Introduction
Glioma arises from glial or precursor cells of the
central nervous system (CNS) and accounts for ~26% of all primary
CNS tumors and >80% of malignant CNS tumors in the USA (1). Glioma has several histological
subtypes, such as astrocytoma (including glioblastoma),
oligodendroglioma and ependymoma among others (1,2). Despite
continuing progress in treatments (such as surgery, chemotherapy,
radiotherapy, targeted therapy and immunotherapy), the prognosis of
glioma, particularly that of glioblastoma, remains unfavorable. For
example, the 1- and 5-year survival rates of glioblastoma in the
USA from 2000–2014 were estimated to be 41.4 and 5.4%, respectively
(3). To date, although certain
molecular alterations [e.g. isocitrate dehydrogenase 1 and 2
(IDH1/2) mutations] have been identified as prognostic markers for
glioma (4,5), more prognostic biomarkers are required
due to the complex genomic alterations (6) and biological heterogeneity (7) of glioma.
Glycoprotein non-metastatic melanoma protein B
(GPNMB), a type I transmembrane glycoprotein, was originally cloned
from metastatic human melanoma cell lines (8). GPNMB is not only expressed in normal
tissues (e.g. skin, bone, urinary system and CNS tissues), but also
abnormally expressed in pathological tissues such as glaucoma,
colitis, liver injury and a variety of carcinoma tissues (9), such as breast (10), gastric (11) or pancreatic cancer (12). GPNMB is located on the cell membrane
and intracellular organelles, such as melanosomes and lysosomes,
and can also be secreted into the extracellular compartment
(13–15).
GPNMB serves multiple roles in both normal and tumor
tissues. In normal tissues, GPNMB modulates various physiological
processes, such as melanosome maturation (14), intercellular adhesion between
keratinocytes and melanocytes (16),
osteoclast and osteoblast differentiation (15,17,18), and
the regulation of immune responses (19,20).
Regarding the role of GPNMB in cancer, a variety of studies have
demonstrated pro-tumorigenic roles of GPNMB in breast (10,21),
gastric (11), lung (22) and pancreatic cancer (12).
GPNMB has been demonstrated to be highly expressed
in glioblastoma tissues (23) and to
mediate glioma progression. Ono et al (24) have proposed that GPNMB prompts glioma
progression by interacting with Na+/K+-ATPase
α subunits. Using in vitro assays, Bao et al
(25) demonstrated that GPNMB
mediated the proliferation and migration of glioma cells and tube
formation of endothelial cells. These studies attributed the
mechanisms of GPNMB-mediated glioma progression to one single
molecule; however, the molecular mechanisms underlying the
GPNMB-induced glioma progression may involve numerous pathways or
complicated networks and remain insufficiently characterized. To
date, the prognostic role of GPNMB in glioma has been inadequately
studied, although an early study from Kuan et al (23) suggested that GPNMB was associated
with increasing survival risk for patients with glioblastoma.
However, due to the limited sample size, specific ethnicity and
other confounding factors in their study, the prognostic role of
GPNMB in glioma requires further investigation.
Thus, the present study aimed to comprehensively
elucidate the potential mechanisms of GPNMB-induced glioma
progression and identify multiple pathways through which GPNMB may
mediate glioma progression via systemic bioinformatics
analysis.
Materials and methods
Publicly available datasets
The GSE53733 dataset (26), which comprises the data of Affymetrix
gene chip analyses from 70 German patients with glioblastoma, was
downloaded from the GEO database (https://www.ncbi.nlm.nih.gov/geo/query/acc.cgi?acc=GSE53733).
Another publicly available dataset, which was originally used in a
study by Yan et al (27),
contained mRNA microarray data and clinical information from 220
Chinese patients with glioma and was downloaded from the CGGA
database (http://www.cgga.org.cn/). The glioma
patients in CGGA were classified into high and low GPNMB expression
groups based on the median expression value of GPNMB.
Screening differentially expressed
genes (DEGs)
To preliminarily explore the disparity in
transcriptome profiles between patients with high and low GPNMB
expression, the four highest (GSM1299519, GSM1299555, GSM1299571,
GSM1299574) and four lowest GPNMB expression samples (GSM1299575,
GSM1299580, GSM1299583, GSM1299584) in GSE53733 were compared. The
raw data from the GSE53733 dataset were processed using the R
Project version 3.5.3 (https://www.r-project.org/) (28). The DEGs between the top and bottom 4
GPNMB expression samples were identified using the limma package in
R Project (29). The screening
thresholds for DEGs were set at adjusted P-value=0.05 and
log2 fold-change=2.
Gene ontology (GO) term and kyoto
encyclopedia of genes and genomes (KEGG) pathway enrichment
analysis
The upregulated DEGs in the four highest GPNMB
expression samples compared with the four lowest samples were
subjected to GO analysis using the Database for Annotation,
Visualization and Integrated Discovery (https://david.ncifcrf.gov/). The enriched GO terms
derived from the DEGs were categorized into three groups: Cell
components (CC), molecular functions (MF) and biological processes
(BP).
The enriched KEGG pathways of the DEGs were
identified using the clusterProfiler package (30) and visualized using the pathview
package (31) in R. The network
diagram depicting complex interactions between significantly
enriched KEGG pathways and DEGs was constructed using Cytoscape
version 3.3.0 (https://cytoscape.org/).
Gene set enrichment analysis
(GSEA)
GSEA between the top and bottom four samples was
conducted using GSEA (version 2.2.3; http://software.broadinstitute.org/gsea/downloads.jsp).
Enrichment scores of 0–1 and nominal P-values for enriched gene
sets were calculated using this software.
Correlation analysis
Correlation analysis was performed between GPNMB and
markers of angiogenesis, migration and invasion, including cluster
of differentiation 31 (CD31), endoglin (ENG), C-X-C motif chemokine
receptor 4 (CXCR4), transforming growth factor β1 (TGFB1),
plasminogen activator, urokinase (PLAU), PLAU receptor (PLAUR) and
matrix metalloproteinase 2 (MMP-2), MMP-7 and MMP-9. Pearson
correlation analysis was used for parametric tests; Spearman
correlation analysis was used for non-parametric tests. P-values
for correlation analysis were determined using SPSS software
(version 20.0.0; IBM Corp.).
Tissue microarray staining and
scoring
The glioma tissue microarrays (G6042-3 and G6042-4)
were purchased from Wuhan Servicebio Technology Co., Ltd. The
tissue microarrays were subjected to immunohistochemical staining.
Specifically, slides with tissue microarray were deparaffinized and
rehydrated. Heat-induced antigen retrieval was conducted by
immersing the slides into boiling Tris-EDTA buffer for 3 min.
Slides were incubated with 3% hydrogen peroxide for 30 min to block
endogenous peroxidase and then blocked with blocking buffer (cat.
no. P0102; Beyotime Institute of Biotechnology) for 1 h at room
temperature. Slides were incubated with an anti-GPNMB primary
antibody (1:500; cat. no. 38313; Cell Signaling Technology, Inc.)
overnight at 4°C. After washing the slides 3 times with
Tris-Buffered Saline Tween-20 (TBST) for 5 min each time, the Real
Envision Detection kit (cat. no. GK500710; GeneTech Biotechnology,
Co., Ltd.) was used for signal visualization through the
diaminobenzidine reaction. Nuclei were counterstained with
hematoxylin. GPNMB immunoreactivity was scored by observing 3
random fields under a light microscope (Leica Microsystems, Inc.;
magnification, ×200). GPNMB immunoreactivity was scored based on
staining distribution and intensity as previously described
(23). According to the percentage
of immunopositive cells, the staining distribution was categorized
as follows: 0 points, 0%; 1 point, 1–25%; 2 points, 26–50%; 3
points, 51–75%; and 4 points, 76–100%. The staining intensity was
assessed and graded from 0 to 3 (0 points, negative; 1 point, weak
staining; 2 points, moderate staining; and 3 points, strong
staining). These two values were multiplied to achieve a maximum
score of 12. Scores of 0–6 were considered low GPNMB expression,
and scores of 7–12 were considered high GPNMB expression. The
slides were evaluated by two independent observers. A total number
of 74 Chinese patients with glioma were incorporated into the
following analysis, after excluding those with incomplete follow-up
information.
Cell culture and siRNA
transfection
U-87MG (U87) glioblastoma cell line of unknown
origin was obtained from the American Type Culture Collection (cat.
no. HTB-14). U87 cells were cultured in Dulbecco's modified Eagle's
medium (Thermo Fisher Scientific, Inc.) supplemented with 10% fetal
bovine serum (FBS; Gibco; Thermo Fisher Scientific, Inc.). Small
interfering RNA (siRNA) targeting human GPNMB
(5′-GGATAATACTGGCCTGTTT-3′) and a negative control siRNA
(5′-GGCTCTAGAAAAGCCTATGC-3′) were purchased from Guangzhou RiboBio,
Co., Ltd. A total of 5×10⁵ U87 cells were seeded in
6-well plates overnight and then transfected with 50 nM siRNA using
Lipofectamine® 2000 (cat. no. 11668-019; Invitrogen;
Thermo Fisher Scientific, Inc.) at 37°C for 6 h according to the
manufacturer's instructions. Subsequent experiments were conducted
24 h post-transfection.
Western blotting
Cells were lysed for protein extraction with RIPA
lysis buffer (cat. no. P0013B; Beyotime Institute of
Biotechnology). Protein concentration was determined using an
Enhanced BCA Protein Assay kit (cat. no. P0010; Beyotime Institute
of Biotechnology). A total of 30 µg protein for each sample was
loaded per lane for sodium dodecyl sulfate-polyacrylamide gel
electrophoresis using a 10% stacking gel to separate the proteins,
which were subsequently transferred to 0.22-µm PVDF membranes. The
PVDF membranes were blocked with 5% non-fat dry milk in
Tris-buffered saline at room temperature for 1 h, washed three
times with Tris-Buffered Saline Tween-20 and incubated with primary
antibodies against GPNMB (dilution, 1:1,000; cat. no. 38313; Cell
Signaling Technology, Inc.) or GAPDH (dilution, 1:1,000; cat. no.
2118; Cell Signaling Technology, Inc.) overnight at 4°C. The
membranes were then washed three times and incubated with
horseradish peroxidase-conjugated secondary antibodies (1:5,000;
cat. no. 111-035-003; Jackson ImmunoResearch, Inc.) at room
temperature for 1 h. Finally, Immobilon™ Western
Chemiluminescent HRP Substrate (cat. no. P90719; EMD Millipore) was
used to visualize signals.
Cell counting Kit-8 (CCK-8) assay
The CCK-8 assay (cat. no. CK04; Dojindo Molecular
Technologies, Inc.) was performed in 96-well plates according to
the manufacturer's instructions. A total of 3×10³ U87
cell were plated in each well of a 96-well plate. Prior to
measuring, 10 µl of CCK-8 solution was added to each well and the
plate was incubated for 2 h at 37°C. The absorbance at 450 nm was
measured on days 1–3, and 4, respectively.
Cell migration and invasion assay
U87 migration and invasion assays were performed
using 24-well Transwell plate inserts with 8-µm pores (cat. no.
3422; Corning, Inc.). For the cell invasion assay, the inserts were
pre-coated with Matrigel (cat. no. 356234; Corning, Inc.) at 4°C
and incubated at 37°C for 2 h. A total of 600 µl DMEM supplemented
with 10% FBS was added into the lower chamber, and 200 µl
serum-free medium containing 5×10⁵ U87 cells was added
into the upper chamber. Following 24-h incubation, U87 cells in the
upper chamber were removed with cotton swabs. Migratory or invasive
U87 cells were fixed with 4% paraformaldehyde at room temperature
for 1 h and stained with 0.1% crystal violet at room temperature
for 15 min. The number of migratory or invasive U87 cells was
determined by counting cells from five random fields under a light
microscope (Leica Microsystems, Inc.) with ×200 magnification.
Statistical analysis
Data are presented as the mean ± standard error of
the mean. In CCK-8 assay, 6 independent repeats for each group were
performed and in the cell migration and invasion assays, 5 random
fields were observed for cell counting. Statistical differences
were calculated using SPSS Statistics (version 20; IBM, Inc.) and
GraphPad Prism (version 6.02; GraphPad Software, Inc.). For
parametric tests, unpaired Student's t-test was used for two-group
comparisons, and one-way ANOVA followed by Tukey's post hoc test
was conducted for multi-group comparisons. For non-parametric
tests, Mann-Whitney U test was performed for two-group comparisons,
and Kruskal-Wallis test followed by Dunn's multiple comparisons
test was used. The Kaplan-Meier method followed by log-rank test
was used for survival analysis. The Renyi test was performed to
detect differences when survival curves crossed over with the
survMisc package in R. The Cox proportional hazards model was used
for univariate and multivariate analysis. P<0.05 was considered
to indicate a statistically significant difference.
Results
Screening DEGs between samples with
high and low GPNMB expression, and hierarchical clustering
analysis
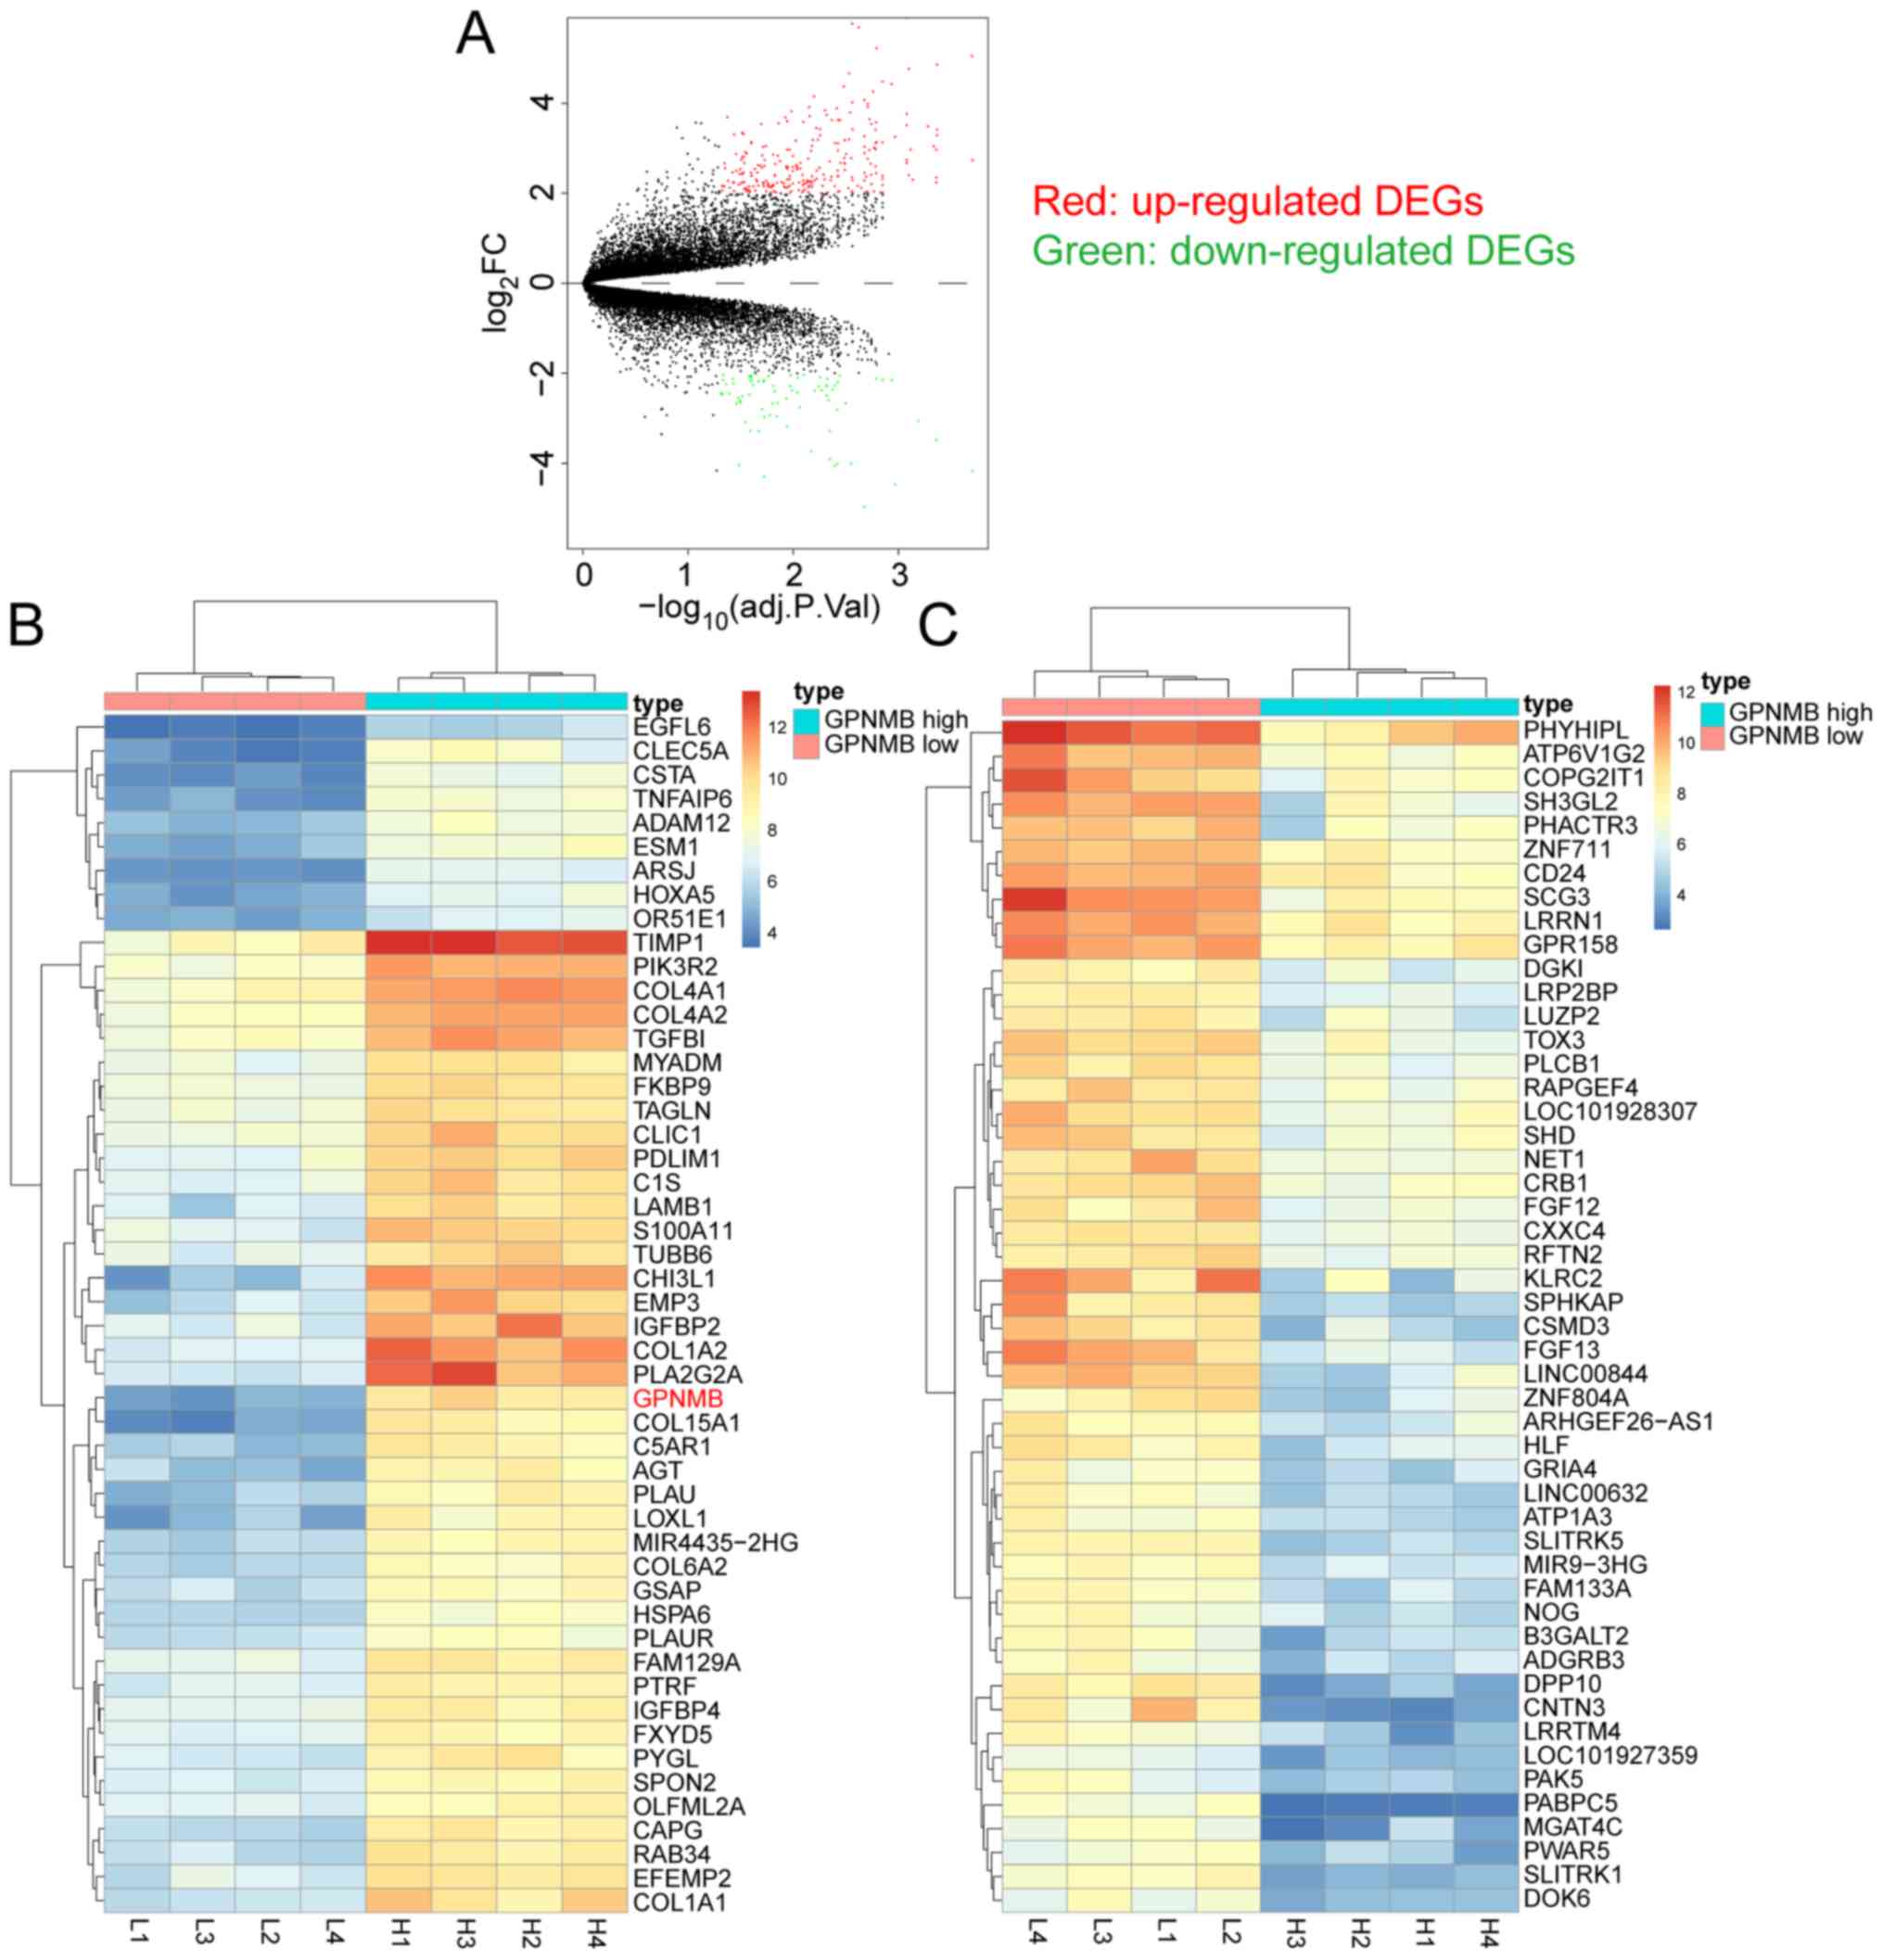
The four highest and four lowest GPNMB expression
samples in the GSE53733 dataset were compared to screen for DEGs.
Based on the aforementioned screening thresholds, 254 up- and 79
downregulated DEGs were identified and are presented in the volcano
plot (Fig. 1A). Hierarchical
clustering analysis was performed using the top 50 up- and
downregulated DEGs between the four highest and four lowest GPNMB
expression samples in GSE53733. The top 50 up- (Fig. 1B) and downregulated (Fig. 1C) DEGs are presented in the heat
maps.
GO and KEGG analysis of DEGs
GO pathways in which the 79 downregulated DEGs were
enriched were irrelevant to tumor biological behaviors and were
therefore not studied (data not shown). The 254 upregulated DEGs
were subjected to GO analysis. The significantly enriched GO terms
in BP comprised ‘extracellular matrix organization’, ‘collagen
catabolic process’, ‘collagen fibril organization’, ‘inflammatory
response’ etc. (Fig. 1D). The
significantly enriched GO terms in CC included ‘extracellular
space’, ‘extracellular region’, extracellular matrix’,
‘extracellular exosome'etc. (Fig.
1E). The significantly enriched GO terms in MF contained
‘extracellular matrix structural constituent’, ‘integrin binding’,
‘heparin binding’, ‘collagen binding'etc. (Fig. 1F).
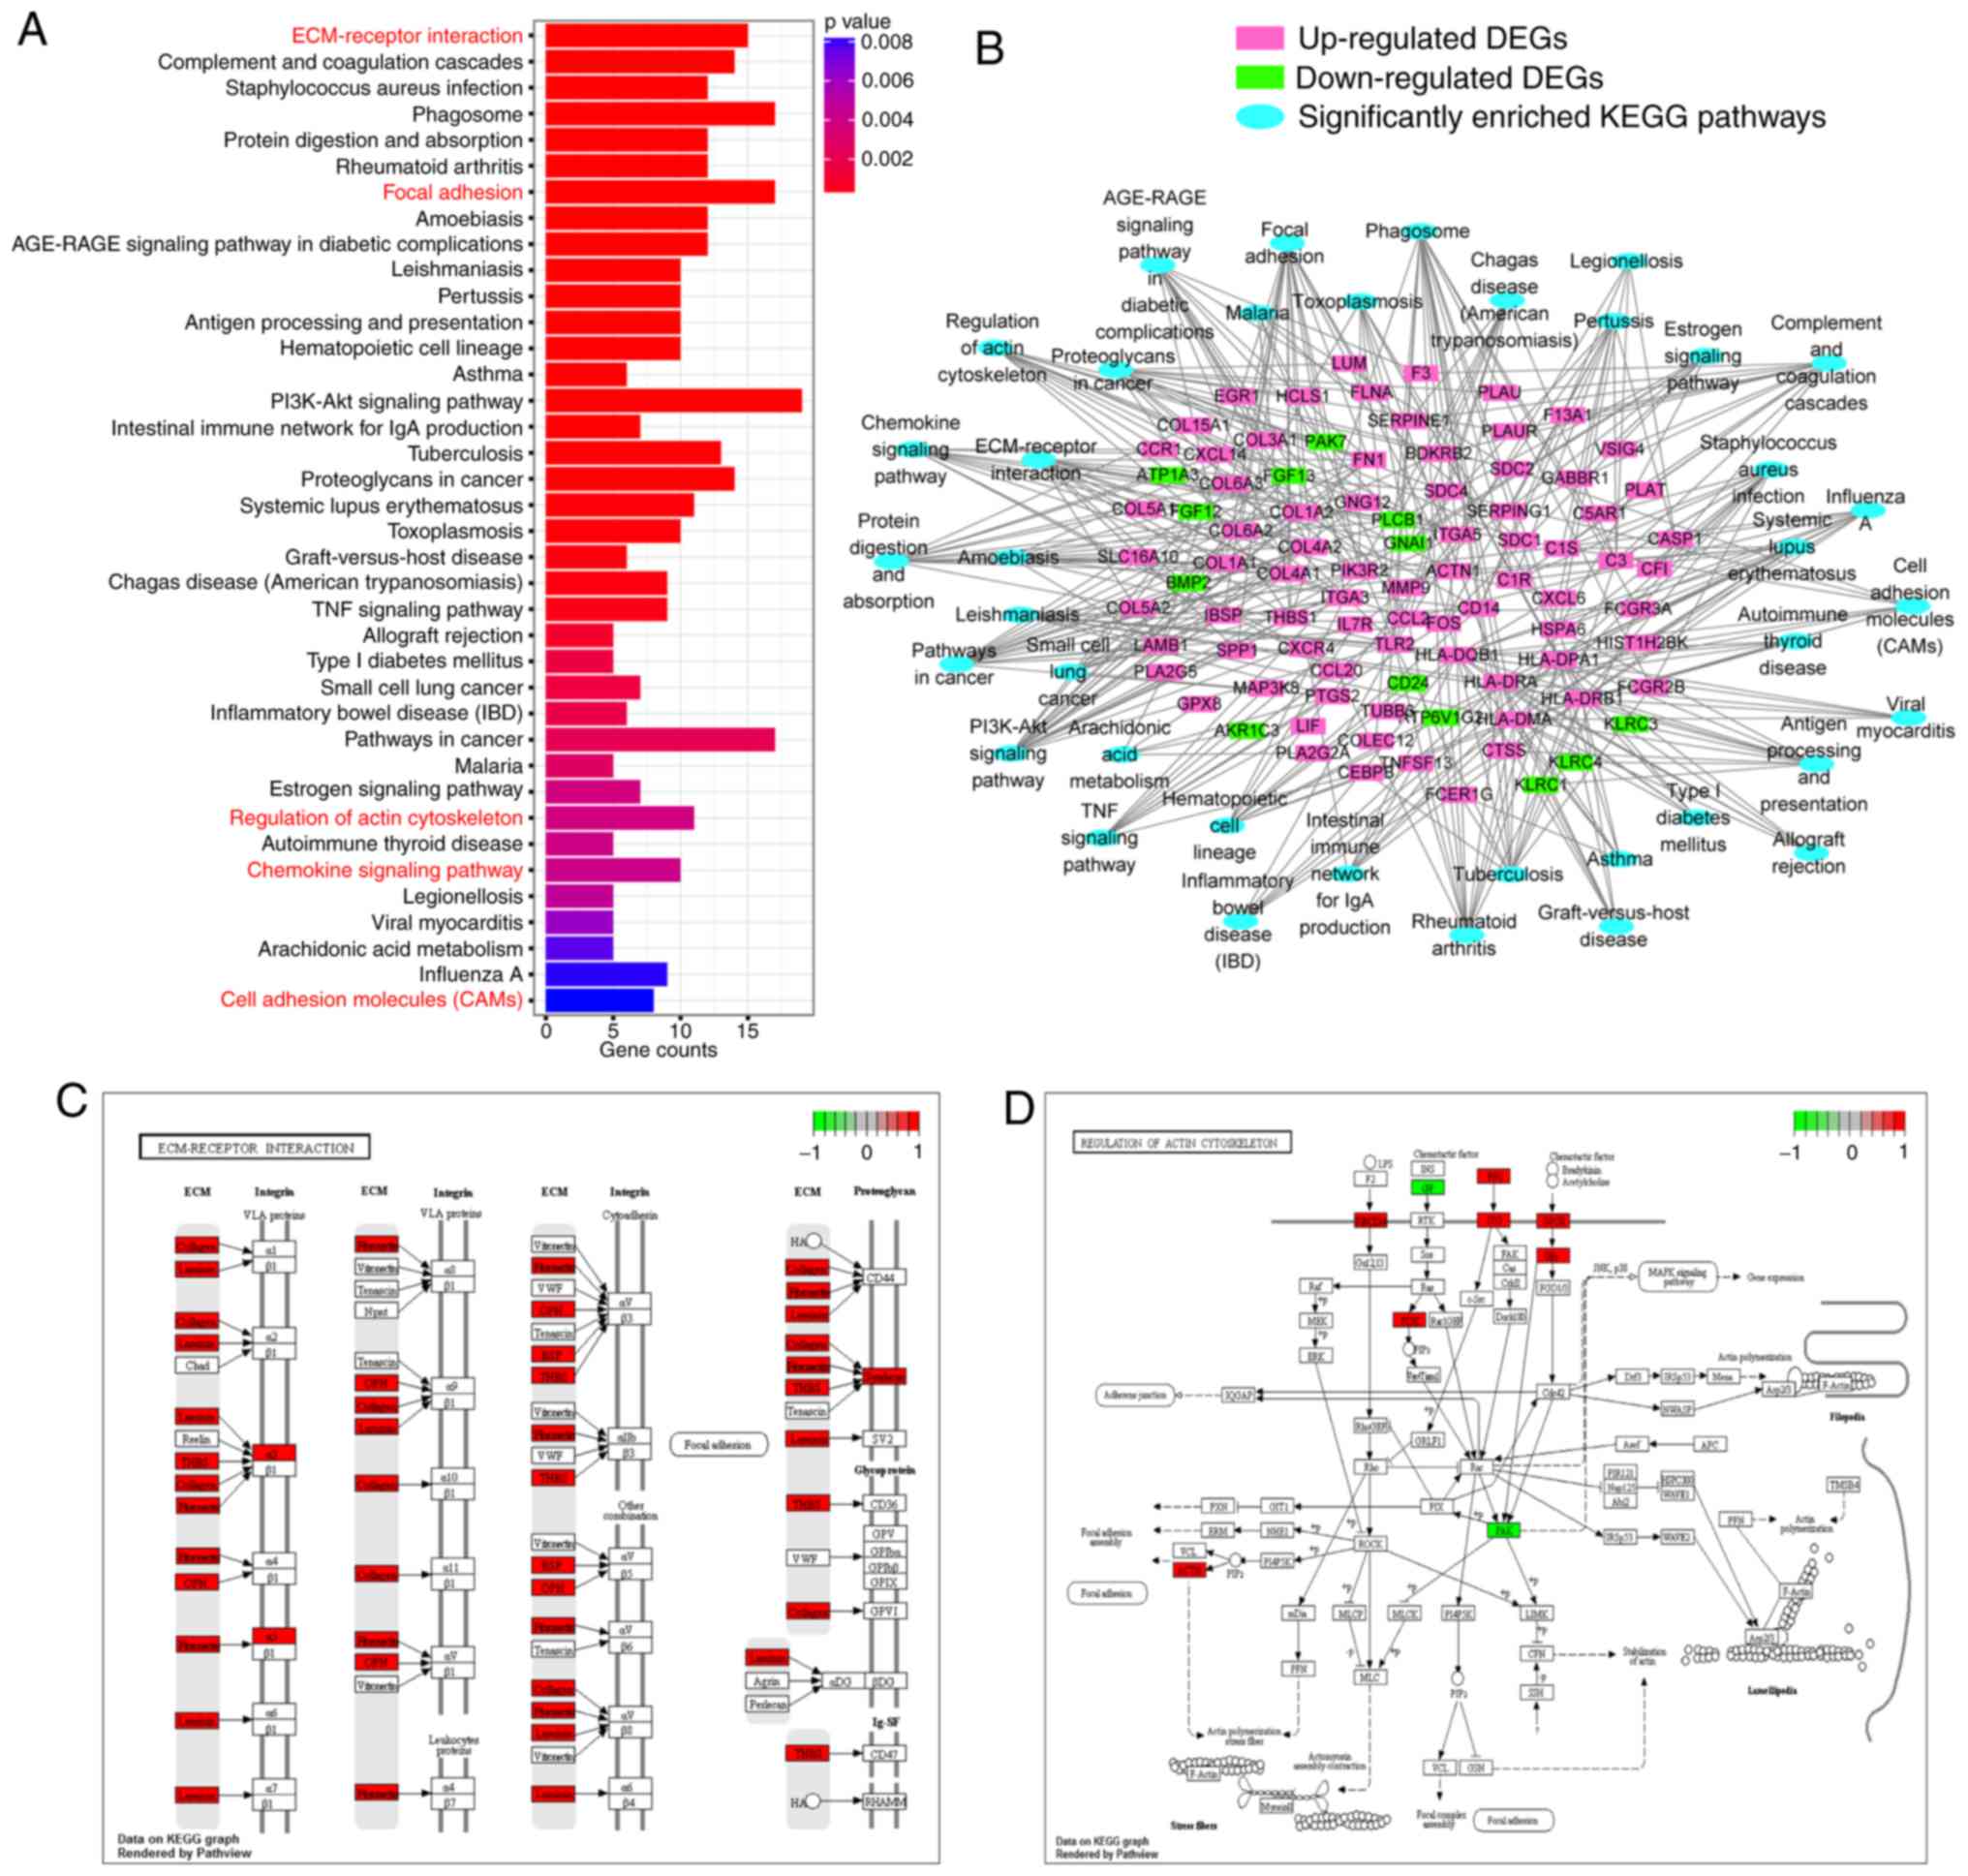
KEGG analysis using DEGs identified 38 significantly
enriched pathways (Fig. 2A). To
illustrate the interactions between the DEGs and the enriched KEGG
pathways, a network diagram was constructed (Fig. 2B). The ‘ECM-receptor interaction’ and
the ‘regulation of actin cytoskeleton’ are vital pathways mediating
cell migration and invasion and are presented in detail in Fig. 2C and D.
GSEA analysis
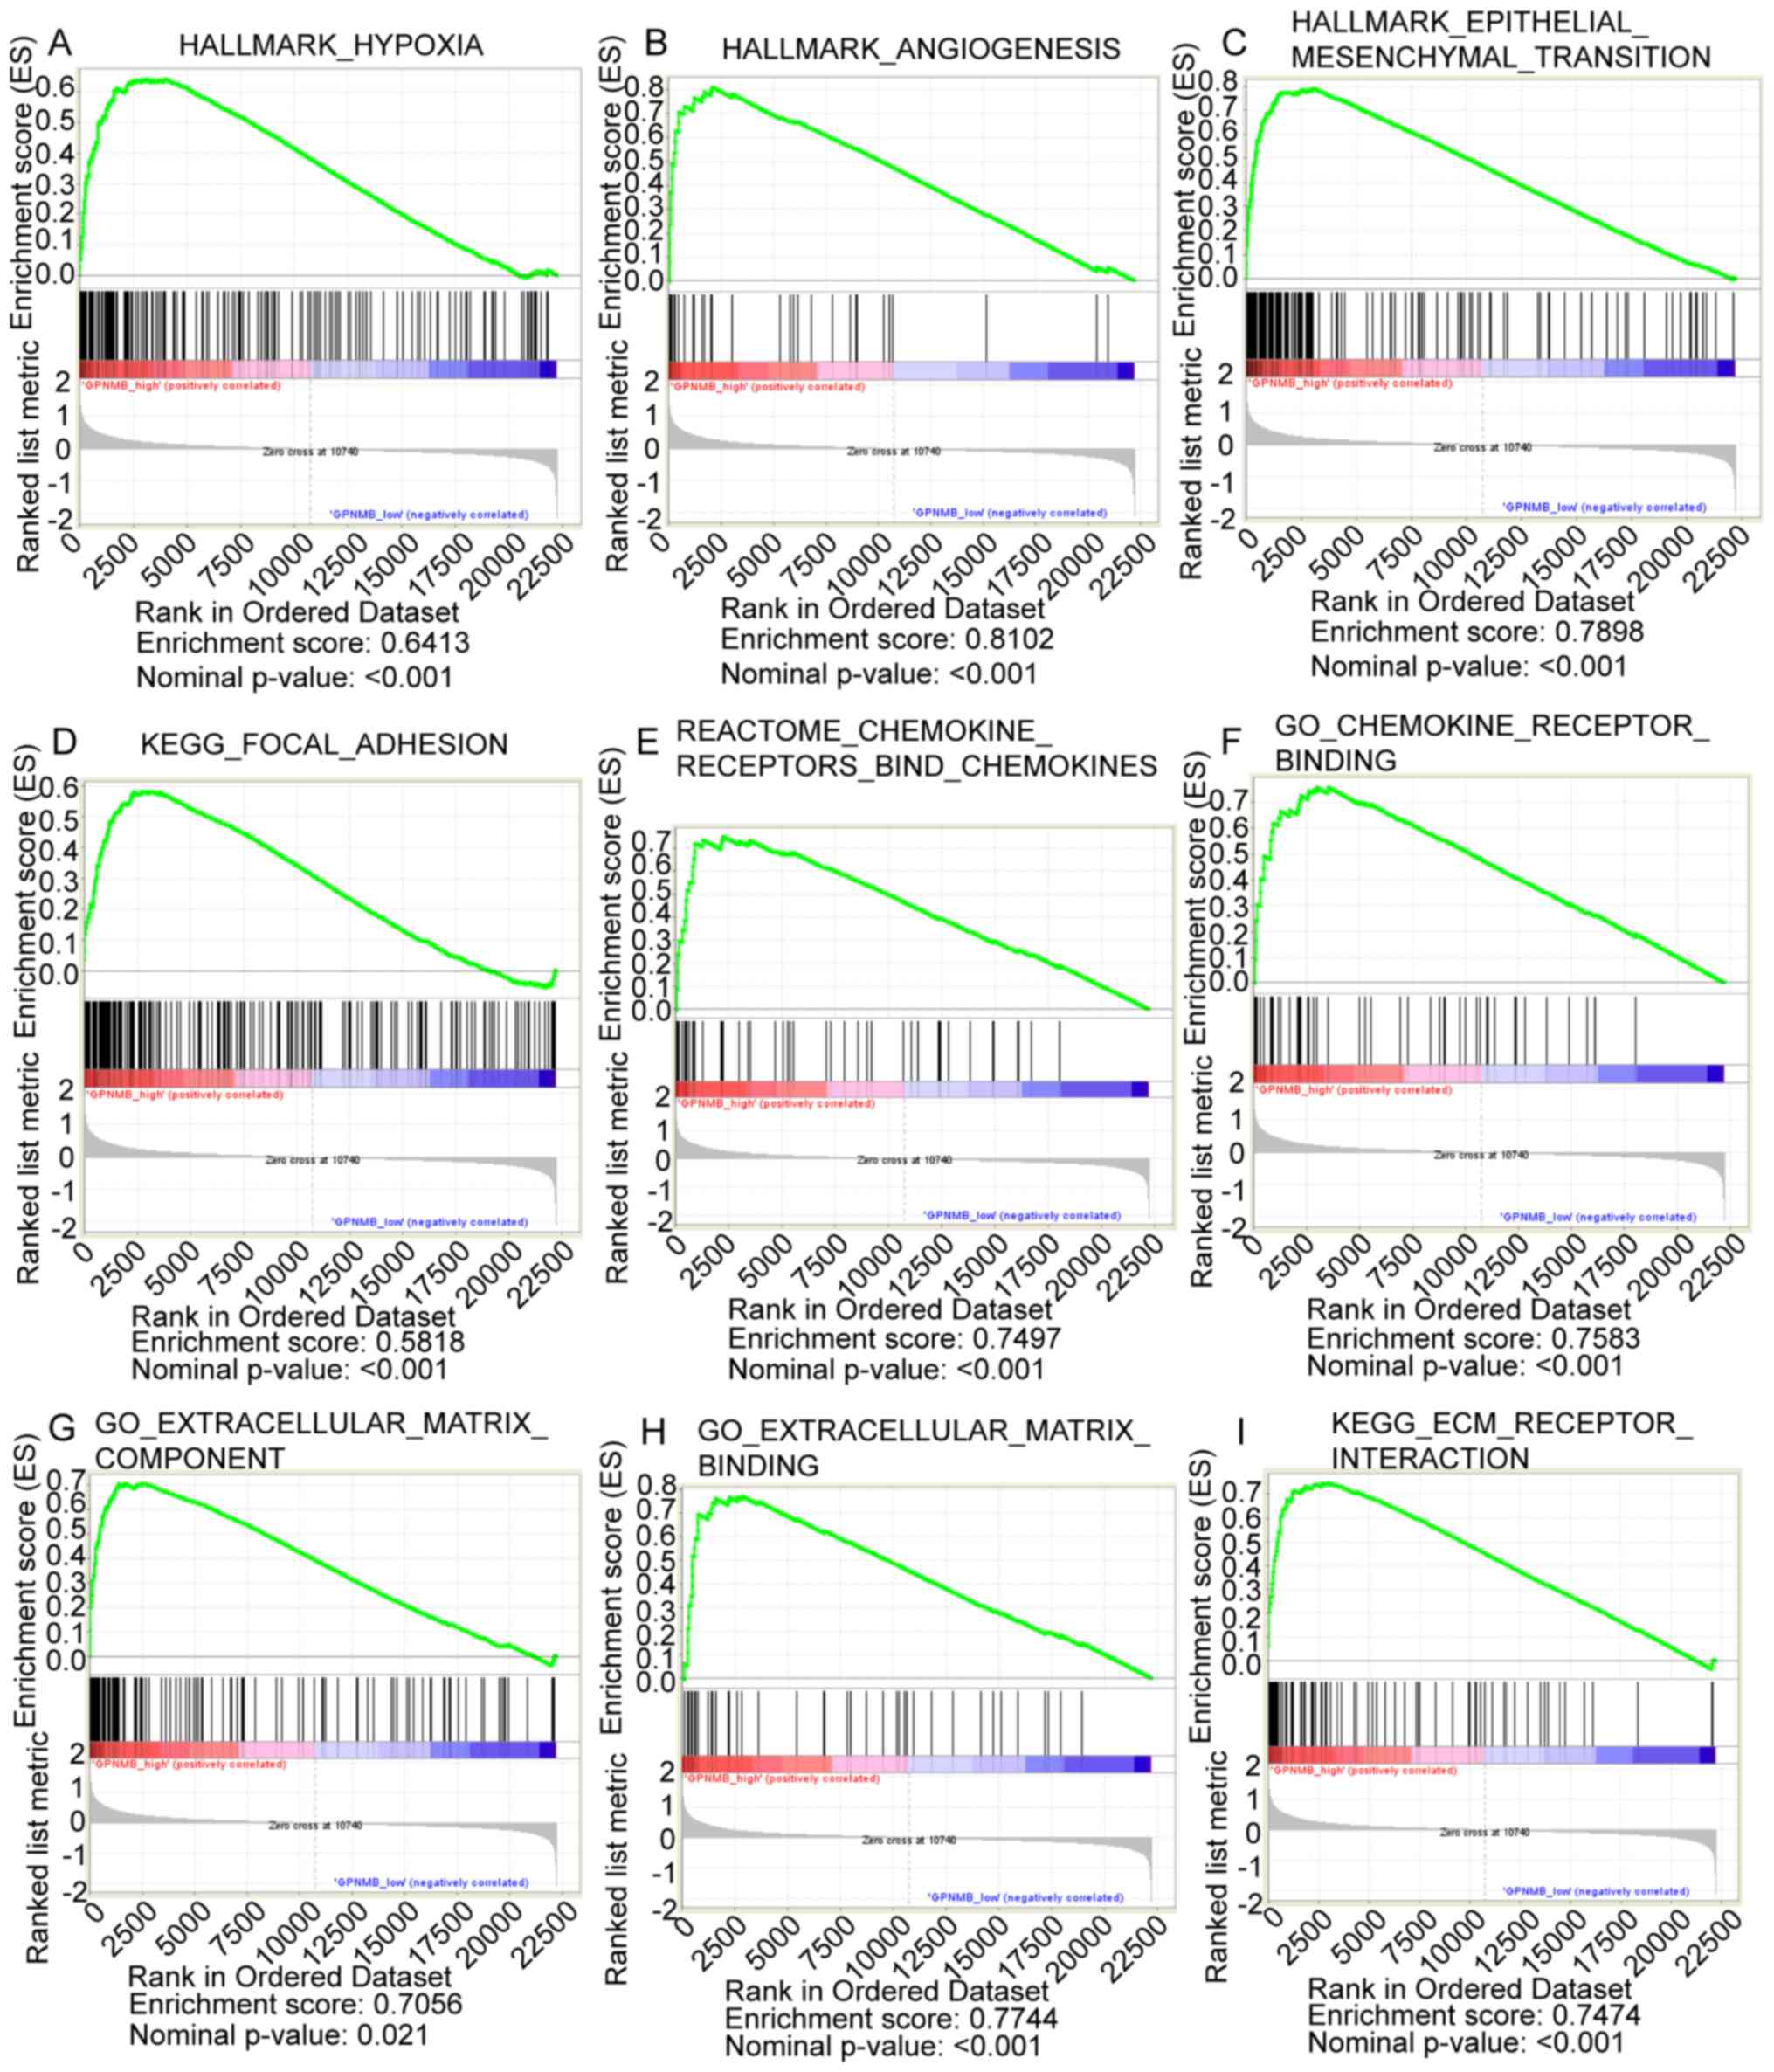
GSEA analysis between the four highest and four
lowest GPNMB expression samples in GSE53733 identified the
following significantly enriched pathways: ‘Hypoxia’ (Fig. 3A), ‘angiogenesis’ (Fig. 3B), ‘epithelial mesenchymal
transition’ (Fig. 3C), ‘focal
adhesion’ (Fig. 3D), ‘chemokine
receptors bind chemokines’ (Fig.
3E), ‘chemokine receptor binding’ (Fig. 3F), ‘ECM component’ (Fig. 3G), ‘ECM binding’ (Fig. 3H) and ‘ECM receptor interaction’
(Fig. 3I).
Correlation analysis between GPNMB and
markers of angiogenesis, migration and invasion using the GSE53733
dataset and validation in the CGGA dataset
The GO and KEGG pathway analysis, as well as GSEA
results revealed that DEGs between high and low GPNMB expression
samples were generally enriched in pathways associated with
angiogenesis, migration and invasion. Therefore, the present study
subsequently investigated whether GPNMB expression correlated with
the expression of the known markers of angiogenesis, migration and
invasion. In the GSE53733 dataset, Pearson correlation analysis
determined that GPNMB expression was positively correlated with the
expression of CD31 (r=0.548; P<0.001), ENG (r=0.465; P<0.001;
weak positive correlation), CXCR4 (r=0.584; P<0.001), TGFB1
(r=0.390; P<0.001; weak positive correlation), PLAU (r=0.557;
P<0.001), PLAUR (r=0.657; P<0.001), MMP-2 (r=0.396;
P<0.001; weak positive correlation), MMP-7 (r=0.341; P<0.001;
weak positive correlation) and MMP-9 (r=0.496; P<0.001; weak
positive correlation) (Fig. 4).
Using a validation dataset from CGGA, Spearman correlation analysis
revealed significant correlations between the expression of GPNMB
and CD31 (rho=0.684; P<0.001), ENG (rho=0.502; P<0.001),
CXCR4 (rho=0.661; P<0.001), TGFB1 (rho=0.334; P<0.001), PLAU
(rho=0.631; P<0.001), PLAUR (rho=0.619; P<0.001), MMP-2
(rho=0.409; P<0.001), MMP-7 (rho=0.455; P<0.001) and MMP-9
(rho=0.518; P<0.001) (Fig.
5).
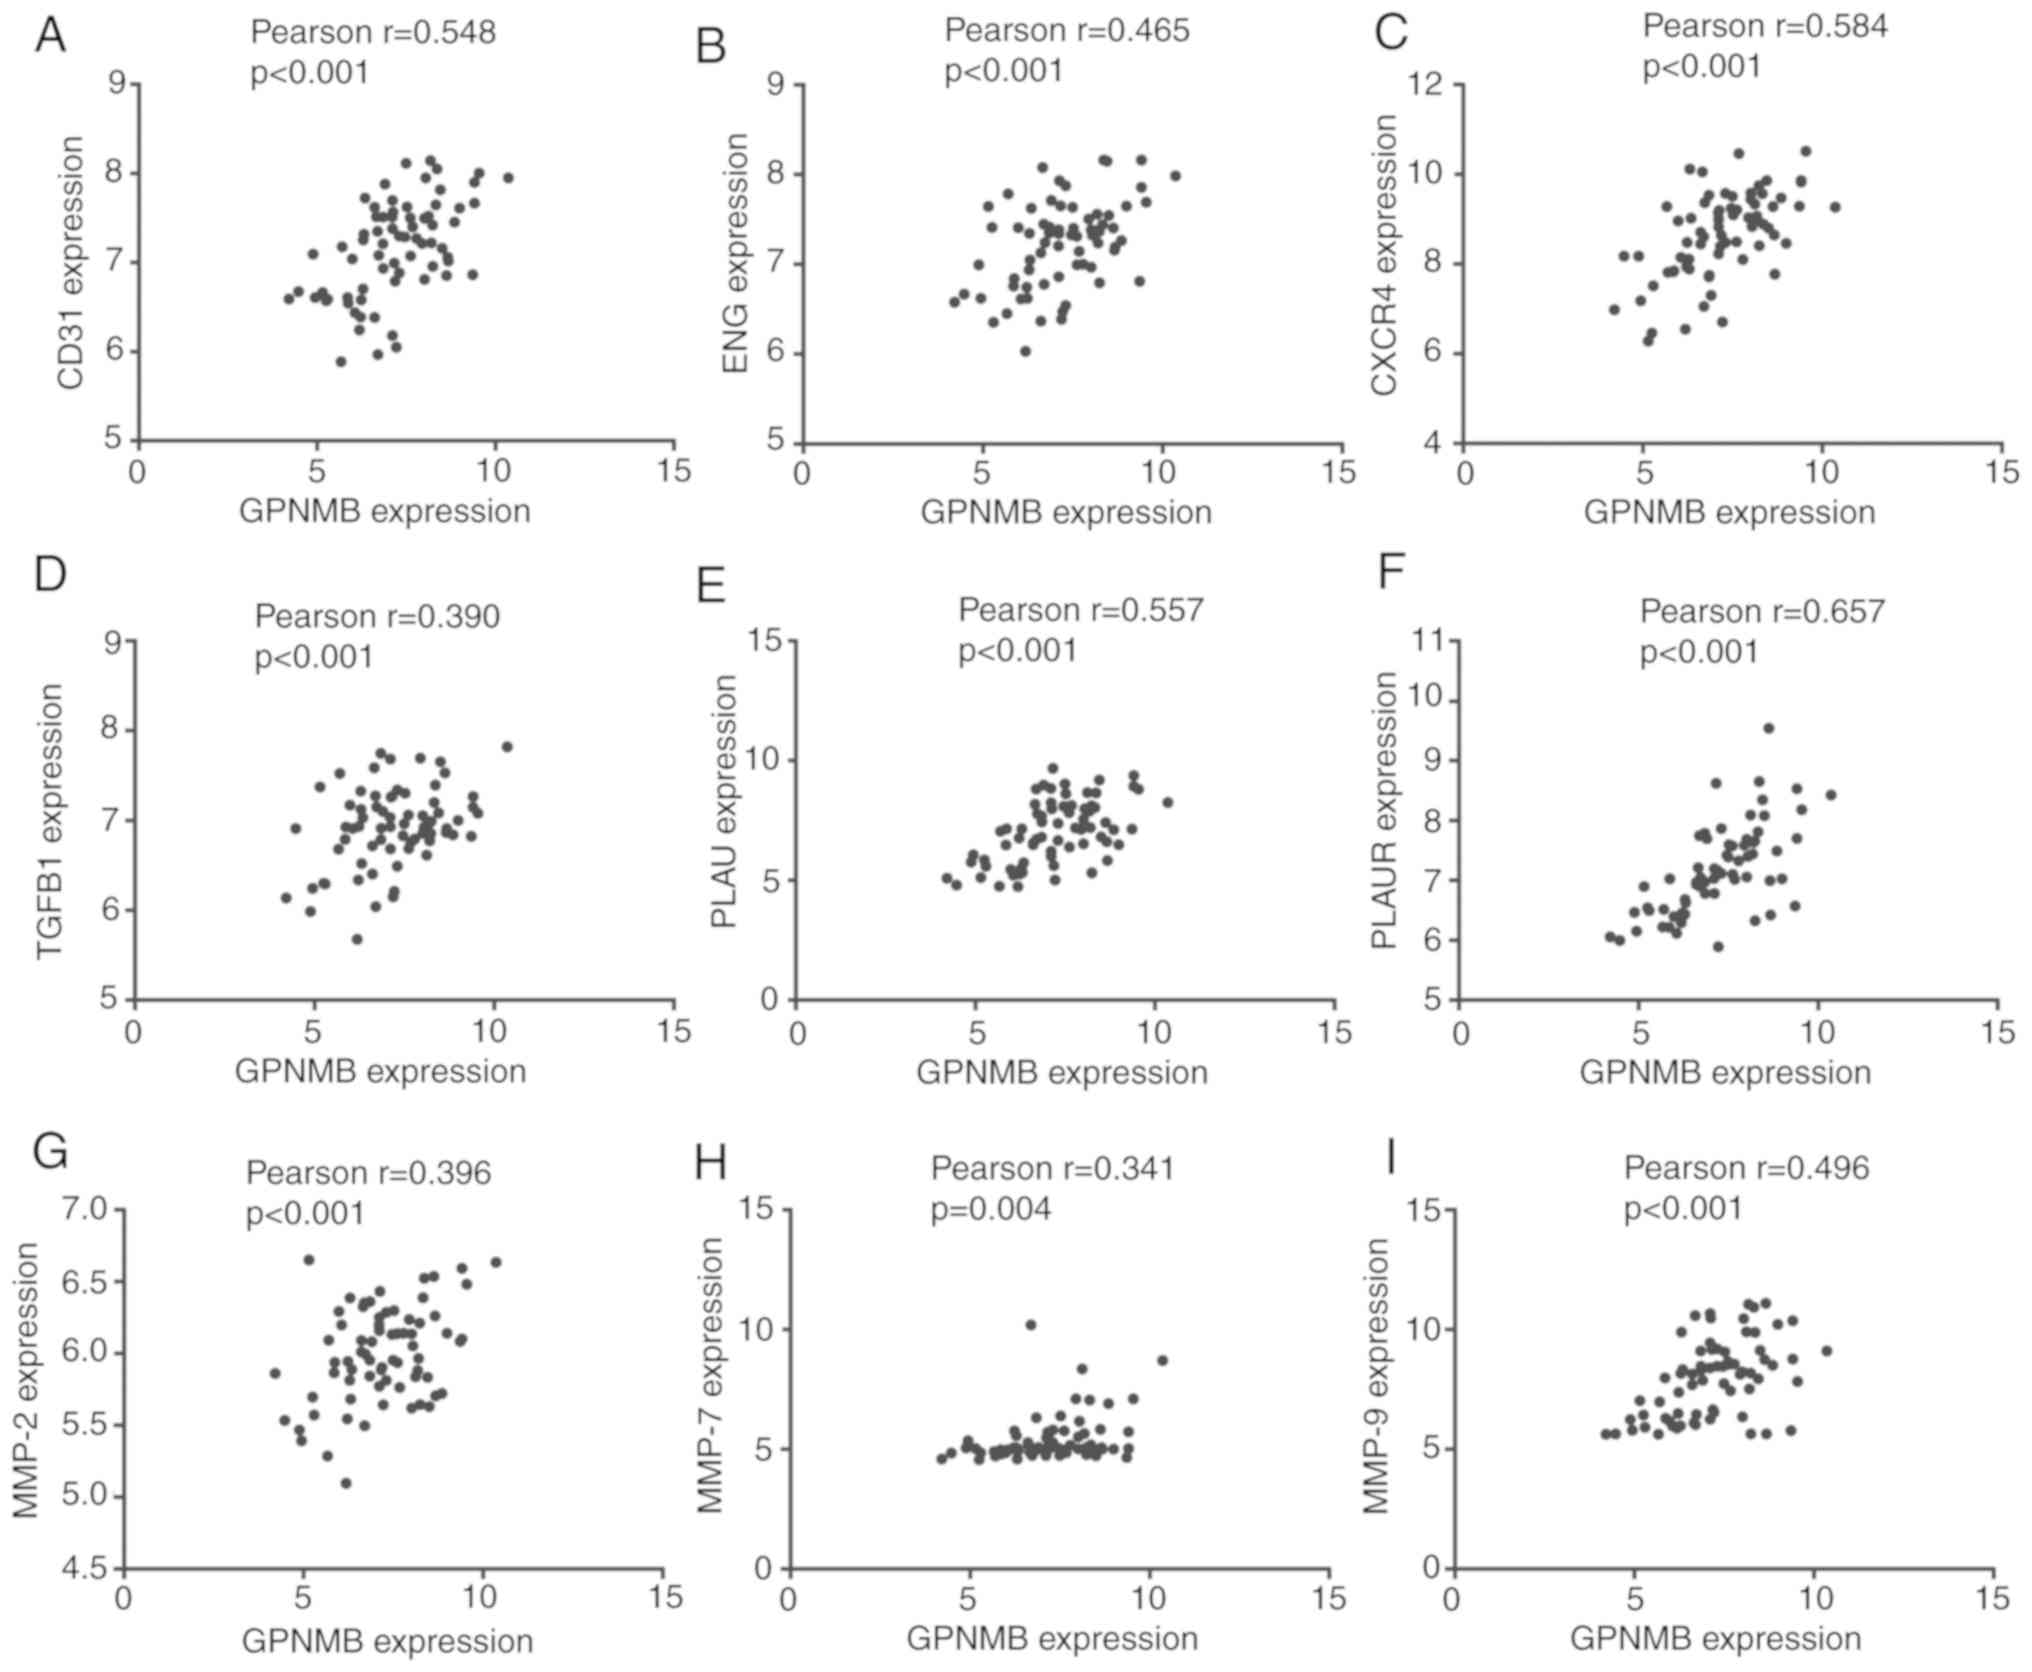 | Figure 4.Pearson correlation analysis between
GPNMB and markers of angiogenesis, migration and invasion in
GSE53733. (A-I) Correlations between GPNMB and (A) CD31, (B) ENG,
(C) CXCR4, (D) TGFB1, (E) PLAU, (F) PLAUR, (G) MMP-2, (H) MMP-7 and
(I) MMP-9. GPNMB, glycoprotein non-metastatic melanoma protein B;
CD31, cluster of differentiation 31; ENG, endoglin; CXCR4, C-X-C
motif chemokine receptor 4; TGFB1, transforming growth factor β1;
PLAU, urokinase; PLAUR, PLAU receptor; MMP, matrix
metalloproteinase. |
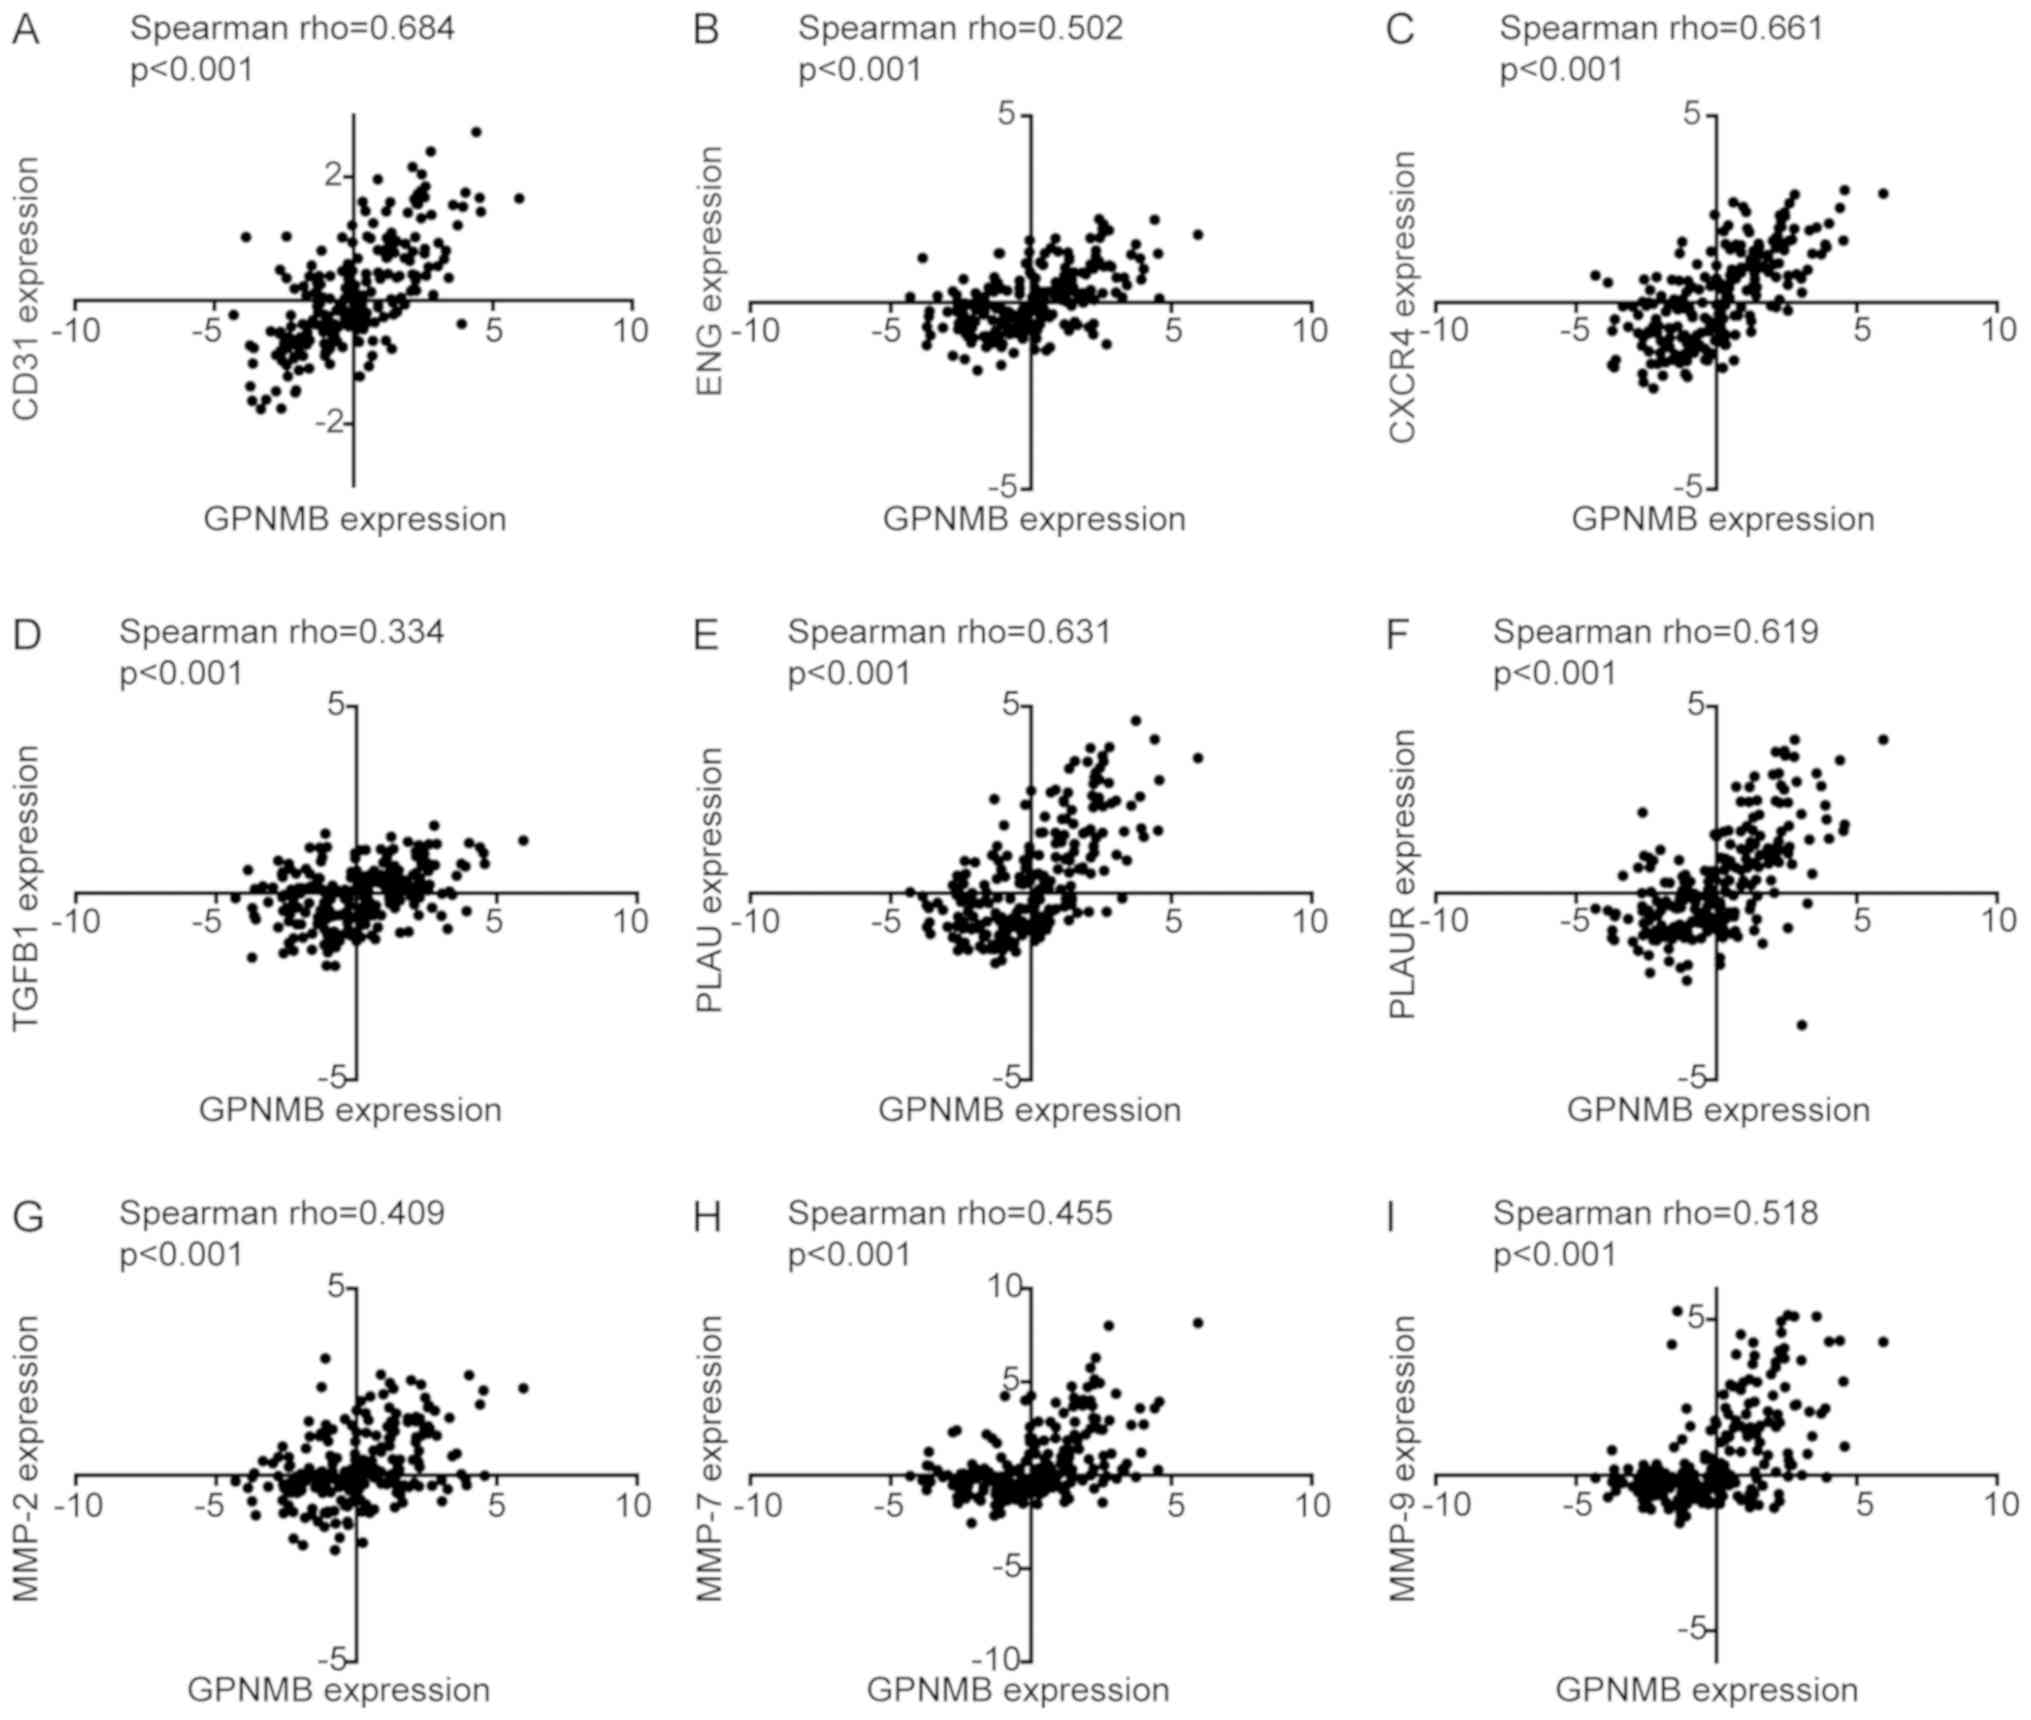 | Figure 5.Spearman correlation analysis between
GPNMB and markers of angiogenesis, migration and invasion in the
mRNA microarray dataset in Chinese Glioma Genome Atlas. (A-I)
Correlations between GPNMB and (A) CD31, (B) ENG, (C) CXCR4, (D)
TGFB1, (E) PLAU, (F) PLAUR, (G) MMP-2, (H) MMP-7 and (I) MMP-9.
GPNMB, glycoprotein non-metastatic melanoma protein B; CD31,
cluster of differentiation 31; ENG, endoglin; CXCR4, C-X-C motif
chemokine receptor 4; TGFB1, transforming growth factor β1; PLAU,
urokinase; PLAUR, PLAU receptor; MMP, matrix metalloproteinase. |
In addition, correlation analysis revealed that
GPNMB expression was positively associated with CD163 in the
GSE53733 dataset (r=0.671; P<0.001; Fig. S1A) and the microarray dataset in
CGGA (rho=0.670; P<0.001; Fig.
S1B).
In vitro experiments investigating the
effects of GPNMB on glioma cell proliferation, migration and
invasion
Fig. S2A
demonstrates the knockdown of GPNBM in U87 cells transfected with
siRNA. Subsequent experiments revealed that knockdown of GPNBM
significantly inhibited the proliferation, migration and invasion
of U87 cells (Fig. S2B-D).
Clinical and prognostic role of GPNMB
expression in glioma
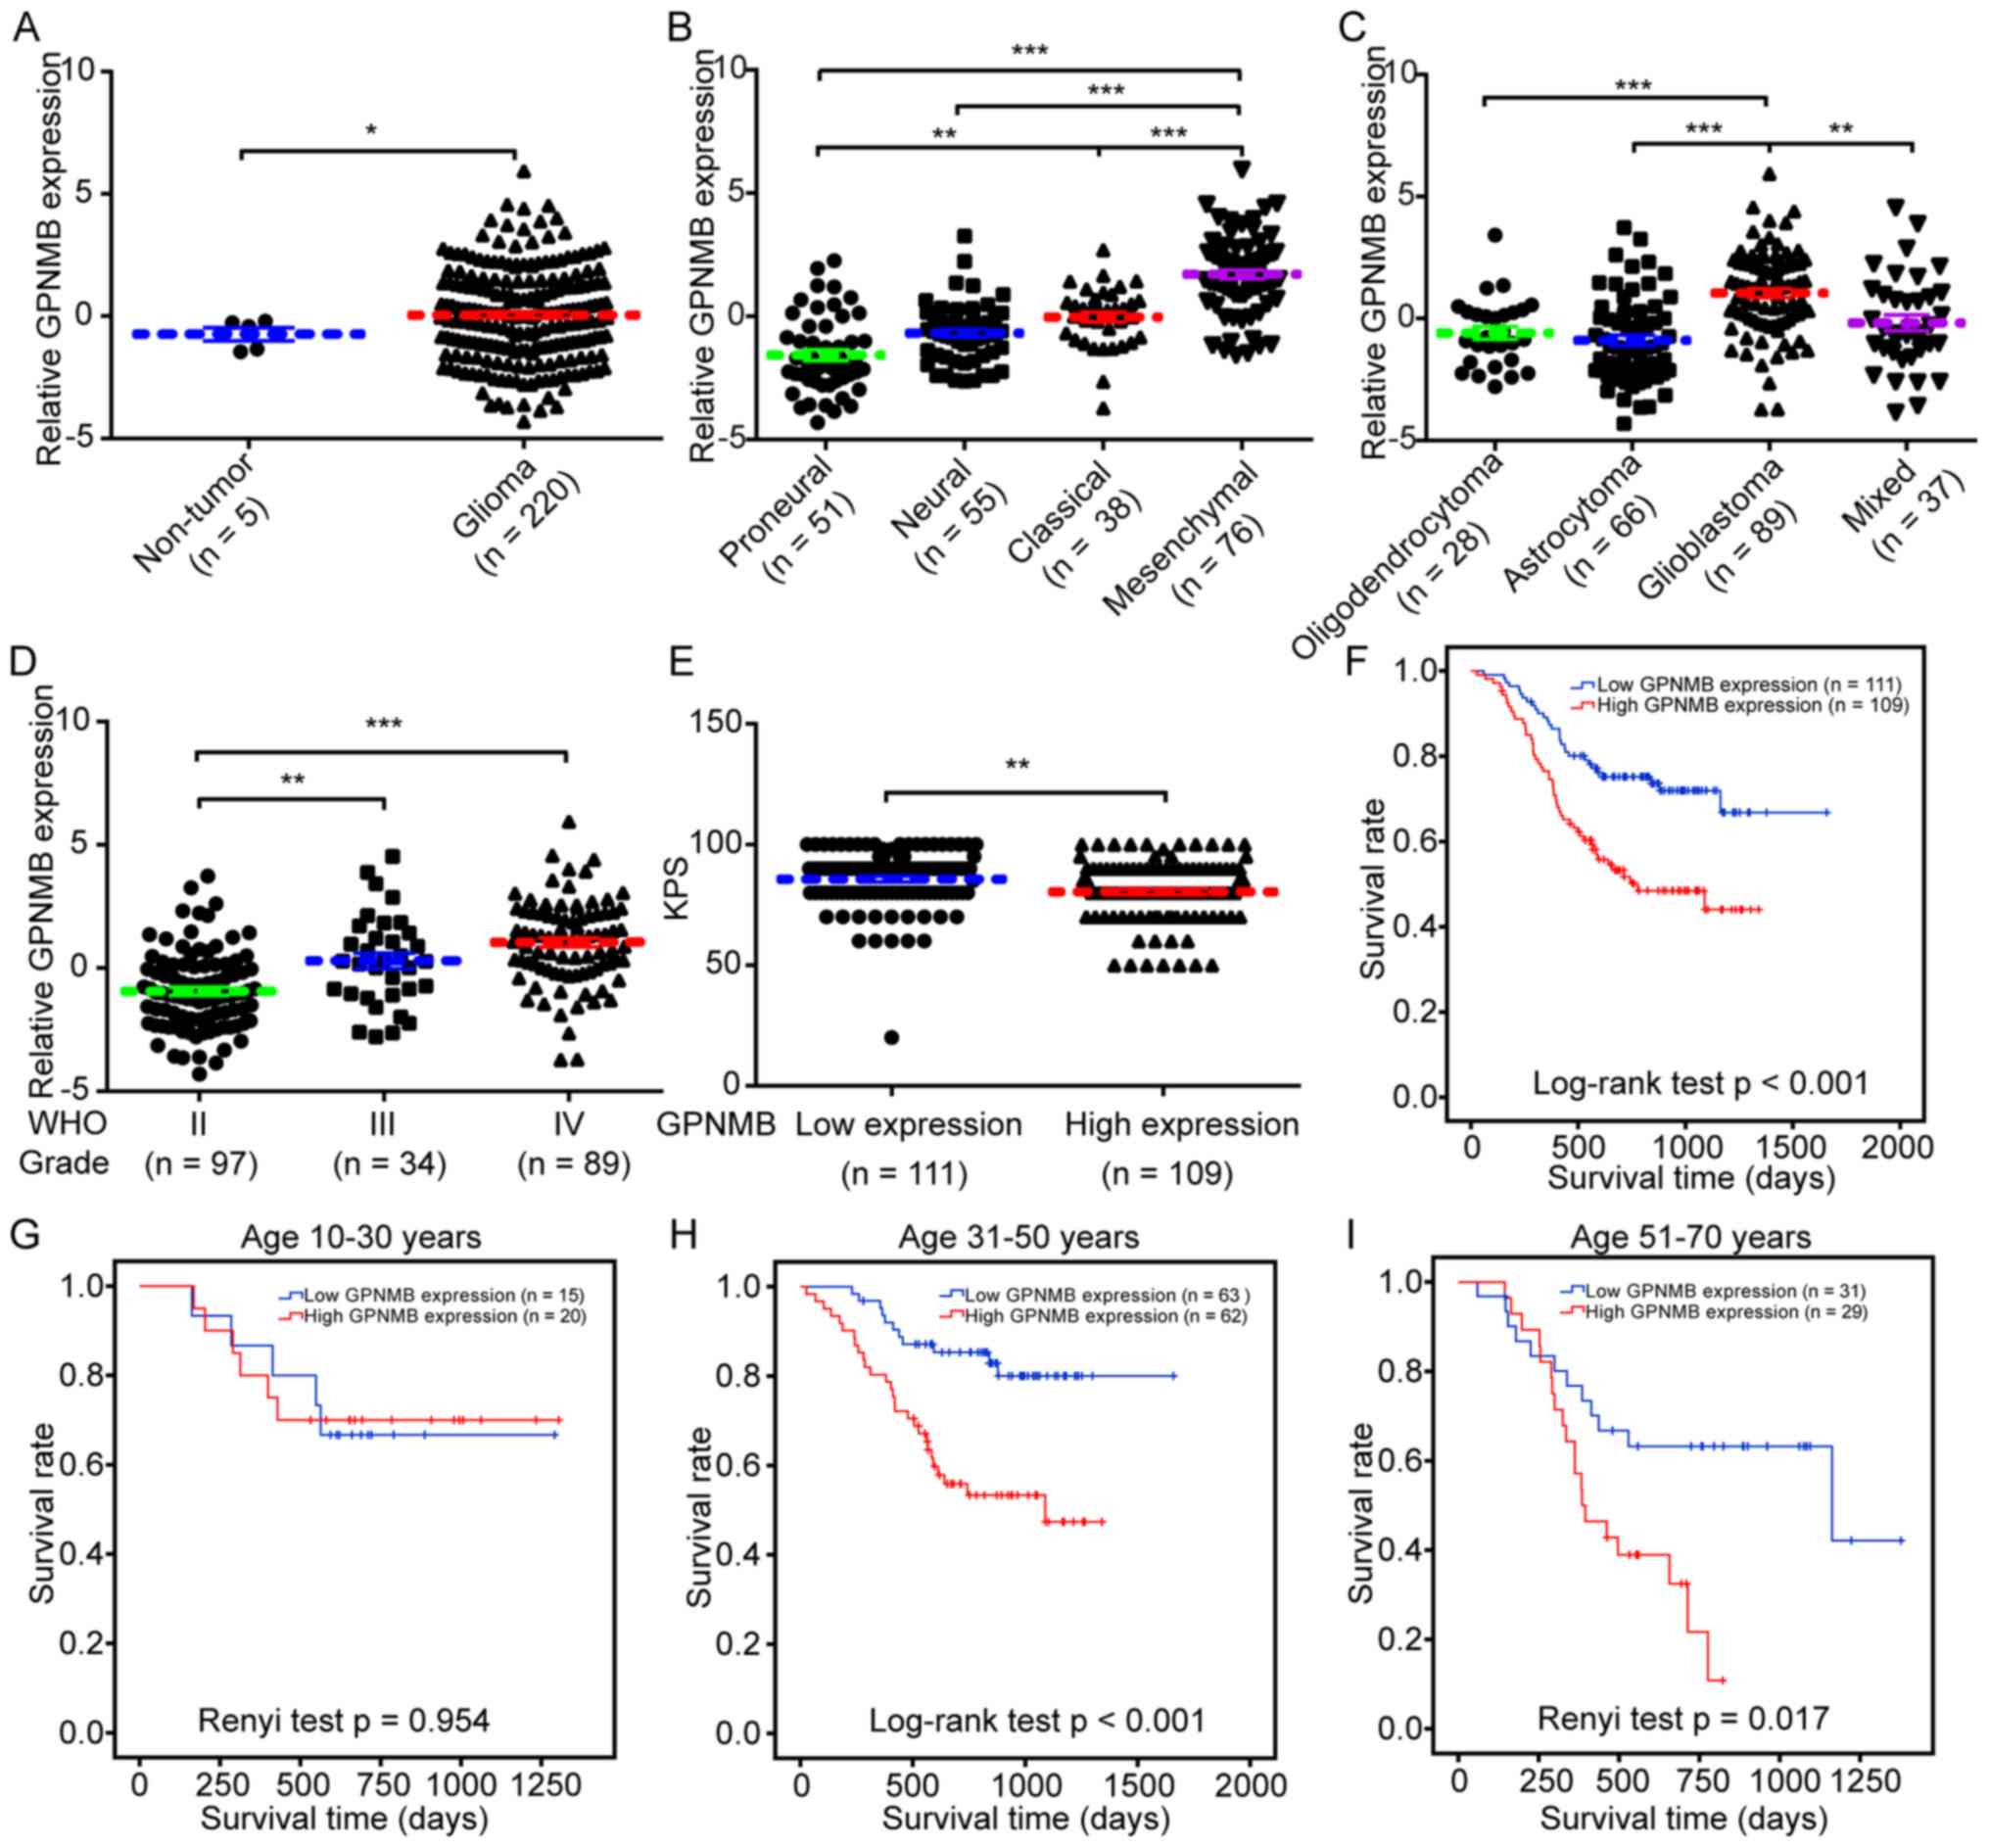
Using the mRNA microarray data and clinical
information of the 220 Chinese patients with glioma from the CGGA,
the clinical and prognostic role of GPNMB expression in glioma was
investigated. Compared with non-tumor brain tissues, higher levels
of GPNMB expression were observed in glioma tissues (Fig. 6A). The four gene expression-based
molecular subtypes (proneural, neural, classical and mesenchymal)
of glioblastoma were previously identified and characterized
(32). The highest levels of GPNMB
expression were identified in patients with the mesenchymal subtype
(Fig. 6B). Regarding the association
between histological subtypes and GPNMB expression, the highest
levels of GPNMB expression were detected in patients with
glioblastoma (Fig. 6C). GPNMB
expression was higher in high-grade glioma (WHO III or IV) compared
with that in low-grade glioma (WHO II) (Fig. 6D). Lower Karnofsky performance scores
were observed in patients with high GPNMB expression compared with
those with low expression (Fig. 6E).
Kaplan-Meier analysis with the log-rank test demonstrated that high
GPNMB expression was associated with a shorter survival time
(P<0.001; Fig. 6F). Survival
analysis in sub-populations stratified by age revealed that high
GPNMB expression was significantly associated with a lower survival
rate in patients aged 31–50 years (P<0.001; Fig. 6H) and 51–70 years (P=0.017; Fig. 6I), but not in patients aged 10–30
years (P=0.954; Fig. 6G).
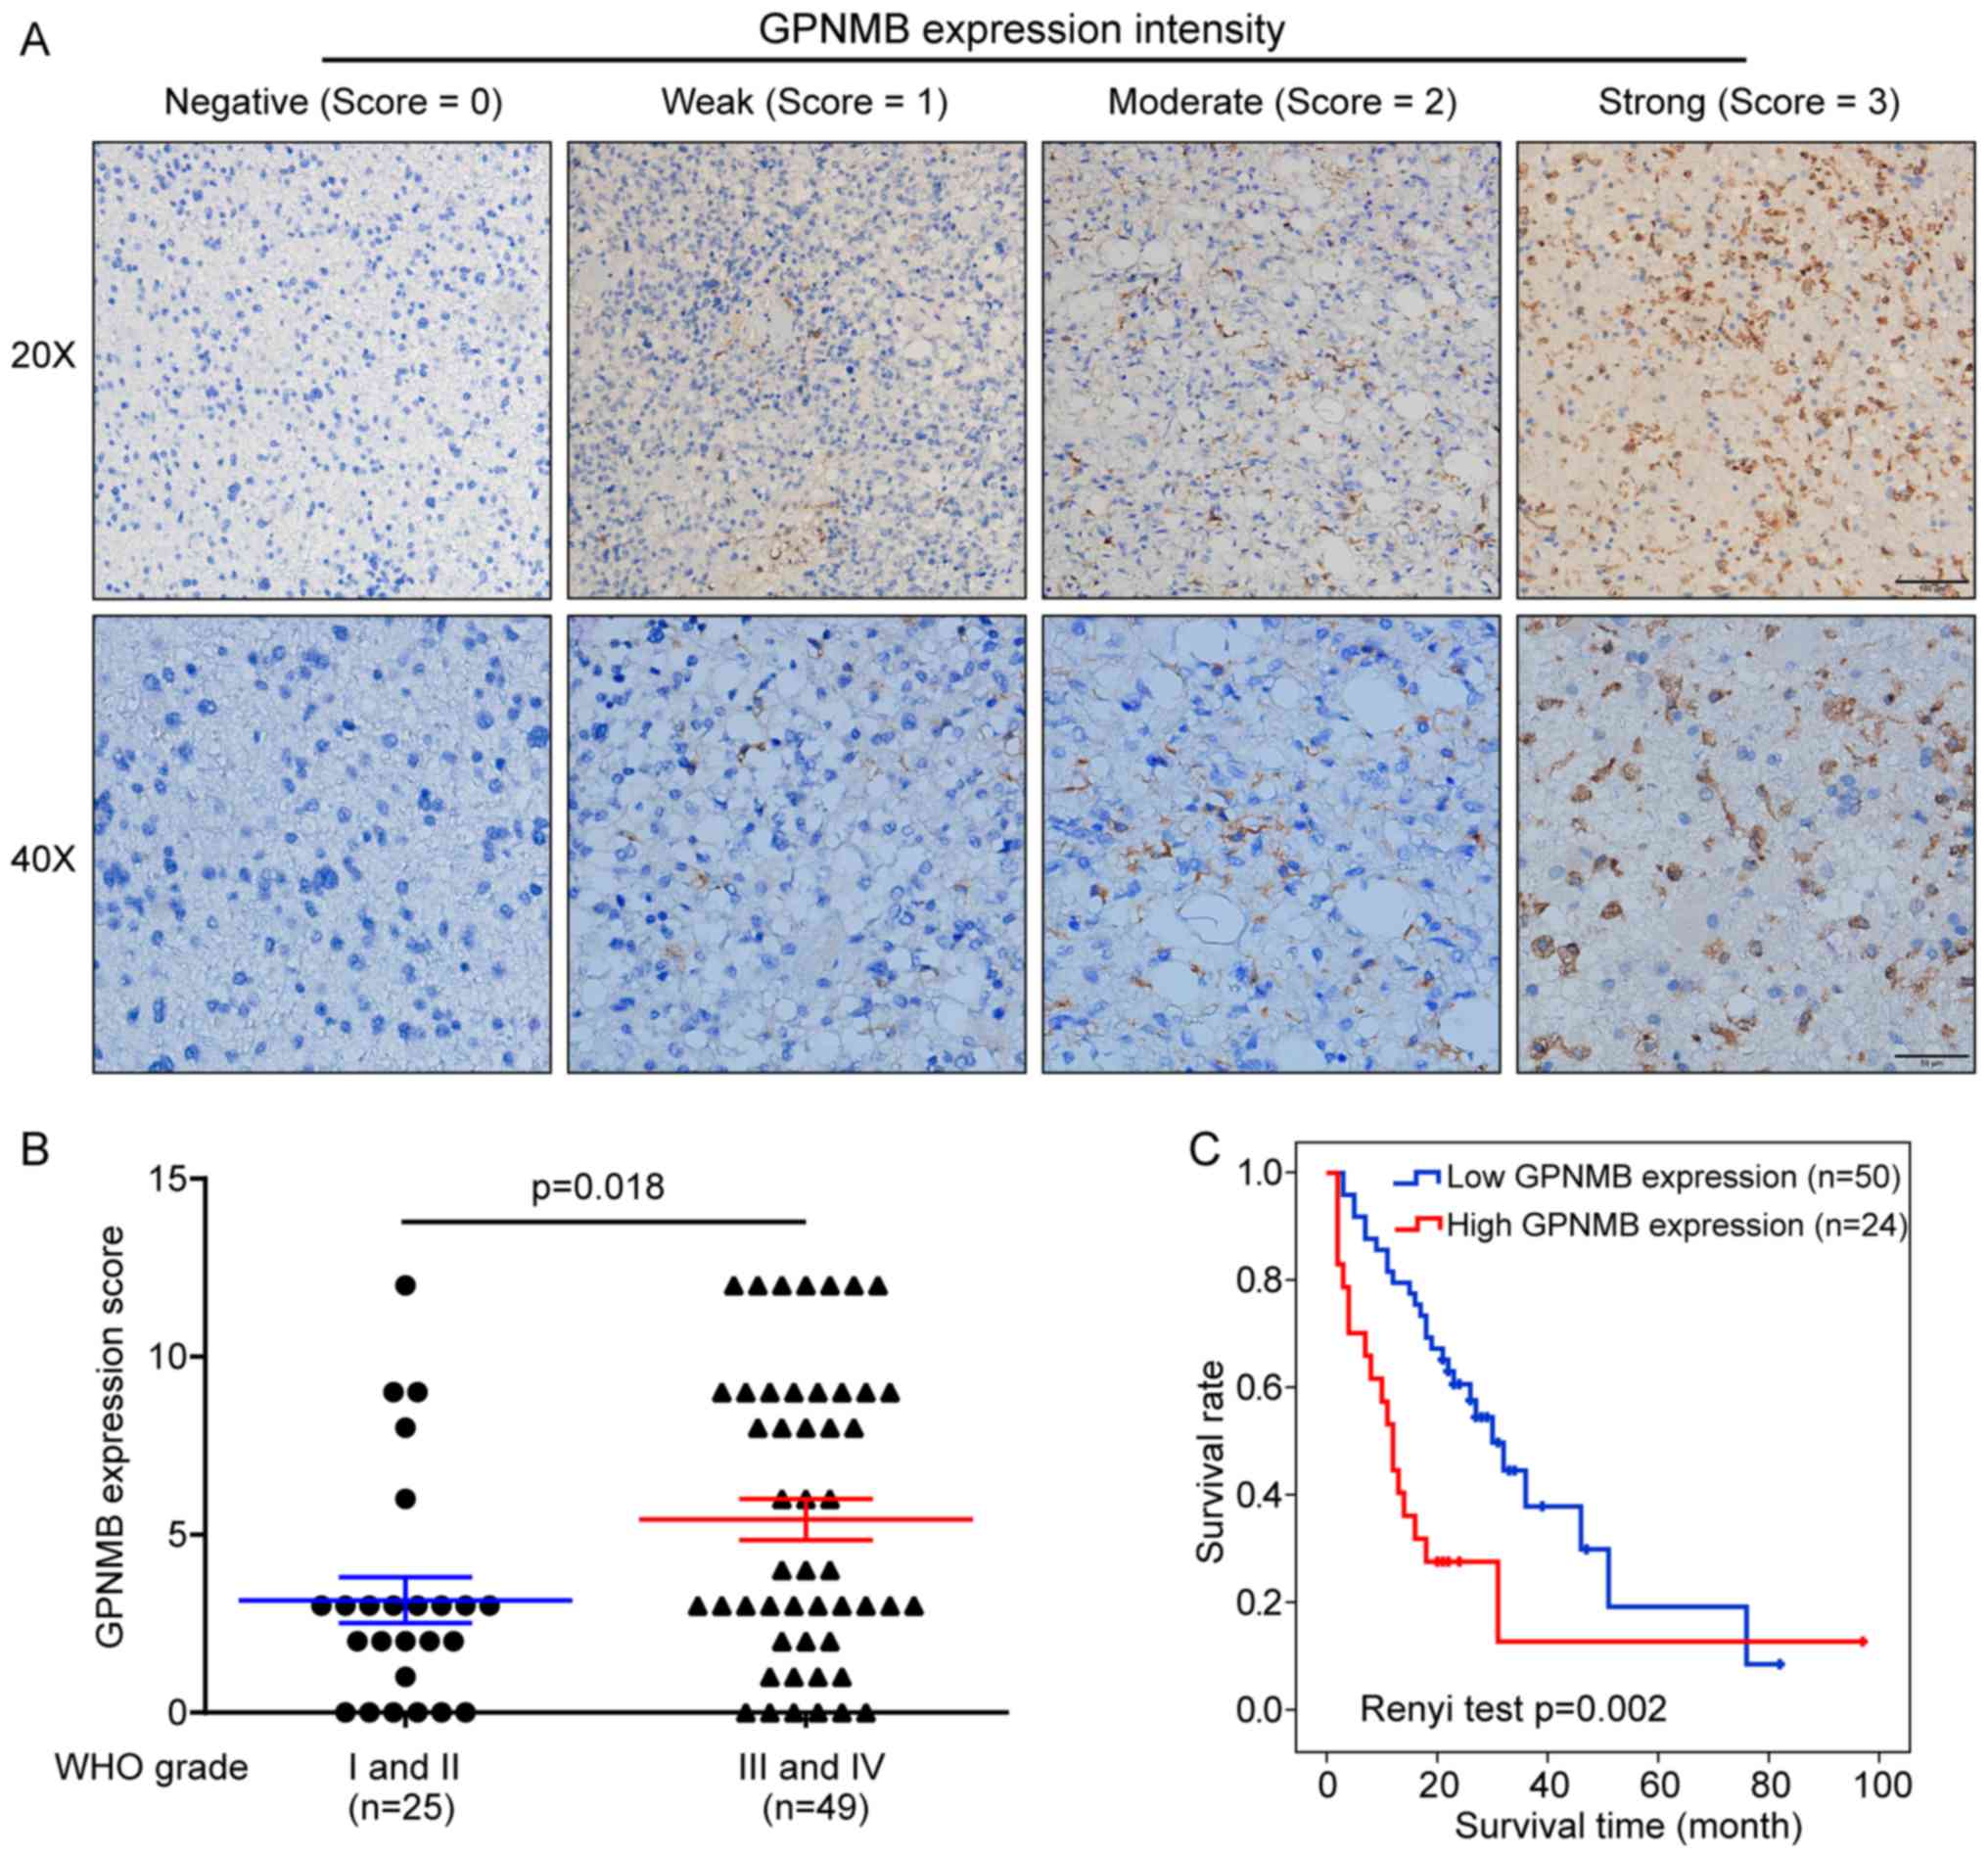
To validate the prognostic role of GPNMB in glioma,
tissue microarrays were immunohistochemically stained with an
anti-GPNMB antibody. Microarrays from 74 Chinese patients with
glioma with complete follow-up information were analyzed.
Representative images of GPNMB staining with different intensity
scores are presented in Fig. 7A. No
significant differences in GPNMB expression distribution were
observed between female and male patients (χ2=0.173;
P=0.678; Table I). The proportion of
patients with high GPNMB expression was higher in patients aged
>40 years compared with that in patients aged ≤40 years
(χ2=5.316; P=0.021; Table
I). The GPNMB expression level was significantly correlated
with the WHO grade (rho=0.353; P=0.002; Table I), and the GPNMB expression scores
were higher in high-compared with low-grade glioma (P=0.018;
Fig. 7B). Survival analysis using
Renyi test demonstrated that high GPNMB expression was
significantly associated with a lower survival rate (P=0.002;
Fig. 7C). In addition, multivariate
analysis based on the Cox proportional hazards model revealed that
GPNMB expression was an independent prognostic factor for glioma
(P=0.009, Table II).
 | Table I.Association of GPNMB expression with
clinical parameters in the 74 glioma patients. |
Table I.
Association of GPNMB expression with
clinical parameters in the 74 glioma patients.
|
| GPNMB
expression |
|
|
|---|
|
|
|
|
|
|---|
| Variable | Low | High | Statistics
value | P-value |
|---|
| Sex |
|
|
|
|
|
Female | 17 | 7 | 0.173
(χ2) | 0.678 |
|
Male | 33 | 17 |
|
|
| Age |
|
|
|
|
|
≤40 | 22 | 4 | 5.316
(χ2) | 0.021a |
|
>40 | 28 | 20 |
|
|
| WHO
gradeb |
|
|
|
|
| I | 1 | 0 | 0.353 (Spearman
rho) | 0.002a |
| II | 20 | 4 |
|
|
|
III | 18 | 6 |
|
|
| IV | 11 | 14 |
|
|
| Table II.Univariate and multivariate analysis
based on Cox proportional hazards model explored prognostic role of
GPNMB. |
Table II.
Univariate and multivariate analysis
based on Cox proportional hazards model explored prognostic role of
GPNMB.
|
|
| Multivariate
analysis |
|---|
|
|
|
|
|---|
| Variable | Univariate analysis
P-value | P-value | RR | 95% CI |
|---|
| Sex (female vs.
male) | 0.281 | 0.181 | 0.637 | 0.330–1.232 |
| Age (≤40 vs.
>40) | 0.702 | 0.409 | 1.340 | 0.669–2.686 |
| WHO grade (I and II
vs. III and IV)b | 0.043a | 0.114 | 0.562 | 0.275–1.148 |
| GPNMB expression
(low vs. high) | 0.005a | 0.009a | 0.413 | 0.213–0.803 |
Discussion
To date, although a number of predictive molecular
markers (e.g., 1p/19q co-deletion and IDH1/2 mutations) have been
identified as prognostic markers for glioma (33–35),
more are urgently required, partly due to the great complexity of
the molecular traits of glioma (36). GPNMB, a transmembrane glycoprotein,
has been demonstrated to be involved in tumor progression (11,12,21,22),
whereas its mechanistic effects on glioma progression and its
prognostic role have not been thoroughly investigated. Therefore,
the aim of the present study was to elucidate the prognostic role
of GPNMB in glioma through data mining of publicly accessible
datasets through validation by immunohistochemical staining of a
tissue microarray. Systematic bioinformatics analysis was conducted
to explore the molecular disparities between samples with high and
low GPNMB expression; the results identified potential mechanisms
through which GPNMB may mediate glioma progression.
In the present study, the upregulated DEGs in
samples with high GPNMB expression compared with samples with low
GPNMB expression were subjected to GO enrichment analysis. The
processes of cell migration and invasion have been established to
be inextricably linked with and characterized by the extracellular
matrix (ECM), cell adhesion, cell cytoskeleton and chemotaxis
(37–41). In the present study, the most
significantly enriched GO pathways participated in migration and
invasion. In addition, KEGG analysis results consistently revealed
that the DEGs were significantly enriched in pathways associated
with cell migration and invasion, such as ‘ECM-receptor
interaction’, ‘focal adhesion’, ‘regulation of actin cytoskeleton’,
‘chemokine signaling pathway’ and ‘cell adhesion molecules’. The
subsequent GSEA demonstrated that glioma samples with high GPNMB
expression were characterized by enriched pathways involved in
migration and invasion. Correlation analysis was performed to
explore the relationship between GPNMB and markers of migration and
invasion. GPNMB expression was positively correlated with that of
CXCR4, TGFB1, PLAU, PLAUR, MMP-2, MMP-7 and MMP-9, which are
considered to be markers of tumor cell migration and invasion
(42–51). Taken together, the comprehensive
bioinformatics analysis, which included GO, KEGG, GSEA and
correlation analysis, indicated the potential pathways through
which GPNMB promotes glioma migration and invasion.
To the best of our knowledge, studies concerning the
effects of GPNMB on glioma angiogenesis are rare. Using in
vitro assays, Bao et al (25) demonstrated that GPNMB knockdown in
glioma cells suppressed the tube formation of endothelial cells
induced by conditioned medium from glioma cells. Considering that
glioma angiogenesis is a highly complicated in vivo process
(52), evidence from Bao et
al (25) for the role of GPNMB
in glioma angiogenesis may be reasonable but inadequate. In the
present study, GO analysis revealed that the upregulated DEGs in
samples with high GPNMB expression were enriched in ‘response to
hypoxia’ and ‘positive regulation of angiogenesis’. Consistently,
GSEA revealed that samples with high GPNMB expression were
characterized by hypoxia and angiogenesis. In addition, GPNMB was
positively correlated with CD31 and ENG, which are markers of
angiogenesis (53,54). Taken together, based on systemic
bioinformatics analysis, the results of the present study suggested
that the effects of GPNMB on angiogenesis may be crucial mechanisms
of glioma progression.
In addition to the effects of GPNMB on glioma
angiogenesis, migration and invasion, several recent studies have
suggested other potential mechanisms of GPNMB-mediated glioma
progression which involve glioma-associated microglia/macrophage
(GAM) polarization towards the M2 phenotype (55–57). GAM
with the M2 phenotype has protumoral and immunosuppressive
properties (58,59). Thus, the present study explored the
correlation between GPNMB and CD163 (a known marker for GAM with
the M2 phenotype) expression (60).
In the present study, the correlation analysis revealed that GPNMB
expression was positively associated with CD163 in the GSE53733
dataset and the microarray dataset in CGGA. In addition, GPNMB
expression was significantly correlated with that of TGFB1, which
is another known marker for GAM polarization towards the M2
phenotype (60). Although the
correlation analysis indicated positive associations between GPNMB
and markers of M2-phenotype GAM, the specific roles of GPNMB in GAM
polarization require more thorough investigation and solid
evidence.
To further validate the effects of GPNMB on glioma
progression, in vitro experiments were performed to
determine the role of GPNMB in glioma cell proliferation, migration
and invasion. Fig. S2 demonstrates
that knockdown of GPNBM significantly inhibited the proliferation,
migration and invasion of U87 cells. These in vitro
experiments consolidated the tumor-promoting role of GPNBM in
glioma progression.
The prognostic role of GPNMB in glioma is not fully
determined, although an early study from Kuan et al
(23) suggested that GPNMB was
associated with higher risk of death. Due to the limited sample
size in survival analysis (only 39 cases), ethnicity, age, sex,
lifestyle, other factors and the prognostic role of GPNMB in glioma
requires further investigation. In the present study, it was
revealed through data mining of the dataset from CGGA and
subsequent validation with immunohistochemical staining of tissue
microarray that high GPNMB expression, both at the mRNA and protein
level, was associated with poor survival. Of note, multivariate
analysis demonstrated that high GPNMB expression was an independent
risk factor for patient survival. The difference in survival
outcomes between patients with high and low GPNMB expression was
not statistically significant in sub-populations aged <30 years,
which may be due to the low percentage of patients with high GPNMB
expression among young patients. In the present study, the
population included in the survival analysis comprised Chinese
patients, whereas the previous survival analysis was performed in
American population (23),
suggesting that the unfavorable prognostic effect of GPNMB on
glioma may not be associated with ethnicity.
In conclusion, the results of the present study
demonstrated that high GPNMB expression was associated with high
malignancy and denoted unfavorable prognosis in patients with
glioma. In addition, systematic bioinformatics analyses revealed
that GPNMB expression was correlated with that of genes involved in
hypoxia, angiogenesis, migration and invasion, which may be the
potential mechanisms through which GPNMB mediates glioma
progression.
Supplementary Material
Supporting Data
Acknowledgements
Not applicable.
Funding
This study was funded by the National Natural
Science Foundation of China (grant nos. 81803048 to XF and 81602663
to WT) and the Henan Provincial People's Hospital, People's
Hospital of Zhengzhou University, People's Hospital of Henan
University (grant nos. ZC20170016 and ZC20180135 to XF and
ZC23456049 to LZ).
Availability of data and materials
The datasets used and/or analyzed in the present
study are available from the corresponding author upon reasonable
request.
Authors' contributions
XF, WT and SC conceived and designed the present
study. XF, LZ, SK, TL, LH and PZ performed the research, collected
and analyzed the data, interpreted the results and wrote the
manuscript. All authors read and approved the final manuscript.
Ethics approval and consent to
participate
The present study was approved by the Ethics
Committee of Henan Provincial People's Hospital.
Patient consent for publication
Not applicable.
Competing interests
The authors declare that they have no competing
interests.
References
|
1
|
Ostrom QT, Gittleman H, Truitt G, Boscia
A, Kruchko C and Barnholtz-Sloan JS: CBTRUS statistical report:
Primary brain and other central nervous system tumors diagnosed in
the United States in 2011–2015. Neuro Oncol. 20 (Suppl 4):iv1–iv86.
2018. View Article : Google Scholar : PubMed/NCBI
|
|
2
|
Lapointe S, Perry A and Butowski NA:
Primary brain tumours in adults. Lancet. 392:432–446. 2018.
View Article : Google Scholar : PubMed/NCBI
|
|
3
|
Ostrom QT, Cote DJ, Ascha M, Kruchko C and
Barnholtz- Sloan JS: Adult glioma incidence and survival by race or
ethnicity in the United States from 2000 to 2014. JAMA Oncol.
4:1254–1262. 2018. View Article : Google Scholar : PubMed/NCBI
|
|
4
|
Hartmann C, Hentschel B, Wick Wm, Capper
D, Felsberg J, Simon M, Westphal M, Schackert G, Meyermann R,
Pietsch T, et al: Patients with IDH1 wild type anaplastic
astrocytomas exhibit worse prognosis than IDH1-mutated
glioblastomas, and IDH1 mutation status accounts for the
unfavorable prognostic effect of higher age: Implications for
classification of gliomas. Acta Neuropathol. 120:707–718. 2010.
View Article : Google Scholar : PubMed/NCBI
|
|
5
|
Metellus P, Coulibaly B, Colin C, de Paula
AM, Vasiljevic A, Taieb D, Barlier A, Boisselier B, Mokhtari K,
Wang XW, et al: Absence of IDH mutation identifies a novel
radiologic and molecular subtype of WHO grade II gliomas with
dismal prognosis. Acta Neuropathol. 120:719–729. 2010. View Article : Google Scholar : PubMed/NCBI
|
|
6
|
Frattini V, Trifonov V, Chan JM, Castano
A, Lia M, Abate F, Keir ST, Ji AX, Zoppoli P, Niola F, et al: The
integrated landscape of driver genomic alterations in glioblastoma.
Nat Genet. 45:1141–1149. 2013. View
Article : Google Scholar : PubMed/NCBI
|
|
7
|
Ceccarelli M, Barthel FP, Malta TM,
Sabedot TS, Salama SR, Murray BA, Morozova O, Newton Y, Radenbaugh
A, Pagnotta SM, et al: Molecular profiling reveals biologically
discrete subsets and pathways of progression in diffuse glioma.
Cell. 164:550–563. 2016. View Article : Google Scholar : PubMed/NCBI
|
|
8
|
Weterman MA, Ajubi N, van Dinter IM, Degen
WG, van Muijen GN, Ruitter DJ and Bloemers HP: nmb, a novel gene,
is expressed in low-metastatic human melanoma cell lines and
xenografts. Int J Cancer. 60:73–81. 1995. View Article : Google Scholar : PubMed/NCBI
|
|
9
|
Zhuo H and Zhou L: Gpnmb/osteoactivin: An
indicator and therapeutic target in tumor and nontumorous lesions.
Pharmazie. 71:555–561. 2016.PubMed/NCBI
|
|
10
|
Maric G, Annis MG, Dong Z, Rose AA, Ng S,
Perkins D, MacDonald PA, Ouellet V, Russo C and Siegel PM: GPNMB
cooperates with neuropilin-1 to promote mammary tumor growth and
engages integrin α5β1 for efficient breast cancer metastasis.
Oncogene. 34:5494–5504. 2015. View Article : Google Scholar : PubMed/NCBI
|
|
11
|
Li Y, Yuan S, Liu J, Wang Y, Zhang Y, Chen
X and Si W: CSE1L silence inhibits the growth and metastasis in
gastric cancer by repressing GPNMB via positively regulating
transcription factor MITF. J Cell Physiol. 235:2071–2079. 2020.
View Article : Google Scholar : PubMed/NCBI
|
|
12
|
Torres C, Linares A, Alejandre MJ,
Palomino-Morales R, Martin M, Delgado JR, Martinez J and Perales S:
The potential role of the glycoprotein osteoactivin/glycoprotein
nonmetastatic melanoma protein B in pancreatic cancer. Pancreas.
44:302–310. 2015. View Article : Google Scholar : PubMed/NCBI
|
|
13
|
Taya M and Hammes SR: Glycoprotein
non-metastatic melanoma protein B (GPNMB) and cancer: A novel
potential therapeutic target. Steroids. 133:102–107. 2018.
View Article : Google Scholar : PubMed/NCBI
|
|
14
|
Hoashi T, Sato S, Yamaguchi Y, Passeron T,
Tamaki K and Hearing VJ: Glycoprotein nonmetastatic melanoma
protein B, a melanocytic cell marker, is a melanosome-specific and
proteolytically released protein. FASEB J. 24:1616–1629. 2010.
View Article : Google Scholar : PubMed/NCBI
|
|
15
|
Abdelmagid SM, Barbe MF, Rico MC,
Salihoglu S, Arango-Hisijara I, Selim AH, Anderson MG, Owen TA,
Popoff SN and Safadi FF: Osteoactivin, an anabolic factor that
regulates osteoblast differentiation and function. Exp Cell Res.
314:2334–2351. 2008. View Article : Google Scholar : PubMed/NCBI
|
|
16
|
Tomihari M, Hwang SH, Chung JS, Cruz PD Jr
and Ariizumi K: Gpnmb is a melanosome-associated glycoprotein that
contributes to melanocyte/keratinocyte adhesion in a RGD-dependent
fashion. Exp Dermatol. 18:586–595. 2009. View Article : Google Scholar : PubMed/NCBI
|
|
17
|
Ripoll VM, Meadows NA, Raggatt LJ, Chang
MK, Pettit AR, Cassady AI and Hume DA: Microphthalmia transcription
factor regulates the expression of the novel osteoclast factor
GPNMB. Gene. 413:32–41. 2008. View Article : Google Scholar : PubMed/NCBI
|
|
18
|
Sheng MH, Wergedal JE, Mohan S and Lau KH:
Osteoactivin is a novel osteoclastic protein and plays a key role
in osteoclast differentiation and activity. FEBS Lett.
582:1451–1458. 2008. View Article : Google Scholar : PubMed/NCBI
|
|
19
|
Ripoll VM, Irvine KM, Ravasi T, Sweet MJ
and Hume DA: Gpnmb is induced in macrophages by IFN-gamma and
lipopolysaccharide and acts as a feedback regulator of
proinflammatory responses. J Immunol. 178:6557–6566. 2007.
View Article : Google Scholar : PubMed/NCBI
|
|
20
|
Ahn JH, Lee Y, Jeon C, Lee SJ, Lee BH,
Choi KD and Bae YS: Identification of the genes differentially
expressed in human dendritic cell subsets by cDNA subtraction and
microarray analysis. Blood. 100:1742–1754. 2002. View Article : Google Scholar : PubMed/NCBI
|
|
21
|
Chen C, Okita Y, Watanabe Y, Abe F, Fikry
MA, Ichikawa Y, Suzuki H, Shibuya A and Kato M: Glycoprotein nmb is
exposed on the surface of dormant breast cancer cells and induces
stem cell-like properties. Cancer Res. 78:6424–6435.
2018.PubMed/NCBI
|
|
22
|
Oyewumi MO, Manickavasagam D, Novak K,
Wehrung D, Paulic N, Moussa FM, Sondag GR and Safadi FF:
Osteoactivin (GPNMB) ectodomain protein promotes growth and
invasive behavior of human lung cancer cells. Oncotarget.
7:13932–13944. 2016. View Article : Google Scholar : PubMed/NCBI
|
|
23
|
Kuan CT, Wakiya K, Dowell JM, Herndon JE
II, Reardon DA, Graner MW, Riggins GJ, Wikstrand CJ and Bigner DD:
Glycoprotein nonmetastatic melanoma protein B, a potential
molecular therapeutic target in patients with glioblastoma
multiforme. Clin Cancer Res. 12:1970–1982. 2006. View Article : Google Scholar : PubMed/NCBI
|
|
24
|
Ono Y, Chiba S, Yano H, Nakayama N, Saio
M, Tsuruma K, Shimazawa M, Iwama T and Hara H: Glycoprotein
nonmetastatic melanoma protein B (GPNMB) promotes the progression
of brain glioblastoma via Na+/K+-ATPase.
Biochem Biophys Res Commun. 481:7–12. 2016. View Article : Google Scholar : PubMed/NCBI
|
|
25
|
Bao G, Wang N, Li R, Xu G, Liu P and He B:
Glycoprotein non-metastaticmelanoma protein B promotes glioma
motility and angiogenesis through the Wnt/β-catenin signaling
pathway. Exp Biol Med (Maywood). 241:1968–1976. 2016. View Article : Google Scholar : PubMed/NCBI
|
|
26
|
Reifenberger G, Weber RG, Riehmer V,
Kaulich K, Willscher E, Wirth H, Gietzelt J, Hentschel B, Westphal
M, Simon M, et al: Molecular characterization of long-term
survivors of glioblastoma using genome- and transcriptome-wide
profiling. Int J Cancer. 135:1822–1831. 2014. View Article : Google Scholar : PubMed/NCBI
|
|
27
|
Yan W, Zhang W, You G, Zhang J, Han L, Bao
Z, Wang Y, Liu Y, Jiang C, Kang C, et al: Molecular classification
of gliomas based on whole genome gene expression: A systematic
report of 225 samples from the Chinese glioma cooperative group.
Neuro Oncol. 14:1432–1440. 2012. View Article : Google Scholar : PubMed/NCBI
|
|
28
|
R Core Team, . R: A language and
environment for statistical computing. R Foundation for Statistical
Computing. (Vienna, Austria). URL http://www.R-project.org/.
2014.
|
|
29
|
Wettenhall JM and Smyth GK: limmaGUI: A
graphical user interface for linear modeling of microarray data.
Bioinformatics. 20:3705–3706. 2004. View Article : Google Scholar : PubMed/NCBI
|
|
30
|
Yu G, Wang LG, Han Y and He QY:
clusterProfiler: An R package for comparing biological themes among
gene clusters. OMICS. 16:284–287. 2012. View Article : Google Scholar : PubMed/NCBI
|
|
31
|
Luo W and Brouwer C: Pathview: An
R/Bioconductor package for pathway-based data integration and
visualization. Bioinformatics. 29:1830–1831. 2013. View Article : Google Scholar : PubMed/NCBI
|
|
32
|
Verhaak RG, Hoadley KA, Purdom E, Wang V,
Qi Y, Wilkerson MD, Miller CR, Ding L, Golub T, Mesirov JP, et al:
Integrated genomic analysis identifies clinically relevant subtypes
of glioblastoma characterized by abnormalities in PDGFRA, IDH1,
EGFR, and NF1. Cancer Cell. 17:98–110. 2010. View Article : Google Scholar : PubMed/NCBI
|
|
33
|
Hofer S and Lassman AB: Molecular markers
in gliomas: Impact for the clinician. Target Oncol. 5:201–210.
2010. View Article : Google Scholar : PubMed/NCBI
|
|
34
|
Ma R, de Pennington N, Hofer M, Blesing C
and Stacey R: Diagnostic and prognostic markers in gliomas-an
update. Br J Neurosurg. 27:311–315. 2013. View Article : Google Scholar : PubMed/NCBI
|
|
35
|
Thomas L, Di Stefano AL and Ducray F:
Predictive biomarkers in adult gliomas: The present and the future.
Curr Opin Oncol. 25:689–694. 2013. View Article : Google Scholar : PubMed/NCBI
|
|
36
|
Ellison DW: Multiple molecular data sets
and the classification of adult diffuse gliomas. N Engl J Med.
372:2555–2557. 2015. View Article : Google Scholar : PubMed/NCBI
|
|
37
|
Gimona M and Buccione R: Adhesions that
mediate invasion. Int J Biochem Cell Biol. 38:1875–1892. 2006.
View Article : Google Scholar : PubMed/NCBI
|
|
38
|
Yamaguchi H, Wyckoff J and Condeelis J:
Cell migration in tumors. Curr Opin Cell Biol. 17:559–564. 2005.
View Article : Google Scholar : PubMed/NCBI
|
|
39
|
Kedrin D, van Rheenen J, Hernandez L,
Condeelis J and Segall JE: Cell motility and cytoskeletal
regulation in invasion and metastasis. J Mammary Gland Biol
Neoplasia. 12:143–152. 2007. View Article : Google Scholar : PubMed/NCBI
|
|
40
|
Staff AC: An introduction to cell
migration and invasion. Scand J Clin Lab Invest. 61:257–268. 2001.
View Article : Google Scholar : PubMed/NCBI
|
|
41
|
Sciumè G, Santoni A and Bernardini G:
Chemokines and glioma: Invasion and more. J Neuroimmunol. 224:8–12.
2010. View Article : Google Scholar : PubMed/NCBI
|
|
42
|
Wick W, Naumann U and Weller M:
Transforming growth factor-beta: A molecular target for the future
therapy of glioblastoma. Curr Pharm Des. 12:341–349. 2006.
View Article : Google Scholar : PubMed/NCBI
|
|
43
|
Wells A, Grahovac J, Wheeler S, Ma B and
Lauffenburger D: Targeting tumor cell motility as a strategy
against invasion and metastasis. Trends Pharmacol Sci. 34:283–289.
2013. View Article : Google Scholar : PubMed/NCBI
|
|
44
|
Laufs S, Schumacher J and Allgayer H:
Urokinase-receptor (u-PAR): An essential player in multiple games
of cancer: A review on its role in tumor progression, invasion,
metastasis, proliferation/dormancy, clinical outcome and minimal
residual disease. Cell Cycle. 5:1760–1771. 2006. View Article : Google Scholar : PubMed/NCBI
|
|
45
|
Kessenbrock K, Plaks V and Werb Z: Matrix
metalloproteinases: Regulators of the tumor microenvironment. Cell.
141:52–67. 2010. View Article : Google Scholar : PubMed/NCBI
|
|
46
|
Kassis J, Lauffenburger DA, Turner T and
Wells A: Tumor invasion as dysregulated cell motility. Semin Cancer
Biol. 11:105–117. 2001. View Article : Google Scholar : PubMed/NCBI
|
|
47
|
Jiang WG, Sanders AJ, Katoh M, Ungefroren
H, Gieseler F, Prince M, Thompson SK, Zollo M, Spano D, Dhawan P,
et al: Tissue invasion and metastasis: Molecular, biological and
clinical perspectives. Semin Cancer Biol. 35 (Suppl):S244–S275.
2015. View Article : Google Scholar : PubMed/NCBI
|
|
48
|
Jakowlew SB: Transforming growth
factor-beta in cancer and metastasis. Cancer Metastasis Rev.
25:435–457. 2006. View Article : Google Scholar : PubMed/NCBI
|
|
49
|
Friedl P and Wolf K: Tumour-cell invasion
and migration: Diversity and escape mechanisms. Nat Rev Cancer.
3:362–374. 2003. View Article : Google Scholar : PubMed/NCBI
|
|
50
|
Andreasen PA, Kjøller L, Christensen L and
Duffy MJ: The urokinase-type plasminogen activator system in cancer
metastasis: A review. Int J Cancer. 72:1–22. 1997. View Article : Google Scholar : PubMed/NCBI
|
|
51
|
Westermarck J and Kähäri VM: Regulation of
matrix metalloproteinase expression in tumor invasion. FASEB J.
13:781–792. 1999. View Article : Google Scholar : PubMed/NCBI
|
|
52
|
Jain RK, di Tomaso E, Duda DG, Loeffler
JS, Sorensen AG and Batchelor TT: Angiogenesis in brain tumours.
Nat Rev Neurosci. 8:610–622. 2007. View Article : Google Scholar : PubMed/NCBI
|
|
53
|
Anderson SA, Glod J, Arbab AS, Noel M,
Ashari P, Fine HA and Frank JA: Noninvasive MR imaging of
magnetically labeled stem cells to directly identify neovasculature
in a glioma model. Blood. 105:420–425. 2005. View Article : Google Scholar : PubMed/NCBI
|
|
54
|
Smith SJ, Tilly H, Ward JH, Macarthur DC,
Lowe J, Coyle B and Grundy RG: CD105 (Endoglin) exerts prognostic
effects via its role in the microvascular niche of paediatric high
grade glioma. Acta Neuropathol. 124:99–110. 2012. View Article : Google Scholar : PubMed/NCBI
|
|
55
|
Hudson AL, Parker NR, Khong P, Parkinson
JF, Dwight T, Ikin RJ, Zhu Y, Chen J, Wheeler HR and Howell VM:
Glioblastoma Recurrence correlates with increased APE1 and
polarization toward an immuno-suppressive microenvironment. Front
Oncol. 8:3142018. View Article : Google Scholar : PubMed/NCBI
|
|
56
|
Walentynowicz KA, Ochocka N, Pasierbinska
M, Wojnicki K, Stepniak K, Mieczkowski J, Ciechomska IA and
Kaminska B: In search for reliable markers of glioma-induced
polarization of microglia. Front Immunol. 9:13292018. View Article : Google Scholar : PubMed/NCBI
|
|
57
|
Sun X, Liu X, Xia M, Shao Y and Zhang XD:
Multicellular gene network analysis identifies a macrophage-related
gene signature predictive of therapeutic response and prognosis of
gliomas. J Transl Med. 17:1592019. View Article : Google Scholar : PubMed/NCBI
|
|
58
|
Zhou W, Ke SQ, Huang Z, Flavahan W, Fang
X, Paul J, Wu L, Sloan AE, McLendon RE, Li X, et al: Periostin
secreted by glioblastoma stem cells recruits M2 tumour-associated
macrophages and promotes malignant growth. Nat Cell Biol.
17:170–182. 2015. View Article : Google Scholar : PubMed/NCBI
|
|
59
|
Hambardzumyan D, Gutmann DH and Kettenmann
H: The role of microglia and macrophages in glioma maintenance and
progression. Nat Neurosci. 19:20–27. 2016. View Article : Google Scholar : PubMed/NCBI
|
|
60
|
Mantovani A, Sozzani S, Locati M, Allavena
P and Sica A: Macrophage polarization: Tumor-associated macrophages
as a paradigm for polarized M2 mononuclear phagocytes. Trends
Immunol. 23:549–555. 2002. View Article : Google Scholar : PubMed/NCBI
|