Introduction
Uterine corpus endometrial carcinoma (UCEC) is one
of the most common cancer types that affects women worldwide
(1). According to the 2009
International Federation of Gynecology and Obstetrics
classification, stage I or stage II UCEC is categorized as early
stage UCEC (2,3). In total, ~75% of UCEC cases are
diagnosed at stage I of the disease. At this early stage, patients
clinically present with abnormal vaginal bleeding (4). Due to early diagnosis, the 5-year
survival rate of patients with UCEC is ~90% (5). However, in a subset of patients
diagnosed with early stage UCEC, the disease manifests in a poorly
differentiated form and is classified as grade III UCEC (6). High-grade stage I UCEC progresses
rapidly and presents with a high metastatic rate within a short
time (6). Higher-grade
classification takes into account the number of tumor cells
undergoing differentiation, which allows the more malignant
biological behavior to be observed (7). High-grade UCEC frequently presents with
lymph-vascular space invasion and deep myometrial infiltration
(8). Therefore, there is an urgent
need to investigate the underlying mechanisms that drive the
tumorigenesis and progression of stage I UCEC. The therapeutic
strategy employed in the treatment of UCEC depends on the tumor
grade. For stage I UCEC, surgical intervention is preferred, and
total hysterectomy and removal of oviduct and ovaries are standard
treatments (6). For high-grade UCEC,
adjuvant treatments, such as radiotherapy and chemotherapy, are
preferred, as they achieve improved outcomes (9,10). Due
to its high recurrence rate, the 5-year overall survival (OS) rate
of grade 3 UCEC ranges between 20 and 40% (11). Therefore, novel and specific targeted
therapies with fewer negative side effects are urgently needed to
improve the outcomes for patients with high-grade stage I UCEC.
It has previously been reported that the
PI3K/AKT/mTOR signaling axis is frequently dysregulated in UCEC
(12). However, a trial testing the
clinical efficacy of mTOR inhibitors against UCEC revealed a
response rate of <10% (13).
Other therapeutic strategies have also been evaluated, including
use of inhibitors of PI3K (14),
vascular endothelial growth factor/fibroblast growth factor
receptor (15,16), poly (ADP-ribose) polymerase (17) and programmed cell death protein
1/programmed death-ligand 1 (18),
with outcomes showing the limited efficacy of these agents.
Advances in the application of high-throughput
microarray technology in research, coupled with the availability of
public databases, has made bioinformatics analysis a powerful means
for identifying critical biomarkers in cancer (19–21).
However, to the best of our knowledge, very few studies (22,23) have
investigated the interconnection among genes. By contrast, numerous
studies have focused on the identification of differentially
expressed genes (DEGs) between cancer and normal tissues (24–26).
Weighted gene co-expression network analysis (WGCNA) allows the
identification of associations between genes and the clinical
features of cancer based on scale-free networks (27). WGCNA has previously been used to
identify genes associated with clinical features of cancer, such as
stage, tumor grade and metastasis (28–30).
In the present study, WGCNA was performed on
microarray data obtained from the Gene Expression Omnibus (GEO)
database and UCEC RNA-sequencing (RNA-seq) data from The Cancer
Genome Atlas (TCGA). The publicly available data were screened to
identify DEGs for determination of their association with tumor
grade. The present study may help to identify novel tumor
grade-associated genes with the potential to predict the prognosis
and progression of UCEC, which may provide insight for an improved
understanding of UCEC pathogenesis.
Materials and methods
Data source
A workflow diagram for the present study is shown in
Fig. 1. The following datasets were
downloaded from the publicly available endometrial carcinoma (EC)
GEO database (http://www.ncbi.nlm.nij.gov/geo/): GSE17025 (31), GSE56026 (32) and GSE115810 (33). Datasets GSE17025 and GSE56026 were
based on the Affymetrix Human Genome U133 Plus 2.0 Array, while
dataset GSE115810 was based on the Affymetrix Human Genome U133A
Array (both Affymetrix; Thermo Fisher Scientific, Inc.). The
GSE17025 dataset, which consists of 91 stage I EC samples and 12
normal endometrium samples, was used to identify the DEGs that are
associated with tumor grade. This GSE17025 dataset consisted of 30
grade I samples, 36 grade II samples and 25 grade III samples. An
UCEC RNA-seq dataset and its corresponding clinical information was
also downloaded from TCGA database (https://www.cancer.gov/tcga) using the following
inclusion criteria: i) Histological diagnosed UCEC; ii) no other
malignancy except UCEC; and iii) available detailed clinical and
follow-up information. This dataset contains 581 samples, of which
35 are normal endometrial tissue samples and 546 are UCEC samples.
This TCGA dataset was used to investigate the expression levels of
the DEGs and to analyze OS. The GSE115810 and GSE56026 datasets
were used as test datasets for the validation of the association of
DEG expression levels with various tumor grades.
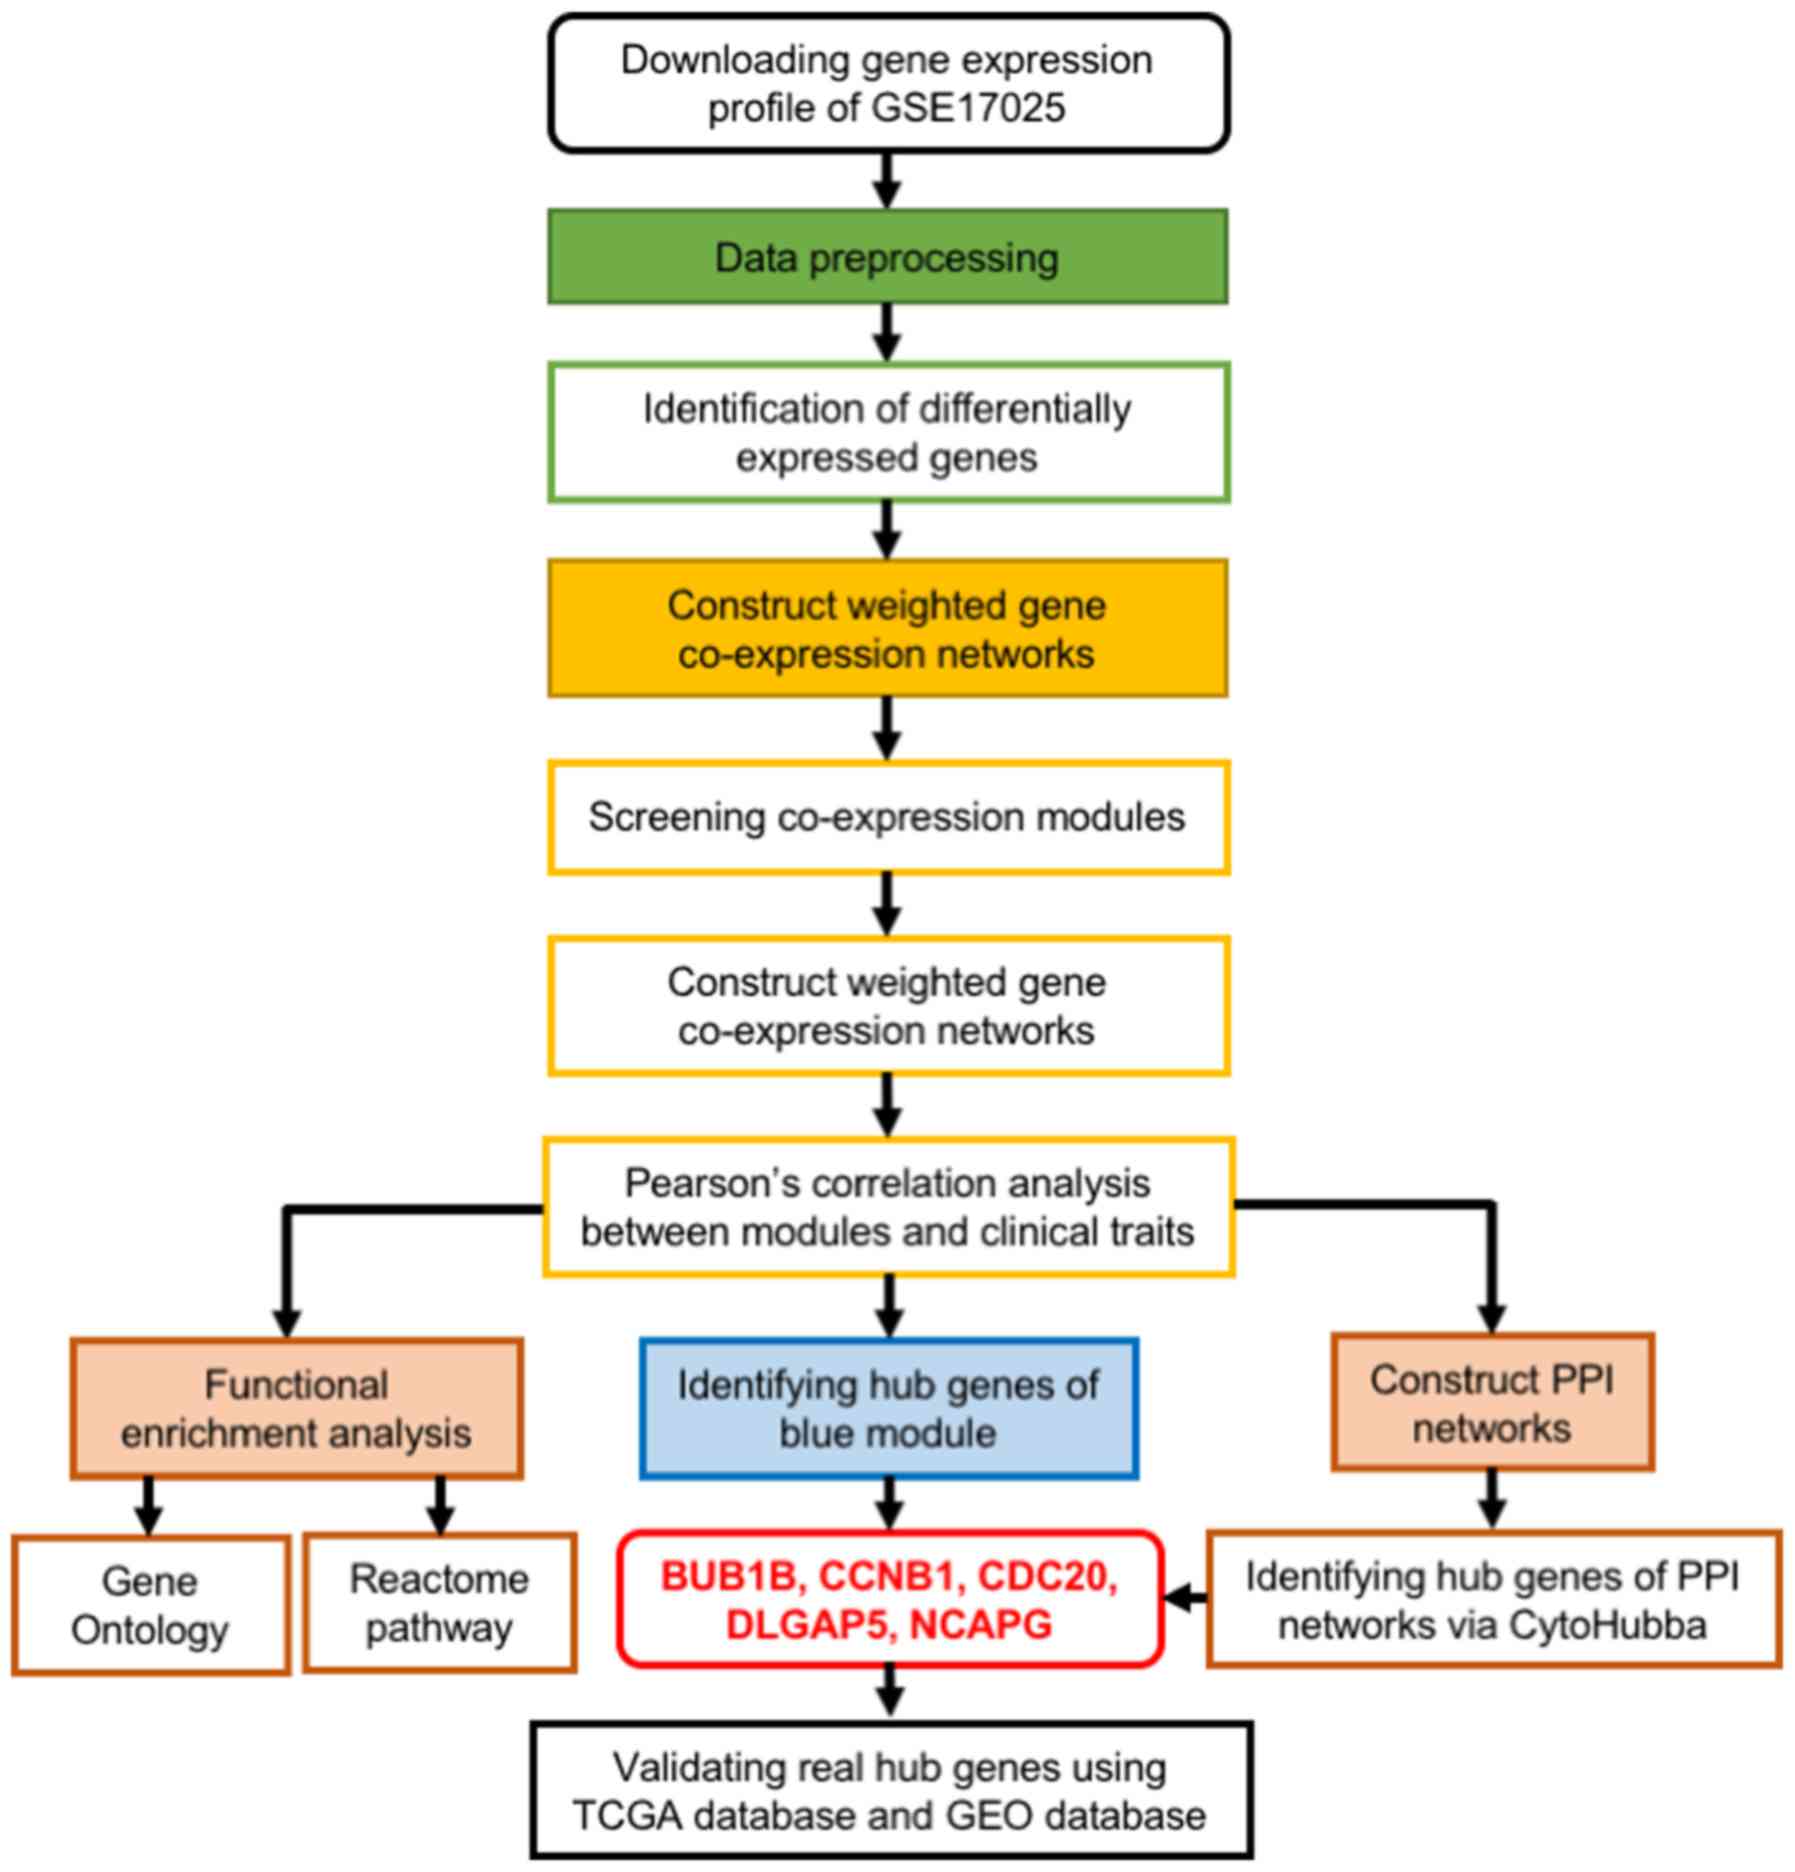 | Figure 1.Flow chart outlining the data
preparation, processing, analysis and validation in the present
study. PPI, protein-protein interaction; BUB1B, BUB1 mitotic
checkpoint serine/threonine kinase B; CCNB1, cyclin B1; CDC20,
cell-division cycle protein 20; DLGAP5, DLG-associated protein 5;
NCAPG, non-SMC condensing I complex subunit; TCGA, The Cancer
Genome Atlas; GEO, Gene Expression Omnibus. |
Data preprocessing
A quality control analysis of the raw microarray
data was performed using the ‘Affy’ package (34) for R software (R version 3.6) using
the following functions: The relative logarithmic expression (RLE)
and the normalized unscaled standard errors (NUSE) (35). Data were considered to be of
sufficiently high quality if the box plot center was at ~0 for the
RLE function and ~1 for the NUSE function. Data that failed to meet
the quality threshold were excluded from downstream analysis. Next,
raw microarray data were subjected to background correction,
normalization and logarithmic conversion using the Robust
Multi-Array Average function in the ‘Affy’ package for R software
(R version 3.6) (36).
Identification of DEGs
Subsequently, the gene expression profile data from
the GSE17025 dataset were analyzed using the ‘limma’ package
(37) for R software (R version
3.6). This was performed to identify DEGs in EC compared with
normal endometrial samples. Only candidate genes within the cut-off
limit of |log2 fold-change (FC)|≥1 and an adjusted
P-value of <0.05 were selected for further analysis.
Construction of co-expression
network
To construct a co-expression network, a matrix was
assembled with the gene symbols as column names and expression
profiles as the row names. Another matrix was assembled using the
corresponding clinical information with the similar approach. Next,
normal endometrium samples and UCEC samples with missing data or
genes with zero variance, were all removed using the
goodSamplesGenes function of the ‘WGCNA’ package in R software (R
version 3.6). Following this step, the ‘WGCNA’ package was employed
to construct a co-expression network of the DEGs, as described
previously (27). Briefly, Pearson's
correlation matrices were conducted for all pair-wise genes. Next,
power functions were applied to establish a weighted adjacency
matrix. The following function was used:
amn=|cmn|ß, where amn indicates
adjacency between gene m and gene n, and cmn indicates
Pearson's correlation between gene m and gene n. The best power (ß
value) was applied as a soft-thresholding parameter that permitted
emphasis on strong DEG correlations while penalizing weak
correlations (38). Next,
adjacencies were transformed into topological overlap matrices to
minimize interference from noise and spurious associations
(39). Any genes exhibiting
identical expression profiles were grouped together into gene
modules using hierarchical clustering. Minimum module size was set
at 30 genes as previously described (40). Finally, the dissimilarity of module
eigengenes (MEs) was calculated and a cutoff threshold of 0.25 was
applied to merge highly identical modules together. Principal
component analysis was employed to identify MEs as the major
component for each module.
Elucidation of tumor grade-associated
modules
Next, the MEs, together with the corresponding
clinical features, were used for module-trait relationship analysis
in R software (R version 3.6) (38).
To this end, Pearson's correlation coefficients and P-values were
calculated and plotted into a heatmap to clearly visualize any
tumor grade-related modules. Genes that were associated with
clinical features of the samples were also calculated. These genes
were used to calculate module significance, which is given as the
mean of the individual gene significance values for the genes
present in a given module. Finally, the ‘highest module’, which is
the module with the strongest correlation with clinical features of
UCEC, was identified.
Functional enrichment analyses
Next, functional enrichment analyses were performed
to identify the biological processes associated with the DEGs. This
was achieved using Gene Ontology (GO) analysis of all genes in the
highest module with the ‘clusterProfiler’ package (41) in R software (R version 3.6). For this
analysis, the statistical cutoff threshold was set at P<0.05.
Genes in the highest threshold were also subjected to Reactome
pathway analysis (42,43). The pathway enrichment threshold was
set at a false discovery rate <0.05.
Identification of hub genes
Modules were further analyzed to identify module hub
genes. Hub genes are defined as those genes that exhibit the
highest correlation with certain clinical features (38). Hub genes were selected from the
highest module based on module membership (correlation between the
MEs and the gene expression profiles) and gene significance
(correlation between genes and certain UCEC clinical features).
Module memberships and gene significance were both derived using
the absolute values from Pearson's correlation analysis in R
software (R version 3.6). The following criteria were used to
select hub genes: cor.geneModuleMembership >0.8 and
cor.geneTraitSignificance >0.3 (38). Next, STRING (version 11; http://string-db.org/) (44) was used to construct protein-protein
interaction (PPI) networks for genes of interest selected from the
highest module. To visualize the results of this analysis,
Cytoscape (version 3.7.0; http://www.cytoscape.org/) (45) was used, applying a minimum required
interaction score of 0.700. Hub genes were identified and
highlighted using CytoHubba (46), a
Cytospace plug-in. To prioritize potential hub genes, the following
methods were employed in CytoHubba: Maximal clique centrality
(MCC), maximum neighborhood component (MNC), degree, edge
percolated component (EPC) and bottleneck (BN). The top 20 genes,
returning the highest connectivity score using each method were
considered to be hub genes. To further narrow the list of potential
hub genes, the lists generated using the respective methods were
combined and the overlapping candidates were selected as the real
hub genes.
Validation and survival analysis based
on TCGA database
UCEC RNA-seq data for 581 samples were downloaded
from TCGA database. This dataset was used to analyze the expression
levels of real hub genes in normal compared with tumor tissues.
First, the best expression cut-off threshold was set for each gene.
This was achieved by taking the gene expression value with the
highest survival difference between the two groups as the lowest
Renyi test P-value. Next, the 541 UCEC samples for which
corresponding clinical information was available were split into
high and low expression groups. Kaplan-Meier (KM) survival analysis
was performed to determine the associations between real hub genes
and OS rate. The Human Protein Atlas (http://www.proteinatlas.org) (47) was employed to map the tissue protein
expression pattern for the real hub genes.
Statistical analysis
The R software (R version 3.6) was used to identify
DEGs, screen out key modules and perform functional enrichment
analyses (27,37,41). The
associations between clinical features and MEs were assessed by
Pearson's correlation analysis in R software (R version 3.6)
(38). Subsequently, the following
statistical analyses were performed using GraphPad Prism 7 (version
7.0a; GraphPad Software, Inc.). KM was used to analyze OS, and the
differences between the study groups were compared using the Renyi
test (48). To evaluate the
associations between expression levels of real hub genes and UCEC
tumor grade, an unpaired two-tailed Student's t-test or one-way
ANOVA followed by Tukey's post-hoc test were performed for data
comparisons. All values are presented as the mean ± standard
deviation. P<0.05 was considered to indicate a statistically
significant difference.
Results
Identification of DEGs
Following preprocessing and normalization of gene
expression data, gene expression matrices were generated for the
103 samples in the GSE17025 dataset. To match clinical features
with sample name, a dendrogram was generated using one of the
cluster methods named ‘complete’ from the ‘WGCNA’ package in R
software. Clinical features for the 91 tumor samples, including
age, ethnicity, histology, disease stage and tumor grade
characteristics, were derived from this dataset (Fig. 2A). In the reported cases, the mean
age of patients with EC was 60.80±10.71 years, the oldest patient
was 91 years old and the youngest was 37 years old. In terms of
ethnicity, 68 patients were Caucasian, 18 were African American, 2
were American Indian, 1 was Asian and 1 was Hispanic (data from 1
patient was missing). The histological pattern of 79 cases was
typical of the endometrioid EC type, while that of the other 12
cases was typical of the papillary serous EC type. Excluding 1 case
with stage I EC that could not be further subdivided into stages,
the other 90 cases consisted of 30 stage IA cases, 37 stage IB
cases and 23 stage IC cases. Next, the samples were categorized
into EC tissues or normal tissues based on indicated pathology.
After applying a cut-off threshold of |log2FC|≥1 and an
adjusted P<0.05, 1,447 DEGs, including 439 upregulated DEGs and
1,008 downregulated DEGs, were identified (Fig. 2B and C).
 | Figure 2.Identification of DEGs in GSE17025.
(A) Clinical traits of 91 tumor samples from the GSE17025 dataset.
White represents missing age, missing ethnicity and endometrioid
histology data. Red for histology represents papillary serous
endometrial carcinoma. The color intensity is proportional to the
age, tumor grade and pathological stage, and the alphabetical order
of ethnicity (African American, American Indian, Asian, Caucasian
and Hispanic). (B) A heatmap plot showing gene expression levels of
103 samples from the GSE17025 dataset. Red indicates a high gene
expression level and blue indicates a low gene expression level.
The color intensity is proportional to gene expression level. (C) A
volcano plot of DEGs in GSE17025. The upregulated DEGs selected
based on the cut-off criteria (|log2 fold-change|≥1 and adj.
P<0.05) are shown in red, and the downregulated DEGs are shown
in blue. DEG, differentially expressed gene; adj., adjusted; BUB1B,
BUB1 mitotic checkpoint serine/threonine kinase B; CCNB1, cyclin
B1; CDC20, cell-division cycle protein 20; DLGAP5, DLG-associated
protein 5; NCAPG, non-SMC condensing I complex subunit. |
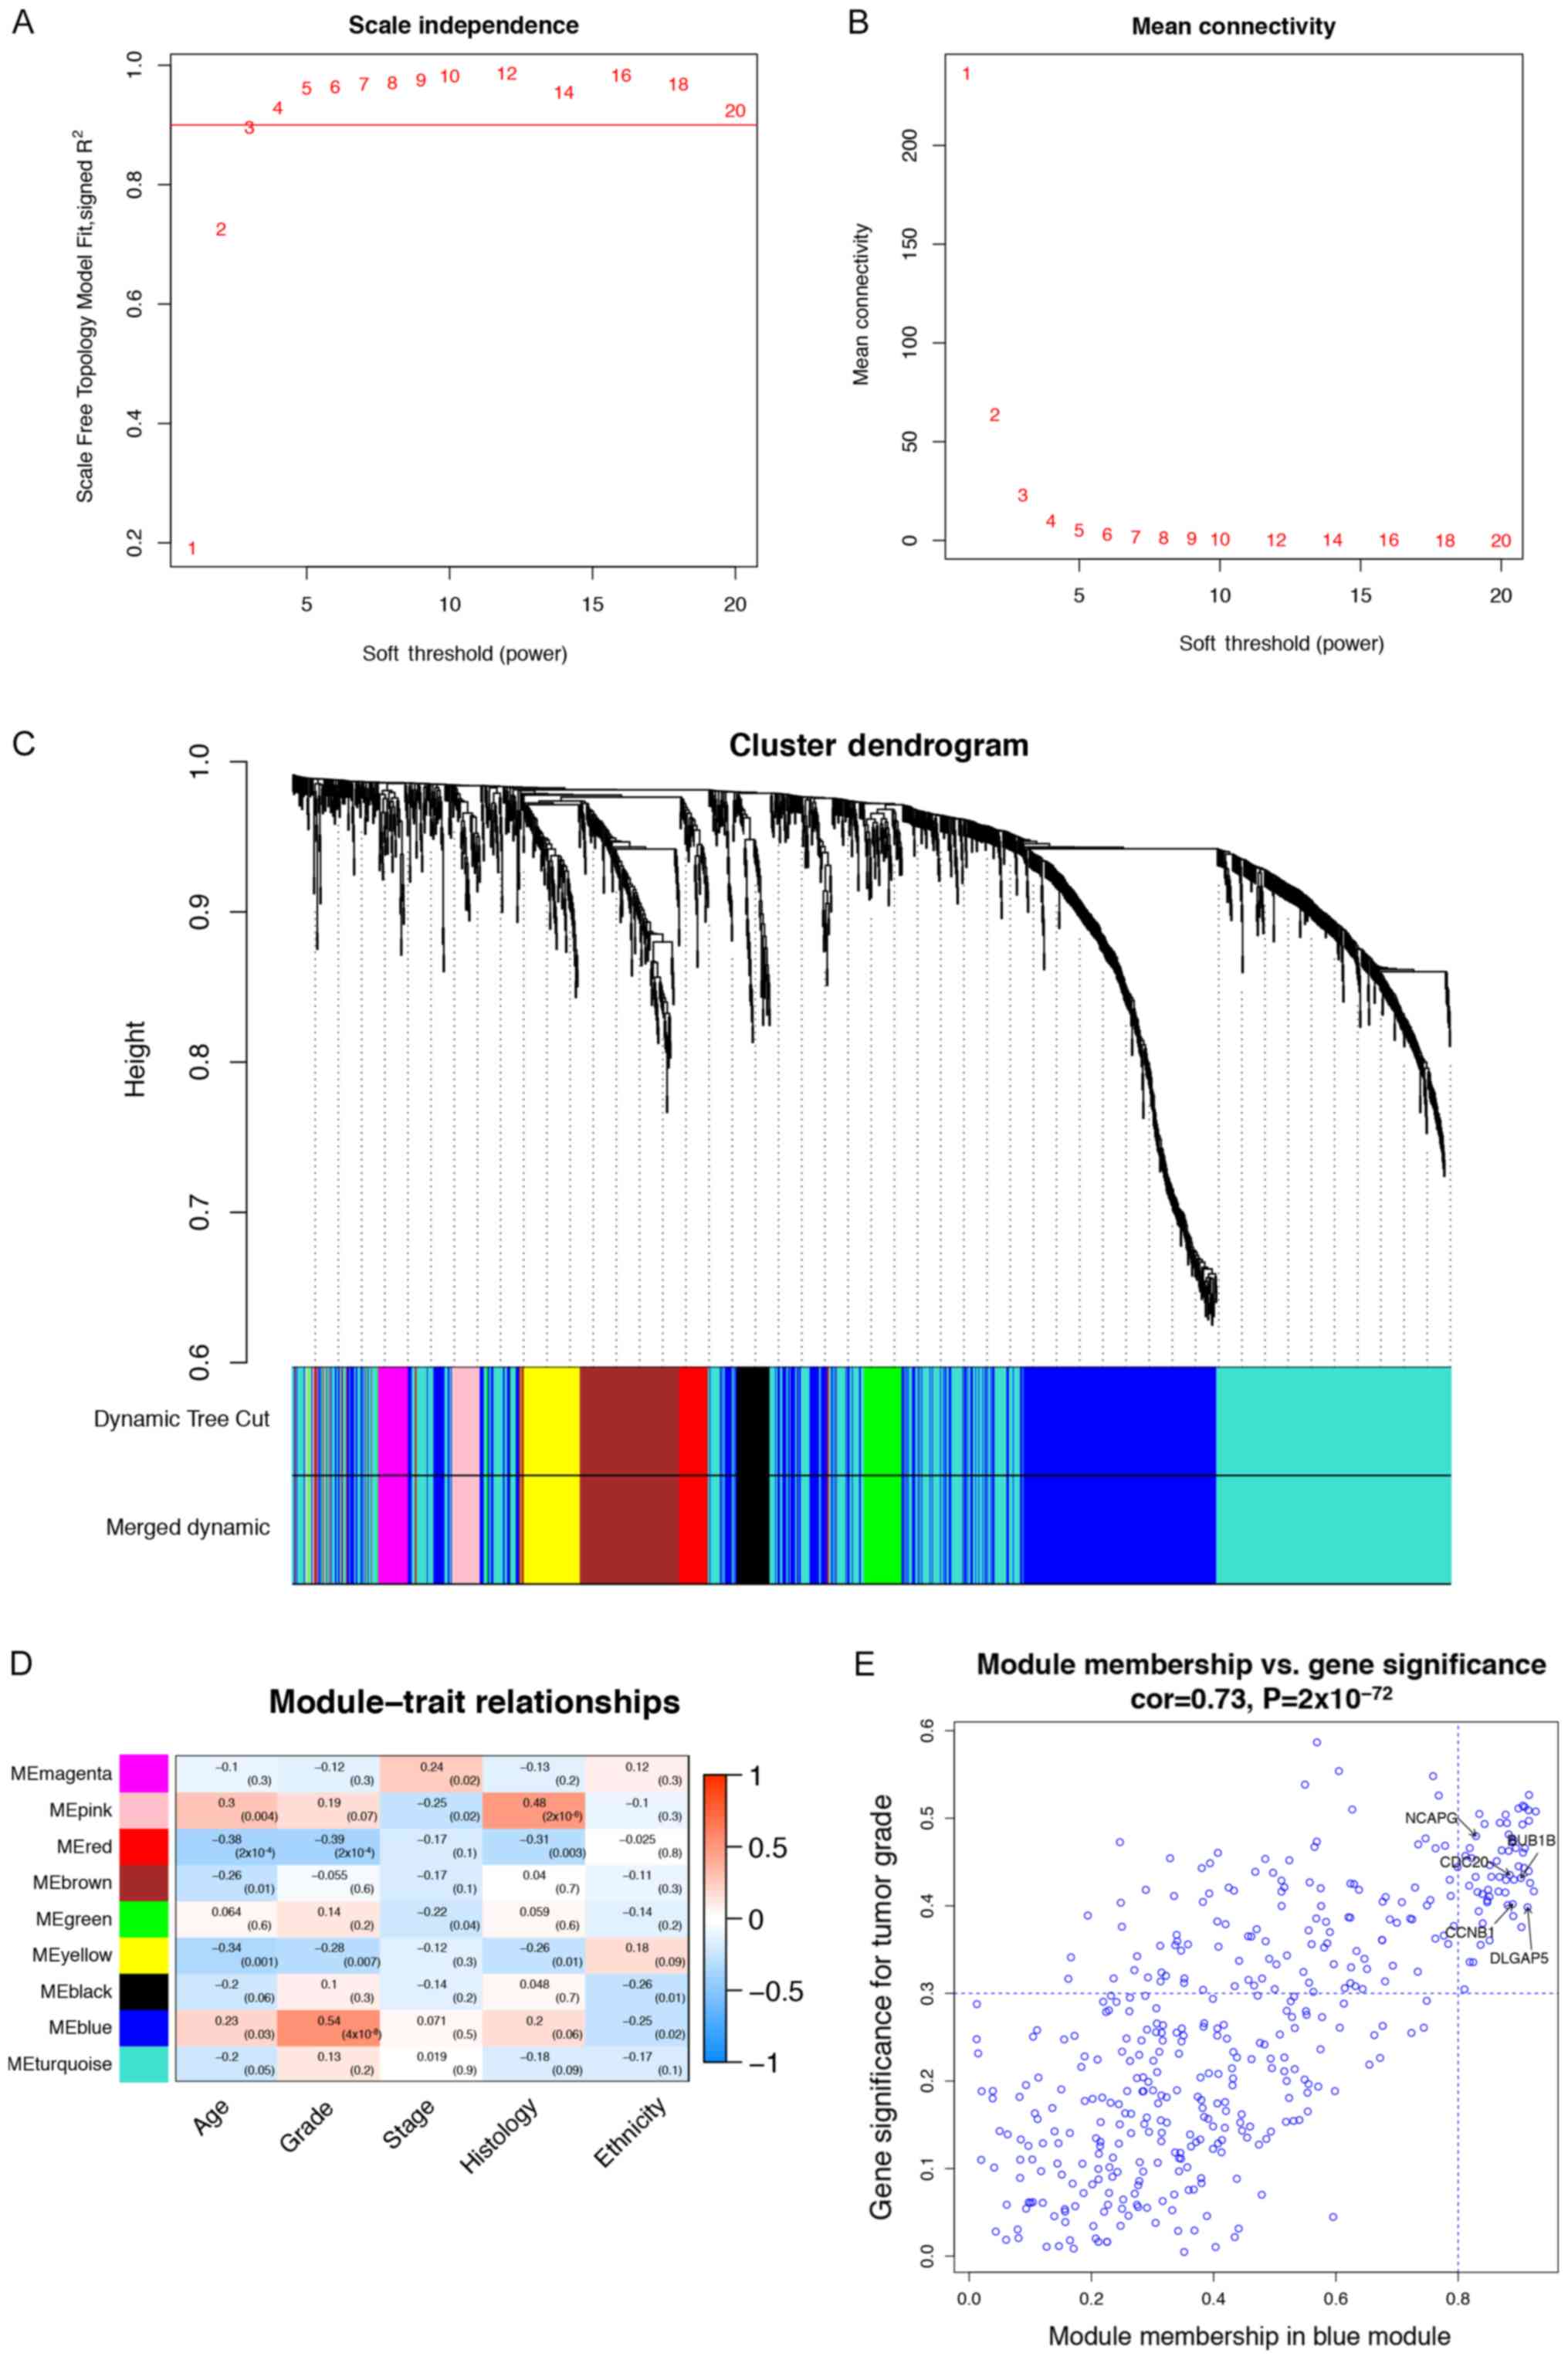
Construction of a weighted
co-expression network and identification of key modules
The expression levels of 1,447 DEGs from 91 UCEC
samples and the corresponding clinical information were assembled
into matrices for co-expression analysis. To ensure a scale-free
network, a power of β=3 (scale free R2=0.9) was applied
as soft-thresholding (Fig. 3A and
B). From this analysis, nine key modules were identified for
downstream analysis (Fig. 3C). From
this analysis, the blue module (highest module) demonstrated the
highest correlation with tumor grade (r=0.54; P=4×10⁻⁸;
Fig. 3D). The highest module
contained 428 tumor grade-related genes (r=0.73;
P=2×10−72; Fig. 3E).
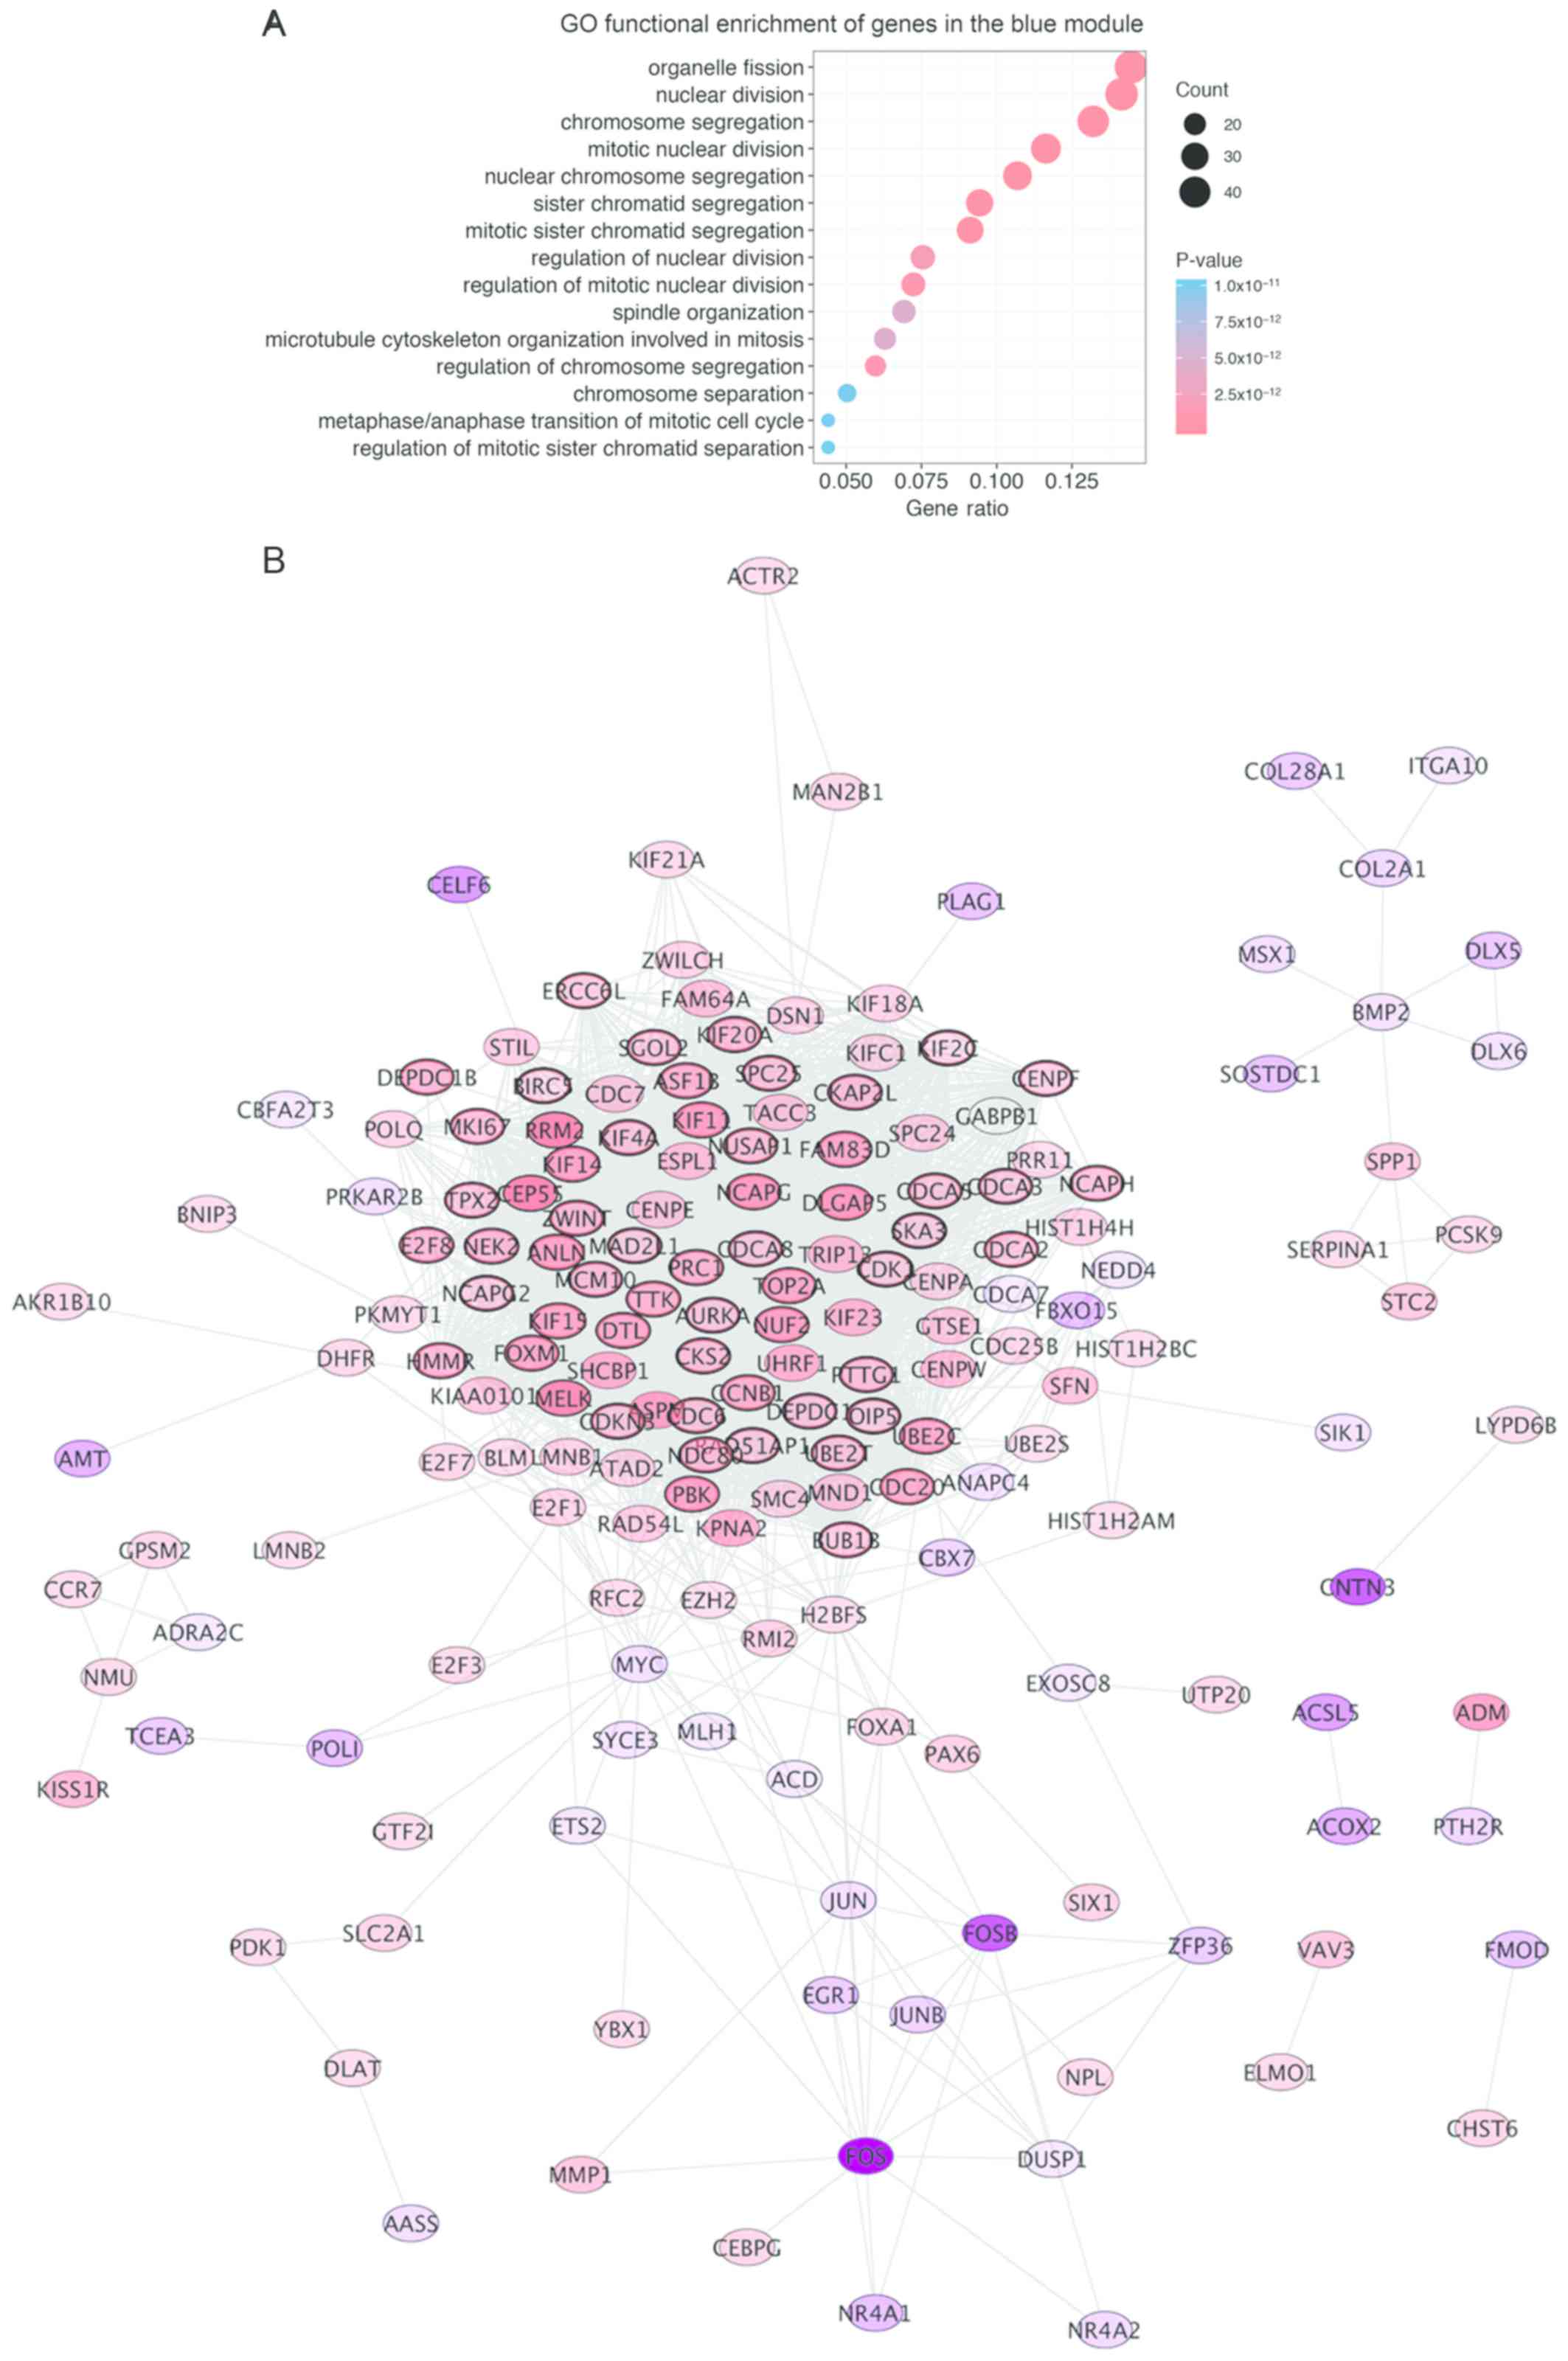
The ‘clusterProfiler’ package in R software was then
used to conduct GO enrichment analysis to identify the biological
processes associated with the DEGs. It was identified that the DEGs
were involved in ‘chromosome segregation’
(P=3.830×10⁻²⁷), ‘nuclear division’
(P=1.993×10⁻²⁵), ‘organelle fission’
(P=1.694×10⁻²⁴) and ‘mitotic nuclear division’
(P=2.428×20−24; Fig. 4A).
Pathway analysis revealed that 216 out of 428 genes of the highest
module were associated with the ‘cell cycle, mitotic’ pathways
(P=1.11×10⁻¹⁶), the ‘cell cycle’
(P=1.11×10⁻¹⁶), ‘cell cycle checkpoint’
(P=2.12×10⁻¹¹) and ‘mitotic spindle checkpoint’
(P=4.693×10⁻¹⁰). Out of the 728 enriched pathways, the
top 25 pathways are presented in Table
I. The pathway enrichment threshold was set at a false
discovery rate <0.05.
 | Table I.Top 25 Reactome pathways of tumor
grade-associated genes in uterine corpus endometrial carcinoma. |
Table I.
Top 25 Reactome pathways of tumor
grade-associated genes in uterine corpus endometrial carcinoma.
| Pathway | Description | Count | P-value | False discovery
rate |
|---|
| R-HSA-69278 | Cell Cycle,
Mitotic | 65/570 |
1.11×10⁻¹⁶ |
4.36×10⁻¹⁴ |
| R-HSA-1640170 | Cell Cycle | 74/682 |
1.11×10⁻¹⁶ |
4.36×10⁻¹⁴ |
| R-HSA-69620 | Cell Cycle
Checkpoint | 36/279 |
2.12×10⁻¹¹ |
5.57×10⁻⁹ |
| R-HSA-69618 | Mitotic Spindle
Checkpoint | 21/110 |
4.69×10⁻¹⁰ |
9.20×10⁻⁸ |
| R-HSA-141444 | Amplification of
signal from unattached kinetochores via a MAD2 inhibitory
signal | 19/94 |
1.27×10⁻⁹ |
1.66×10⁻⁷ |
| R-HSA-141424 | Amplification of
signal from the kinetochores | 19/94 |
1.27×10⁻⁹ |
1.66×10⁻⁷ |
| R-HSA-2500257 | Resolution of
Sister Chromatid Cohesion | 22/134 |
2.78×10⁻⁹ |
3.12×10⁻⁷ |
| R-HSA-68877 | Mitotic
Prometaphase | 27/207 |
5.77×10⁻⁹ |
5.65×10⁻⁷ |
| R-HSA-68886 | M Phase | 38/390 |
1.28×10⁻⁸ |
1.12×10⁻⁶ |
| R-HSA-68882 | Mitotic
Anaphase | 25/208 |
9.87×10⁻⁸ |
7.54×10⁻⁶ |
| R-HSA-2467813 | Separation of
Sister Chromatids | 24/194 |
1.06×10⁻⁷ |
7.54×10⁻⁶ |
| R-HSA-2555396 | Mitotic Metaphase
and Anaphase | 25/211 |
1.29×10⁻⁷ |
8.36×10⁻⁶ |
| R-HSA-5663220 | RHO GTPases
Activate Formins | 20/149 |
3.54×10⁻⁷ |
2.12×10⁻⁵ |
| R-HSA-195258 | RHO GTPase
Effectors | 28/316 |
6.44×10⁻⁶ |
3.60×10⁻⁴ |
| R-HSA-1538133 | G0 and Early
G1 | 9/38 |
8.45×10⁻⁶ |
4.39×10⁻⁴ |
| R-HSA-539107 | Activation of E2F1
target genes at G1/S | 9/43 |
2.22×10⁻⁵ | 0.001 |
| R-HSA-69205 | G1/S-Specific
Transcription | 9/43 |
2.22×10⁻⁵ | 0.001 |
| R-HSA-1362277 | Transcription of
E2F targets under negative control by DREAM complex | 7/25 |
3.00×10⁻⁵ | 0.001 |
| R-HSA-6791312 | TP53 Regulates
Transcription of Cell Cycle Genes | 10/65 |
1.01×10⁻⁴ | 0.004 |
| R-HSA-453279 | Mitotic G1-G1/S
phases | 17/173 |
1.28×10⁻⁴ | 0.005 |
| R-HSA-983189 | Kinesins | 10/68 |
1.46×10⁻⁴ | 0.005 |
| R-HSA-156711 | Polo-like kinase
mediated events | 6/23 |
1.62×10⁻⁴ | 0.006 |
| R-HSA-2514853 | Condensation of
Prometaphase Chromosomes | 5/15 |
1.88×10⁻⁴ | 0.006 |
| R-HSA-179409 | APC-Cdc20 mediated
degradation of Nek2A | 6/25 |
2.53×10⁻⁴ | 0.008 |
| R-HSA-69481 | G2/M
Checkpoints | 15/154 |
3.43×10⁻⁴ | 0.011 |
Identification of hub genes
A total of 60 hub genes exhibiting high connectivity
in the blue module were identified with cor.geneModuleMembership
>0.8 and cor.geneTraitSignificance >0.3. A PPI network of all
genes in the blue module was generated using Cytoscape to visualize
interactions among the genes. This revealed 178 nodes and 2,435
edges. Of the 178 nodes, 134 genes (red nodes) were upregulated,
whereas 44 genes (purple nodes) were downregulated. For each node,
the intensity of color was proportional to the level of gene
expression in the tumor compared with non-tumor tissues (Fig. 4B). To identify hub genes, the
following CytoHubba plug-in methods were employed: MCC, MNC,
degree, EPC and BN. From these analyses, the top 20 hits produced
by each method were considered as hub genes. The hub gene lists
produced by each method were then combined and the overlapping
candidates were selected as the real hub genes for further
analysis. These real hub genes were BUB1 mitotic checkpoint
serine/threonine kinase B (BUB1B), cyclin B1 (CCNB1), cell-division
cycle protein 20 (CDC20), DLG-associated protein 5 (DLGAP5) and
non-SMC condensing I complex subunit G (NCAPG) (Fig. 5A).
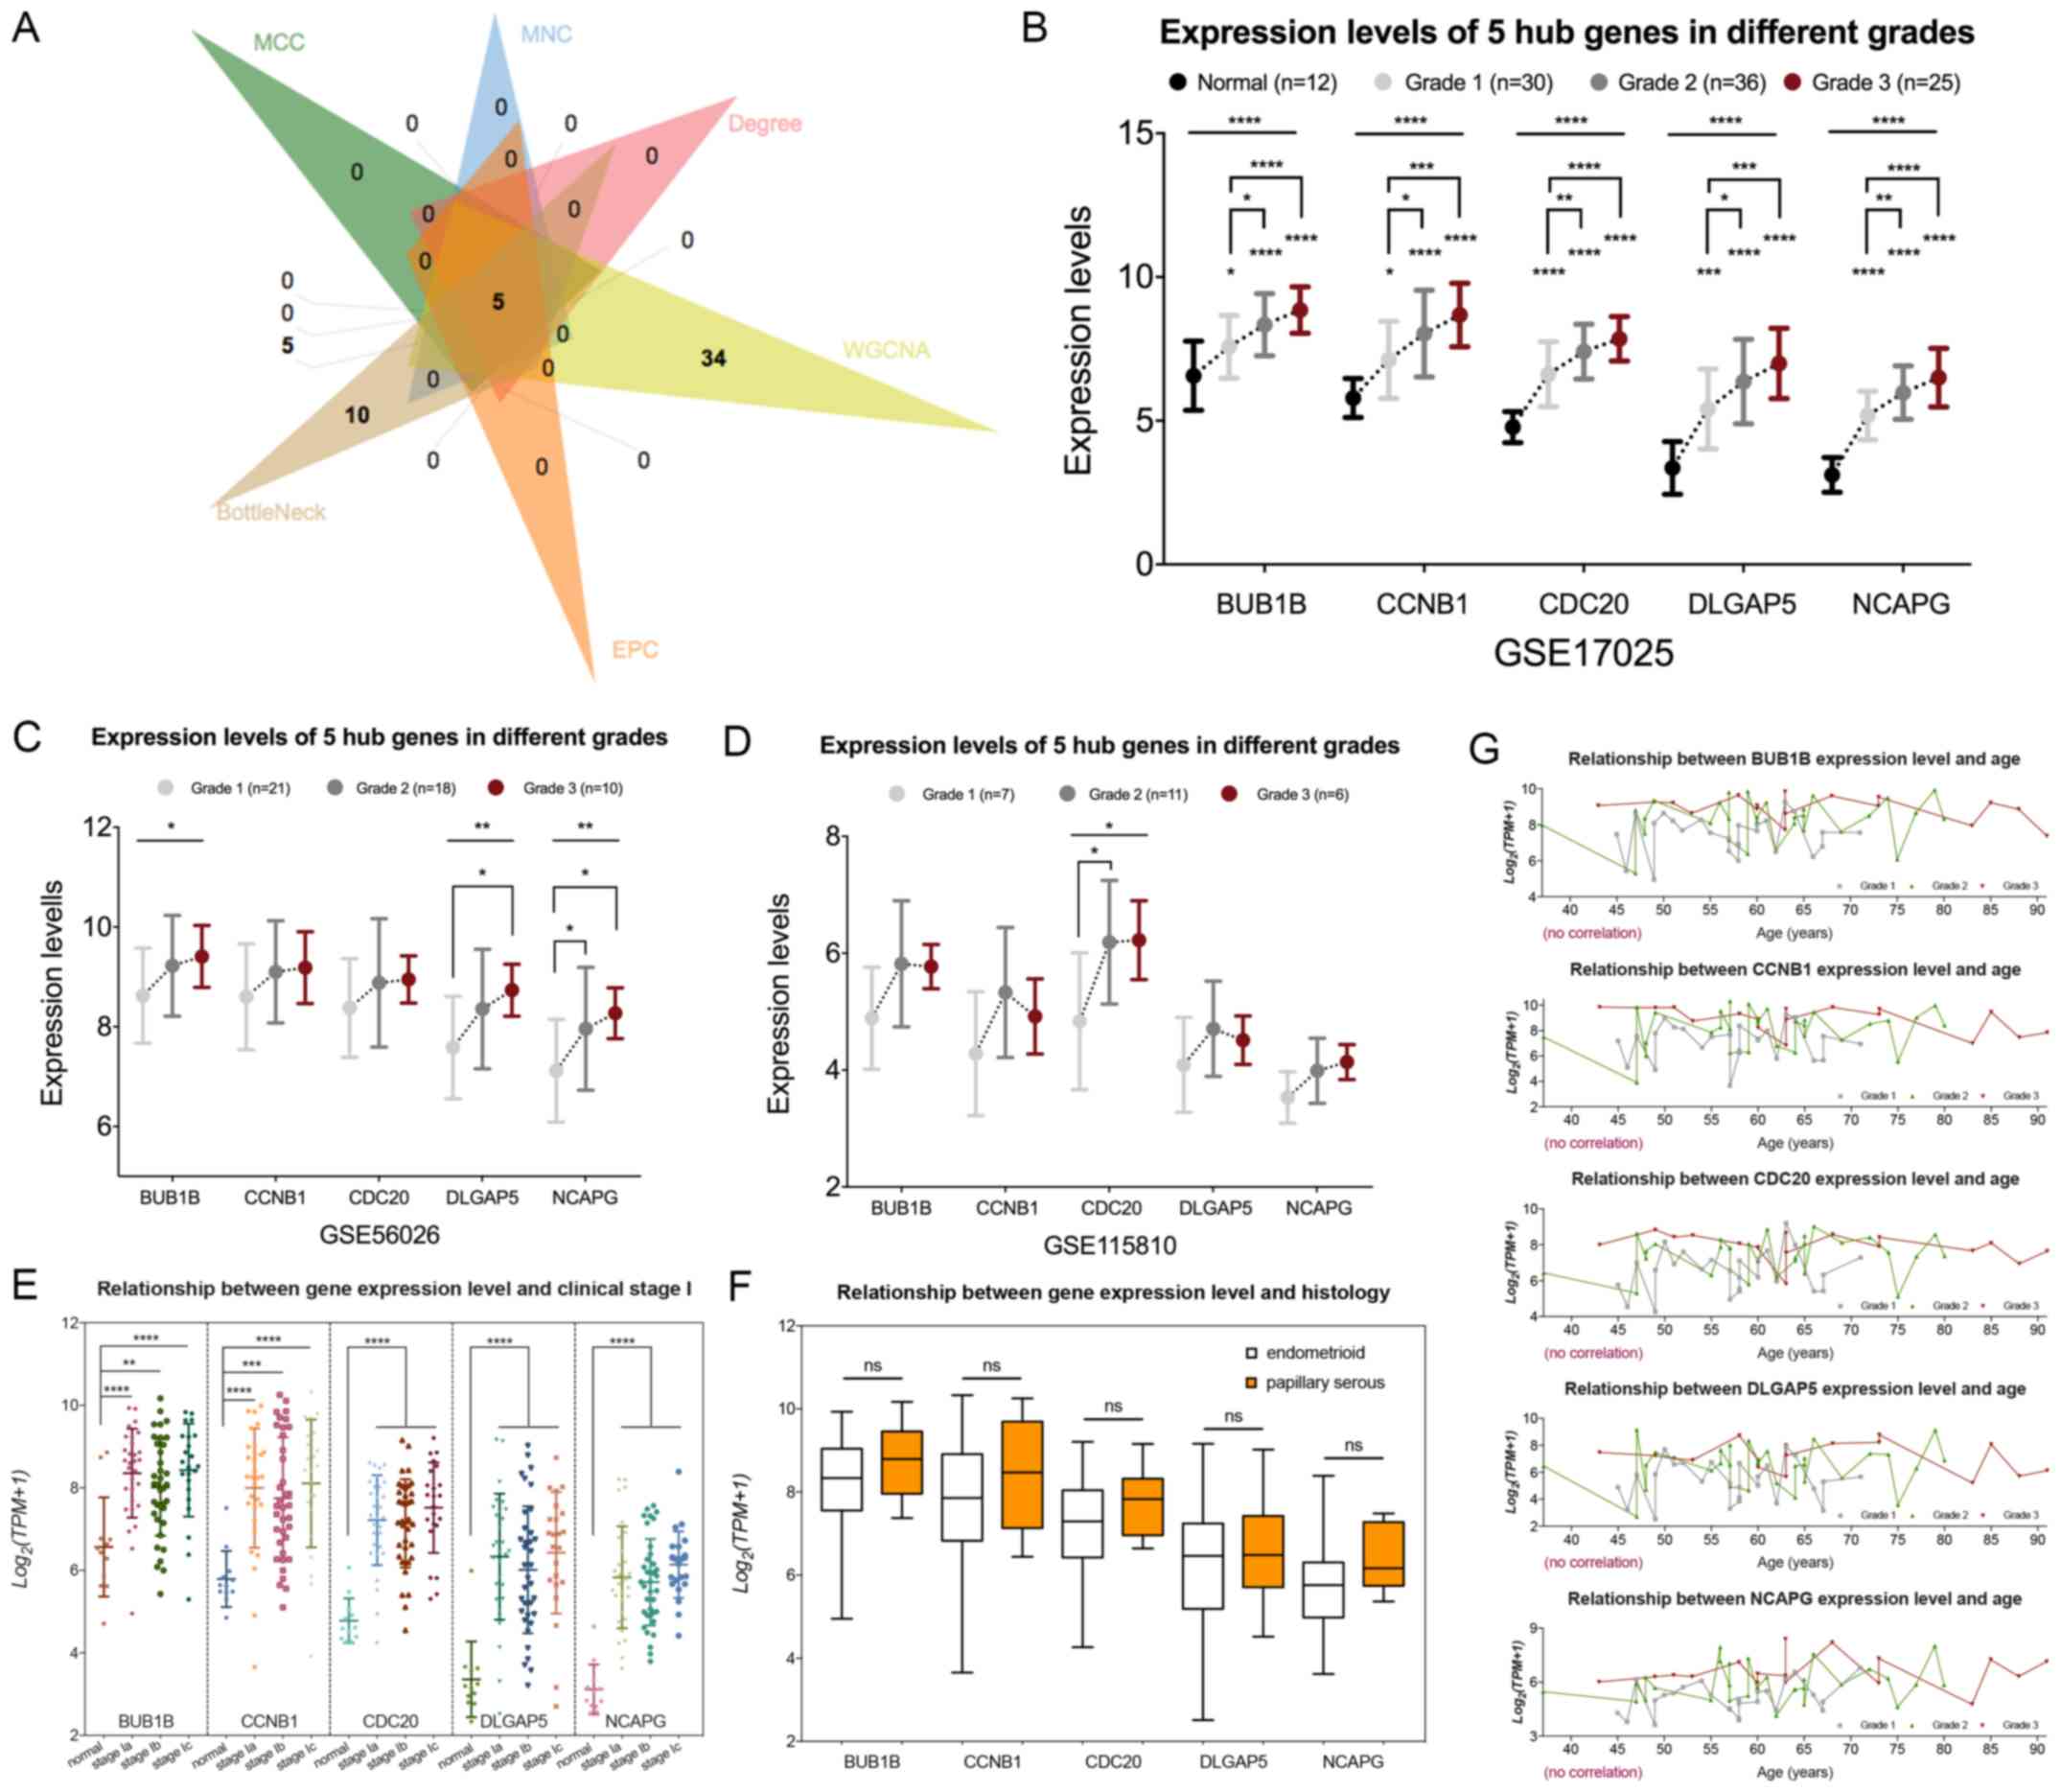 | Figure 5.Identification and validation of real
hub genes associated with tumor grades. (A) The five common hub
genes in both the co-expression network and protein-protein
interaction network were regarded as real hub genes. (B) Expression
levels of the five hub genes in 103 samples with different grades.
(C) Expression levels of the five hub genes in the GSE56026 dataset
with different grades. (D) Expression levels of the five hub genes
in the GSE115810 dataset with different grades. (E) Five genes were
expressed at a significantly higher in stage Ia, Ib and Ic compared
with those in normal tissues; however, there was no significant
difference in their expression among the stage Ia, Ib and Ic EC
samples. (F) There was no significant difference in gene expression
levels between endometrioid EC and papillary serous EC. (G) There
was no correlation between gene expression levels and age of
patients. *P<0.05; **P<0.01; ***P<0.001; ****P<0.0001.
EC, endometrial carcinoma; MCC, maximal clique centrality; MNC,
maximum neighborhood component; EPC, edge percolated component; BN,
bottleneck; BUB1B, BUB1 mitotic checkpoint serine/threonine kinase
B; CCNB1, cyclin B1; CDC20, cell-division cycle protein 20; DLGAP5,
DLG-associated protein 5; NCAPG, non-SMC condensing I complex
subunit; ns, not significant; WCGNA, weighted gene co-expression
network analysis. |
Validation of hub gene expression
levels
Subsequently, the five real hub genes were subjected
to validation analysis. To do so, the expression levels of the five
genes were first analyzed in the GSE17025 dataset. The results
demonstrated that all five genes were highly expressed in UCEC
tissues compared with normal tissues. In addition, patients who had
more advanced tumor grades exhibited significantly higher
expression levels of the five genes compared with patients with
lower grade tumors (Fig. 5B). In the
testing datasets GSE115810 and GSE56026, BUB1B, DLGAP5 and NCAPG
expression demonstrated significant association with tumor grade in
the GSE56026 dataset, while in the GSE115810 dataset, CDC20
exhibited a significant association with tumor grade (Fig. 5C and D). To further evaluate the
clinical significance of the five genes, the associations between
gene expression levels and clinical traits, including clinical
stage, histological diagnosis and age, were investigated using the
GSE17025 dataset. All five genes were expressed as at significantly
higher level in stages Ia, Ib and Ic compared with those in normal
tissues; however, no significant differences were observed in the
expression of these genes among stage Ia, Ib and Ic EC samples
(Fig. 5E). In terms of tumor
histology, there were no significant differences in gene expression
levels between endometrioid EC and papillary serous EC (Fig. 5F). In addition, the gene expression
levels were not correlated with the age of the patients (Fig. 5G).
Reactome pathway analysis for the hub
genes
The 5 hub genes identified in the aforementioned
step were also subjected to Reactome pathway analysis, which
revealed that BUB1B, CCNB1, CDC20 and NCAPG were involved in cell
cycle processes and particularly in the ‘mitotic prometaphase’
pathway. DLGAP5 was associated with the NOTCH3 intracellular
domain, a component of the Notch pathway involved in gene
transcription processes (Table II)
(49).
| Table II.Reactome pathways of 5 hub genes in
uterine corpus endometrial carcinoma. |
Table II.
Reactome pathways of 5 hub genes in
uterine corpus endometrial carcinoma.
| Pathway | Description | Enriched genes | P-value | FDR |
|---|
| R-HSA-68877 | Mitotic
Prometaphase | BUB1B, CCNB1,
CDC20, NCAPG |
1.62×10⁻⁶ |
6.94×10⁻⁵ |
| R-HSA-69278 | Cell Cycle,
Mitotic | BUB1B, CCNB1,
CDC20, NCAPG |
2.21×10⁻⁶ |
6.94×10⁻⁵ |
| R-HSA-1640170 | Cell Cycle | BUB1B, CCNB1,
CDC20, NCAPG |
5.33×10⁻⁶ |
6.94×10⁻⁵ |
| R-HSA-9013508 | NOTCH3
Intracellular Domain Regulates Transcription | DLGAP5 |
1.38×10⁻⁴ |
4.14×10⁻⁴ |
| R-HSA-9012852 | Signaling by
NOTCH3 | DLGPA5 |
4.20×10⁻⁴ | 0.001 |
Survival analysis based on TCGA
database
To validate the aforementioned results, TCGA RNA-seq
data for 546 UCEC samples and 35 normal endometrial tissue samples
were used for further analyses. The gene expression levels of the
five real hub genes were compared between normal endometrial tissue
and UCEC tissue. Consistent with results from GEO analysis, it was
identified that all real hub genes were expressed at a
significantly higher level in UCEC samples compared with those in
normal endometrial tissue samples (Fig.
6A-E). Subsequently, the best expression cut-off point for each
real hub gene was set and the 541 UCEC samples for which clinical
information was available were separated into two groups that
yielded maximal difference with regard to survival at the lowest
Renyi test P-value. BUB1B (P=0.0053), CCNB1 (P=0.0307), CDC20
(P=0.0011), DLGAP5 (P=0.0036) and NCAPG (P=0.0056) were
significantly associated with the OS rate of patients with UCEC,
suggesting that patients with UCEC with higher expression of the
five genes exhibited a poor prognosis (Fig. 6F-J).
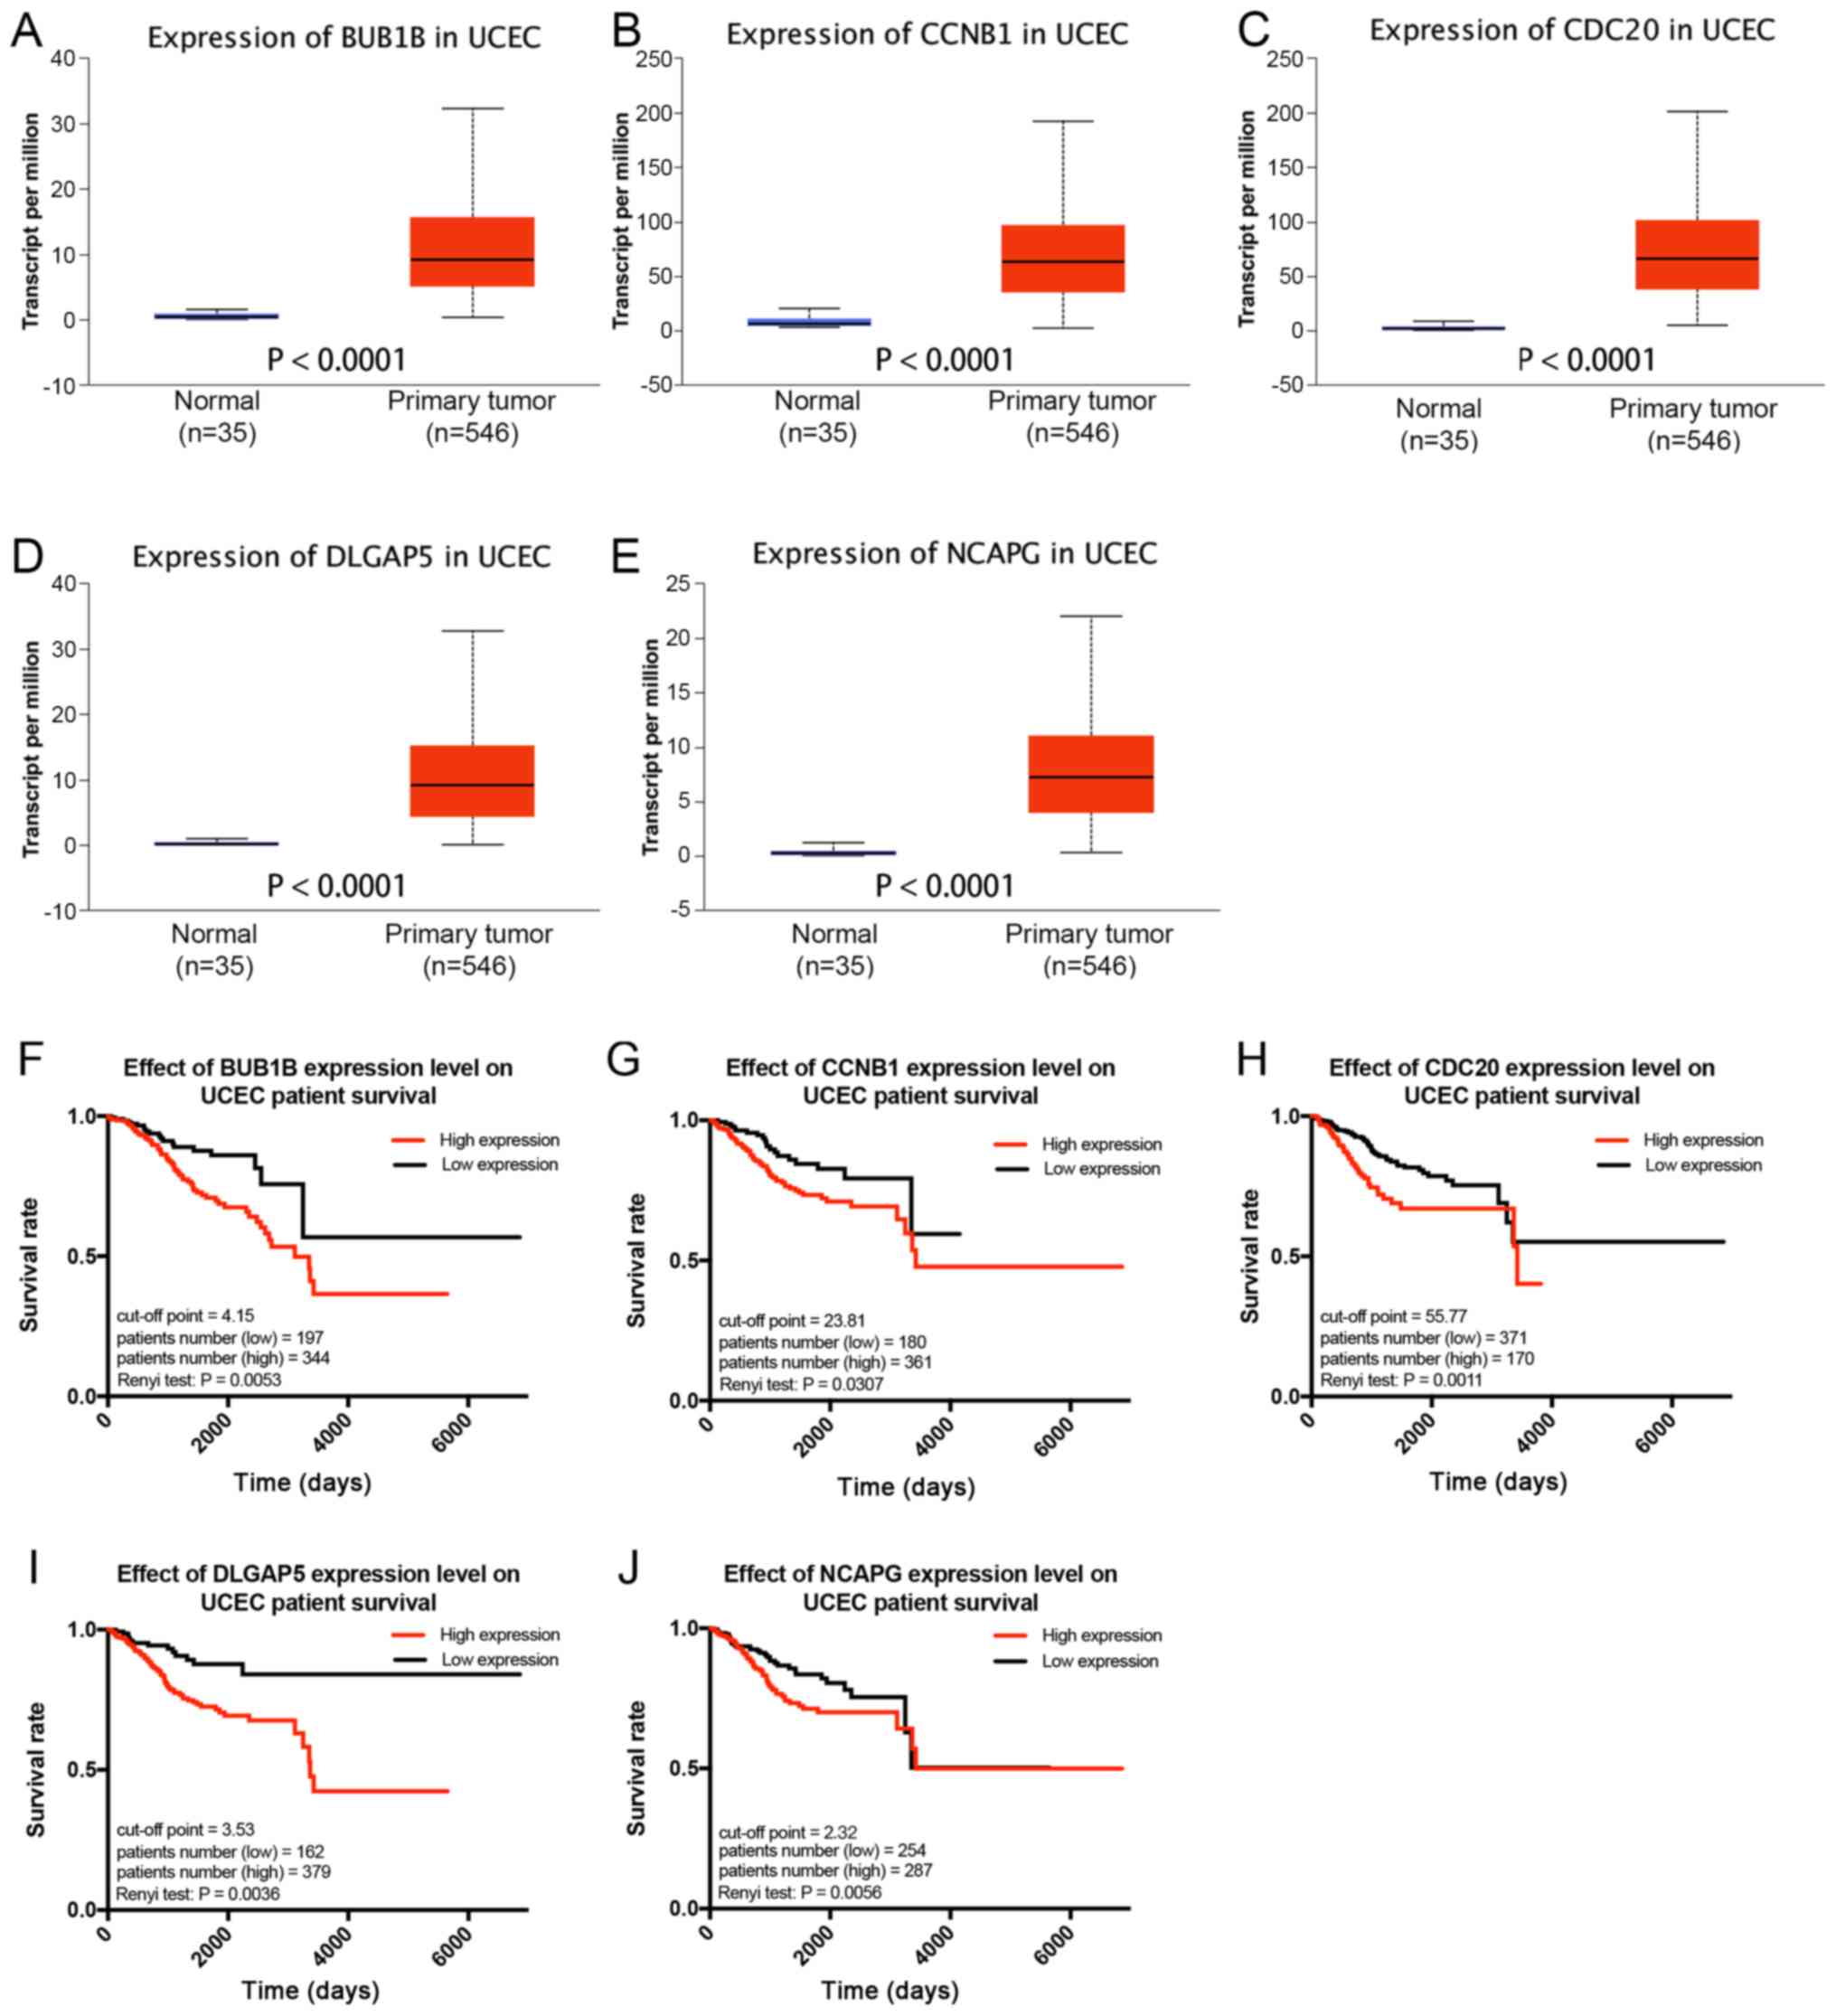 | Figure 6.Validation and survival analysis of
real hub genes in UCEC based on TCGA database. The mRNA expression
levels of (A) BUB1B, (B) CCNB1, (C) CDC20, (D) DLGAP5 and (E) NCAPG
were significantly higher in UCEC tissues compared with those in
normal tissues. Kaplan-Meier plots showing the association of (F)
BUB1B, (G) CCNB1, (H) CDC20, (I) DLGAP5 and (J) NCAPG expression
levels with the survival of 541 patients with UCEC, with the best
expression cut-off point according to the clinical data on TCGA.
BUB1B, BUB1 mitotic checkpoint serine/threonine kinase B; CCNB1,
cyclin B1; CDC20, cell-division cycle protein 20; DLGAP5,
DLG-associated protein 5; NCAPG, non-SMC condensing I complex
subunit; UCEC, uterine corpus endometrial carcinoma; TCGA, The
Cancer Genome Atlas. |
Verification of the expression of hub
genes at the protein level
To investigate the protein expression patterns of
the five hub genes in samples of patients with UCEC and further
interrogate the prognostic significance of these genes, the
expression levels of CCNB1, CDC20, DLGAP5 and NCAPG were analyzed
in The Human Protein Atlas database (Fig. 7). The expression level of BUB1B
protein was not analyzed as its information was not available in
The Human Protein Atlas database. In agreement with the earlier
analysis, this analysis revealed that the CCNB1, CDC20, DLGAP5 and
NCAPG proteins were expressed at higher levels in UCEC tissues
compared with those in normal tissues. Analysis of IHC images
revealed that CCNB1, CDC20, DLGAP5 and NCAPG proteins were
localized in the cytoplasm and cell surface membranes of UCEC
cells. Notably, CDC20 exhibited a strong nuclear localization. All
patient information obtained from The Human Protein Atlas database
is provided in Table III.
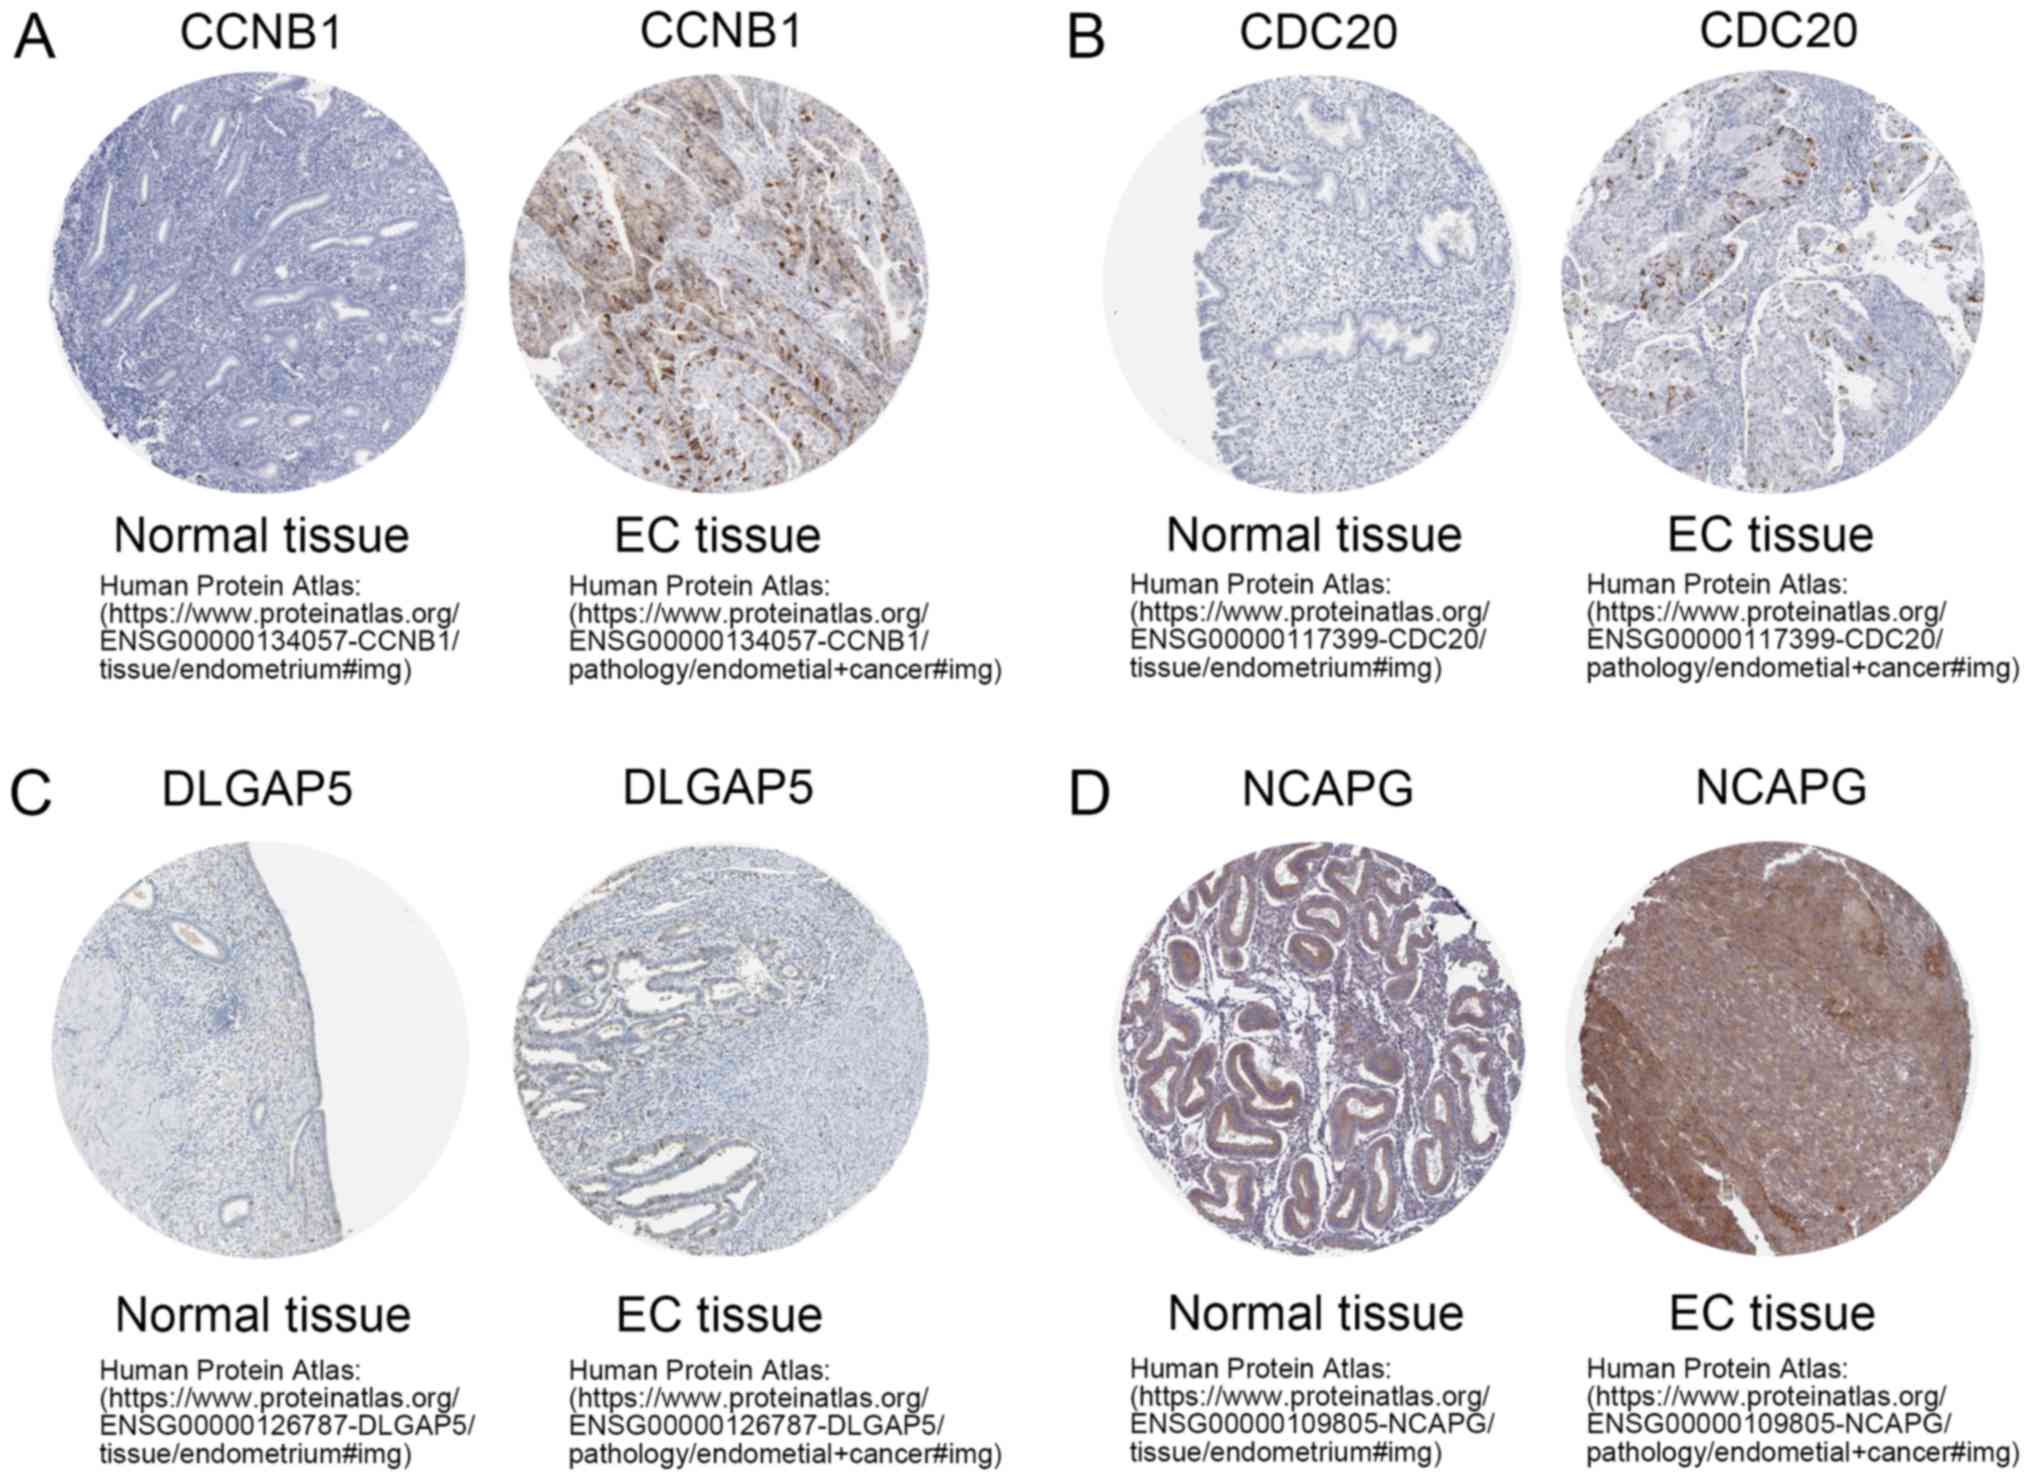 | Figure 7.Validation of protein expression
levels of CCNB1, CDC20, DLGAP5 and NCAPG. The (A) CCNB1, (B) CDC20,
(C) DLGAP5 and (D) NCAPG proteins were expressed at higher levels
in EC tissues compared with those in normal tissues, as revealed by
The Human Protein Atlas database (http://www.proteinatlas.org). CCNB1, cyclin B1;
CDC20, cell-division cycle protein 20; DLGAP5, DLG-associated
protein 5; NCAPG, non-SMC condensing I complex subunit; EC,
endometrial carcinoma. |
| Table III.Immunohistochemistry staining
characteristics of the hub genes from The Human Protein Atlas
database. |
Table III.
Immunohistochemistry staining
characteristics of the hub genes from The Human Protein Atlas
database.
| A, Normal
tissue |
|---|
|
|---|
| Gene | Patient ID | Sex | Age, years | Staining | Intensity | Quantity | Location |
|---|
| CCNB1 | 2361 | Female | 33 | Medium | Strong | Rare | Cytoplasmic
membranous |
| CDC20 | 2941 | Female | 33 | Medium | Strong | <25% | Nuclear |
| DLGAP5 | 1978 | Female | 72 | Low | Moderate | <25% | Cytoplasmic
membranous |
| NCAPG | 3313 | Female | 39 | Medium | Moderate | >75% | Cytoplasmic
membranous |
|
| B, Uterine
corpus endometrial carcinoma tissue |
| Gene | Patient
ID | Sex | Age,
years |
Staining |
Intensity |
Quantity |
Location |
|
| CCNB1 | 167 | Female | 75 | Medium | Moderate | >75% | Cytoplasmic
membranous |
| CDC20 | 1165 | Female | 75 | High | Strong | 75-25% | Cytoplasmic
membranous nuclear |
| DLGAP5 | 1750 | Female | 83 | Medium | Strong | <25% | Cytoplasmic
membranous |
| NCAPG | 3036 | Female | 32 | High | Strong | >75% | Cytoplasmic
membranous |
Discussion
UCEC and normal endometrial tissues exhibit a high
degree of genetic heterogeneity (6).
Although 75% of UCEC cases are diagnosed at stage I, a significant
subset of patients with UCEC are identified at a high-grade disease
stage (4). The current therapeutic
strategies for this condition do not effectively control
progression of UCEC (50). To
improve disease outcomes, novel therapeutic strategies with higher
specificity and efficacy are urgently needed, particularly for
high-grade UCEC. Previous studies have suggested that activated
leukocyte cell adhesion molecule and L1 cell adhesion molecule are
key players in the oncogenesis of early stage and moderately to
poorly differentiated UCEC, respectively (50,51). In
the present study, WGCNA revealed five tumor grade-related genes.
The association of these genes with UCEC was validated by
evaluating their mRNA and protein levels in UCEC samples. The
current results demonstrate that this group of tumor grade-related
genes plays a critical role in the development of UCEC. These genes
can be used to predict prognosis and are ideal therapeutic targets
in UCEC.
WGCNA has previously been employed to identify genes
associated with clinical features from various publicly available
databases. A previous study used this method to identify 5
EC-related modules and prioritize 11 aberrantly expressed genes,
and it was determined that only 6 genes had mutations with
relevance to EC (25). The present
study is more extensive than this previous study. First, the
associations between DEGs and tumor clinical features were
analyzed. This analysis uncovered the blue module, which was
significantly associated with high tumor grades, and 60 hub genes
were identified. Furthermore, MCC, MNC, degree, EPC and BN methods
of Cytoscapes's CytoHubba plug-in were employed to select
high-ranking genes in the blue module with the highest connectivity
scores from a PPI network of the 428 DEGs. This analysis produced
five overlapping hub genes in the co-expression network and PPI
network. These five candidates were found to be strongly associated
with higher tumor grades. Survival analysis revealed that high
expression of these genes predicted a poor OS rate in UCEC. Further
analysis demonstrated that mRNA expression levels of these genes
were in line with the results obtained from the gene co-expression
analysis. Although the expression level of BUB1B protein was not
available in The Human Protein Atlas database, the other four genes
were found to be upregulated in UCEC tissues. However, the
underlying mechanisms explaining how these genes impact the
progression and prognosis of UCEC remain unknown.
BUB1B has been reported to serve an important role
in the mitotic checkpoint (52).
However, it is currently unknown how its aberrant expression
impacts tumorigenesis. Overexpression of BUB1B has been
demonstrated to be strongly associated with advanced tumor stage,
poor OS rate and high tumor recurrence rate in various tumors,
including pancreatic ductal adenocarcinoma, gastric cancer, bladder
cancer and liver cancer (53–56). An
in vitro study on verteporfin-treated type 1 EC cell lines
(HEC-1-B cells) demonstrated that BUB1B regulates the progression
of the mitotic checkpoint (57). By
contrast, lower levels of BUB1B have been associated with a poor OS
rate in colon adenocarcinoma (52).
CDC20, in cooperation with other factors, has been
reported to be an important modulator of the cell cycle and is
associated with advanced tumor stages and higher grades in multiple
cancer types, including pancreatic (58), breast (59) and colorectal cancer (60). A previous study suggested that low
CDC20 expression is associated with an improved OS rate and that
knockdown of CDC20 expression suppresses proliferation of EC cells
(61).
The present study identified several genes,
including BUB1B and CDC20, that when upregulated, were associated
with poor OS in UCEC. Functional enrichment analysis results
demonstrated that these genes are mainly involved in the mitotic
prometaphase pathway during the M phase of the cell cycle. Taken
together, these observations point to a potential prognostic value
for BUB1B and CDC20 in UCEC.
The current study also revealed that CCNB1 could be
a potential prognostic biomarker for UCEC. The CCNB1 gene encodes
an important regulator of the cell cycle and is associated with
cyclin-dependent kinase 1, and it is also known to regulate the
G2/M transition during mitosis (62). It has been previously reported that
CCNB1 expression is associated with poorly differentiated EC
(7). Integrated bioinformatics
analysis methods were used to examine TCGA and GEO datasets
(26). This led to the
identification of 11 hub genes that are closely associated with EC
tumorigenesis, including CCNB1 (26). Several reports have indicated that
CCNB1 serves as a tumor antigen in cancer immunotherapy (62,63). In
hepatocellular carcinoma (HCC), CCNB1 regulates tumorigenesis and
predicts the prognosis of the disease (63). However, the role of CCNB1 in UCEC has
not been sufficiently investigated.
NCAPG participates in the condensation and
stabilization of chromosomes during cell division (64). To the best of our knowledge, this
gene has also not previously been characterized in UCEC.
Overexpression of NCAPG has been shown to be correlated with that
of CCNB1 (65). NCAPG silencing
induces HCC cell entry into mitosis leading to inhibition of cell
growth and proliferation both in vitro and in vivo
(65). In patients with HCC, high
expression of NCAPG is associated with poor OS and high recurrence
rates (65). The present functional
enrichment analyses revealed that CCNB1 and NCAPG are upregulated
in UCEC and are involved in cell cycle-related pathways. Taken
together, these data suggest that CCNB1 and NCAPG are promising
prognostic and therapeutic targets in UCEC.
In the current analysis, DLGAP5 was identified as a
hub gene associated with higher tumor grade in UCEC. This gene has
previously been shown to play a crucial role in the G2/M
transition in the cell cycle (66).
The role of DLGAP5 in UCEC has previously been investigated. Using
bioinformatics, DLGAP5 was reported to be among the 11 EC
tumorigenic and prognostic genes (25). In this previous study, it was
reported that DLGAP5 expression in EC tissues predicts a poor OS
rate, which agrees with the present findings. In addition, aberrant
expression of DLGAP5 was found to be correlated with higher tumor
grades in UCEC as revealed by co-expression network and PPI network
analysis (25). The present study
also identified that DLGAP5 is associated with the NOTCH3
intracellular domain, which regulates gene transcription (49). While, to the best of our knowledge,
only a few studies have investigated the molecular mechanisms of
DLGAP5 in EC, DLGAP5 has been studied extensively in other cancer
types. It has been reported that, as a NOTCH3 target gene, DLGAP5
silencing inhibits tumorigenicity and proliferation of cancer cells
by arresting the cell cycle in the G2/M phase in ovarian
cancer (49). Another study
suggested that DLGAP5 is associated with aggressive colorectal
cancer, and its overexpression predicted a poor OS rate in the
lower crypt-like subtype of colorectal cancer (66). In summary, the present findings and
previous studies suggest that DLGAP5 may be a potential prognostic
biomarker of UCEC.
The present study has several innovative aspects. To
the best of our knowledge, this is the first report that has
investigated the associations between DEGs and clinical features of
UCEC cases. Furthermore, three gene expression microarray datasets
from the GEO database and one RNA-seq dataset from TCGA database
were combined to comprehensively identify DEGs that are relevant to
the progression and prognosis of UCEC. Indeed, the selection of
samples was crucial to the present analysis. A small sample size
and the absence of the normal group could have an effect on
obtaining reliable DEGs. The GSE17025 dataset consisted of 91 EC
samples and 12 normal endometrium samples. However, the GSE56026
dataset did not contain normal endometrium samples, and the
GSE115810 dataset contained only three normal samples. WGCNA
requires a sample size of at least 15 for each group. Among the 91
EC samples in the GSE17025 dataset, there were 30 grade I samples,
36 grade II samples and 25 grade III samples. In addition, TCGA
UCEC data contained more complete clinical information on the
patients with UCEC, such as survival time and survival status,
which were of great importance for the OS analysis in the study. In
addition, survival data of patients with UCEC were missing from the
GSE17025 dataset. Therefore, after comprehensive consideration, it
was considered that the GSE17025 dataset was more suitable to be
analyzed as a training dataset, whereas the other two gene
expression microarray datasets were more suitable as testing
datasets, and TCGA data was used for the OS analysis to evaluate
the hub genes. Furthermore, two functional enrichment analysis
databases and five methods in Cytoscape's CytoHubba plug-in were
co-utilized to rigorously screen for tumor grade-related hub genes.
A limitation of the present approach is that the precise molecular
mechanism by which these tumor grade-related genes impact the
progression and prognosis of UCEC could not be determined.
In conclusion, WGCNA revealed five tumor
grade-related genes from 1,447 DEGs between UCEC tissues and normal
endometrial tissues. The tumorigenic role of these hub genes was
validated at the RNA and protein levels. High expression of the
five hub genes was associated with poor OS rate. Furthermore, these
genes demonstrated potential to predict the prognosis of UCEC and
may be therapeutic targets in this type of cancer. Further
experimental studies are required to experimentally validate these
findings.
Acknowledgements
The results published in the present study are in
whole or part based upon data generated by The Cancer Genome Atlas
Research Network (https://www.cancer.gov/tcga), the Gene Expression
Omnibus database (http://www.ncbi.nlm.nih.gov/geo/) and The Human
Protein Atlas database (http://www.proteinatlas.org).
Funding
No funding was received.
Availability of data and materials
The datasets generated and/or analyzed during the
present study are available in the Gene Expression Omnibus database
(GSE17025, GSE56026 and GSE115810; http://www.ncbi.nlm.nih.gov/geo/), The Cancer Genome
Atlas database (UCEC RNA-sequencing; http://www.cancer.gov/tcga) and The Human Protein
Atlas database (http://www.proteinatlas.org).
Authors' contributions
JB and YX designed the study. YX and FW downloaded
all datasets used in the current study and analyzed the
differentially expressed genes between UCEC and normal endometrial
tissues. QP and YL participated in the interpretation of the data,
prepared the figures and revised the manuscript. JB and YX drafted
the manuscript and revised the manuscript. All authors contributed
to manuscript writing. All authors read and approved the final
manuscript.
Ethics approval and consent to
participate
Not applicable.
Patient consent for publication
Not applicable.
Competing interests
The authors declare that they have no competing
interests.
References
|
1
|
Siegel RL, Miller KD and Jemal A: Cancer
statistics, 2018. CA Cancer J Clin. 68:7–30. 2018. View Article : Google Scholar : PubMed/NCBI
|
|
2
|
Pecorelli S: Revised FIGO staging for
carcinoma of the vulva, cervix, and endometrium. Int J Gynaecol
Obstet. 105:103–104. 2009. View Article : Google Scholar : PubMed/NCBI
|
|
3
|
Murali R, Soslow RA and Weigelt B:
Classification of endometrial carcinoma: More than two types.
Lancet Oncol. 15:e268–e278. 2014. View Article : Google Scholar : PubMed/NCBI
|
|
4
|
Creasman WT, Odicino F, Maisonneuve P,
Quinn MA, Beller U, Benedet JL, Heintz AP, Ngan HY and Pecorelli S:
Carcinoma of the corpus uteri. FIGO 26th Annual report on the
results of treatment in gynecological cancer. Int J Gynaecol
Obstet. 95 (Suppl 1):S105–S143. 2006. View Article : Google Scholar
|
|
5
|
Colombo N, Creutzberg C, Amant F, Bosse T,
González-Martín A, Ledermann J, Marth C, Nout R, Querleu D, Mirza
MR, et al: ESMO-ESGO-ESTRO consensus conference on endometrial
cancer: Diagnosis, treatment and follow-up. Radiother Oncol.
117:559–581. 2015. View Article : Google Scholar : PubMed/NCBI
|
|
6
|
Morice P, Leary A, Creutzberg C,
Abu-Rustum N and Darai E: Endometrial cancer. Lancet.
387:1094–1108. 2016. View Article : Google Scholar : PubMed/NCBI
|
|
7
|
Zang Y, Dong M, Zhang K, Tian W, Wang Y
and Xue F: Bioinformatics analysis of key differentially expressed
genes in well and poorly differentiated endometrial carcinoma. Mol
Med Rep. 18:467–476. 2018.PubMed/NCBI
|
|
8
|
Kaloglu S, Guraslan H, Tekirdag AI,
Dagdeviren H and Kaya C: Relation of preoperative thrombocytosis
between tumor stage and grade in patients with endometrial cancer.
Eurasian J Med. 46:164–168. 2014. View Article : Google Scholar : PubMed/NCBI
|
|
9
|
Kong A, Johnson N, Kitchener HC and Lawrie
TA: Adjuvant radiotherapy for stage I endometrial cancer: An
updated Cochrane systematic review and meta-analysis. J Natl Cancer
Inst. 104:1625–1634. 2012. View Article : Google Scholar : PubMed/NCBI
|
|
10
|
Susumu N, Sagae S, Udagawa Y, Niwa K,
Kuramoto H, Satoh S and Kudo R; Japanese Gynecologic Oncology
Group, : Randomized phase III trial of pelvic radiotherapy versus
cisplatin-based combined chemotherapy in patients with
intermediate- and high-risk endometrial cancer: A Japanese
Gynecologic Oncology Group study. Gynecol Oncol. 108:226–233. 2008.
View Article : Google Scholar : PubMed/NCBI
|
|
11
|
Bradford LS, Rauh-Hain JA, Schorge J,
Birrer MJ and Dizon DS: Advances in the management of recurrent
endometrial cancer. Am J Clin Oncol. 38:206–212. 2015. View Article : Google Scholar : PubMed/NCBI
|
|
12
|
Tsoref D, Welch S, Lau S, Biagi J, Tonkin
K, Martin LA, Ellard S, Ghatage P, Elit L, Mackay HJ, et al: Phase
II study of oral ridaforolimus in women with recurrent or
metastatic endometrial cancer. Gynecol Oncol. 135:184–189. 2014.
View Article : Google Scholar : PubMed/NCBI
|
|
13
|
Oza AM, Pignata S, Poveda A, McCormack M,
Clamp A, Schwartz B, Cheng J, Li X, Campbell K, Dodion P and
Haluska FG: Randomized phase II trial of ridaforolimus in advanced
endometrial carcinoma. J Clin Oncol. 33:3576–3582. 2015. View Article : Google Scholar : PubMed/NCBI
|
|
14
|
Matulonis U, Vergote I, Backes F, Martin
LP, McMeekin S, Birrer M, Campana F, Xu Y, Egile C and Ghamande S:
Phase II study of the PI3K inhibitor pilaralisib (SAR245408; XL147)
in patients with advanced or recurrent endometrial carcinoma.
Gynecol Oncol. 136:246–253. 2015. View Article : Google Scholar : PubMed/NCBI
|
|
15
|
Powell MA, Sill MW, Goodfellow PJ,
Benbrook DM, Lankes HA, Leslie KK, Jeske Y, Mannel RS, Spillman MA,
Lee PS, et al: A phase II trial of brivanib in recurrent or
persistent endometrial cancer: An NRG Oncology/Gynecologic Oncology
Group Study. Gynecol Oncol. 135:38–43. 2014. View Article : Google Scholar : PubMed/NCBI
|
|
16
|
Lee PS and Secord AA: Targeting molecular
pathways in endometrial cancer: A focus on the FGFR pathway. Cancer
Treat Rev. 40:507–512. 2014. View Article : Google Scholar : PubMed/NCBI
|
|
17
|
Forster MD, Dedes KJ, Sandhu S, Frentzas
S, Kristeleit R, Ashworth A, Poole CJ, Weigelt B, Kaye SB and
Molife LR: Treatment with olaparib in a patient with PTEN-deficient
endometrioid endometrial cancer. Nat Rev Clin Oncol. 8:302–306.
2011. View Article : Google Scholar : PubMed/NCBI
|
|
18
|
Howitt BE, Shukla SA, Sholl LM,
Ritterhouse LL, Watkins JC, Rodig S, Stover E, Strickland KC,
D'Andrea AD, Wu CJ, et al: Association of polymerase e-Mutated and
microsatellite-instable endometrial cancers with neoantigen load,
number of tumor-infiltrating lymphocytes, and expression of PD-1
and PD-L1. JAMA Oncol. 1:1319–1323. 2015. View Article : Google Scholar : PubMed/NCBI
|
|
19
|
Duran-Sanchon S, Moreno L, Augé JM,
Serra-Burriel M, Cuatrecasas M, Moreira L, Martín A, Serradesanferm
A, Pozo À, Costa R, et al: Identification and validation of
microRNA profiles in fecal samples for detection of colorectal
cancer. Gastroenterology. 158:947–957.e4. 2020. View Article : Google Scholar : PubMed/NCBI
|
|
20
|
Polano M, Chierici M, Dal Bo M, Gentilini
D, Cintio FD, Baboci L, GibbsD L, Furlanello C and Toffoli G: A
Pan-cancer approach to predict responsiveness to immune checkpoint
inhibitors by machine learning. Cancers (Basel). 11:15622019.
View Article : Google Scholar
|
|
21
|
Zhang K, Li H, Yan Y, Zang Y, Li K, Wang Y
and Xue F: Identification of key genes and pathways between type I
and type II endometrial cancer using bioinformatics analysis. Oncol
Lett. 18:2464–2476. 2019.PubMed/NCBI
|
|
22
|
Chou WC, Cheng AL, Brotto M and Chuang CY:
Visual gene-network analysis reveals the cancer gene co-expression
in human endometrial cancer. BMC Genomics. 15:3002014. View Article : Google Scholar : PubMed/NCBI
|
|
23
|
Huo X, Sun H, Liu Q, Ma X, Peng P, Yu M,
Zhang Y, Cao D and Shen K: Clinical and expression significance of
AKT1 by Co-expression network analysis in endometrial cancer. Front
Oncol. 9:11472019. View Article : Google Scholar : PubMed/NCBI
|
|
24
|
Liu Y, Nan F, Lu K and Wang Y, Liu Y, Wei
S, Wu R and Wang Y: Identification of key genes in endometrioid
endometrial adenocarcinoma via TCGA database. Cancer Biomark.
21:11–21. 2017. View Article : Google Scholar : PubMed/NCBI
|
|
25
|
Liu J, Zhou S, Li S, Jiang Y, Wan Y, Ma X
and Cheng W: Eleven genes associated with progression and prognosis
of endometrial cancer (EC) identified by comprehensive
bioinformatics analysis. Cancer Cell Int. 19:1362019. View Article : Google Scholar : PubMed/NCBI
|
|
26
|
Liu L, Lin J and He H: Identification of
potential crucial genes associated with the pathogenesis and
prognosis of endometrial cancer. Front Genet. 10:3732019.
View Article : Google Scholar : PubMed/NCBI
|
|
27
|
Langfelder P and Horvath S: WGCNA: An R
package for weighted correlation network analysis. BMC
Bioinformatics. 9:5592008. View Article : Google Scholar : PubMed/NCBI
|
|
28
|
Chen L, Yuan L, Qian K, Qian G, Zhu Y, Wu
CL, Dan HC, Xiao Y and Wang X: Identification of biomarkers
associated with pathological stage and prognosis of clear cell
renal cell carcinoma by Co-expression network analysis. Front
Physiol. 9:3992018. View Article : Google Scholar : PubMed/NCBI
|
|
29
|
Guo X, Xiao H, Guo S, Dong L and Chen J:
Identification of breast cancer mechanism based on weighted gene
coexpression network analysis. Cancer Gene Ther. 24:333–341. 2017.
View Article : Google Scholar : PubMed/NCBI
|
|
30
|
Zhou XG, Huang XL, Liang SY, Tang SM, Wu
SK, Huang TT, Mo ZN and Wang QY: Identifying miRNA and gene modules
of colon cancer associated with pathological stage by weighted gene
Co-expression network analysis. Onco Targets Ther. 11:2815–2830.
2018. View Article : Google Scholar : PubMed/NCBI
|
|
31
|
Day RS, McDade KK, Chandran UR, Lisovich
A, Conrads TP, Hood BL, Kolli VS, Kirchner D, Litzi T and Maxwell
GL: Identifier mapping performance for integrating transcriptomics
and proteomics experimental results. BMC Bioinformatics.
12:2132011. View Article : Google Scholar : PubMed/NCBI
|
|
32
|
Kharma B, Baba T, Matsumura N, Kang HS,
Hamanishi J, Murakami R, McConechy MM, Leung S, Yamaguchi K, Hosoe
Y, et al: STAT1 drives tumor progression in serous papillary
endometrial cancer. Cancer Res. 74:6519–6530. 2014. View Article : Google Scholar : PubMed/NCBI
|
|
33
|
Hermyt E, Zmarzly N, Grabarek B,
Kruszniewska-Rajs C, Gola J, Jęda-Golonka A, Szczepanek K, Mazurek
U and Witek A: Interplay between miRNAs and Genes Associated with
Cell Proliferation in Endometrial Cancer. Int J Mol Sci.
20:60112019. View Article : Google Scholar
|
|
34
|
Gautier L, Cope L, Bolstad BM and Irizarry
RA: Affy-analysis of Affymetrix GeneChip data at the probe level.
Bioinformatics. 20:307–315. 2004. View Article : Google Scholar : PubMed/NCBI
|
|
35
|
Stafford P: Methods in microarray
normalization. CRC Press. (Boca Raton). 2008. View Article : Google Scholar
|
|
36
|
Irizarry RA, Hobbs B, Collin F,
Beazer-Barclay YD, Antonellis KJ, Scherf U and Speed TP:
Exploration, normalization, and summaries of high density
oligonucleotide array probe level data. Biostatistics. 4:249–264.
2003. View Article : Google Scholar : PubMed/NCBI
|
|
37
|
Ritchie ME, Phipson B, Wu D, Hu Y, Law CW,
Shi W and Smyth GK: Limma powers differential expression analyses
for RNA-sequencing and microarray studies. Nucleic Acids Res.
43:e472015. View Article : Google Scholar : PubMed/NCBI
|
|
38
|
Zhang B and Horvath S: A general framework
for weighted gene Co-expression network analysis. Stat Appl Genet
Mol Biol. 4:Article 17. 2005. View Article : Google Scholar : PubMed/NCBI
|
|
39
|
Yip AM and Horvath S: Gene network
interconnectedness and the generalized topological overlap measure.
BMC Bioinformatics. 8:222007. View Article : Google Scholar : PubMed/NCBI
|
|
40
|
Ravasz E, Somera AL, Mongru DA, Oltvai ZN
and Barabási AL: Hierarchical organization of modularity in
metabolic networks. Science. 297:1551–1555. 2002. View Article : Google Scholar : PubMed/NCBI
|
|
41
|
Yu G, Wang LG, Han Y and He QY:
clusterProfiler: An R package for comparing biological themes among
gene clusters. OMICS. 16:284–287. 2012. View Article : Google Scholar : PubMed/NCBI
|
|
42
|
Fabregat A, Sidiropoulos K, Viteri G,
Forner O, Marin-Garcia P, Arnau V, D'Eustachio P, Stein L and
Hermjakob H: Reactome pathway analysis: A high-performance
in-memory approach. BMC Bioinformatics. 18:1422017. View Article : Google Scholar : PubMed/NCBI
|
|
43
|
Jupe S, Ray K, Roca CD, Varusai T,
Shamovsky V, Stein L, D'Eustachio P and Hermjakob H: Interleukins
and their signaling pathways in the Reactome biological pathway
database. J Allergy Clin Immunol. 141:1411–1416. 2018. View Article : Google Scholar : PubMed/NCBI
|
|
44
|
Szklarczyk D, Gable AL, Lyon D, Junge A,
Wyder S, Huerta-Cepas J, Simonovic M, Doncheva NT, Morris JH, Bork
P, et al: STRING v11: Protein-protein association networks with
increased coverage, supporting functional discovery in genome-wide
experimental datasets. Nucleic Acids Res. 47:D607–D613. 2019.
View Article : Google Scholar : PubMed/NCBI
|
|
45
|
Killcoyne S, Carter GW, Smith J and Boyle
J: Cytoscape: A community -based framework for network modeling.
Methods Mol Biol. 563:219–239. 2009. View Article : Google Scholar : PubMed/NCBI
|
|
46
|
Chin CH, Chen SH, Wu HH, Ho CW, Ko MT and
Lin CY: CytoHubba: Identifying hub objects and sub-networks from
complex interactome. BMC Syst Biol. 8 (Suppl 4):S112014. View Article : Google Scholar : PubMed/NCBI
|
|
47
|
Uhlén M, Fagerberg L, Hallström BM,
Lindskog C, Oksvold P, Mardinoglu A, Sivertsson Å, Kampf C,
Sjöstedt E, Asplund A, et al: Proteomics. Tissue-based map of the
human proteome. Science. 347:12604192015. View Article : Google Scholar : PubMed/NCBI
|
|
48
|
Li C: Doubly robust weighted log-rank
tests and Renyi-type tests under non-random treatment assignment
and dependent censoring. Stat Methods Med Res. 28:2649–2664. 2019.
View Article : Google Scholar : PubMed/NCBI
|
|
49
|
Chen X, Thiaville MM, Chen L, Stoeck A,
Xuan J, Gao M, Shih IeM and Wang TL: Defining NOTCH3 target genes
in ovarian cancer. Cancer Res. 72:2294–2303. 2012. View Article : Google Scholar : PubMed/NCBI
|
|
50
|
Devis L, Moiola CP, Masia N,
Martinez-Garcia E, Santacana M, Stirbat TV, Brochard-Wyart F,
García Á, Alameda F, Cabrera S, et al: Activated leukocyte cell
adhesion molecule (ALCAM) is a marker of recurrence and promotes
cell migration, invasion, and metastasis in early-stage
endometrioid endometrial cancer. J Pathol. 241:475–487. 2017.
View Article : Google Scholar : PubMed/NCBI
|
|
51
|
Klat J, Mladenka A, Dvorackova J, Bajsova
S and Simetka O: L1CAM as a negative prognostic factor in
endometrioid endometrial adenocarcinoma FIGO Stage IA-IB.
Anticancer Res. 39:421–424. 2019. View Article : Google Scholar : PubMed/NCBI
|
|
52
|
Shichiri M, Yoshinaga K, Hisatomi H,
Sugihara K and Hirata Y: Genetic and epigenetic inactivation of
mitotic checkpoint genes hBUB1 and hBUBR1 and their relationship to
survival. Cancer Res. 62:13–17. 2002.PubMed/NCBI
|
|
53
|
Dong S, Huang F, Zhang H and Chen Q:
Overexpression of BUB1B, CCNA2, CDC20, and CDK1 in tumor tissues
predicts poor survival in pancreatic ductal adenocarcinoma. Biosci
Rep. 39:BSR201823062019. View Article : Google Scholar : PubMed/NCBI
|
|
54
|
Ando K, Kakeji Y, Kitao H, Iimori M, Zhao
Y, Yoshida R, Oki E, Yoshinaga K, Matumoto T, Morita M, et al: High
expression of BUBR1 is one of the factors for inducing DNA
aneuploidy and progression in gastric cancer. Cancer Sci.
101:639–645. 2010. View Article : Google Scholar : PubMed/NCBI
|
|
55
|
Yamamoto Y, Matsuyama H, Chochi Y, Okuda
M, Kawauchi S, Inoue R, Furuya T, Oga A, Naito K and Sasaki K:
Overexpression of BUBR1 is associated with chromosomal instability
in bladder cancer. Cancer Genet Cytogenet. 174:42–47. 2007.
View Article : Google Scholar : PubMed/NCBI
|
|
56
|
Liu AW, Cai J, Zhao XL, Xu AM, Fu HQ, Nian
H and Zhang SH: The clinicopathological significance of BUBR1
overexpression in hepatocellular carcinoma. J Clin Pathol.
62:1003–1008. 2009. View Article : Google Scholar : PubMed/NCBI
|
|
57
|
Bang LG, Dasari VR, Kim D and Gogoi RP:
Differential gene expression induced by Verteporfin in endometrial
cancer cells. Sci Rep. 9:38392019. View Article : Google Scholar : PubMed/NCBI
|
|
58
|
Chang DZ, Ma Y, Ji B, Liu Y, Hwu P,
Abbruzzese JL, Logsdon C and Wang H: Increased CDC20 expression is
associated with pancreatic ductal adenocarcinoma differentiation
and progression. J Hematol Oncol. 5:152012. View Article : Google Scholar : PubMed/NCBI
|
|
59
|
Yuan B, Xu Y, Woo JH, Wang Y, Bae YK, Yoon
DS, Wersto RP, Tully E, Wilsbach K and Gabrielson E: Increased
expression of mitotic checkpoint genes in breast cancer cells with
chromosomal instability. Clin Cancer Res. 12:405–410. 2006.
View Article : Google Scholar : PubMed/NCBI
|
|
60
|
Wu WJ, Hu KS, Wang DS, Zeng ZL, Zhang DS,
Chen DL, Bai L and Xu RH: CDC20 overexpression predicts a poor
prognosis for patients with colorectal cancer. J Transl Med.
11:1422013. View Article : Google Scholar : PubMed/NCBI
|
|
61
|
Huo X, Sun H, Cao D, Yang J, Peng P, Yu M
and Shen K: Identification of prognosis markers for endometrial
cancer by integrated analysis of DNA methylation and RNA-Seq data.
Sci Rep. 9:99242019. View Article : Google Scholar : PubMed/NCBI
|
|
62
|
Egloff AM, Vella LA and Finn OJ: Cyclin B1
and other cyclins as tumor antigens in immunosurveillance and
immunotherapy of cancer. Cancer Res. 66:6–9. 2006. View Article : Google Scholar : PubMed/NCBI
|
|
63
|
Gu J, Liu X, Li J and He Y: MicroRNA-144
inhibits cell proliferation, migration and invasion in human
hepatocellular carcinoma by targeting CCNB1. Cancer Cell Int.
19:152019. View Article : Google Scholar : PubMed/NCBI
|
|
64
|
Eberlein A, Takasuga A, Setoguchi K, Pfuhl
R, Flisikowski K, Fries R, Klopp N, Fürbass R, Weikard R and Kühn
C: Dissection of genetic factors modulating fetal growth in cattle
indicates a substantial role of the non-SMC condensin I complex,
subunit G (NCAPG) gene. Genetics. 183:951–964. 2009. View Article : Google Scholar : PubMed/NCBI
|
|
65
|
Zhang Q, Su R, Shan C, Gao C and Wu P:
Non-SMC condensin I Complex, Subunit G (NCAPG) is a novel mitotic
gene required for hepatocellular cancer cell proliferation and
migration. Oncol Res. 26:269–276. 2018. View Article : Google Scholar : PubMed/NCBI
|
|
66
|
Branchi V, Garcia SA, Radhakrishnan P,
Győrffy B, Hissa B, Schneider M, Reißfelder C and Schölch S:
Prognostic value of DLGAP5 in colorectal cancer. Int J Colorectal
Dis. 34:1455–1465. 2019. View Article : Google Scholar : PubMed/NCBI
|