Introduction
Human T-lymphotropic virus type I (HTLV–I) is an
oncogenic human retrovirus that was first isolated from the HUT102
T-cell line, which had been obtained from a patient with adult
T-cell leukemia/lymphoma (ATLL) (1).
Globally, there are an estimated 5–10 million individuals who carry
HTLV–I, with the important caveat that the prevalence remains
largely unknown in several areas of the world, such as India,
China, Russia, Australia and several African countries (2). The disease burden is unevenly
distributed, with a higher incidence of the disease in southwest
Japan, the Caribbean islands, South America and parts of Central
Africa (3). Infection with HTLV–I
may result in a spectrum of clinical manifestations, ranging from
asymptomatic infection to several health conditions, most notably
malignant ATLL and a type of chronic progressive neuromyelopathy,
termed HTLV–I-associated myelopathy/tropical spastic paraparesis
(4). The majority of patients with
HTLV–I remain asymptomatic for life, while certain individuals
progress to a pre-leukemic phase that is characterized by small
numbers of circulating leukemic cells in the peripheral blood and
skin lesions, but with a lack of involvement of other organ systems
(5). Only 2.5–5% of the virus
carriers eventually develop ATLL after a long asymptomatic period
(6,7).
The reason why certain individuals develop the
disease, whereas others remain asymptomatic, is likely dependent on
host- and virus-associated factors (8). Available evidence from molecular
studies indicates that impaired cellular functions mediated by
viral proteins, such as immortalization and interleukin
(IL)-2-independent proliferation of T cells induced by TAX
protein (9) genetic and epigenetic
changes, including DNA methylation, and the host's immune system
may contribute to the leukemogenesis of ATLL (10–12).
Despite the effective immortalization of the T cells, the markedly
prolonged incubation period (>30 years) prior to the onset of
ATLL suggests the additional acquisition of genetic changes besides
the viral infection contributing to the pathogenesis (13).
Infections with HTLV–I are expected to produce an
initial polyclonal T-cell proliferation followed by a monoclonal
malignant transformation in asymptomatic HTLV–I carriers prior to
the diagnosis of ATLL. HTLV–I carriers who have monoclonal
integration of HTLV–I provirus DNA in their mononuclear cells are
at high risk of developing ATLL, but the prognosis of these
patients varies from being stable long-term carriers to developing
ATLL (14–17). Carvalho and Da Fonseca Porto
(18) also identified a correlation
between monoclonal integration of provirus DNA and abnormal
lymphocytes in peripheral blood, with a trend toward greater
severity of the parasitic infection.
Certain studies have provided significant evidence
to support transcription of several non-protein coding regions of
the mammalian genome (19,20), yielding a complex network of
transcripts that include tremendous numbers of non-coding RNAs
(ncRNAs). These molecules have important roles in normal biological
processes and in a variety of human diseases, including diabetes
(21), aging heart (22) and cancer (23,24).
Within these ncRNAs, small RNAs (sRNAs) have emerged as potential
posttranscriptional regulators of gene expression in both
eukaryotes and prokaryotes (25).
sRNAs are highly complex in terms of structural diversity and
function, and may be further divided into structural and regulatory
ncRNAs (26). Structural ncRNAs
include transfer RNA (tRNA) and ribosomal RNA, as well as other
small but stable non-coding RNAs, including small nuclear RNAs
(snRNAs), small nucleolar RNAs (snoRNAs), small cytoplasmic RNA
(scRNA), ribonuclease P (RNase P), mitochondrial RNA processing
RNA, signal recognition particle RNA and telomerase RNA (27,28).
Regulatory ncRNAs include microRNAs (miRNAs/miRs), P-element
induced wimpy testis-interacting RNAs (piRNAs) and long ncRNAs
(29). miRNAs are perhaps the single
most extensively investigated small ncRNAs. miRNAs are typically
18–25 nucleotides long, single-stranded RNAs that have emerged as
principal posttranscriptional regulators of gene expression and
have a vital role in several cellular processes, including cell
proliferation (30), differentiation
(31) and apoptosis (32). Mature miRNAs are assembled into
ribonucleoprotein complexes called miRNA-induced silencing
complexes, which inhibit gene expression by perfect complementary
binding for mRNA degradation, or imperfect binding at the 3′
untranslated region to inhibit translation (33). The rigid control of miRNA expression
is important to maintain the normal physiological state of cells
(34), while overexpression of
miRNAs has been associated with the occurrence and development of
various diseases including ATLL (35,36). t
has been demonstrated that oncogenic miRNAs and tumor-suppressor
miRNAs mediate important cell cycle components, thus resulting in
either acceleration or deceleration of the cell cycle (37–39).
In theory, dysregulation of host cell miRNAs
mediated by HTLV–I may influence the development of ATLL. Certain
studies have demonstrated the role of cellular miRNA in the
proliferation and survival of HTLV–I-infected T cells.
Hybridization-based methodologies, including microarray and
PCR-based assays, have been used thus far to identify and profile
cellular miRNAs in HTLV–I-infected cell lines (40,41).
Pichler et al (35), who
first used quantitative (q)PCR to study the associations between
HTLV–I and cellular miRNAs, confirmed that HTLV–I transforms host
cells by inducing dysregulated expression of specific miRNAs,
including miR-146a, which is upregulated by the Tax protein, an
oncoprotein of HTLV–I. Subsequently, other studies have reported
both up- and downregulation of a number of miRNAs in HTLV–I/ATLL
cell lines and primary ATLL cells (36,42).
Previously, Ruggero et al (43) used massively parallel sequencing
(MPS) to identify the miRNAs and tRNA fragments expressed in
HTLV–I-infected cells compared with normal CD4+ T cells.
Most of the aforementioned studies primarily focused on the
expression of specific or diverse miRNAs in HTLV–I-infected cell
lines, while few studies have focused on determining the expression
profiles of sRNAs isolated from human blood samples. Thus, it would
be worthwhile to investigate early gene regulatory mechanisms
associated with cell transformation in HTLV–I asymptomatic carriers
with monoclonal T cell receptor (TCR) γ gene rearrangement,
designated here as ASM group.
In the present pilot study, Illumina MPS technology
(Illumina, Inc.) was used to comprehensively characterize sRNA
expression profiles in the peripheral blood mononuclear cells
(PBMCs) of patients with ASM and HTLV-1 asymptomatic carriers with
polyclonal TCR γ gene rearrangement, designated as ASP group, and
to compare these to a healthy control (HC) group. The present
results provide considerable insight to enhance the current
understanding of the expression characteristics of sRNAs in ASM and
ASP subjects.
Materials and methods
Patient enrolment and sample
preparation
Peripheral blood samples were initially collected
from 367 HTLV–I asymptomatic carriers. These participants were
receiving care at the HTLV–I outpatient clinic at the University of
São Paulo and the Institute of Infectious Diseases Emilio
Ribas (São Paulo, Brazil) between November 2012 and December
2014. All subjects were recruited for the present study after
receiving adequate explanations of the enrollment procedure at the
collaborating institutions. Of the 367 HTLV–I asymptomatic
carriers, seven had detectable monoclonal expansion of T-cells
population, which resulted in the predominance of TCR γ gene
rearrangement, classified as ASM group, were included in the
present study. Furthermore, eight patients who were ASP were
randomly selected from the 360 carriers to limit them to the ASM
group. Furthermore, five HCs were selected from apparently healthy
volunteers recruited from the laboratory staff who have no evidence
of HTLV-1 infection. Thus, the final sample size was seven ASM and
eight ASP cases, as well as five HCs. All eight participants in the
ASP group were female and the median age was 55 years (range, 31–80
years). Furthermore, five females and two males were included in
the ASM group and the median age of this group was 61 years (range,
28–74 years). The samples were collected after approval by the
Ethics Committee for Review of Research Projects (CAPPesq; approval
no. 1235/2017) and written informed consent was provided by all
subjects. Isolation of PBMCs was performed using Ficoll-Hypaque
(Amersham; Cyvita) density centrifugation for 20 min at 1,020 × g,
followed by two washes with RPMI 1640 (R0883, Sigma-Aldrich; Merck
KGaA) with 10% fetal calf serum (FCS, Gibco; Thermo Fisher
Scientific, Inc.) and stored in liquid nitrogen (≤140°C) until use.
A summary of the clinical characteristics of the patients is
provided in Table I.
 | Table I.Demographic and clinical
characteristics of HTLV-1 asymptomatic carriers and HCs subjected
to small RNA analysis. |
Table I.
Demographic and clinical
characteristics of HTLV-1 asymptomatic carriers and HCs subjected
to small RNA analysis.
| Sample | Sex | Age, years | Clonality
features | Proviral load
(copies/1,000 PBMCs) | Total input
reads | Total filtered
reads, n (%) | Mapped reads |
|---|
| 131ASP | Female | 52 | Polyclonal | 17 | 4,029,773 | 766,480
(19.02) | 3,263,293 |
| 146ASP | Female | 59 | Polyclonal | 208 | 12,757,509 | 2,882,221
(22.59) | 9,875,288 |
| 151ASP | Female | 72 | Polyclonal | 1 | 11,791,086 | 1,821,389
(15.45) | 9,969,697 |
| 152ASP | Female | 34 | Polyclonal | 60 | 6,445,840 | 887,250
(13.76) | 5,558,590 |
| 167ASP | Female | 58 | Polyclonal | 32 | 5,942,373 | 941,689
(15.85) | 5,000,684 |
| 172ASP | Female | 31 | Polyclonal | 102 | 4,441,528 | 726,607
(16.36) | 3,714,921 |
| 182ASP | Female | 80 | Polyclonal | 22 | 7,313,049 | 1,410,187
(19.28) | 5,902,862 |
| 188ASP | Female | 49 | Polyclonal | 8 | 9,208,436 | 2,309,907
(25.08) | 6,898,529 |
| 054ASM | Female | 42 | Monoclonal | ND | 6,597,354 | 1,471,005
(22.30) | 5,126,349 |
| 075ASM | Female | 45 | Monoclonal | ND | 11,351,002 | 2,096,996
(18.47) | 9,254,006 |
| 124ASM | Male | 70 | Monoclonal | 327 | 8,270,885 | 1,327,603
(16.05) | 6,943,282 |
| 143ASM | Female | 65 | Monoclonal | 71 | 5,833,340 | 1,087,647
(18.65) | 4,745,693 |
| 154ASM | Female | 28 | Monoclonal | 163 | 11,211,867 | 1,715,983
(15.31) | 9,495,884 |
| 200ASM | Female | 74 | Monoclonal | ND | 8,077,749 | 1,649,537
(20.42) | 6,428,212 |
| 212ASM | Male | 61 | Monoclonal | 27 | 12,982,061 | 2,715,976
(20.92) | 10,266,085 |
| 002HC | Female | 38 | NA | NA | 3,707,168 | 432,213
(11.66) | 3,285,435 |
| 003HC | Male | 53 | NA | NA | 8,917,856 | 911,050
(10.22) | 8,051,395 |
| 004HC | Female | 37 | NA | NA | 5,078,632 | 847,574
(16.69) | 4,241,255 |
| 005HC | Male | 32 | NA | NA | 2,969,362 | 474,247
(15.97) | 2,504,144 |
| 006HC | Female | 32 | NA | NA | 6,665,538 | 868,400
(13.03) | 5,833,724 |
Genomic DNA and RNA extraction
Genomic DNA was extracted from PBMCs using a QIAamp
blood kit (Qiagen GmbH). An miRNeasy Mini kit (Qiagen GmbH) in
conjunction with TRIzol® (Thermo Fisher Scientific,
Inc.) was used to extract total RNA and sRNA following the
manufacturer's protocols. In brief, 700 µl TRIzol was added to 200
µl cryopreserved PBMCs, followed by incubation at room temperature
for 5 min. After this, 200 µl chloroform (Sigma-Aldrich; Merck
KGaA) was added and the samples were shaken during incubation at
room temperature for 5 min, followed by centrifugation at 12,000 ×
g for 15 min at 4°C. The aqueous phase containing RNA was
transferred to a new tube and 0.5 ml isopropanol (Thermo Fisher
Scientific, Inc.) was added. The samples were incubated at room
temperature for 10 min, followed by centrifugation at 12,000 × g
for 15 min at 4°C. The pellet was washed with 75% ethanol
(Sigma-Aldrich; Merck KGaG), air-dried and resuspended in 20 µl
nuclease-free water (Ambion; Thermo Fisher Scientific, Inc.). For
the addition of carriers, 2 µl glycogen (5 µg/µl) was added during
the isopropanol precipitation step. Using the miRNeasy Mini kit
(QIAgen, Hliden, Germany), the aqueous phase was added to ~525 µl
100% ethanol and the mixture was thoroughly blended by pipetting.
The supernatants were then transferred to the miRNeasy Mini spin
column and centrifuged at ≥8,000 × g. Thereafter, the column was
washed with 700 µl Qiagen RWT buffer, 500 µl Qiagen RPE buffer and
500 µl 80% ethanol, and then centrifuged at 12,000 × g for 5 min at
room temperature. Finally, the sRNAs on the membrane were eluted in
22 µl RNase-free water and stored at −80°C until further use. The
concentration of DNA and RNA, including sRNA, was measured using
fluorimetry, using a Qubit 2.0 fluorometer with a Qubit®
DNA or an RNA HS Assay kit (Thermo Fisher Scientific, Inc.),
respectively, according to manufacturer's instructions.
HTLV–I proviral load
determination
Extracted DNA was used as a template to amplify a
97-base pair (bp) fluorimetry fragment from the HTLV–I tax
region using previously described primers (44) and protocols (45). Amplification and analysis were
performed using an Applied Biosystems 7500 real-time PCR system
(Applied Biosystems; Thermo Fisher Scientific, Inc.). The standard
curves for HTLV–I tax were generated from MT-2 cells (kindly
provided by Dr Jorge Casseb, University of São Paulo, Brazil) of
log10 dilutions (from 105 to 10° copies). The
threshold cycle for each clinical sample was calculated by defining
the point at which the fluorescence exceeded a threshold limit set
at the mean plus 10 standard deviations above the baseline. Each
sample was assayed in duplicate and the mean of the two values was
considered the copy number of the sample. The HTLV–I proviral load
was calculated as the copy number of HTLV–I (tax) per 1,000 cells=
(copy number of HTLV–I tax)/(copy number of RNase P gene/2) ×1,000
cells. The method was able to detect one copy per 103
PBMCs.
Analysis of TCR γ gene
rearrangement
DNA-based PCR of rearranged yTCR genes was performed
according to a previously described protocol (46). For each of the patients, the PCR
products were analyzed using 3130 ABI Prism capillary
electrophoresis equipment (Applied Biosystems; Thermo Fisher
Scientific, Inc.). The following was added to each well of a
96-well plate: 0.5 µl size GeneScan Rox (red) 500 size standard, 13
µl Highly deionized (Hi-Di) formamide and 1 µl template DNA sample.
Data were analyzed using Genescan and Genotyper software version
2.1 (Applied Biosystems; Thermo Fisher Scientific, Inc.). T-cell
clonalities were blindly determined by visual examination of the
electropherograms by two independent examiners and further
confirmed by an expert hematology pathologist (coauthor JP).
sRNA library construction and MPS
For each sample in each group, sRNA libraries were
prepared with the Small RNA v1.5 sample preparation kit, as per the
manufacturer's instructions (Illumina, Inc.) and a previous
protocol (47). In brief, 5 µl
purified total RNA was ligated with 1 µl RNA 3′ adapter and then
with a 5′ RNA adapter (both Illumina, Inc.). The 5′ adapter also
included the sequencing primer. After reverse transcription
(RT-)qPCR amplification, the resulting products were analyzed using
PAGE (6% Novex Tris-borate-EDTA PAGE; Invitrogen; Thermo Fisher
Scientific, Inc.). After gel electrophoresis, sRNA bands sized
145–150 bp were excised and purified. Finally, every four libraries
were pooled and up to 8–10 pM of the pooled libraries were loaded
and sequenced using the MiSeq platform (Illumina, Inc.) with a
36-base single-end protocol, according to the manufacturer's
protocol.
sRNA data analysis and
interpretation
Base-calling, demultiplexing and trimmed FASTQ files
were generated using MiSeq reporter 2.3 and 2.4.1.3, (Illumina,
Inc.). Only high-quality reads with scores >30 on the Sanger
scale were considered for further analysis. The reads were aligned
against the whole genome build: Hg19 using Strand NGS version 3.1
(Strand Life Science). The default parameters and algorithms of
this software package were also used for sequences annotations and
deferential expression of known, novel sRNA, and mature miRNA.
Novel sRNA was identified and classified using the decision tree
method with 3-fold validation accuracy according to a previously
described model by Langenberger et al (48). Distributions of the sRNA data in each
clinical condition were conducted according to the quantile
normalization algorithm (49), with
a baseline transformation set to the median value for all samples.
In addition, only sRNA sequences meeting the minimum read coverage
criterion of >5 were considered as novel or known sRNA and were
included in further analyses. For each sRNA within each group, the
Shapiro-Wilk method was used to test for normality of the
distribution of the clean data (Shapiro-Wilk P>0.95) and only
data meeting this standard were considered for further analysis.
sRNAs with fold-changes >2.0 were considered differentially
expressed. All the sRNA raw data generated using MPS were deposited
in the Zenodo repository (https://doi.org/10.5281/zenodo.1181925).
Validation of miRNA using RT-qPCR
A total of two miRNAs, namely Homo sapiens
(hsa)-mir-23a-3p (MI0000079) and −363-3p (MIMAT0000707),
demonstrating a tendency of strong dysregulation among patients
with ASM compared with ASP and HCs according to MPS analysis, were
selected and subjected to validation by RT-qPCR. A total of 5 µl of
each enriched miRNA was converted into complementary DNA using a
TaqMan™ MicroRNA Reverse Transcription kit (cat. no. 4366596;
Thermo Fisher Scientific, Inc.) according to the manufacturer's
protocol. qPCR was then performed using TaqMan™ Universal Master
Mix II (cat. no. 4440040; Thermo Fisher Scientific, Inc.) using a
7500 Real-Time PCR system (Thermo Fisher Scientific, Inc.). Each
reaction, including no-template negative control, was assayed in
triplicate. The relative expression levels of miRNA were normalized
to the internal control of miR16 (MI0000070). The PCR conditions
consisted of uracil-DNA glycosylase activation at 50°C for 2 min,
pre-denaturation and hot-start Taq activation at 95°C for 20
sec, and then 40 cycles of 95°C for 3 sec and 60°C for 30 sec. Data
were quantified using the 2−ΔΔCq method (50). Comparison of the ASM and ASP groups
was performed using paired t-tests. P<0.05 was considered to
indicate a statistically significant difference.
Statistical analysis
Moderated t-test or one-way analysis of variance
(ANOVA) followed by Benjamini-Hochberg correction for multiple
comparisons of the false discovery rate (FDR) was used for
statistical analysis with a P(Corr) cut-off <0.05 to
indicate statistical significance. Hierarchical clustering was
performed using Strand NGS version 3.1 (Strand Life Science).
Results
Patient characteristics
The characteristics of the subjects in the three
groups are presented in Table I. All
eight participants in the ASP group were female and the median age
was 55 years (range, 31–80 years). Five females and two males were
assigned to the ASM group and the median age was 61 years (range,
28–74 years). The HC consisted of 5 participants (3 females and 2
males with a median age of 37 years and range, 32–53 years). HTLV-1
proviral load levels varied from one copy to 208
copies/103 PBMCs in the ASP group and varied from
undetectable to 327 copies/103 PBMCs in the ASM group
(two-tailed P=0.7).
Whole-genome sRNA sequencing data
Illumina MPS revealed a total of 153,592,408 reads.
After the removal of low-quality data and failed reads, 126,359,328
reads were retained from combined genes that included tRNAs,
intronic genes, scRNA pseudogenes, snRNAs, snoRNAs, snoRNA
pseudogenes, snRNA pseudogenes, piRNAs, scRNAs, miRNAs and tRNA
pseudogenes. The sRNA reads filtered for quality metrics for each
sample used in alignment with the human genome sequence dataset are
presented in Table I. Illumina MPS
yielded 128 sRNA molecules that passed the filter on normality with
Shapiro-Wilk (P>0.95), of which 76 and 52 sequences were derived
from known and novel sRNAs, respectively. Of the 76 known sRNAs, 41
were miRNAs, 4 scRNAs, 2 scRNA pseudogenes, 6 snoRNAs, 1 was an
snRNA, 21 were tRNAs and one was a tRNA pseudogene (Table SI). Of the 52 novel genes, two were
novel miRNAs, 6 snoRNAs, 2 tRNAs and 42 were unknown (Table SII). Considering-3p and −5p mature
forms of miRNA, the present analysis revealed a total of 54 mature
miRNAs that passed the filter on normality with Shapiro-Wilk
(P>0.95; Table SIII).
Analysis of differential sRNA
expression in PBMCs between ASM and ASP HTLV-1 carriers and
HCs
To evaluate altered sRNA expression, replicative
differential expression analysis was performed between the ASM and
ASP groups and HCs subjects. This analysis revealed 28 upregulated
and 25 downregulated sRNAs within the PBMCs of the ASM and ASP
group compared with the HC group. These 53 molecules included 28
miRNAs, two scRNAs, one scRNA pseudogene, six snoRNAs, 15 tRNAs and
one tRNA pseudogene (Table SIV).
Furthermore, hsa-mir-155, −23a and −23b, SNORD17 and hsa-mir-21-5p
were the top five upregulated sRNAs and hsa-mir-144, −550a-1,
−550a-2, −186 and −486 were the five top downregulated sRNAs. The
individual analysis of the ASM vs. HC group revealed 28 upregulated
and 26 downregulated known genes, satisfying the corrected [FDR
corrected p-value ≤0.05] in the ASM group. The annotations of these
54 sRNAs were 29 miRNAs, two scRNAs, one scRNA pseudogene, six
snoRNAs, 15 tRNAs and one tRNA pseudogene (Table SV). The most notably upregulated
five sRNAs were hsa-mir-23a, hsa-mir-23b, hsa-mir-155, SNORD119 and
SNORD100. On the other hand, hsa-mir-550a-2, −550a-1, −144, −486
and −186 were the most notably downregulated sRNAs. The
differential analysis of known sRNAs within the PBMCs of the ASP
vs. HC group revealed 45 dysregulated sRNAs (20 upregulated and 25
downregulated), consisting of 26 miRNAs, two scRNAs, one scRNA
pseudogene, six snoRNAs and 10 tRNAs (Table SVI). The most notably upregulated
five sRNAs were hsa-mir-155, −23b, −23a, −21 and SNORD17, while
hsa-mir-144, −486, −550a-2, −550a-1 and −186 were among the most
significantly downregulated sRNAs (FDR corrected P≤0.05). The Venn
diagram representation depicted in Fig.
1 displays the sRNAs differentially expressed in the ASM and
ASP vs. HC groups. A total of 44 sRNAs were common differentially
expressed sRNAs in the ASM and ASP groups, whereas 10 were
exclusively dysregulated in the ASM group (hsa-mir-378a, 590, 99b,
trna17, trna35, trna2, trna37, trna39, trna41 and the transfer RNA
glutamic acid 40 (anticodon UUC) pseudogene (TRNAE40P)) and one
(trna65) was significantly upregulated in the ASP group.
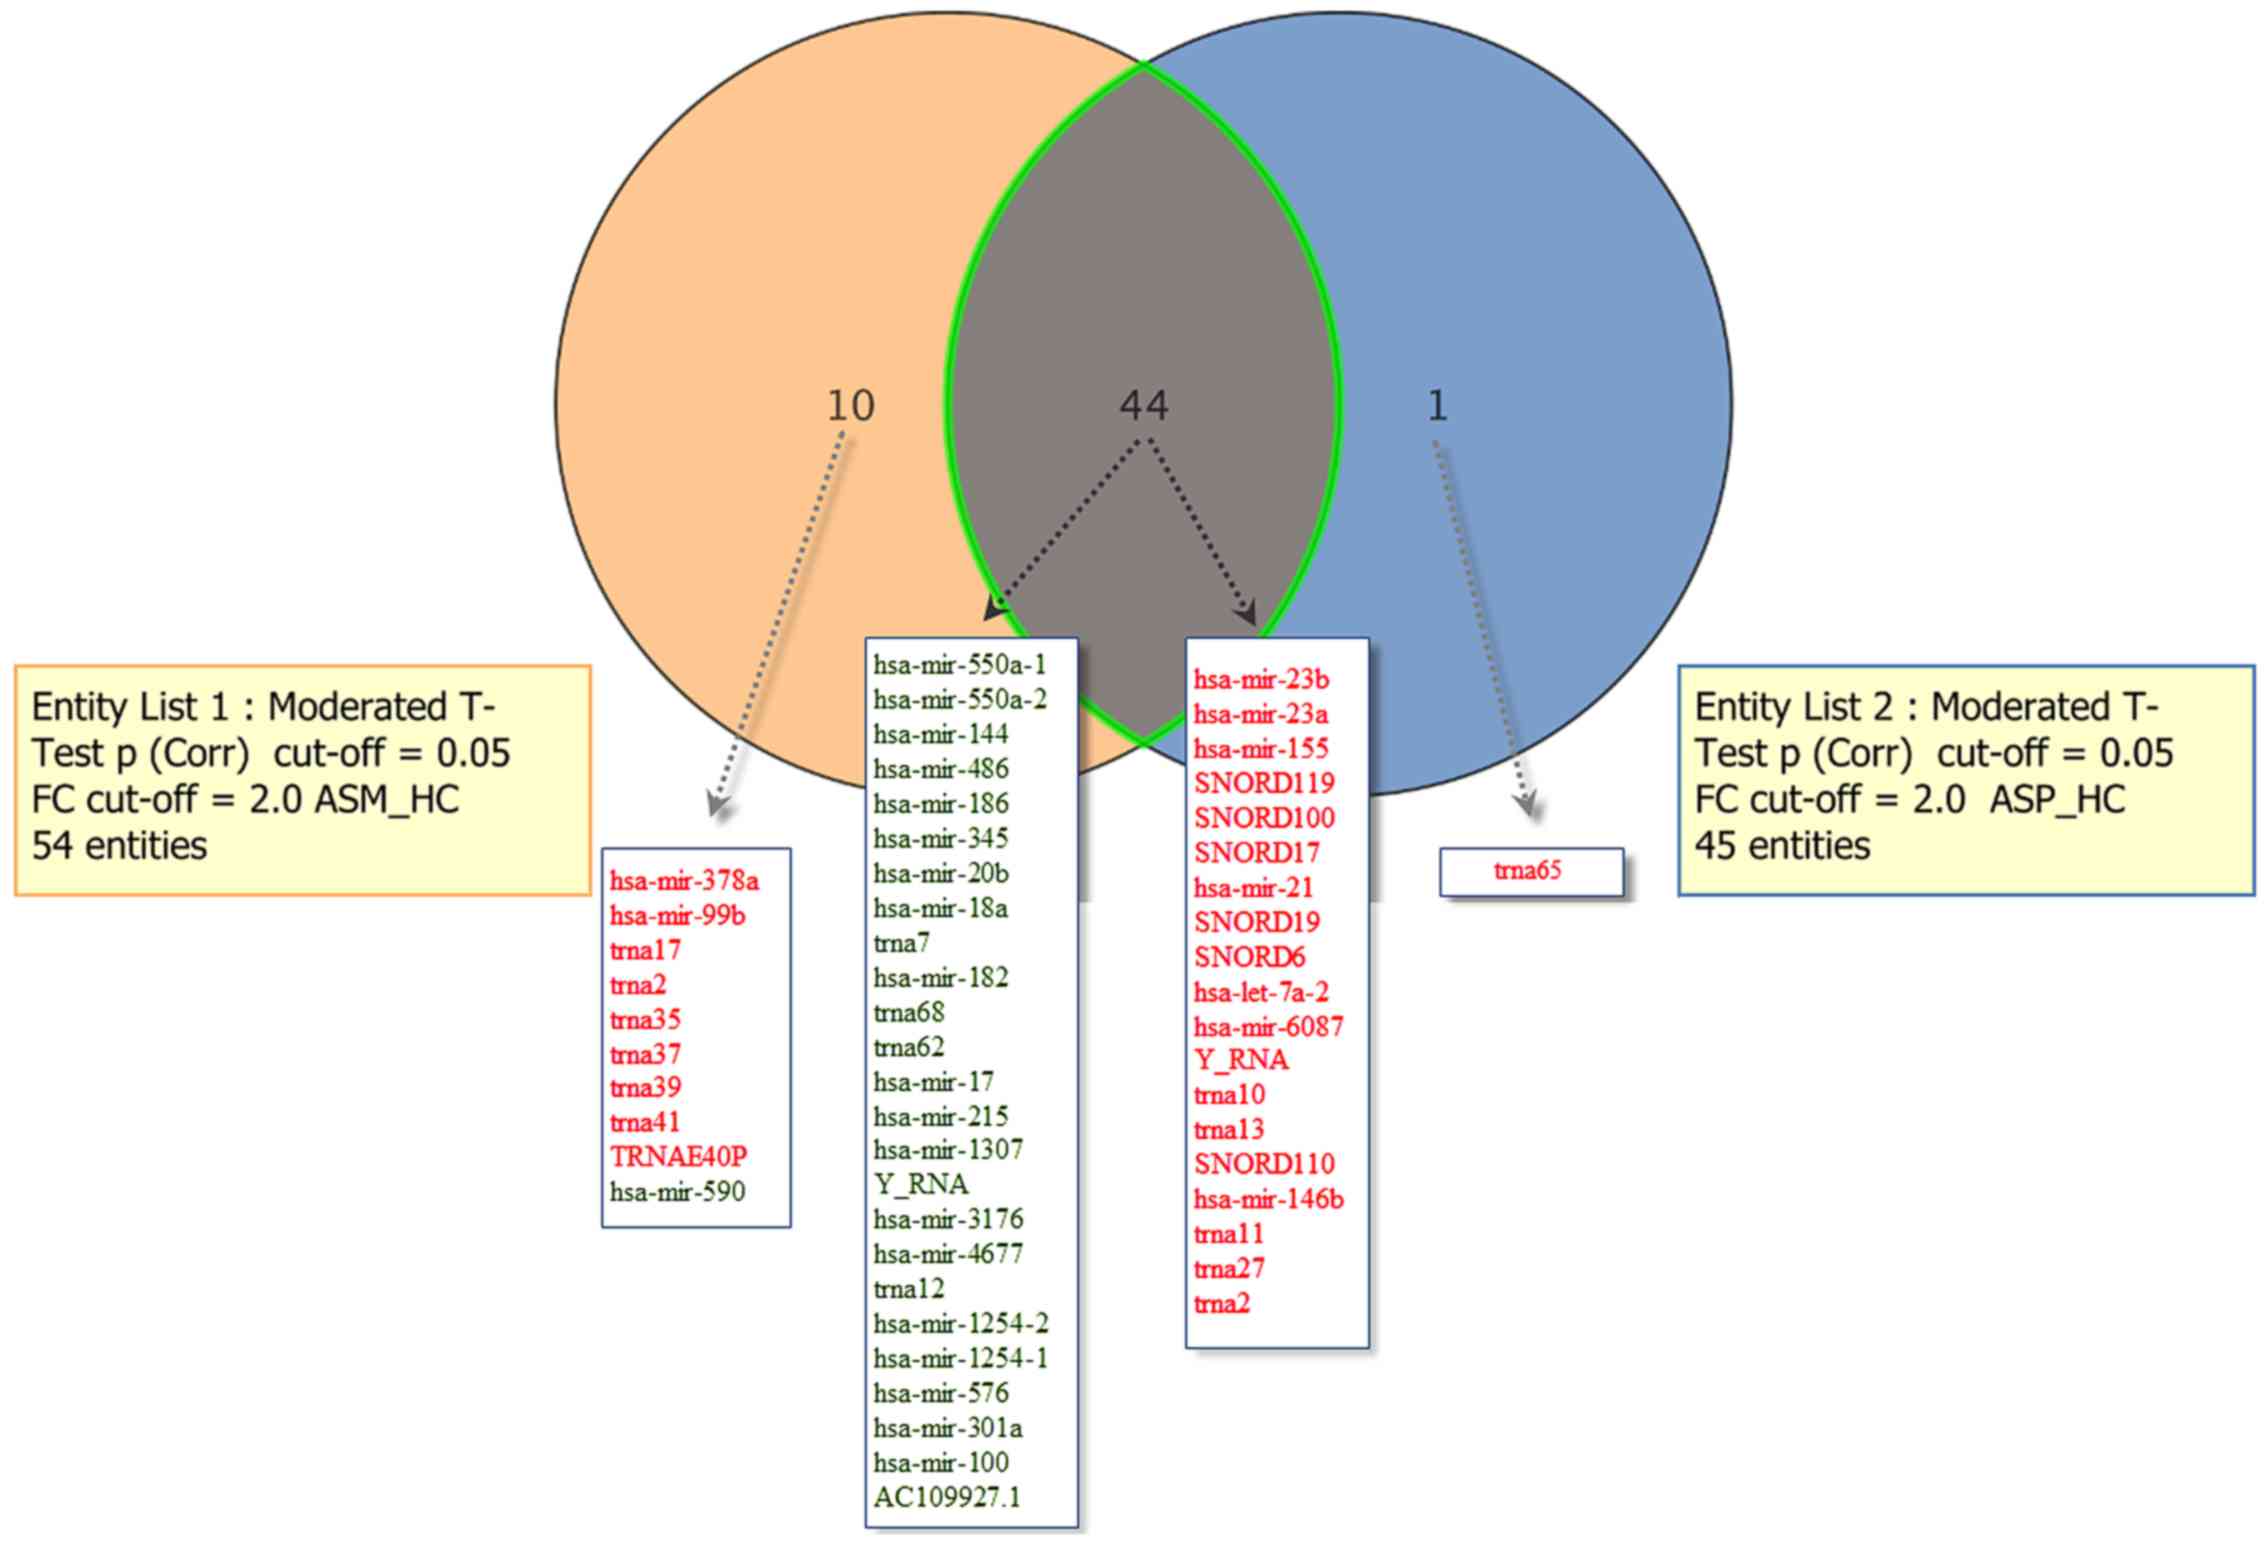 | Figure 1.Comparisons of significantly
dysregulated known sRNAs in peripheral blood mononuclear cells of
patients with asymptomatic human T-lymphotropic virus type I. The
Venn diagram indicates the number of sRNAs differentially expressed
in entity list 1 (ASM vs. HC), entity list 2 (ASP vs. HC) and in
both. For each entity, the sRNAs elevated (indicated in red) and
downregulated (indicated in green) are indicated within the
diagram. ASM, asymptomatic carriers with monoclonal T cell receptor
γ gene rearrangement; ASP, asymptomatic carriers with polyclonal T
cell receptor γ gene rearrangement; HC, healthy control; Corr,
corrected; miR, microRNA; trna, transfer RNA; snoRNA, small
nucleolar RNA;TRNAE40P, transfer RNA glutamic acid 40 (anticodon
UUC) pseudogene; FC, fold-change; ASM_HC, ASM vs. HC; ASP_HC, ASP
vs. HC; sRNA, small RNA; hsa, Homo sapiens. |
Of the 52 novel genes, 37 reached an FDR significant
value (FDR corrected P≤0.05] in the comparison of ASM and ASP vs.
the HC group, of which 10 were upregulated and 27 downregulated
(Table SVII). A total of 28 of
these 37 significantly dysregulated novel sRNAs (73.7%) have never
been reported previously, to the best of our knowledge. The most
significantly downregulated gene was annotated as NEWGENE156
[chromosome (chr)6, 8164298–8164349], followed by NEWGENE671
(chr20, 57414179–57414214). One miRNA (chr8, 136785981–136786100)
followed by one snoRNA (chr1, 173836772–173836882) were
significantly upregulated novel genes (both FDR corrected
P≤0.05).
In the aforementioned results, the differential
expression profiles of the sRNAs in the HTLV–I-infected groups (ASM
and ASP) compared with the HC group were analyzed. It was then
determined whether there is a significant change in the expression
of known and novel sRNAs between the ASM and ASP groups. A pairwise
comparison of the detected sRNAs between the two groups was
performed using a moderated t-test with FDR corrected P≤0.05. The
results revealed no significant difference in sRNA expression
between the two groups (data not shown).
The extent to which the 53 and 37 known and novel
sRNAs, respectively, were distinctly different in HTLV–I ASM and
ASP carriers from HCs were explored via hierarchical clustering,
which revealed a clear partition between these groups with all HC
samples clustering within their group (Figs. 2 and S1). The same cluster analysis of
individual cases indicated no clearly distinct differences in RNA
expression profiles between the ASM and ASP samples.
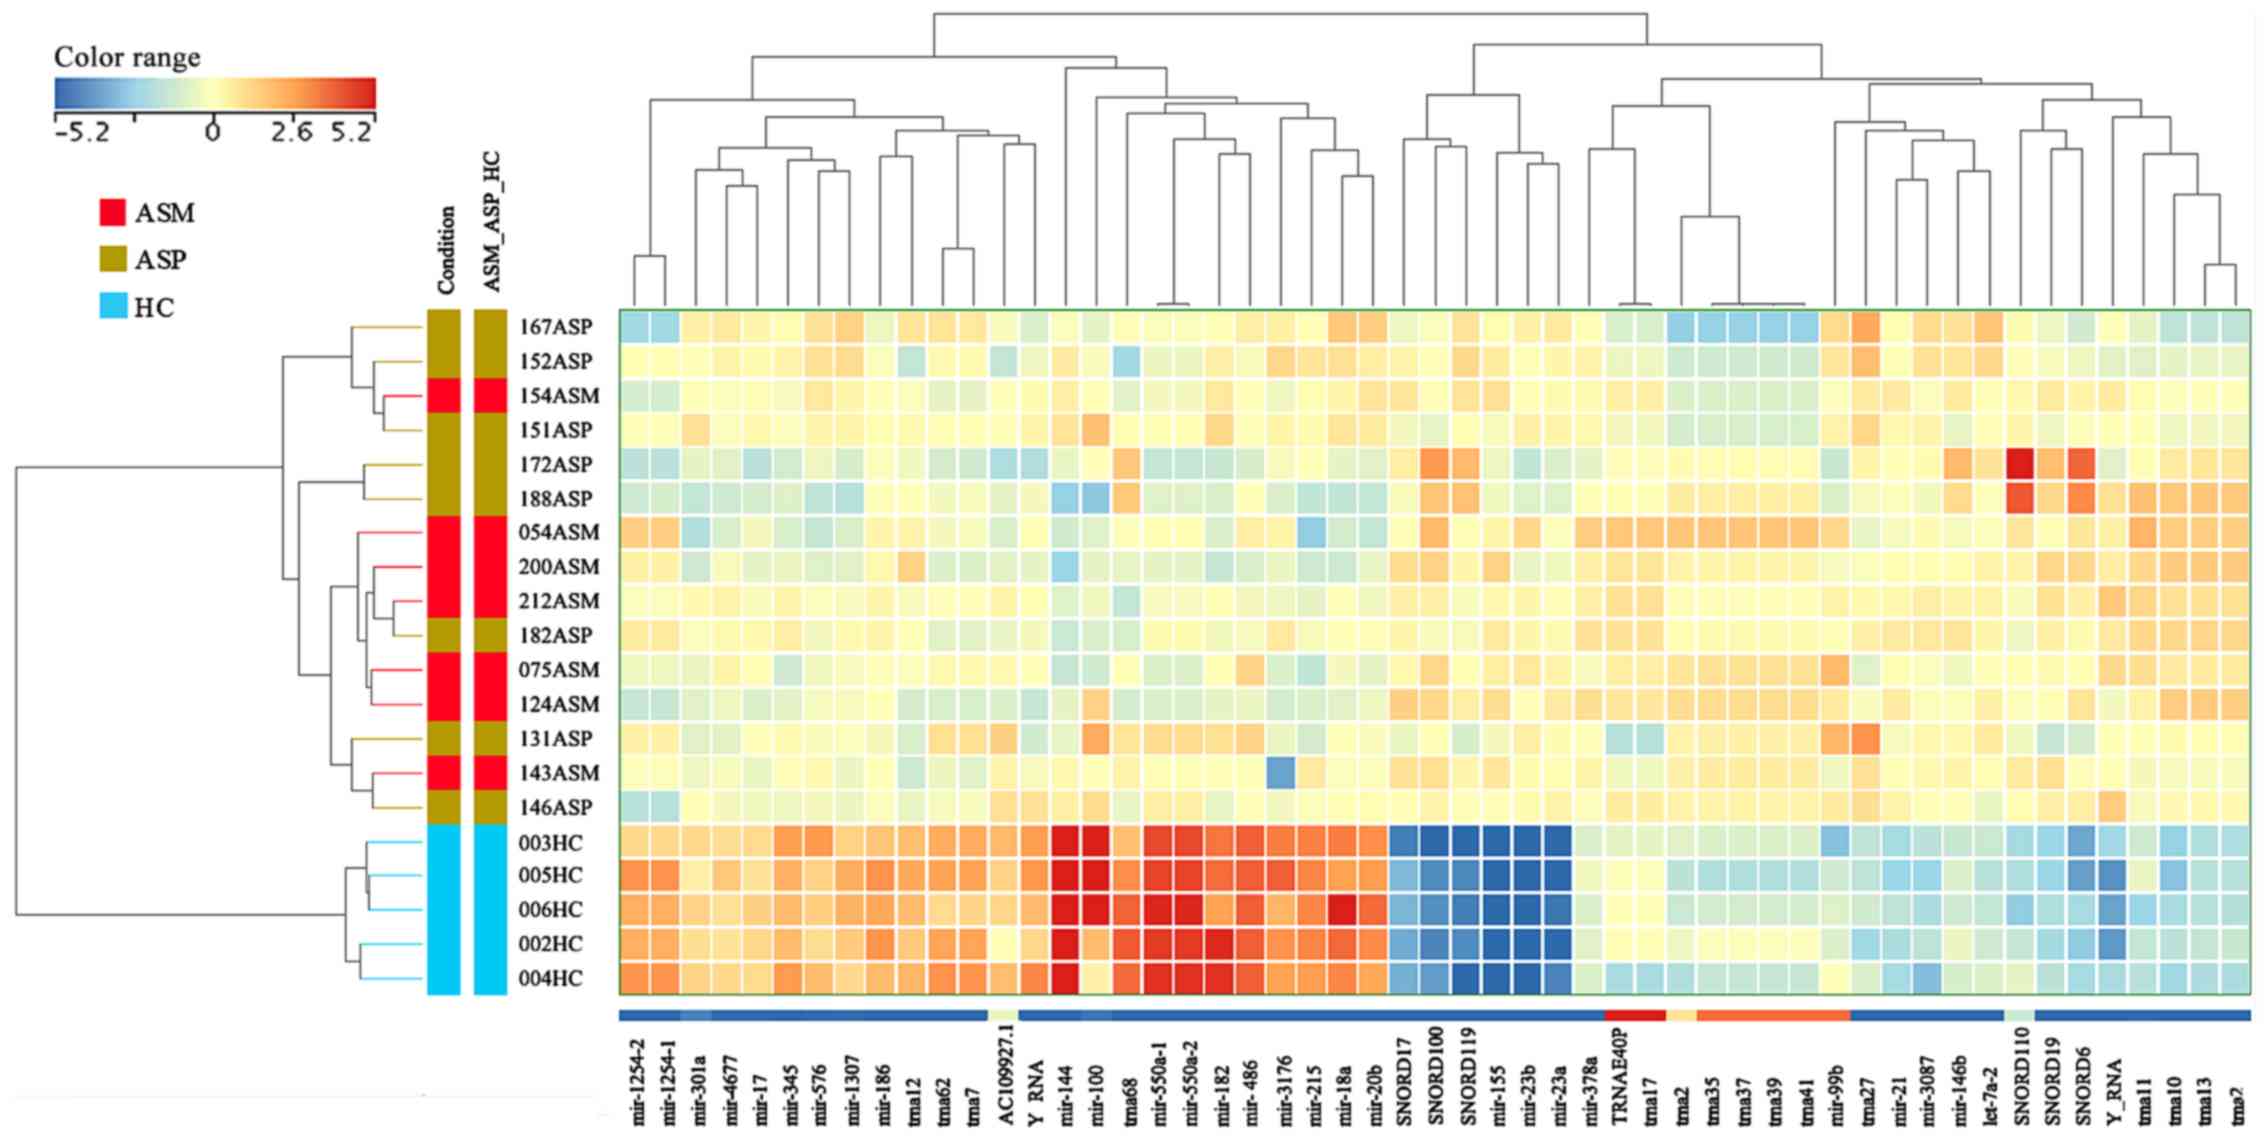 | Figure 2.Unsupervised hierarchical clustering
of sRNAs and samples from the Illumina MPS data. The heat map
contains 53 unique and known sRNAs, which were differentially
expressed in patients with ASM and ASP human T-lymphotropic virus
type I. The sample clustering tree is displayed to the left and the
sRNA clustering tree is above. The color scale at the top indicates
the relative expression levels of sRNA across all samples. Red
indicates that the expression levels are higher compared with the
mean, whereas blue indicates that the expression levels are lower
compared with the mean. Each column represents one known sRNA and
each row represents one sample. ASM, asymptomatic carriers with
monoclonal T cell receptor γ gene rearrangement; ASP, asymptomatic
carriers with polyclonal T cell receptor γ gene rearrangement; HC,
healthy control; miR, microRNA; trna, transfer RNA; snoRNA, small
nucleolar RNA; TRNAE40P, transfer RNA glutamic acid 40 (anticodon
UUC) pseudogene; ASM_ASP_HC, ASM vs. ASP vs. HC. |
Differential analysis of mature miRNA
expression in PBMCs between HTLV-1 ASM and ASP carriers and
HCs
After correction for multiple testing using the
Benjamini-Hochberg method, the replicative differential analysis of
the 54 mature miRNAs was distributed normally following a
Shapiro-Wilk test (P>0.95) between the HTLV-1 ASM and ASP
carriers and HC group, and revealed 16 significantly upregulated
and 14 significantly downregulated miRNAs [one-way ANOVA, FDR
corrected P≤0.05; Table SVIII). The
top five most upregulated mature miRNAs were hsa-mir-23a-3p and
−28-5p, hsa-let-7e-5p, hsa-mir-28-3p and 361-5p, while the top five
most downregulated miRNAs were hsa-miR-363-3p, −532-5p, −106a-5p,
−25-3p and −30e-5p. The individual analysis of the mature miRNAs of
the ASM vs. HC and ASP vs. HC groups yielded identical results to
the replicative analysis. A total of 3 downregulated (hsa-miR-320b,
−1468-5p and −4772-3p) and 2 upregulated (hsa-miR-339-5p and
−625-3p) mature miRNAs were exclusively detected in the ASP group
(Fig. 3). A Venn diagram
representation of the number of significantly differentially
expressed mature miRNAs overlapping between the ASM and ASP groups
is provided in Fig. 3. The results
also suggested that all of the 30 miRNAs significantly dysregulated
in the ASM libraries were also significantly dysregulated in the
ASP libraries. In other relaxed analysis, we used all mature miRNAs
with 2-fold or greater change and a corrected p-value of <0.001
regardless of their normal distribution. The results revealed 144
highly dysregulated mature miRNA in PBMCs of ASM and ASP when
compared to HC subjects as shown in Table SIX.
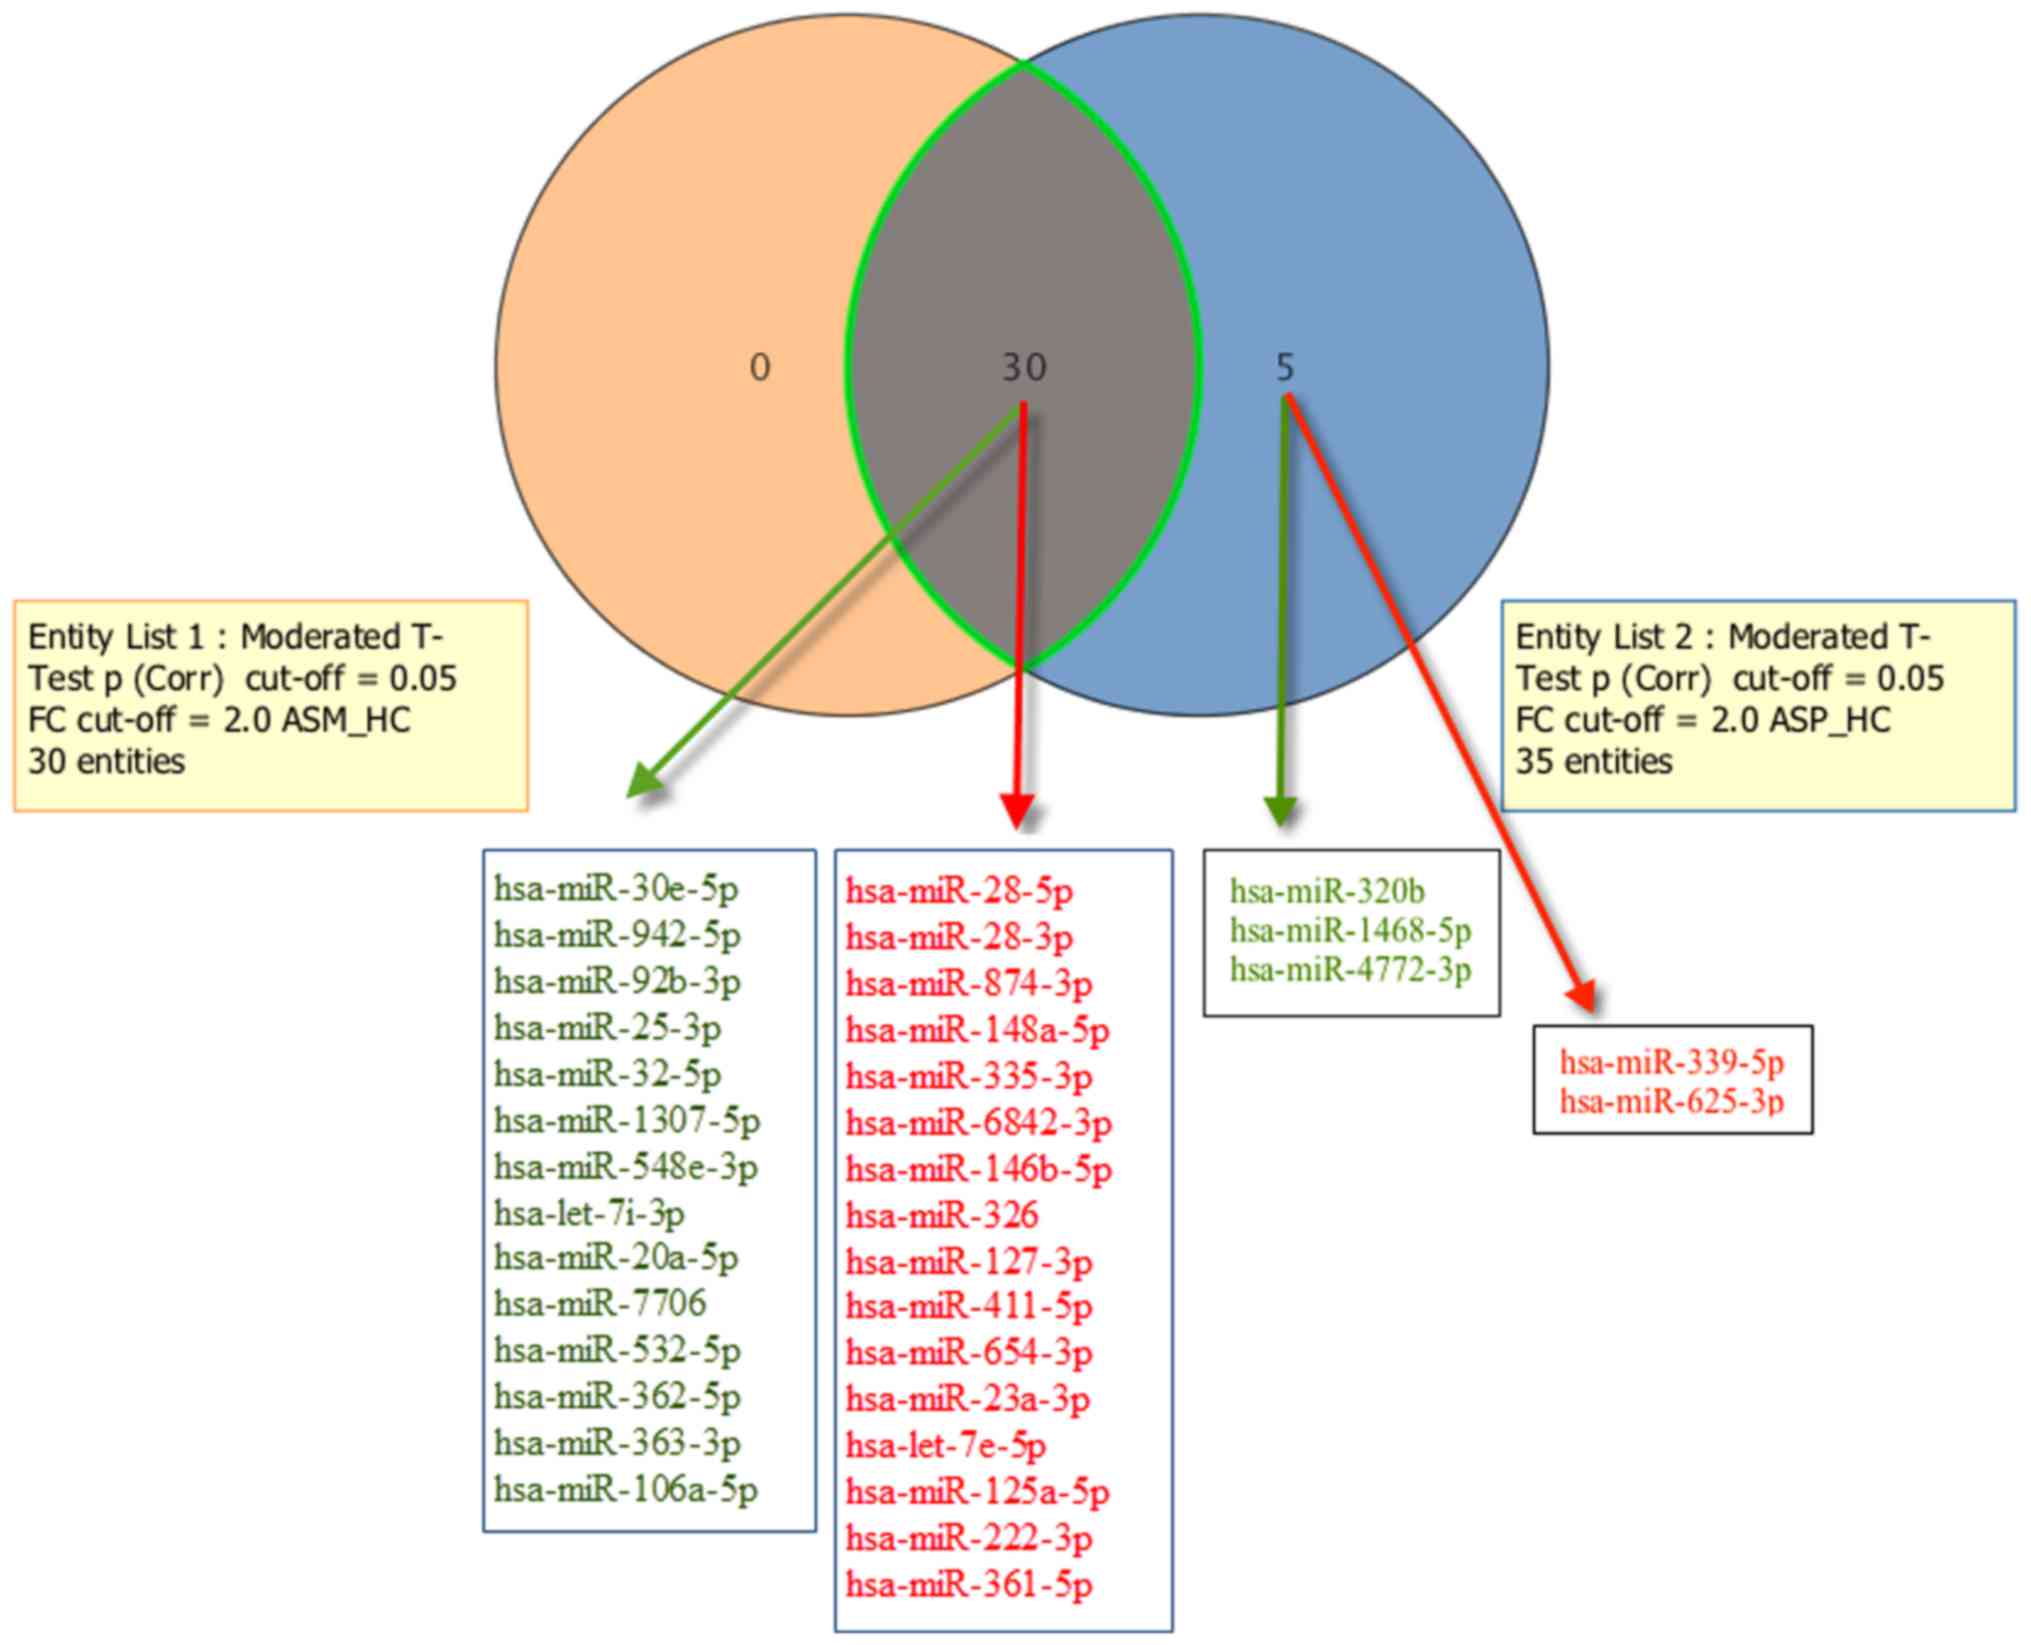 | Figure 3.Comparisons of significantly
dysregulated mature miRNA expression in peripheral blood
mononuclear cells of patients with asymptomatic human
T-lymphotropic virus type I. The Venn diagram indicates the number
of mature miRNAs differentially expressed in entity list 1 (ASM vs.
HC), entity list 2 (ASP vs. HC), and in both. For each entity,
elevated miRNAs (indicated in red) and downregulated miRNAs
(indicated in green) are indicated within the diagram. ASM,
asymptomatic carriers with monoclonal T cell receptor γ gene
rearrangement; ASP, asymptomatic carriers with polyclonal T cell
receptor γ gene rearrangement; FC, fold-change; Corr, corrected;
miR, microRNA; ASM_HC, ASM vs. HC; ASP_HC, ASP vs. HC. |
miRNA validation using RT-qPCR
To validate the expression levels of miRNAs among
the three compared groups by RT-qPCR, two miRNAs (hsa-miR-23a-3p
and −363-3p) were selected based on their expression profiles.
However, the results revealed no significant differences in miRNAs
expression among the three groups (P>0.05; data not shown).
Discussion
In the present pilot study, Illumina high-throughput
sequencing technology was used to analyze the global expression of
the non-coding RNome in PBMCs of ASM, ASP, and HCs groups.
Significant dysregulation of 76 known sRNAs and 52 putative novel
sRNAs was detected. Of these, 44 and 34 sRNAs were known and
potential novel sRNAs, respectively, and were commonly and
differentially dysregulated in the ASM and ASP libraries when
compared with HCs. In addition, 10 known sRNAs were exclusively
dysregulated in the ASM group and one (trna65) was exclusively and
significantly upregulated in the ASP group. On the other hand,
analysis of the 54 mature miRNAs between the ASM and ASP versus HC
group revealed significantly 16 up-regulated and 14 down-regulated
entities. Of these, hsa-mir-23a-3p and 363-3p, were selected for
the validation among the three groups. However, subsequent RT-qPCR
analyses of both miRNAs revealed no significant difference between
the analyzed subgroups. As there were no differences between the
samples used in the MPS experiment and the consequent validations,
the discrepancies in miRNA quantification may have been caused by
the small sample size available for validation using RT-qPCR or by
the MiSeq platform. Other possible explanations for these
differences include the enzymatic reactions and amplification step
performed during sample preparation, as well as the RT-qPCR probe
design (51–53). For the MPS assay, the integrity of
RNA and precision of miRNA band excision from the gel during
library preparation may impact the detection of miRNA and may have
resulted in the detection of the precursor as mature miRNA
(54). These factors could be
minimized in future studies by optimizing PCR conditions and using
high quality primer and probe, and by developing a robust methods
for MPS library preparation.
As there is growing interest in personalized
medicine and an individualized multimodality approach to treatment,
it is important to identify early biomarkers to more accurately
identify leukemic cells. Clonal changes have been detected in ~10%
of cases progressing from asymptomatic HTLV–I infection to overt
acute ATLL, and this may reflect the emergence of multiple
premalignant clones in viral leukemogenesis as proposed in
Epstein-Barr virus-associated lymphomagenesis (55,56).
After infection, HTLV–I mediates the cellular transformation of
primary human T cells through a multistep process in which the
virus induces genomic instability, thus ultimately promoting the
accumulation of genetic mutations and enhancing the chronic
proliferation of infected cells (57). It has been proposed that, during
infection, the HTLV–I virus dysregulates the host cellular RNA
interference pathway, including miRNAs, by different mechanisms,
including suppression and degradation of Drosha through binding to
the tax protein (58), or by
inhibition of Dicer activation through direct interaction with the
viral rex protein (59). Previous
studies have identified multiple miRNAs that are significantly
differentially expressed in ATLL cell lines and patients with ATLL
infected with HTLV–I (35,36,42,60).
However, studies concerning sRNA expression alterations in response
to HTLV–I infection during chronic infection in asymptomatic
carriers are lacking.
Using an MPS approach, the present study identified
differential sRNA expression profiles between ASM and ASP versus
HCs group. However, the present study failed to identify a
significant predictive impact of these miRNAs using RT-qPCR
analyses. The following significantly differentially expressed
miRNAs were identified as possible predictive factors in
asymptomatic HTLV–I carriers with monoclonal T cell receptor γ gene
rearrangement: hsa-miR-26a-5p, −23a-3p, −144-3p, −146a, −28-5p,
−23b-3p, −363-3p, −532-5p, −93-5p, −155-5p and −185-5p. The
expression profiles of several of these miRNAs are consistent with
those of previous studies and are involved in various cellular
processes, including cell proliferation, differentiation and
apoptosis. For instance, consistent with a previous study by
Pichler et al (35), who
examined the expression of miRNAs in HTLV-1-transformed cells, the
present results obtained with clinical samples demonstrated
upregulation of miR-21, miR-146a and miR-155 in PBMCs in
HTLV–I-infected carriers regardless of their mode of T-cell γ gene
rearrangements. Of note, the same three miRNAs, together with
miR-27a, reported in the present study (Table SIX), were upregulated in
Epstein-Barr virus-infected B cells during latency III, the viral
growth program that induces B-cell proliferation (61). The upregulation of miR-146a, miR-21
and miR-155 in uninfected CD4+ T cells occurs after
activation through the T-cell receptor (62). Tomita et al (63) altered the levels of miR-146a in
HTLV–I-infected T-cell lines and observed that the inhibition of
miR-146a by a specific antagomir in these cells elicited an
inhibitory effect on cell proliferation, and the opposite effect
was induced by forcing HTLV–I-infected T-cell lines to overexpress
miR-146a. In addition, the present study demonstrated a significant
downregulation of miR-19a and suggested that miR-26a-5p was one of
the most highly expressed miRNAs. Consistent with these results,
Yeung et al (36) reported
significant upregulation of miR-19a and downregulation of miR-26a
in HTLV–I-transformed cell lines. As miR-26a is located in
cancer-associated genomic regions, it may have a dual role in
tumorigenesis and may act as a tumor suppressor (64–68) as
well as oncogenic miRNA (69). It
has been demonstrated that upregulation of miR-26a is able to
phosphorylate mutant p53 and restore the wild-type function,
thereby resulting in G0/G1 phase arrest and
reducing the proliferation of tumor cells in pancreatic cancer
(70). Furthermore, previous studies
indicated the involvement of miR-26a in multiple biological
pathways, including proliferation (71), invasion (65), differentiation (72,73),
angiogenesis (74,75) and energy metabolism (75). The same patterns of miR-19a and
miR-26a dysregulation observed in HTLV–I-transformed cell lines
have been documented in B-cell chronic lymphocytic leukemia
(76,77) and epithelial cancer types (78). Furthermore, miR-19a has been
demonstrated to target a tumor suppressor gene, phosphatase and
tensin homolog (PTEN), in CD5+ and chronic lymphocytic
leukemia cells (76,79). Of note, it has been indicated that
PTEN is downregulated by HTLV–I tax through the NF-κB signaling
pathway (80).
In the present study, miR-144-3p was the most
notably downregulated miRNA, consistent with previous studies
reporting its low expression in chronic myeloid leukemia (81), acute myeloid leukemia (82) and in the PBMCs of patients with
HTLV–I as well as ATLL cell lines (36). In addition, miR-28-5p was another
highly expressed miRNA in the present study. This miR has been
reported to inhibit HTLV–I virus expression and its replication,
except ATK1 strains, by targeting a specific site within the
genomic gag/pol viral mRNA (83).
Taking into consideration the aforementioned data, it was
hypothesized that the dysregulated miRs detected in the present
study have important functions in the pathology of HTLV–I
infection.
Previous studies have demonstrated that snoRNAs are
important in the regulation of cell fate and tumorigenesis
(84,85). The present study identified six
significantly upregulated snoRNAs (snoRD17, snoRD119, snoRD100,
snoRD19, snoRD6 and snoRD110). At present, the understanding of the
biological and clinical implications of these results is limited;
however, an improved understanding of these molecules may highlight
their value as diagnostic markers or therapeutic targets.
Validation using large clinical samples is required to confirm the
biological function of the dysregulated snoRNAs identified in the
present study.
Finally, 37 significantly dysregulated novel sRNAs
were identified, including two molecules that met the current miRNA
criteria, 1 tRNA, 6 snoRNAs, and 28 unknown sRNAs. Validation and
future analysis will be required to address the regulatory
mechanisms and biological effects of these small molecules.
The present pilot study has several limitations,
particularly regarding its retrospective design with a small number
of patients. Thus, future studies with larger sample sizes are
required to validate these results. Despite these caveats, these
data provide various known and novel subsets of dysregulated sRNAs,
including a signature in the PBMCs of the ASM group. sRNAs with
aberrant expression may be of value as diagnostic and prognostic
biomarkers and/or therapeutic targets in early HTLV–I pathogenesis
and it is therefore important to investigate the molecular
mechanisms underlying their function.
In conclusion, the present pilot study revealed no
significant changes in expression for the selected miRNAs using
separate RT-qPCR analysis; however, the MPS results yielded
differential sRNA expression profiles. Therefore, further
investigation with a larger number of patients is required to
elucidate the exact pathogenic impact of these ncRNA molecules in
HTLV–I infection.
Supplementary Material
Supporting Data
Supporting Data
Supporting Data
Supporting Data
Supporting Data
Supporting Data
Supporting Data
Supporting Data
Supporting Data
Supporting Data
Acknowledgements
Not applicable.
Funding
This study was funded by the São Paulo Research
Foundation (FAPESP) (grant nos. 2011/12297-2 and 2014/24596-2).
Availability of data and materials
The datasets generated and/or analyzed during the
present study are available from the Zenodo repository (https://doi.org/10.5281/zenodo.1181925).
Authors' contributions
SSS conceived the study and designed the
experiments. DRVS, RP, AN, PBC and SSS performed the experiments.
DRVS, RP, PBC and SSS analyzed the data. DRVS, RP, YN, JP, ACPO,
AJSD, JC, PBC, and SSS analyzed the data and involved in drafting
the manuscript. All authors read and approved the final
manuscript.
Ethics approval and consent to
participate
The collection and the use of all samples was
approved by the Ethics Committee for Review of Research Projects
(CAPPesq; approval no. 1235/2017) All patients provided informed
written consent.
Patient consent for publication
Not applicable.
Competing interests
The authors declare that they have no competing
interests.
Glossary
Abbreviations
Abbreviations:
|
sRNA
|
small RNA
|
|
miRNA
|
microRNA
|
|
ncRNA
|
non-coding RNA
|
|
tRNA
|
transfer RNA
|
|
snRNA
|
small nuclear RNA
|
|
snoRNA
|
small nucleolar RNA
|
|
scRNA
|
small cytoplasmic RNA
|
|
PBMC
|
peripheral blood mononuclear cell
|
|
HTLV–I
|
human T-lymphotropic virus type I
|
|
ASM
|
asymptomatic carriers with monoclonal
T cell receptor γ gene rearrangement-
|
|
ASP
|
asymptomatic carriers with polyclonal
T cell receptor γ gene rearrangement
|
|
TCRγ
|
T-cell receptor γ-chain
|
|
ATLL
|
adult T-cell leukemia/lymphoma
|
References
|
1
|
Poiesz BJ, Ruscetti FW, Gazdar AF, Bunn
PA, Minna JD and Gallo RC: Detection and isolation of type C
retrovirus particles from fresh and cultured lymphocytes of a
patient with cutaneous T-cell lymphoma. Proc Natl Acad Sci USA.
77:7415–7419. 1980. View Article : Google Scholar : PubMed/NCBI
|
|
2
|
Gessain A and Cassar O: Epidemiological
aspects and world distribution of HTLV-1 Infection. Front
Microbiol. 3:3882012. View Article : Google Scholar : PubMed/NCBI
|
|
3
|
Matsuoka M: Human T-cell leukemia virus
type I and adult T-cell leukemia. Oncogene. 22:5131–5140. 2003.
View Article : Google Scholar : PubMed/NCBI
|
|
4
|
Verdonck K, Gonzalez E, Van Dooren S,
Vandamme AM, Vanham G and Gotuzzo E: Human T-lymphotropic virus 1:
Recent knowledge about an ancient infection. Lancet Infect Dis.
7:266–281. 2007. View Article : Google Scholar : PubMed/NCBI
|
|
5
|
Franchini G, Ambinder RF and Barry M:
Viral disease in hematology. Hematology Am Soc Hematol Educ
Program. 409–423. 2000. View Article : Google Scholar : PubMed/NCBI
|
|
6
|
Murphy EL, Hanchard B, Figueroa JP, Gibbs
WN, Lofters WS, Campbell M, Goedert JJ and Blattner WA: Modelling
the risk of adult T-cell leukemia/lymphoma in persons infected with
human T-lymphotropic virus type I. Int J Cancer. 43:250–253. 1989.
View Article : Google Scholar : PubMed/NCBI
|
|
7
|
Yamaguchi K and Watanabe T: Human T
lymphotropic virus type-I and adult T-cell leukemia in Japan. Int J
Hematol. 76 (Suppl 2):240–245. 2002. View Article : Google Scholar : PubMed/NCBI
|
|
8
|
Matsuoka M and Jeang KT: Human T-cell
leukaemia virus type 1 (HTLV-1) infectivity and cellular
transformation. Nat Rev Cancer. 7:270–280. 2007. View Article : Google Scholar : PubMed/NCBI
|
|
9
|
Higuchi M and Fujii M: Distinct functions
of HTLV-1 Tax1 from HTLV-2 Tax2 contribute key roles to viral
pathogenesis. Retrovirology. 6:1172009. View Article : Google Scholar : PubMed/NCBI
|
|
10
|
Yoshida M, Seiki M, Yamaguchi K and
Takatsuki K: Monoclonal integration of human T-cell leukemia
provirus in all primary tumors of adult T-cell leukemia suggests
causative role of human T-cell leukemia virus in the disease. Proc
Natl Acad Sci USA. 81:2534–2537. 1984. View Article : Google Scholar : PubMed/NCBI
|
|
11
|
Takeda S, Maeda M, Morikawa S, Taniguchi
Y, Yasunaga J, Nosaka K, Tanaka Y and Matsuoka M: Genetic and
epigenetic inactivation of tax gene in adult T-cell leukemia cells.
Int J Cancer. 109:559–567. 2004. View Article : Google Scholar : PubMed/NCBI
|
|
12
|
Mesnard JM, Barbeau B and Devaux C: HBZ, a
new important player in the mystery of adult T-cell leukemia.
Blood. 108:3979–3982. 2006. View Article : Google Scholar : PubMed/NCBI
|
|
13
|
Nagata Y, Kontani K, Enami T, Kataoka K,
Ishii R, Totoki Y, Kataoka TR, Hirata M, Aoki K, Nakano K, et al:
Variegated RHOA mutations in adult T-cell leukemia/lymphoma. Blood.
127:596–604. 2016. View Article : Google Scholar : PubMed/NCBI
|
|
14
|
Etoh K, Yamaguchi K, Tokudome S, Watanabe
T, Okayama A, Stuver N, Mueller N, Takatsuki K and Matsuoka M:
Rapid quantification of HTLV–I provirus load: Detection of
monoclonal proliferation of HTLV–I-infected cells among blood
donors. Int J Cancer. 81:859–864. 1999. View Article : Google Scholar : PubMed/NCBI
|
|
15
|
Ohshima K, Mukai Y, Shiraki H, Suzumiya J,
Tashiro K and Kikuchi M: Clonal integration and expression of human
T-cell lymphotropic virus type I in carriers detected by polymerase
chain reaction and inverse PCR. Am J Hematol. 54:306–312. 1997.
View Article : Google Scholar : PubMed/NCBI
|
|
16
|
Furukawa Y, Fujisawa J, Osame M, Toita M,
Sonoda S, Kubota R, Ijichi S and Yoshida M: Frequent clonal
proliferation of human T-cell leukemia virus type 1
(HTLV-1)-infected T cells in HTLV-1-associated myelopathy
(HAM-TSP). Blood. 80:1012–1016. 1992. View Article : Google Scholar : PubMed/NCBI
|
|
17
|
Ikeda S, Momita S, Kinoshita K, Kamihira
S, Moriuchi Y, Tsukasaki K, Ito M, Kanda T, Moriuchi R, Nakamura T,
et al: Clinical course of human T-lymphotropic virus type I
carriers with molecularly detectable monoclonal proliferation of T
lymphocytes: Defining a low- and high-risk population. Blood.
82:2017–2024. 1993. View Article : Google Scholar : PubMed/NCBI
|
|
18
|
Carvalho EM and Da Fonseca Porto A:
Epidemiological and clinical interaction between HTLV-1 and
Strongyloides stercoralis. Parasite Immunol. 26:487–497. 2004.
View Article : Google Scholar : PubMed/NCBI
|
|
19
|
Bertone P, Stolc V, Royce TE, Rozowsky JS,
Urban AE, Zhu X, Rinn JL, Tongprasit W, Samanta M, Weissman S, et
al: Global identification of human transcribed sequences with
genome tiling arrays. Science. 306:2242–2246. 2004. View Article : Google Scholar : PubMed/NCBI
|
|
20
|
Djebali S, Davis CA, Merkel A, Lassmann T,
Mortazavi A, Tanzer A, Lagarde J, Lin W, Schlesinger F, Xue C, et
al: Landscape of transcription in human cells. Nature. 489:101–108.
2012. View Article : Google Scholar : PubMed/NCBI
|
|
21
|
Higuchi C, Nakatsuka A, Eguchi J,
Teshigawara S, Kanzaki M, Katayama A, Yamaguchi S, Takahashi N,
Murakami K, Ogawa D, et al: Identification of circulating miR-101,
miR-375 and miR-802 as biomarkers for type 2 diabetes. Metabolism.
64:489–497. 2015. View Article : Google Scholar : PubMed/NCBI
|
|
22
|
van Rooij E, Sutherland LB, Qi X,
Richardson JA, Hill J and Olson EN: Control of stress-dependent
cardiac growth and gene expression by a microRNA. Science.
316:575–579. 2007. View Article : Google Scholar : PubMed/NCBI
|
|
23
|
Esteller M: Non-coding RNAs in human
disease. Nat Rev Genet. 12:861–874. 2011. View Article : Google Scholar : PubMed/NCBI
|
|
24
|
Zhang WC, Chin TM, Yang H, Nga ME, Lunny
DP, Lim EK, Sun LL, Pang YH, Leow YN, Malusay SR, et al:
Tumour-initiating cell-specific miR-1246 and miR-1290 expression
converge to promote non-small cell lung cancer progression. Nat
Commun. 7:117022016. View Article : Google Scholar : PubMed/NCBI
|
|
25
|
Farazi TA, Juranek SA and Tuschl T: The
growing catalog of small RNAs and their association with distinct
Argonaute/Piwi family members. Development. 135:1201–1214. 2008.
View Article : Google Scholar : PubMed/NCBI
|
|
26
|
Mattick JS and Makunin IV: Non-coding RNA.
Hum Mol Genet 15 (Spec No 1). R17–R29. 2006. View Article : Google Scholar
|
|
27
|
Ambros V, Bartel B, Bartel DP, Burge CB,
Carrington JC, Chen X, Dreyfuss G, Eddy SR, Griffiths-Jones S,
Marshall M, et al: A uniform system for microRNA annotation. RNA.
9:277–279. 2003. View Article : Google Scholar : PubMed/NCBI
|
|
28
|
Griffiths-Jones S, Bateman A, Marshall M,
Khanna A and Eddy SR: Rfam: An RNA family database. Nucleic Acids
Res. 31:439–441. 2003. View Article : Google Scholar : PubMed/NCBI
|
|
29
|
Li J, Wu B, Xu J and Liu C: Genome-wide
identification and characterization of long intergenic non-coding
RNAs in Ganoderma lucidum. PLoS One. 9:e994422014. View Article : Google Scholar : PubMed/NCBI
|
|
30
|
Brennecke J, Hipfner DR, Stark A, Russell
RB and Cohen SM: Bantam encodes a developmentally regulated
microRNA that controls cell proliferation and regulates the
proapoptotic gene hid in Drosophila. Cell. 113:25–36. 2003.
View Article : Google Scholar : PubMed/NCBI
|
|
31
|
Wienholds E, Koudijs MJ, van Eeden FJ,
Cuppen E and Plasterk RH: The microRNA-producing enzyme Dicer1 is
essential for zebrafish development. Nat Genet. 35:217–218. 2003.
View Article : Google Scholar : PubMed/NCBI
|
|
32
|
Xu P, Vernooy SY, Guo M and Hay BA: The
Drosophila microRNA Mir-14 suppresses cell death and is required
for normal fat metabolism. Curr Biol. 13:790–795. 2003. View Article : Google Scholar : PubMed/NCBI
|
|
33
|
Bandiera S, Hatem E, Lyonnet S and
Henrion-Caude A: microRNAs in diseases: From candidate to modifier
genes. Clin Genet. 77:306–313. 2010. View Article : Google Scholar : PubMed/NCBI
|
|
34
|
Bueno MJ and Malumbres M: MicroRNAs and
the cell cycle. Biochim Biophys Acta. 1812:592–601. 2011.
View Article : Google Scholar : PubMed/NCBI
|
|
35
|
Pichler K, Schneider G and Grassmann R:
MicroRNA miR-146a and further oncogenesis-related cellular
microRNAs are dysregulated in HTLV-1-transformed T lymphocytes.
Retrovirology. 5:1002008. View Article : Google Scholar : PubMed/NCBI
|
|
36
|
Yeung ML, Yasunaga J, Bennasser Y, Dusetti
N, Harris D, Ahmad N, Matsuoka M and Jeang KT: Roles for microRNAs,
miR-93 and miR-130b, and tumor protein 53-induced nuclear protein 1
tumor suppressor in cell growth dysregulation by human T-cell
lymphotrophic virus 1. Cancer Res. 68:8976–8985. 2008. View Article : Google Scholar : PubMed/NCBI
|
|
37
|
Zhang B, Pan X, Cobb GP and Anderson TA:
microRNAs as oncogenes and tumor suppressors. Dev Biol. 302:1–12.
2007. View Article : Google Scholar : PubMed/NCBI
|
|
38
|
Shenouda SK and Alahari SK: MicroRNA
function in cancer: Oncogene or a tumor suppressor? Cancer
Metastasis Rev. 28:369–378. 2009. View Article : Google Scholar : PubMed/NCBI
|
|
39
|
Lu J, Getz G, Miska EA, Alvarez-Saavedra
E, Lamb J, Peck D, Sweet-Cordero A, Ebert BL, Mak RH, Ferrando AA,
et al: MicroRNA expression profiles classify human cancers. Nature.
435:834–838. 2005. View Article : Google Scholar : PubMed/NCBI
|
|
40
|
Huntzinger E and Izaurralde E: Gene
silencing by microRNAs: contributions of translational repression
and mRNA decay. Nat Rev Genet. 12:99–110. 2011. View Article : Google Scholar : PubMed/NCBI
|
|
41
|
Ruggero K, Corradin A, Zanovello P,
Amadori A, Bronte V, Ciminale V and D'Agostino DM: Role of
microRNAs in HTLV-1 infection and transformation. Mol Aspects Med.
31:367–382. 2010. View Article : Google Scholar : PubMed/NCBI
|
|
42
|
Bellon M, Lepelletier Y, Hermine O and
Nicot C: Deregulation of microRNA involved in hematopoiesis and the
immune response in HTLV–I adult T-cell leukemia. Blood.
113:4914–4917. 2009. View Article : Google Scholar : PubMed/NCBI
|
|
43
|
Ruggero K, Guffanti A, Corradin A, Sharma
VK, De Bellis G, Corti G, Grassi A, Zanovello P, Bronte V, Ciminale
V and D'Agostino DM: Small noncoding RNAs in cells transformed by
human T-cell leukemia virus type 1: A role for a tRNA fragment as a
primer for reverse transcriptase. J Virol. 88:3612–3622. 2014.
View Article : Google Scholar : PubMed/NCBI
|
|
44
|
Heneine W, Khabbaz RF, Lal RB and Kaplan
JE: Sensitive and specific polymerase chain reaction assays for
diagnosis of human T-cell lymphotropic virus type I (HTLV–I) and
HTLV–II infections in HTLV–I/II-seropositive individuals. J Clin
Microbiol. 30:1605–1607. 1992. View Article : Google Scholar : PubMed/NCBI
|
|
45
|
Pessoa R, Watanabe JT, Nukui Y, Pereira J,
Casseb J, de Oliveira AC, Segurado AC and Sanabani SS: Molecular
characterization of human T-cell lymphotropic virus type 1 full and
partial genomes by Illumina massively parallel sequencing
technology. PLoS One. 9:e933742014. View Article : Google Scholar : PubMed/NCBI
|
|
46
|
Shadrach B and Warshawsky I: A comparison
of multiplex and monoplex T-cell receptor gamma PCR. Diagn Mol
Pathol. 13:127–134. 2004. View Article : Google Scholar : PubMed/NCBI
|
|
47
|
Clissa PB, Pessoa R, Ferraz KF, de Souza
DR and Sanabani SS: Data on global expression of non-coding RNome
in mice gastrocnemius muscle exposed to jararhagin, snake venom
metalloproteinase. Data Brief. 9:685–688. 2016. View Article : Google Scholar : PubMed/NCBI
|
|
48
|
Langenberger D, Bermudez-Santana CI,
Stadler PF and Hoffmann S: Identification and classification of
small RNAs in transcriptome sequence data. Pac Symp Biocomput.
80–87. 2010.PubMed/NCBI
|
|
49
|
Hansen KD, Irizarry RA and Wu Z: Removing
technical variability in RNA-seq data using conditional quantile
normalization. Biostatistics. 13:204–216. 2012. View Article : Google Scholar : PubMed/NCBI
|
|
50
|
Livak KJ and Schmittgen TD: Analysis of
relative gene expression data using real-time quantitative PCR and
the 2(-Delta Delta C(T)) method. Methods. 25:402–408. 2001.
View Article : Google Scholar : PubMed/NCBI
|
|
51
|
Mestdagh P, Hartmann N, Baeriswyl L,
Andreasen D, Bernard N, Chen C, Cheo D, D'Andrade P, DeMayo M,
Dennis L, et al: Evaluation of quantitative miRNA expression
platforms in the microRNA quality control (miRQC) study. Nat
Methods. 11:809–815. 2014. View Article : Google Scholar : PubMed/NCBI
|
|
52
|
Motameny S, Wolters S, Nürnberg P and
Schumacher B: Next Generation Sequencing of miRNAs-Strategies,
Resources and Methods. Genes (Basel). 1:70–84. 2010. View Article : Google Scholar : PubMed/NCBI
|
|
53
|
Dias S, Hemmings S, Muller C, Louw J and
Pheiffer C: MicroRNA expression varies according to glucose
tolerance, measurement platform, and biological source. Biomed Res
Int. 2017:10801572017. View Article : Google Scholar : PubMed/NCBI
|
|
54
|
Leshkowitz D, Horn-Saban S, Parmet Y and
Feldmesser E: Differences in microRNA detection levels are
technology and sequence dependent. RNA. 19:527–538. 2013.
View Article : Google Scholar : PubMed/NCBI
|
|
55
|
Tsukasaki K, Tsushima H, Yamamura M, Hata
T, Murata K, Maeda T, Atogami S, Sohda H, Momita S, Ideda S, et al:
Integration patterns of HTLV–I provirus in relation to the clinical
course of ATL: Frequent clonal change at crisis from indolent
disease. Blood. 89:948–956. 1997. View Article : Google Scholar : PubMed/NCBI
|
|
56
|
Wattel E, Vartanian JP, Pannetier C and
Wain-Hobson S: Clonal expansion of human T-cell leukemia virus type
I-infected cells in asymptomatic and symptomatic carriers without
malignancy. J Virol. 69:2863–2868. 1995. View Article : Google Scholar : PubMed/NCBI
|
|
57
|
Moles R and Nicot C: The Emerging Role of
miRNAs in HTLV-1 Infection and ATLL Pathogenesis. Viruses.
7:4047–4074. 2015. View Article : Google Scholar : PubMed/NCBI
|
|
58
|
Van Duyne R, Guendel I, Klase Z, Narayanan
A, Coley W, Jaworski E, Roman J, Popratiloff A, Mahieux R,
Kehn-Hall K and Kashanchi F: Localization and sub-cellular
shuttling of HTLV-1 tax with the miRNA machinery. PLoS One.
7:e406622012. View Article : Google Scholar : PubMed/NCBI
|
|
59
|
Abe M, Suzuki H, Nishitsuji H, Shida H and
Takaku H: Interaction of human T-cell lymphotropic virus type I Rex
protein with Dicer suppresses RNAi silencing. FEBS Lett.
584:4313–4318. 2010. View Article : Google Scholar : PubMed/NCBI
|
|
60
|
Yamagishi M, Nakano K, Miyake A, Yamochi
T, Kagami Y, Tsutsumi A, Matsuda Y, Sato-Otsubo A, Muto S,
Utsunomiya A, et al: Polycomb-mediated loss of miR-31 activates
NIK-dependent NF-kappaB pathway in adult T cell leukemia and other
cancers. Cancer Cell. 21:121–135. 2012. View Article : Google Scholar : PubMed/NCBI
|
|
61
|
Cameron JE, Fewell C, Yin Q, McBride J,
Wang X, Lin Z and Flemington EK: Epstein-Barr virus growth/latency
III program alters cellular microRNA expression. Virology.
382:257–266. 2008. View Article : Google Scholar : PubMed/NCBI
|
|
62
|
Cobb BS, Hertweck A, Smith J, O'Connor E,
Graf D, Cook T, Smale ST, Sakaguchi S, Livesey FJ, Fisher AG and
Merkenschlager M: A role for Dicer in immune regulation. J Exp Med.
203:2519–2527. 2006. View Article : Google Scholar : PubMed/NCBI
|
|
63
|
Tomita M, Tanaka Y and Mori N: MicroRNA
miR-146a is induced by HTLV-1 tax and increases the growth of
HTLV-1-infected T-cells. Int J Cancer. 130:2300–2309. 2012.
View Article : Google Scholar : PubMed/NCBI
|
|
64
|
Deng J, He M, Chen L, Chen C, Zheng J and
Cai Z: The loss of miR-26a-mediated post-transcriptional regulation
of cyclin E2 in pancreatic cancer cell proliferation and decreased
patient survival. PLoS One. 8:e764502013. View Article : Google Scholar : PubMed/NCBI
|
|
65
|
Deng M, Tang HL, Lu XH, Liu MY, Lu XM, Gu
YX, Liu JF and He ZM: miR-26a suppresses tumor growth and
metastasis by targeting FGF9 in gastric cancer. PLoS One.
8:e726622013. View Article : Google Scholar : PubMed/NCBI
|
|
66
|
Lin Y, Chen H, Hu Z, Mao Y, Xu X, Zhu Y,
Xu X, Wu J, Li S, Mao Q, et al: miR-26a inhibits proliferation and
motility in bladder cancer by targeting HMGA1. FEBS Lett.
587:2467–2473. 2013. View Article : Google Scholar : PubMed/NCBI
|
|
67
|
Sander S, Bullinger L, Klapproth K,
Fiedler K, Kestler HA, Barth TF, Möller P, Stilgenbauer S, Pollack
JR and Wirth T: MYC stimulates EZH2 expression by repression of its
negative regulator miR-26a. Blood. 112:4202–4212. 2008. View Article : Google Scholar : PubMed/NCBI
|
|
68
|
Zhang B, Liu XX, He JR, Zhou CX, Guo M, He
M, Li MF, Chen GQ and Zhao Q: Pathologically decreased miR-26a
antagonizes apoptosis and facilitates carcinogenesis by targeting
MTDH and EZH2 in breast cancer. Carcinogenesis. 32:2–9. 2011.
View Article : Google Scholar : PubMed/NCBI
|
|
69
|
Mavrakis KJ, Van Der Meulen J, Wolfe AL,
Liu X, Mets E, Taghon T, Khan AA, Setty M, Rondou P, Vandenberghe
P, et al: A cooperative microRNA-tumor suppressor gene network in
acute T-cell lymphoblastic leukemia (T-ALL). Nat Genet. 43:673–678.
2011. View
Article : Google Scholar : PubMed/NCBI
|
|
70
|
Batchu RB, Gruzdyn OV, Qazi AM, Kaur J,
Mahmud EM, Weaver DW and Gruber SA: Enhanced phosphorylation of p53
by microRNA-26a leading to growth inhibition of pancreatic cancer.
Surgery. 158:981–987. 2015. View Article : Google Scholar : PubMed/NCBI
|
|
71
|
Zhang J, Han C and Wu T: MicroRNA-26a
promotes cholangiocarcinoma growth by activating β-catenin.
Gastroenterology. 143:246–256.e8. 2012. View Article : Google Scholar : PubMed/NCBI
|
|
72
|
Salvatori B, Iosue I, Mangiavacchi A,
Loddo G, Padula F, Chiaretti S, Peragine N, Bozzoni I, Fazi F and
Fatica A: The microRNA-26a target E2F7 sustains cell proliferation
and inhibits monocytic differentiation of acute myeloid leukemia
cells. Cell Death Dis. 3:e4132012. View Article : Google Scholar : PubMed/NCBI
|
|
73
|
Luzi E, Marini F, Sala SC, Tognarini I,
Galli G and Brandi ML: Osteogenic differentiation of human adipose
tissue-derived stem cells is modulated by the miR-26a targeting of
the SMAD1 transcription factor. J Bone Miner Res. 23:287–295. 2008.
View Article : Google Scholar : PubMed/NCBI
|
|
74
|
Chai ZT, Kong J, Zhu XD, Zhang YY, Lu L,
Zhou JM, Wang LR, Zhang KZ, Zhang QB, Ao JY, et al: MicroRNA-26a
inhibits angiogenesis by down-regulating VEGFA through the
PIK3C2α/Akt/HIF-1α pathway in hepatocellular carcinoma. PLoS One.
8:e779572013. View Article : Google Scholar : PubMed/NCBI
|
|
75
|
Qian X, Zhao P, Li W, Shi ZM, Wang L, Xu
Q, Wang M, Liu N, Liu LZ and Jiang BH: MicroRNA-26a promotes tumor
growth and angiogenesis in glioma by directly targeting prohibitin.
CNS Neurosci Ther. 19:804–812. 2013.PubMed/NCBI
|
|
76
|
Calin GA, Liu CG, Sevignani C, Ferracin M,
Felli N, Dumitru CD, Shimizu M, Cimmino A, Zupo S, Dono M, et al:
MicroRNA profiling reveals distinct signatures in B cell chronic
lymphocytic leukemias. Proc Natl Acad Sci USA. 101:11755–11760.
2004. View Article : Google Scholar : PubMed/NCBI
|
|
77
|
O'Donnell KA, Wentzel EA, Zeller KI, Dang
CV and Mendell JT: c-Myc-regulated microRNAs modulate E2F1
expression. Nature. 435:839–843. 2005. View Article : Google Scholar : PubMed/NCBI
|
|
78
|
Calin GA, Sevignani C, Dumitru CD, Hyslop
T, Noch E, Yendamuri S, Shimizu M, Rattan S, Bullrich F, Negrini M
and Croce CM: Human microRNA genes are frequently located at
fragile sites and genomic regions involved in cancers. Proc Natl
Acad Sci USA. 101:2999–3004. 2004. View Article : Google Scholar : PubMed/NCBI
|
|
79
|
Lewis BP, Shih IH, Jones-Rhoades MW,
Bartel DP and Burge CB: Prediction of mammalian microRNA targets.
Cell. 115:787–798. 2003. View Article : Google Scholar : PubMed/NCBI
|
|
80
|
Fukuda RI, Tsuchiya K, Suzuki K, Itoh K,
Fujita J, Utsunomiya A and Tsuji T: HTLV–I Tax regulates the
cellular proliferation through the down-regulation of
PIP3-phosphatase expressions via the NF-κB pathway. Int J Biochem
Mol Biol. 3:95–104. 2012.PubMed/NCBI
|
|
81
|
Liu L, Wang S, Chen R, Wu Y, Zhang B,
Huang S, Zhang J, Xiao F, Wang M and Liang Y: Myc induced
miR-144/451 contributes to the acquired imatinib resistance in
chronic myelogenous leukemia cell K562. Biochem Biophys Res Commun.
425:368–373. 2012. View Article : Google Scholar : PubMed/NCBI
|
|
82
|
Whitman SP, Maharry K, Radmacher MD,
Becker H, Mrózek K, Margeson D, Holland KB, Wu YZ, Schwind S,
Metzeler KH, et al: FLT3 internal tandem duplication associates
with adverse outcome and gene- and microRNA-expression signatures
in patients 60 years of age or older with primary cytogenetically
normal acute myeloid leukemia: A Cancer and Leukemia Group B study.
Blood. 116:3622–3626. 2010. View Article : Google Scholar : PubMed/NCBI
|
|
83
|
Bai XT and Nicot C: miR-28-3p is a
cellular restriction factor that inhibits human T cell leukemia
virus, type 1 (HTLV-1) replication and virus infection. J Biol
Chem. 290:5381–5390. 2015. View Article : Google Scholar : PubMed/NCBI
|
|
84
|
Chen L, Han L, Wei J, Zhang K, Shi Z, Duan
R, Li S, Zhou X, Pu P, Zhang J and Kang C: SNORD76, a box C/D
snoRNA, acts as a tumor suppressor in glioblastoma. Sci Rep.
5:85882015. View Article : Google Scholar : PubMed/NCBI
|
|
85
|
Koduru SV, Tiwari AK, Leberfinger A,
Hazard SW, Kawasawa YI, Mahajan M and Ravnic DJ: A Comprehensive
NGS data analysis of differentially regulated miRNAs, piRNAs,
lncRNAs and sn/snoRNAs in triple negative breast cancer. J Cancer.
8:578–596. 2017. View Article : Google Scholar : PubMed/NCBI
|


