Introduction
Reactive oxygen species (ROS), whose principal
components include superoxide anion (O2−),
hydrogen peroxide (H2O2) and hydroxyl
radical, can be generated in all aerobic cells (1). At normal concentrations, ROS can be
regarded as signalling molecules, whereas high concentrations of
ROS are cytotoxic, often leading to cell death (2). Lung cancer is one of the most malignant
tumours in the respiratory tract, and 85% of lung cancer cases are
non-small cell lung cancer (NSCLC) (3). Previous reports have revealed that
H2O2 may inhibit the proliferation of A549
lung cancer cells via oxidative stress (4,5). A
recent study demonstrated that in lung cancer cells treated with
H2O2, MAPK inhibitors (mainly the JNK
inhibitor) increased O2− and glutathione
depletion, thus leading to cell death (6). Furthermore, oligomeric
proanthocyanidins have been reported to protect A549 cells from
oxidative stress induced by H2O2 through the
Nrf2-antioxidant responsive element signalling pathway (7).
DNA methylation is a biochemical process that occurs
with the addition of methyl groups to cytosines adjacent to
guanines (CpG) by DNA methyltransferases (8). Although DNA methylation is mainly
located in the gene promoter region, it can also occur along the
gene sequence, and different locations correspond to different
effects on the gene expression level (9,10). DNA
methylation can regulate gene expression, as well as maintain the
DNA structure and control the transposable elements; therefore, it
is often associated with various processes, such as tissue
differentiation and disease susceptibility (11,12).
Anglim et al (13) identified
several useful DNA methylation markers for the early detection of
squamous cell lung cancer using DNA methylation profiles. Del Real
et al (14) identified two
long non-coding RNAs that may promote the pathological process of
non-small cell lung cancer by analysing gene expression and
methylation profiles.
In the present study, genome-wide analyses of mRNA
expression and DNA methylation were systematically performed to
evaluate the inhibitory mechanism of H2O2 on
the proliferation of A549 cells. Association analysis of
differentially expressed genes (DEGs) and differentially methylated
regions (DMRs) revealed several genes that may be associated with
the inhibitory process of H2O2 on the
proliferation of A549 cells. The present study may provide novel
insights into the molecular mechanisms underlying the inhibitory
effects of H2O2 on the proliferation of A549
cells, and could contribute to the identification of novel
prognostic or diagnostic markers for lung cancer.
Materials and methods
Cell culture
A549 lung cancer cells were purchased from the Cell
Bank of Type Culture Collection of the Chinese Academy of Sciences.
A549 cells were cultured in RPMI-1640 medium containing 10% FBS
(Ausbian, http://www.viansaga.com/ausbian.html), 2 mM
L-glutamine, 100 U/ml penicillin and 100 mg/ml streptomycin at 37°C
in a 5% CO2 incubator. Cells treated only with culture
medium were used as the control group, whereas cells treated with
H2O2 for 24 h at 37°C with a final
concentration of 200 µM constituted the experimental group. The
original images of H2O2-treated and untreated
A549 cells were captured using a light microscope. After counting,
the cells in both groups were inoculated on corresponding culture
plates for further analysis, with ~106 cells used for
the gene expression microarray and reduced representation
bisulphite sequencing (RRBS).
MTT assay
Cell viability was assessed using the MTT assay.
A549 cells were seeded at a density of 4,000 cells/well in a
96-well plate and incubated with H2O2 at 37°C
for 24 h. Subsequently, 20 µl MTT aqueous solution (5 mg/ml) was
added to each well and the plates were incubated for 4 h at 37°C in
a humidified atmosphere containing 5% CO2. The culture
medium was aspirated and 100 µl DMSO was added to each well.
Finally, ELX800 UV universal microplate reader (Bio-Tek Instruments
Inc.) was used to determine the absorbance at 570 nm with a
reference wavelength of 630 nm.
Half maximal inhibitory concentration
(IC50) calculation
The IC50 value, which is the
concentration that inhibited cell viability to 50% of the control,
was used to evaluate the inhibitory effect of
H2O2 on the proliferation of A549 cells.
GraphPad Prism (version 5; GraphPad Software, Inc.) was used to
calculate the IC50 value from the best-fit of the Hill
slope curve using nonlinear regression analysis: M = 100/1 +
10^[(LogIC50-N) × HillSlope)], where N is the log of the
dose, M is the growth inhibition value normalised to the control
and HillSlope is the unitless slope factor or Hill slope.
ROS assay
The Fluorometric Intracellular ROS Assay kit
(Sigma-Aldrich; Merck KGaA) was used to detect ROS produced by
H2O2-treated A549 cells, according to the
manufacturer's protocol. The assay was performed in 96-well plate
and read using a fluorescence microplate reader resulting in a
fluorometric product (l ex = 490/l em = 520 nm) proportional to the
amount of ROS present.
Identification of DEGs and RRBS
assay
The treated cells were collected by centrifugation
at 8,000 × g at 4°C for 1 min separately, the DNA was extracted
using the cetyltrimethylammonium bromide method according to the
DNA extract kit manufacurer's protocol (Roche Diagnostics) and the
RNA was extracted using TRIzol® (Invitrogen; Thermo
Fisher Scientific, Inc.), according to the operating
instructions.
RRBS assay
After genomic DNA was extracted from the samples,
DNA concentration and integrity were detected using a NanoDrop
spectrophotometer (NanoDrop; Thermo Fisher Scientific, Inc.) and 1%
agarose gel electrophoresis, respectively. The DNA libraries for
bisulphite sequencing were prepared as previously described
(15). Briefly, genomic DNA was
fragmented into 100–300 bp via sonication with a duration 30 sec at
30 sec intervals for 15 cycles at 20 kHz and 4°C (Covaris M220) and
purified using the MiniElute PCR Purification kit (Qiagen, Inc.).
The DNA fragments were end-repaired and a single ‘A’ nucleotide was
added to the 3′-end of the blunt fragments. Subsequently, the
genomic fragments were ligated to methylated sequencing adapters.
Fragments with adapters were bisulphite-converted using the
Methylation-Gold kit (Zymo Research Corp.). Finally, the converted
DNA fragments were amplified via PCR and sequenced using Illumina
HiSeq™ 2500 by Shanghai GeneChem Co., Ltd.
Identification of DEGs: Genome-wide expression
profiling analysis was performed by Genminix Informatics Co., Ltd.
using GeneChip ClarionD Array (Affymetrix; Thermo Fisher
Scientific, Inc.). Briefly, total RNA was separately extracted from
10 individual samples using the RNeasy Mini kit (Qiagen, Inc.).
Double-stranded cDNA was then synthesized, labeled and hybridized
to the gene chip. After hybridization and washing, the slides were
scanned with the GeneChip Operating Software version 4.0
(Affymetrix; Thermo Fisher Scientific, Inc.). Raw data extraction
and subsequent data processing were performed using the Affymetrix
GeneChip Operating Software.
The significant differential analysis was conducted
via unpaired Student's t-tests to identify the DEGs between
H2O2-treated A549 cells and the control
group. Only genes that met the cut-off criteria (adjusted P<0.05
and |Fold Change| >2) were regarded as significantly
differentially expressed. Additionally, the DEGs were clustered
using the hierarchical clustering method and Euclidean distance was
chosen as a measure of the distance between the samples. The
clustering was implemented using the heatmap.2 function in the
gplot R package version 3.6.3 (https://www.rdocumentation.org/packages/gplots/).
Quantitative gene expression analysis
via reverse transcription-quantitative (RT-q)PCR
RT-qPCR assays were performed to validate the
microarray data. Total RNA was extracted from A549 cells using
TRIzol reagent. Single-strand cDNA was synthesized from 1 mg total
RNA using the Prime-Script™ Reagent kit with gDNA Eraser (TransGen
Biotech Co., Ltd.). The steps were 70°C for 5 min, 37°C for 5 min,
42°C for 60 min and 70°C for 10 min to end the reaction. To detect
the mRNA expression levels of the DEGs, qPCR (TaqMan kit; Thermo
Fisher Scientific, Inc.) was conducted on a Q1 PCR system (Applied
Biosystems; Thermo Fisher Scientific, Inc.). The primer sequences
are listed in Table I. The following
thermocycling conditions were applied: 95°C for 30 sec, followed by
40 cycles at 95°C for 5 sec, 60°C for 15 sec and 72°C for 10 sec
and 72°C for 7 min for final extension. Data were presented as a
relative average value ± SEM after normalization with the average
value of the housekeeping gene GAPDH. Direct comparison was
performed between the control and
H2O2-treated groups for the same gene and
2−ΔΔCq method was used for the relative quantification
of gene expression (16).
 | Table I.Primers used for reverse
transcription-quantitative PCR. |
Table I.
Primers used for reverse
transcription-quantitative PCR.
| Primer name | Sequence
(5′→3′) |
|---|
| (h)CDKN3-138-F |
ACAGAAGGACGAACCAGTGAG |
| (h)CDKN3-138-R |
TTGTATTGAACTGGGCGGCT |
| (h)CENPF-99-F |
CGTCCCCGAGAGCAAGTTTAT |
| (h)CENPF-99-R |
TGTAGGCAGCCCTTCTTTCC |
|
(h)HIST1H2BM-151-F |
CGACCATCACTTCGAGGGAG |
|
(h)HIST1H2BM-151-R |
GTCACGGCGGAACTGTTACT |
| GAPDH-127-F
(h) |
CCAGGTGGTCTCCTCTGA |
| GAPDH-127-R
(h) |
GCTGTAGCCAAATCGTTGT |
Functional enrichment analysis of
DEGs
Gene Ontology (GO) analysis, which organises genes
into hierarchical categories and identifies the gene regulatory
network based on biological processes (BP), molecular functions
(MF) and cellular components (CC), was used for the genes and gene
products. Additionally, Kyoto Encyclopedia of Genes and Genomes
(KEGG) pathway analysis was used to identify significant pathways
of the genes and enriched gene products. The Database for
Annotation, Visualization and Integrated Discovery (DAVID;
https:/david.ncifcrf.gov/) was used for GO and
KEGG functional annotation of genes with P<0.05.
Analysis of the bisulphite sequencing
data
Flexbar version 3.0 software (https://github.com/seqan/flexbar) was used to
guarantee the high quality of the sequence reads in three steps: In
step 1, the low-quality base calls were trimmed, step 2 removed the
adaptor and step 3 filtered the PCR duplication. The absolute
methylation level was measured by the enrichment of CpG fractions
in the genome after treatment with sodium bisulfite. The microarray
reads were aligned to the reference sequence and the methylation
called base-by-base in the reads with a coverage >10 using the
software BSMAP (whole genome bisulphite sequence MAPing program,
http://code.google.com/p/bsmap/)
Subsequently, the proportion of cytosine and thymine bases was
calculated at CG positions among the bisulphite sequencing reads
aligned to the reference sequence as the methylation level. The
DMRs were identified using the methylKit R package (from R version
3.6.3).
Association analysis between gene
expression levels and DNA methylation
Genes with significant changes in expression
(P<0.05) were categorised into four groups based on their
changes in gene expression (E) and methylation levels (M): Group 1
corresponds to high methylation and upregulated genes (log2 fold
change >0.5; E+ and M+); Group 2 to high
methylation and downregulated genes (log2 fold change <1.5;
E− and M+); Group 3 to low methylation and
upregulated genes (log2 fold change >1.5; E+ and
M−); and Group 4 to low methylation and downregulated
genes (log2 fold change ≤1.5; E− and M−).
Gene Expression Profiling Interactive Analysis (GEPIA; http://gepia.cancer-pku.cn) was used to analyse the
expression levels and the effects of genes on survival with
methylation level changes in patients with lung adenocarcinoma
(LUAD). GEPIA is a newly developed interactive web server for
analysing the RNA sequencing expression data of 9,736 tumours and
8,587 normal samples from The Cancer Genome Atlas and the
Genotype-Tissue Expression projects, using a standard processing
pipeline.
Statistical analysis
GraphPad Prism (version 5; GraphPad Software, Inc.)
was used for statistical analysis. Data are expressed as the mean ±
standard error of the mean (SEM). The mean was obtained from three
repeats. Differences between two groups were analysed using
unpaired Student's t-tests, whereas ≥3 groups were analysed via
one-way ANOVA followed by Tukey's post hoc test. In the
Kaplan-Meier analysis log-rank test was conducted to assess the
survival, or Cramer-von Mises when crossover occurred. All tests
performed were two-sided. P<0.05 was considered to indicate a
statistically significant difference.
Results
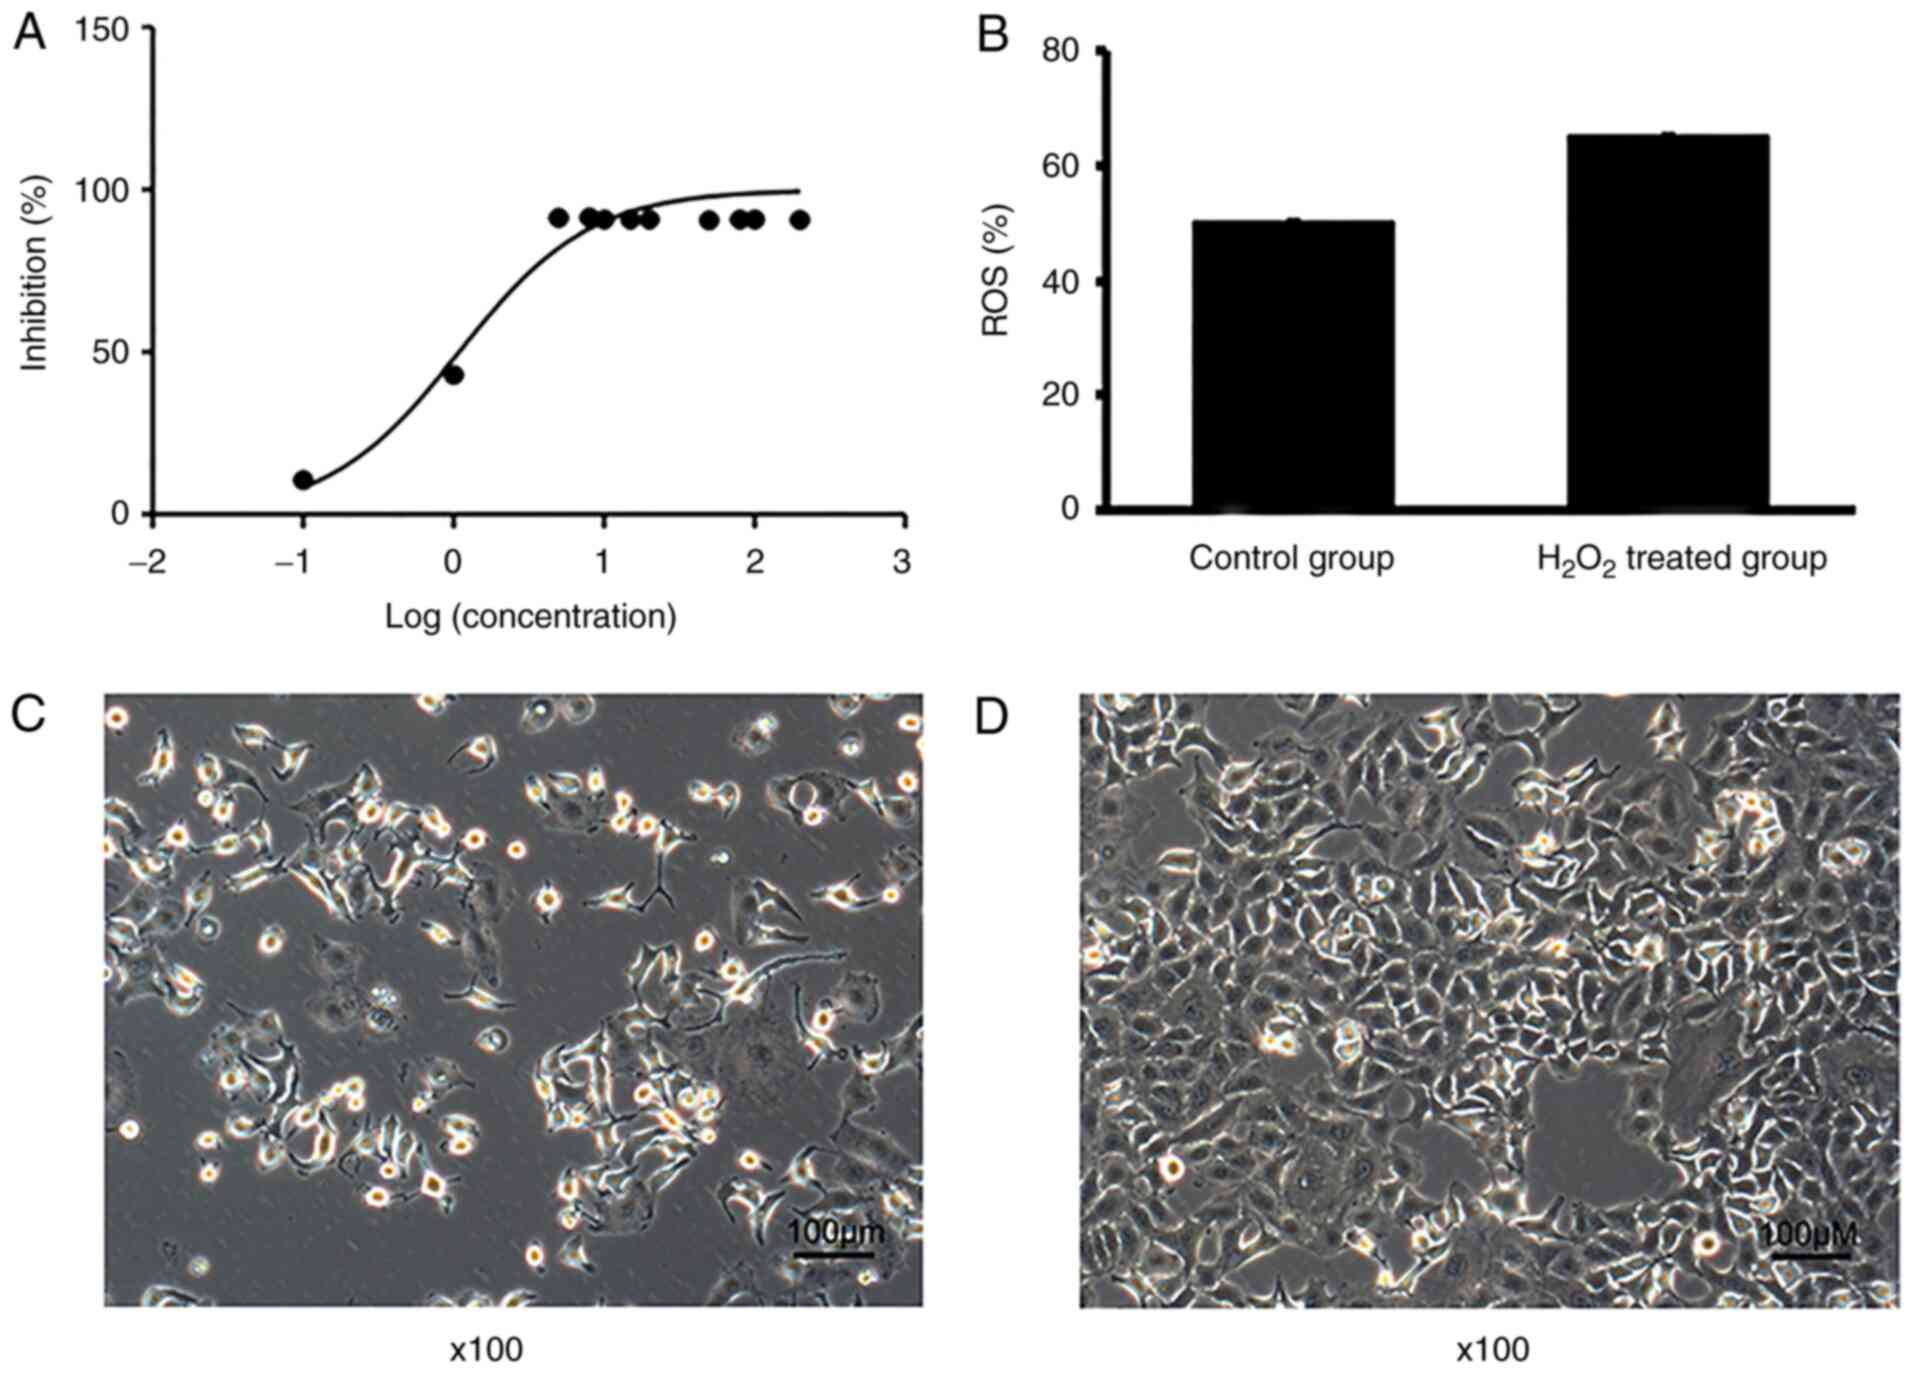
Inhibitory effects of
H2O2 on the proliferation of A549 cells
The inhibitory effect of H2O2
on the proliferation of A549 cells was concentration-dependent
(Fig. 1A), with an IC50
of 1.09 mg/l. In addition, the ROS production of A549 cells was
markedly increased compared with that of the control group
(Fig. 1B). The original images of
H2O2-treated and untreated A549 cells were
captured using a light microscope (Fig.
1C and D) further confirmed that H2O2
inhibited the proliferation of A549 cells.
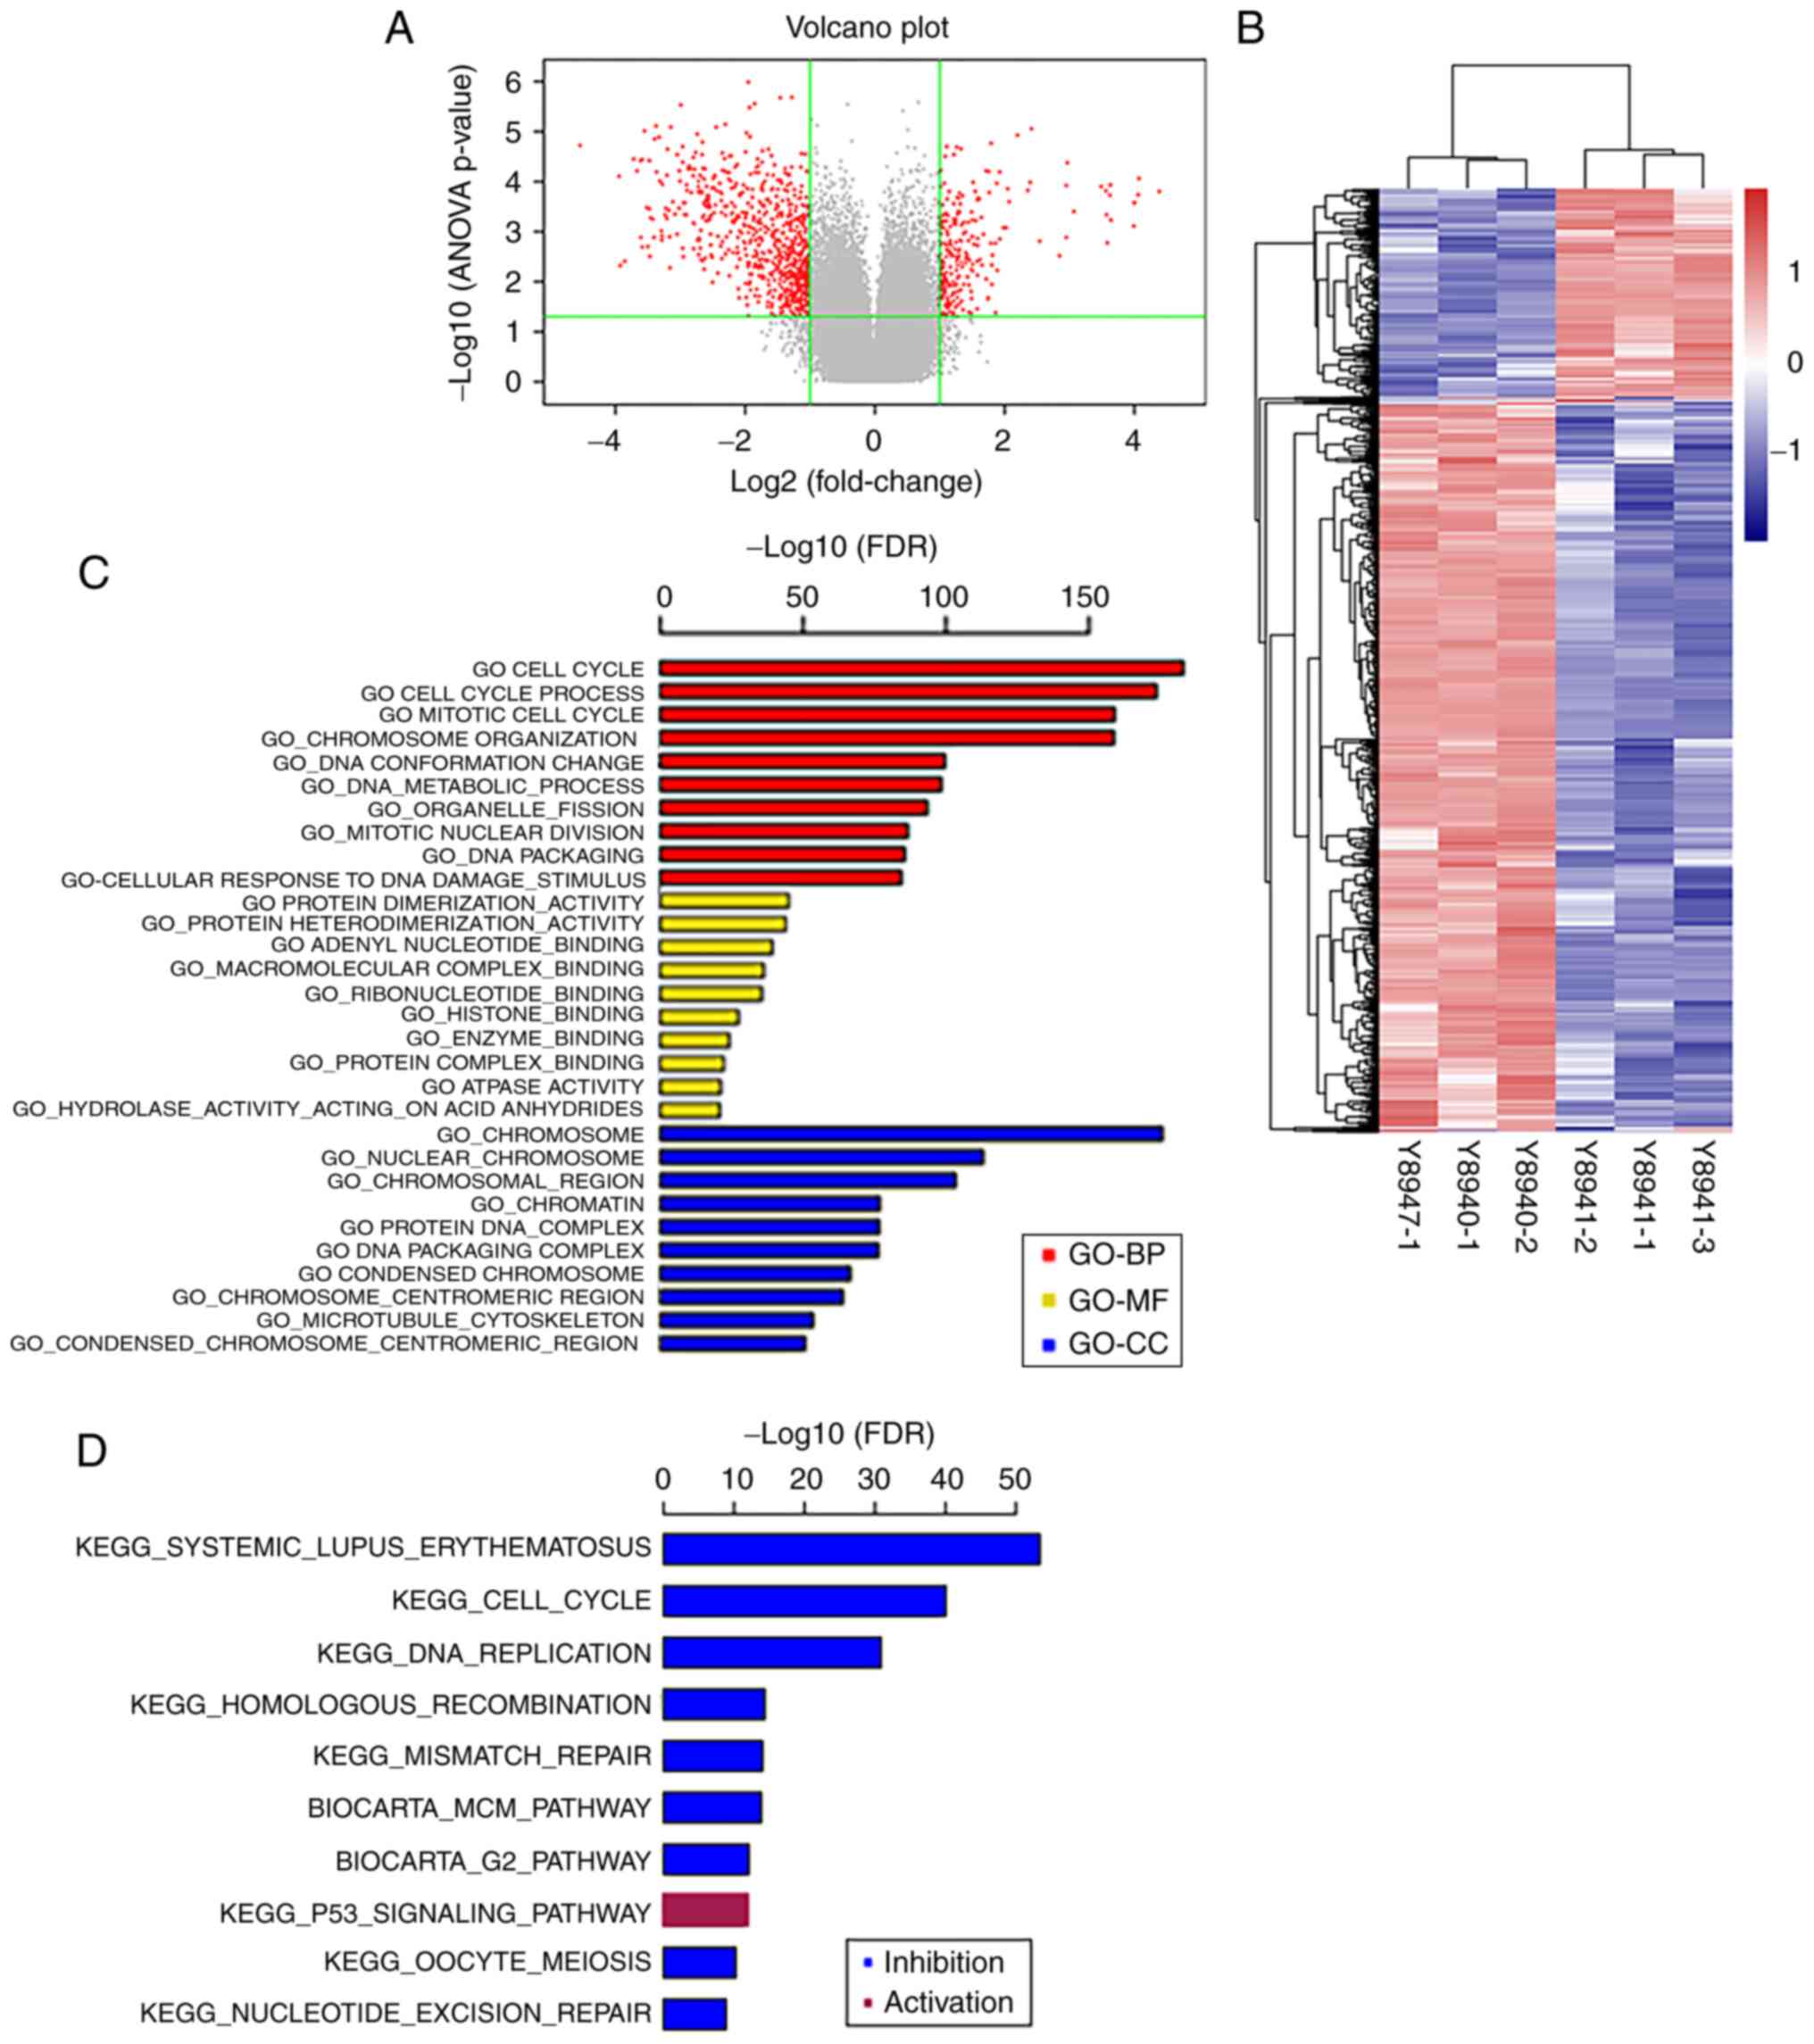
Analysis of the mRNA expression
profiles
A total of 1,026 DEGs, 261 upregulated and 765
downregulated, were identified in
H2O2-treated A549 cells compared with the
control group (Fig. 2A). The heatmap
of hierarchical clustering of the DEGs is shown in Fig. 2B. There were 261 upregulated and 766
downregulated genes between H2O2-treated A549
cells and the control group. The online analysis tool DAVID was
used to identify statistically significant enriched GO terms for
the DEGs between the H2O2-treated and control
groups (Fig. 2C), indicating that
the DEGs were mainly enriched in BP, such as ‘cell cycle’, ‘cell
cycle process’ and ‘mitotic cell cycle’. Regarding CC, they were
enriched in ‘chromosome’, ‘nuclear chromosome’ and ‘chromosomal
region’. In addition, MF analysis revealed that the genes were
enriched in ‘protein dimerization activity’, ‘protein
heterodimerization activity’, ‘adenyl nucleotide binding’ and
‘macromolecular complex binding’. KEGG analysis revealed that the
DEGs were enriched in ‘systemic lupus erythematosus’, ‘cell cycle’,
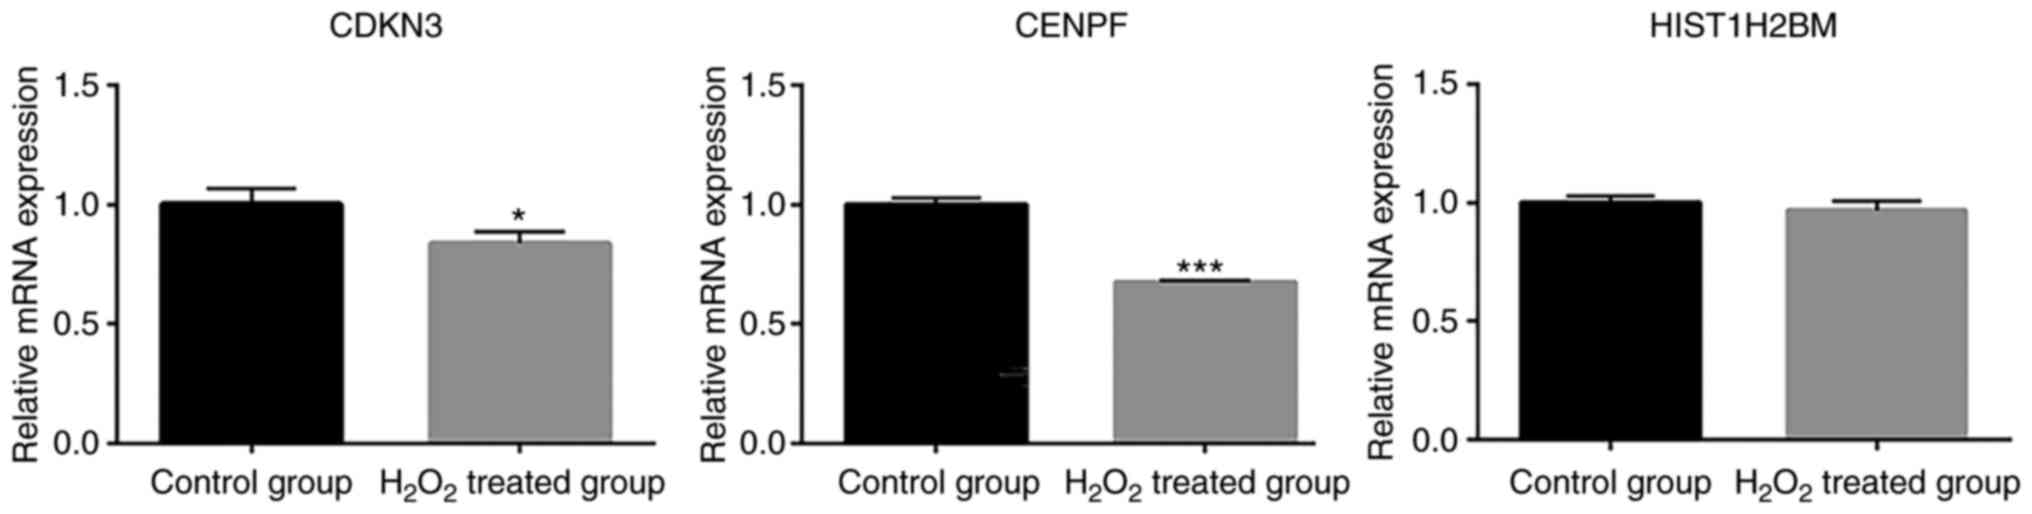
‘DNA replication’ and ‘homologous recombination’ (Fig. 2D). qPCR was used to verify the
expression levels of DEGs in A549 cells (Fig. 3). Association analysis of the gene
expression and methylation levels revealed that several genes were
downregulated and hypermethylated, including cyclin-dependent
kinase inhibitor 3, denticleless E3 ubiquitin protein ligase
homolog, centromere protein (CENP)F, kinesin family member
(KIF)20A, CENPA, KIF11, PCNA clamp associated factor (PAF) and GINS
complex subunit 2. Therefore, these genes were chosen to be
verified by qPCR. Consistent with the gene expression microarray,
the expression levels of cyclin-dependent kinase inhibitor 3
(CDKN3; NCBI_1033) and centromere protein (CENP)F (NCBI_1063) were
significantly downregulated in H2O2-treated
A549 cells compared with those in untreated cells (Fig. 3). The expression levels of H2B
clustered histone 14 (H2BC14 NCBI_8342) were decreased slightly in
H2O2-treated A549 cells, which was also
consistent with the microarray results.
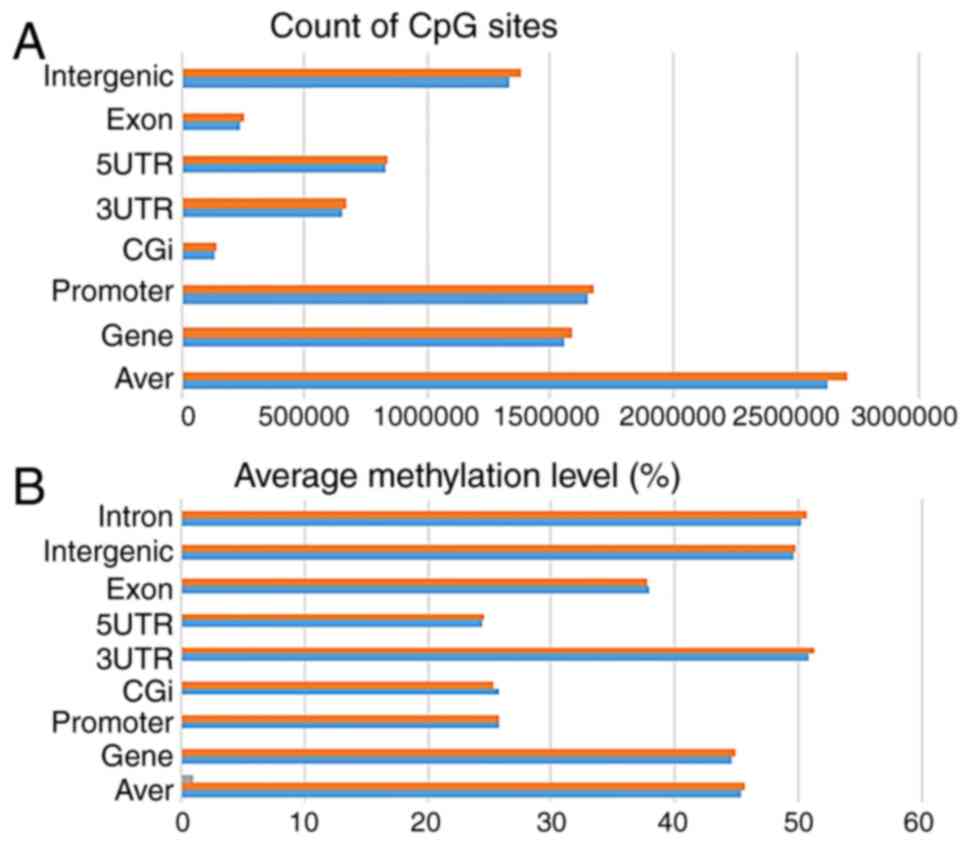
Analysis of the DNA methylation
expression profiles
RRBS was used to annotate differentially methylated
sites between H2O2-treated A549 cells and the
control group. The CpGs were grouped based on the genomic position,
with a similar distribution of CpGs in both groups (Fig. 4A). Additionally, the average
methylation level was calculated, with a similar distribution in
both groups (Fig. 4B). In total,
29,755 differentially methylated CpG sites were identified; 15,365
of them were more methylated and 14,390 were less methylated in the
A549 cells treated with H2O2 compared with in
the untreated cells. Among the differentially methylated CpG sites,
the top 20 were annotated (Table
II). The differences in methylation levels in the same region
between two samples was calculated to identify the DMRs. The top 10
DMRs were annotated (Table III),
suggesting that there was a difference in the methylation levels
between the two groups. In addition, the analysis at the region
level revealed that 1,575 DMRs occurred in the gene promoters. GO
analysis revealed that the genes were enriched in the terms
‘extracellular space’, ‘extracellular matrix’, ‘neuron protein’ and
‘perikaryon’ (Table IV). KEGG
pathway analysis revealed that the genes were enriched in
‘hsa04723: Retrograde endocannabinoid signalling’, ‘hsa05032:
morphine addiction’ and ‘hsa04726: Serotonergic synapse’ (Table V).
| Table II.Top 20 hypermethylated and top 20
hypomethylated CpG sites between the
H2O2-treated and control groups. |
Table II.
Top 20 hypermethylated and top 20
hypomethylated CpG sites between the
H2O2-treated and control groups.
| Chromosome | Position | Strand | P-value | q value | meth.diff (%) | Gene | Gene type | Function
element |
|---|
| chr17 | 78452227 | – |
2.56×10⁻²⁴ |
1.99×10⁻²⁰ | 83.53 | NA | NA | Intergenic |
| chr9 | 140951580 | – |
1.95×10⁻²¹ |
6.20×10⁻¹⁸ | 81.25 | CACNA1B | Protein_coding | Gene |
| chr11 | 973547 | + |
8.04×10⁻²⁸ |
1.89×10⁻²³ | 79.07 | AP2A2 | Protein_coding | Gene |
| chr1 | 241588198 | – |
7.38×10⁻¹⁹ |
1.04×10⁻¹⁵ | 78.81 | RP11-527D7.1 | lincRNA | Gene |
| chr6 | 26210354 | + |
1.60×10⁻²⁹ |
7.75×10⁻²⁵ | 77.46 | NA | NA | Intergenic |
| chr15 | 44068996 | + |
9.65×10⁻¹⁵ |
3.34×10⁻¹² | 76.54 | RP11-296A16.1 | Protein_coding | Gene |
| chr11 | 19893199 | + |
1.90×10⁻¹⁷ |
1.70×10⁻¹⁴ | 76.37 | NAV2 | Protein_coding | Gene |
| chr16 | 65732093 | + |
5.75×10⁻¹⁴ |
1.50×10⁻¹¹ | 76.28 | NA | NA | Intergenic |
| chr8 | 95654198 | + |
1.25×10⁻²¹ |
4.43×10⁻¹⁸ | 75.61 | ESRP1 | Protein_coding | Gene |
| chrX | 133119214 | + |
3.80×10⁻¹⁸ |
4.25×10⁻¹⁵ | 74.86 | GPC3 | Protein_coding | Gene |
| chrX | 153734771 | + |
2.39×10⁻²⁹ |
1.04×10⁻²⁴ | 73.91 | FAM3A | Protein_coding | Gene |
| chr7 | 157697656 | + |
7.23×10⁻²⁵ |
6.57×10⁻²¹ | 73.88 | PTPRN2 | Protein_coding | Gene |
| chr11 | 64659131 | – |
5.57×10⁻²² |
2.16×10⁻¹⁸ | 73.82 | MIR194-2 | lincRNA | Gene |
| chr4 | 131947017 | – |
9.96×10⁻¹⁷ |
6.84×10⁻¹⁴ | NA | NA | NA | Intergenic |
| chr17 | 78452271 | – |
3.26×10⁻¹⁹ |
5.17×10⁻¹⁶ | 73.02 | NA | NA | Intergenic |
| chr20 | 61983851 | – |
7.26×10⁻¹⁵ |
2.61×10⁻¹² | 72.55 | CHRNA4 | Protein_coding | Gene |
| chr2 | 467136 | – |
2.11×10⁻¹⁸ |
2.56×10⁻¹⁵ | 72.25 | NA | NA | Intergenic |
| chr7 | 426119 | + |
2.46×10⁻¹² |
3.61×10⁻¹⁰ | 71.92 | NA | NA | Intergenic |
| chr8 | 8632457 | – |
2.46×10⁻²⁵ |
2.50×10⁻²¹ | 71.11 | RP11-211C9.1 | lincRNA | Gene |
| chr15 | 44069009 | + |
4.02×10⁻¹² |
5.46×10⁻¹⁰ | 70.47 | RP11-296A16.1 | Protein_coding | Gene |
| chr16 | 34622413 | + |
8.19×10⁻²⁰ |
1.57×10⁻¹⁶ | −87.5 | RP11-488I20.3 | lincRNA | Gene |
| chr3 | 32858837 | + |
3.20×10⁻²⁸ |
8.63×10⁻²⁴ | −83.04 | TRIM71 | Protein_coding | Promoter |
| chr16 | 34622419 | + |
2.00×10⁻¹⁷ |
1.77×10⁻¹⁴ | −81.25 | RP11-488I20.3 | lincRNA | Gene |
| chr9 | 136150995 | + |
1.11×10⁻¹⁵ |
5.36×10⁻¹³ | −81.09 | ABO |
Processed_transcript | Promoter |
| chr15 | 62110720 | – |
1.23×10⁻²¹ |
4.39×10⁻¹⁸ | −80.31 | NA | NA | Intergenic |
| chr3 | 38071105 | + |
3.97×10⁻³⁰ |
2.34×10⁻²⁵ | −80.22 | PLCD1 | Protein_coding | Gene |
| chr19 | 1323858 | – |
5.41×10⁻²⁸ |
1.34×10⁻²³ | −79.82 | MUM1 | Protein_coding | Gene |
| chr15 | 79092872 | – |
3.36×10⁻¹⁶ |
1.94×10⁻¹³ | −78.5 | ADAMTS7 | Protein_coding | Gene |
| chr19 | 47979937 | – |
9.68×10⁻²¹ |
2.47×10⁻¹⁷ | −76.98 | KPTN | Protein_coding | Gene |
| chr19 | 39342337 | – |
3.42×10⁻²² |
1.41×10⁻¹⁸ | −76.4 | HNRNPL | Protein_coding | Gene |
| chr5 | 179228528 | – |
1.87×10⁻²⁰ |
4.36×10⁻¹⁷ | −75.95 | MGAT4B | Protein_coding | Gene |
| chr1 | 216275907 | + |
1.71×10⁻¹⁸ |
2.16×10⁻¹⁵ | −75.06 | USH2A | Protein_coding | Gene |
| chr3 | 109051010 | – |
1.61×10⁻¹⁸ |
2.05×10⁻¹⁵ | −74.89 | DPPA4 | Protein_coding | Gene |
| chr4 | 81111777 | + |
1.42×10⁻¹⁹ |
2.50×10⁻¹⁶ | −73.33 | PRDM8 | Protein_coding | Gene |
| chr3 | 13816124 | + |
1.33×10⁻¹⁸ |
1.73×10⁻¹⁵ | −72.31 | NA | NA | Intergenic |
| chr10 | 79470698 | – |
1.63×10⁻²⁰ |
3.87×10⁻¹⁷ | −72.08 | NA | NA | Intergenic |
| chr14 | 104940386 | + |
4.22×10⁻¹⁹ |
6.40×10⁻¹⁶ | −71.71 | NA | NA | Intergenic |
| chr10 | 123389019 | + |
4.70×10⁻¹⁶ |
2.57×10⁻¹³ | −71.57 | NA | NA | Intergenic |
| chr16 | 60247513 | – |
1.19×10⁻¹⁴ |
3.98×10⁻¹² | −71.48 | NA | NA | Intergenic |
| chr1 | 53098973 | + |
2.36×10⁻¹⁵ |
1.01×10⁻¹² | −70.82 | FAM159A | Protein_coding | Promoter |
| Table III.Top 10 hypermethylated and top 10
hypomethylated CpG regions between the
H2O2-treated and control groups. |
Table III.
Top 10 hypermethylated and top 10
hypomethylated CpG regions between the
H2O2-treated and control groups.
| Chromosome | Start | End | P-value | meth.diff (%) | Gene | Gene type | Function
element |
|---|
| chr10 | 3558001 | 3559000 |
3.29×10−51 | 74.40 | NA | NA | Intergenic |
| chr4 | 110000000 | 110000000 |
8.88×10⁻²⁷ | 70.70 | CCDC109B | Protein_coding | Gene |
| chr16 | 68293001 | 68294000 |
6.80×10⁻²⁴ | 68.70 | PLA2G15 | Protein_coding | Gene |
| chr15 | 85383001 | 85384000 |
5.03×10⁻²¹ | 67.80 | ALPK3 | Protein_coding | Gene |
| chr17 | 7696001 | 7697000 |
1.36×10⁻²⁶ | 66.90 | DNAH2 | Protein_coding | Gene |
| chr5 | 10620001 | 10621000 |
9.08×10−36 | 65.00 | ANKRD33B | Protein_coding | Gene |
| chr5 | 68631001 | 68632000 |
3.05×10⁻²⁷ | 64.20 | CCDC125 | Protein_coding | Promoter |
| chr19 | 13025001 | 13026000 |
9.50×10⁻¹⁹ | 63.50 | GCDH | Protein_coding | Gene |
| chr20 | 62044001 | 62045000 |
6.57×10⁻²⁸ | 61.20 | KCNQ2 | Protein_coding | Gene |
| chr11 | 6705001 | 6706000 |
1.19×10−89 | 60.10 | MRPL17 | Protein_coding | Promoter |
| chr17 | 1112001 | 1113000 |
1.15×10⁻²⁰ | −72.40 |
| Protein_coding | Gene |
| chr9 | 126000000 | 126000000 |
4.44×10⁻¹⁸ | −69.00 | DENND1A | Protein_coding | Gene |
| chr15 | 86220001 | 86221000 |
4.86×10⁻¹⁷ | −65.60 | AKAP13 | Protein_coding | Gene |
| chr11 | 66061001 | 66062000 |
7.37×10⁻³⁵ | −65.20 | TMEM151A | Protein_coding | Gene |
| chr15 | 72412001 | 72413000 |
1.35×10⁻²⁰ | −65.10 | SENP8 | Protein_coding | Gene |
| chr1 | 67323001 | 67324000 |
5.58×10⁻²² | −64.70 | WDR78 | Protein_coding | Gene |
| chr22 | 37572001 | 37573000 |
2.11×10⁻¹⁷ | −64.10 | RP1-151B14.6 | Antisense | Gene |
| chr7 | 105000000 | 105000000 |
2.25×10⁻²³ | −63.80 | RINT1 | Protein_coding | Gene |
| chr16 | 65731001 | 65732000 |
1.97×10⁻¹⁷ | −62.50 | NA | NA | Intergenic |
| chr20 | 50471001 | 50472000 |
3.02×10⁻¹⁶ | −61.70 | RP5-1112F19.2 | lincRNA | Gene |
| Table IV.GO analysis of the genes with
differentially methylated regions in the promoter of genes. |
Table IV.
GO analysis of the genes with
differentially methylated regions in the promoter of genes.
| Category | Term | Count | Genes |
|---|
|
GOTERM_CC_DIRECT |
GO:0005615~extracellular space | 88 | GDF3, PXDN, NOG,
SLURP1, LYPD3, IL16, KIAA0556, GDF6, LTBP4, EDN2, CRHBP, TNFSF14,
TNFSF13, DLK1, MCF2L, MMRN2, SCT, GPC5, AZGP1, APOE, CETP, CFD,
ACTN4, IL27, ZNF649, C10ORF99, CST1, MFGE8, CBR3, SSPO, CTSV, PROC,
RETN, CBLN4, AMH, CHGA, THBD, GNB2, SERPINF1, F3, SERPINB8, CPXM1,
ULBP2, NPPC, C1QL4, UBB, WNT9A, ADAMTS5, TF, RBP4, MFNG, PODN,
PRTN3, NDP, CLU, DSCAML1, PF4, CXCL6, NRN1, CCL5, CHIT1, ADCYAP1,
CPZ, AGT, LEFTY2, TFF2, VWC2L, ENTPD6, HGFAC, OLFM1, BMP4, FLRT3,
BGLAP, PRSS57, HSPG2, TNFSF9, FRZB, KRT35, CLEC11A, MUC4, NBL1,
TSLP, DKK3, PPIA, KRT78, LIPG, NRN1L, METRNL |
|
GOTERM_CC_DIRECT |
GO:0031012~extracellular matrix | 26 | FGFR2, HIST1H4L,
PXDN, PRTN3, LTBP4, NDP, ADAMTSL5, CLU, HSPG2, MMP17, MFGE8,
EMILIN3, NDNF, COL5A1, RPS3, MMRN2, LAMA2, SERPINF1, APOE, F3,
LEFTY2, HIST1H4E, ADAMTS10, TGFB1I1, B4GALT7, HSPA9 |
|
GOTERM_CC_DIRECT | GO:0043005~neuron
projection | 22 | GDI1, ACTN4,
SLC6A12, ADCYAP1R1, SLC6A4, WRN, ATP13A2, SHANK2, CTSV, SHANK3,
TRPM2, SLC32A1, ATP2B4, P2RX1, HDAC1, ARPC2, BCL11B, CHRNB4, ABAT,
CYGB, NSMF, UBB |
|
GOTERM_CC_DIRECT |
GO:0043204~perikaryon | 12 | SLC8A3, MAPK1,
BGLAP, CRHBP, EFNA2, CNTNAP2, NSMF, NTSR1, CTSV, OLFM1, TRPM2,
NEURL1 |
|
GOTERM_CC_DIRECT |
GO:0048471~perinuclear region of
cytoplasm | 41 | SLC8A3, NANOS3, TF,
MAL2, HIP1R, ABCD1, SLC39A13, SLC39A12, CLU, TRAPPC2L, CABP7,
PLVAP, NXT2, SLK, NMRAL1, ARHGAP1, MMD2, NDRG2, EHD2, C9ORF24,
CCAR1, DLG1, ACTN4, LDB3, CIDEB, ACKR3, TPD52L2, KAT5, PRKCD, MT1X,
CHGA, SERPINF1, HDAC1, GNB2, VAMP8, TPPP, ATP9A, CDK2AP1, MEX3D,
ABL1, NEURL1 |
| Table V.KEGG pathway analysis of the genes
with differentially methylated regions in the promoter of
genes. |
Table V.
KEGG pathway analysis of the genes
with differentially methylated regions in the promoter of
genes.
| KEGG pathway | Count | P-value | Genes |
|---|
| hsa04723:Retrograde
endocannabinoid signaling | 13 |
7.62×10⁻⁴ | GABRD, GABRG2,
GABRG3, CACNA1S, KCNJ3, GRM1, SLC32A1, GNG8, GNGT1, MAPK1, GNB2,
FAAH, GNG4 |
| hsa05032:Morphine
addiction | 12 | ≤0.001 | GNG8, GABRD,
SLC32A1, GNGT1, GABRG2, GABRG3, GNB2, PDE1C, GRK4, PDE4D, GNG4,
KCNJ3 |
|
hsa04726:Serotonergic synapse | 13 | ≤0.001 | MAOA, SLC6A4, RAF1,
CACNA1S, KCNJ3, GNG8, MAPK1, GNGT1, ALOX15, HTR1B, GNB2, GNG4,
HTR2A |
|
hsa04724:Glutamatergic synapse | 13 | ≤0.001 | GRIK1, GRM1, KCNJ3,
SHANK2, SHANK3, GNG8, GRM4, MAPK1, GNGT1, GNB2, PPP3CC, GNG4,
SLC1A1 |
| hsa04727:GABAergic
synapse | 10 | ≤0.001 | GNG8, GABRD,
SLC32A1, GNGT1, GABRG2, GABRG3, GNB2, ABAT, GNG4, CACNA1S |
| hsa05020:Prion
diseases | 5 | ≤0.001 | C1QA, MAPK1, NCAM2,
C1QB, CCL5 |
Association analysis of gene
expression and methylation levels
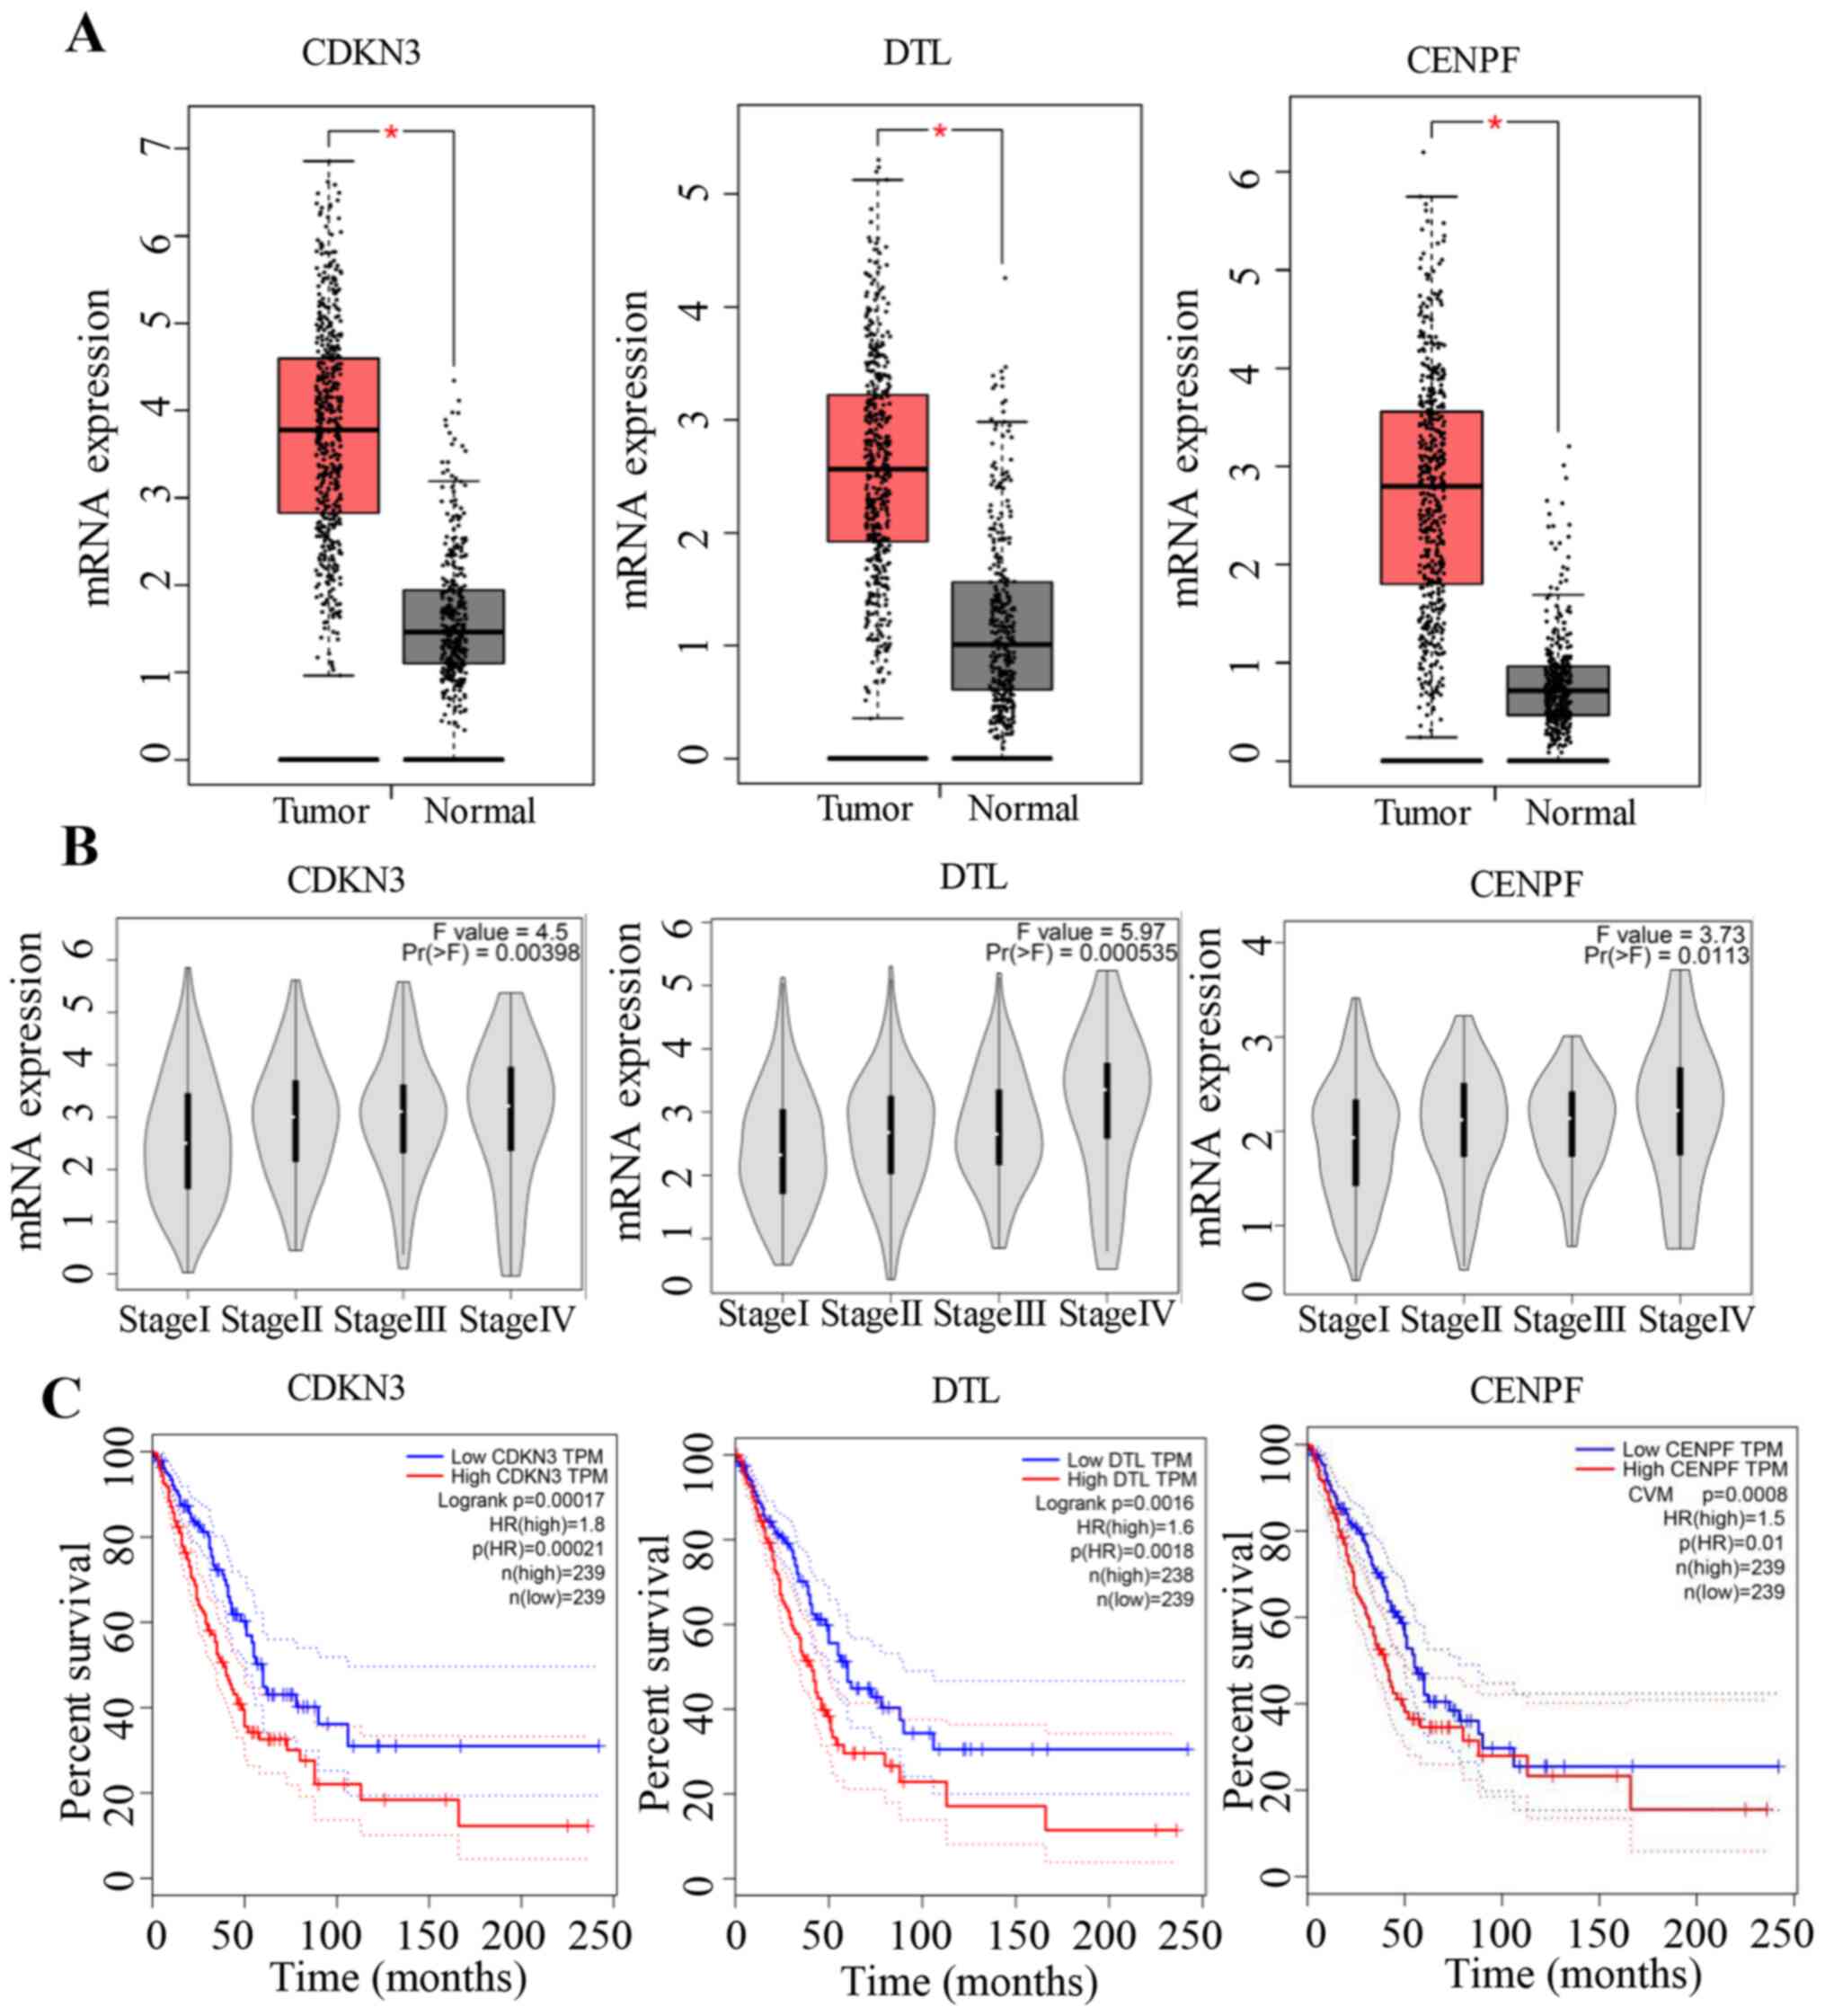
The association analysis indicated that genes with a
high methylation difference always resulted in a difference in the
gene expression levels. Regarding hypermethylation located in the
gene body, the top genes that showed greatest difference in
methylation between groups included H2BC14 (NCBI_8342), CDKN3
(NCBI_1033), denticleless E3 ubiquitin protein ligase homolog (DTL;
NCBI_51514) and CENPF (NCBI_1063) (data not shown). Consistent with
the present results, all genes except H2BC14 were upregulated in
LUAD tumour tissues compared with normal tissues when analysing the
gene expression profiling data using the online tool GEPIA
(Fig. 5A). Furthermore, the gene
expression levels increased with increasing stages of LUAD
(Fig. 5B), and low expression levels
were associated with improved survival compared with high
expression levels (Fig. 5C).
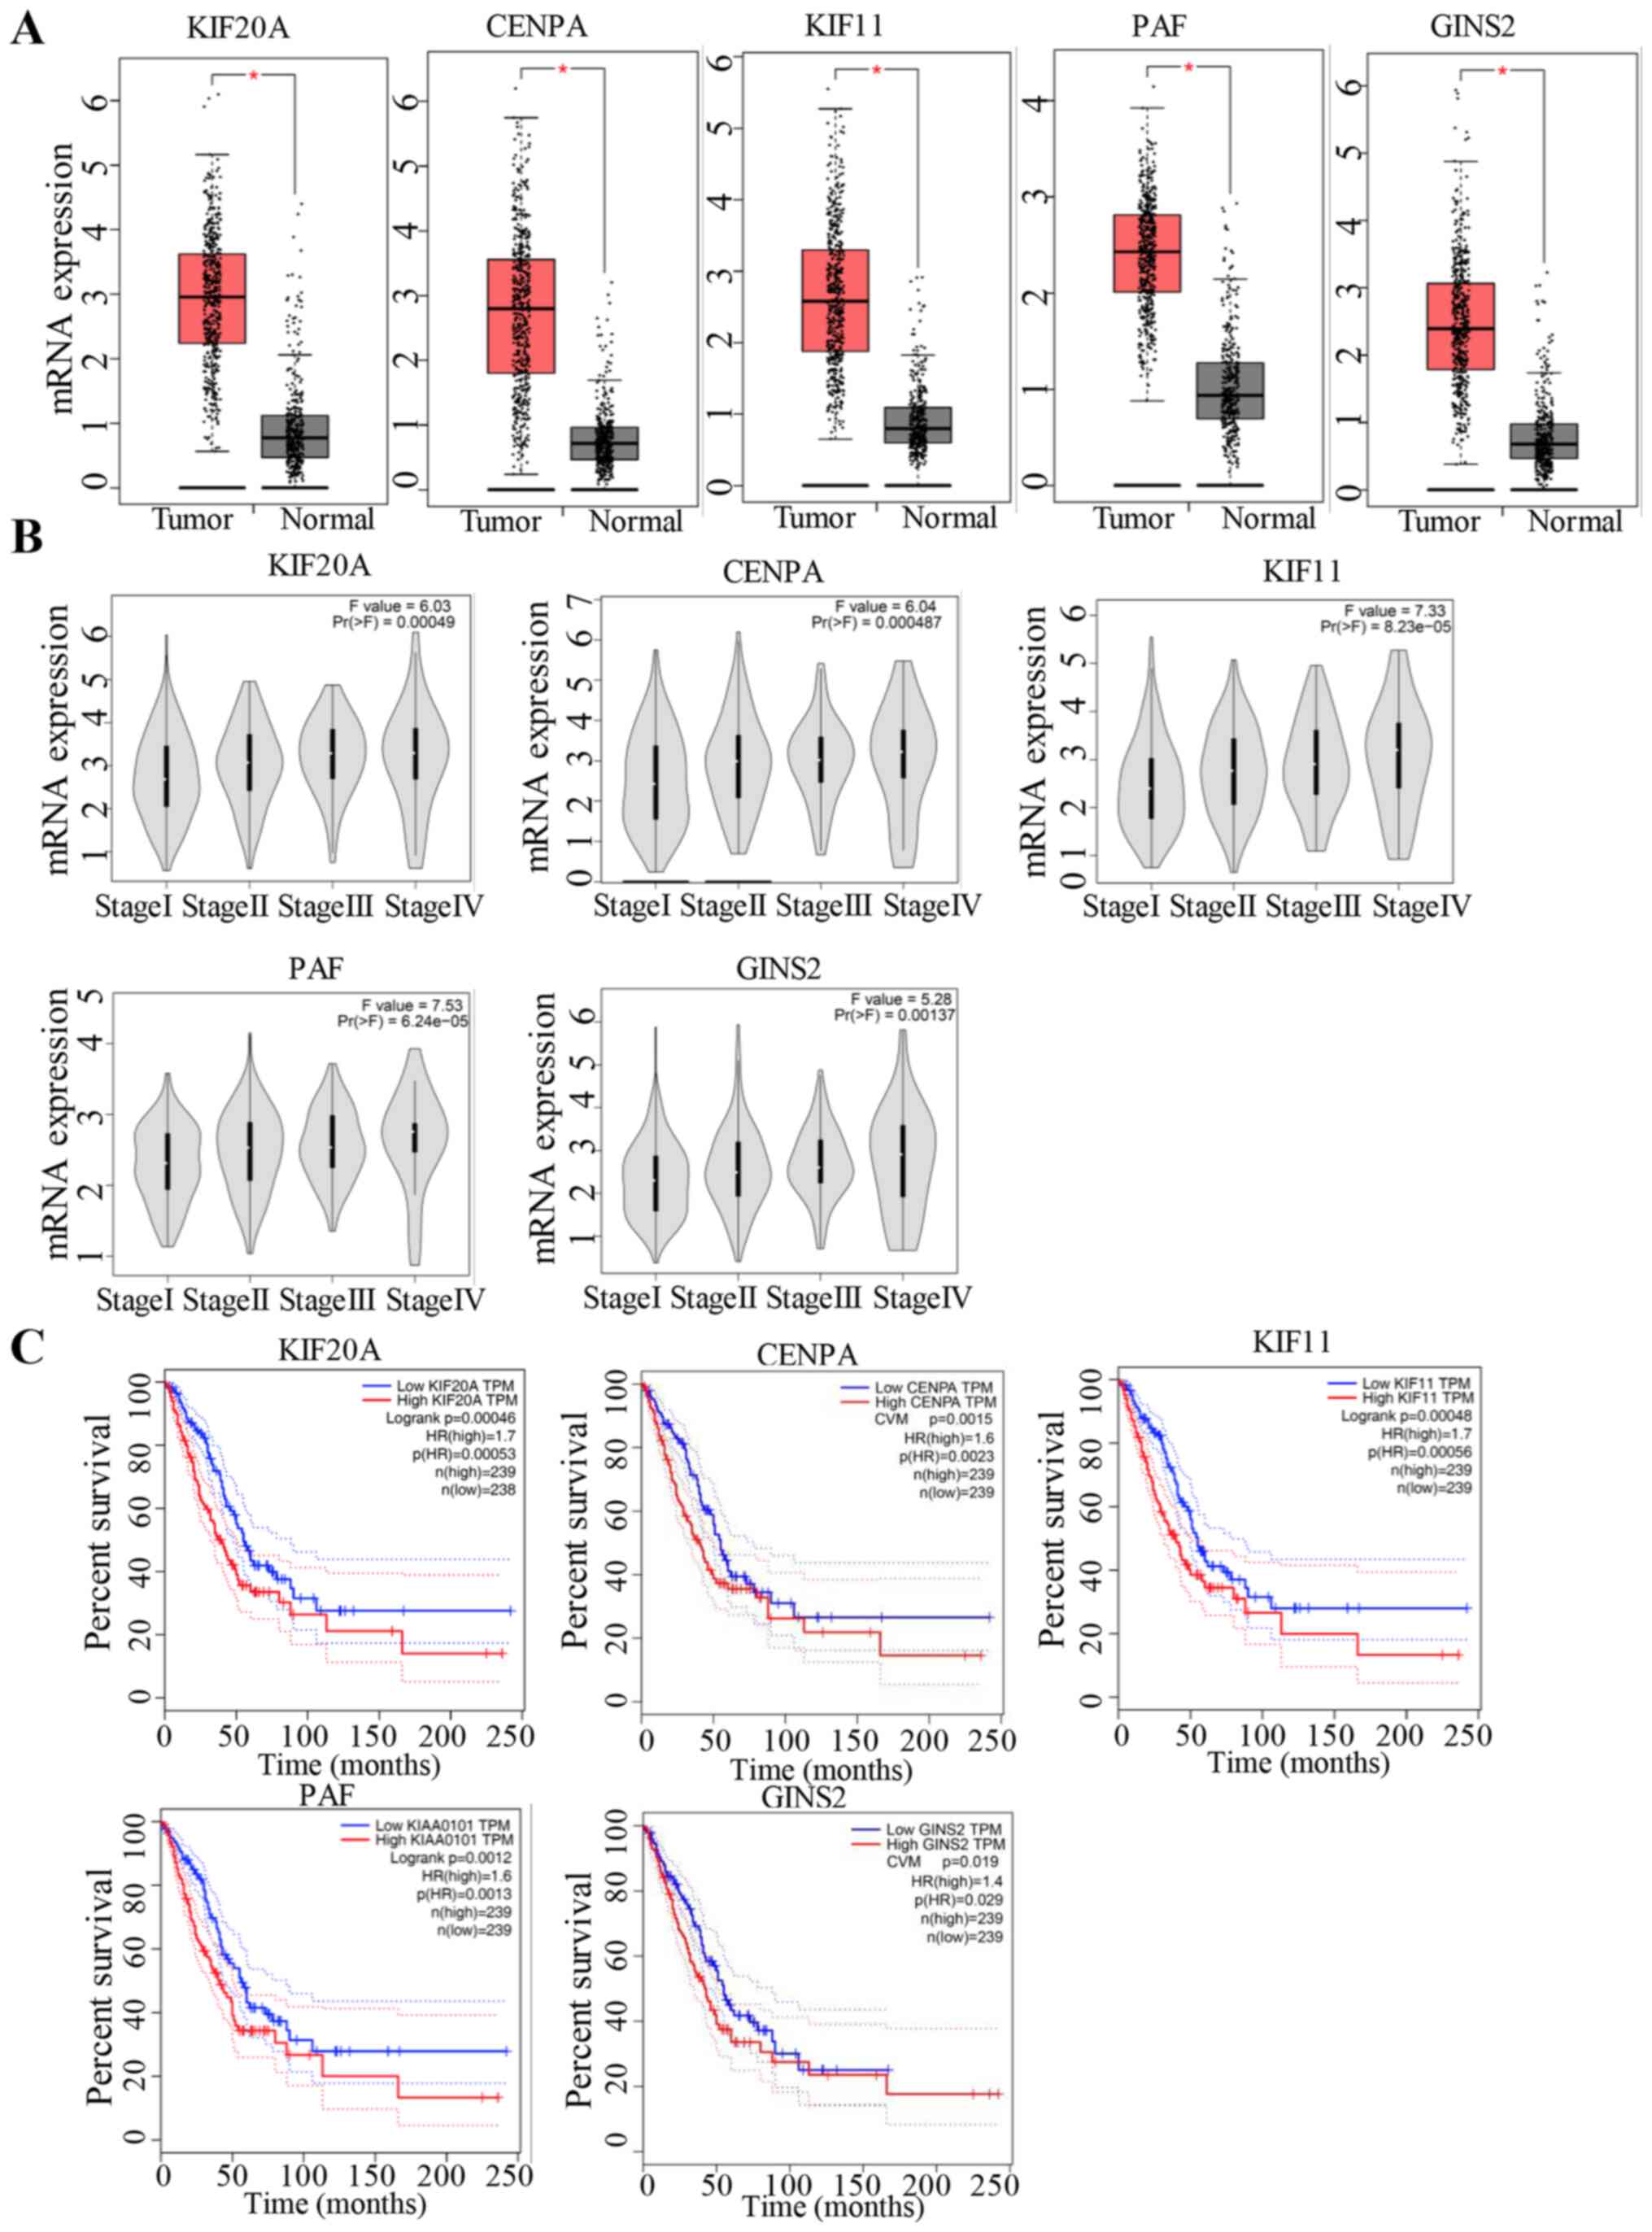
Regarding the hypermethylation in the promoter of genes, the top
genes showing the most notable difference in methylation included
kinesin family member (KIF)20A (NCBI_10112), CENPA (NCBI_1058),
KIF11 (NCBI_3832), PCNA clamp-associated factor (PAF, NCBI_9768)
and GINS complex subunit 2 (GINS2; NCBI_51659) (data not shown),
which exhibited the same trends as aforementioned in LUAD (Fig. 6). The findings showed that genes that
were downregulated in H2O2-treated cells were
more highly expressed in tumour samples with poor prognosis. The
biological function of these genes requires further study.
Although the gene expression and methylation levels
were in accordance, there were some differences between the
H2O2-treated and the control group (Fig. 7A and B). Integrated analysis revealed
that the total expression levels of the genes decreased as the
methylation levels increased. Upstream of genes, the high
methylation levels decreased gene expression levels compared with
low methylation levels (Fig. 7C).
Furthermore, the methylation and gene expression levels in both
study groups were associated. Consistent with a previous report
(9), most genes with low expression
levels had high methylation levels (Fig.
7D).
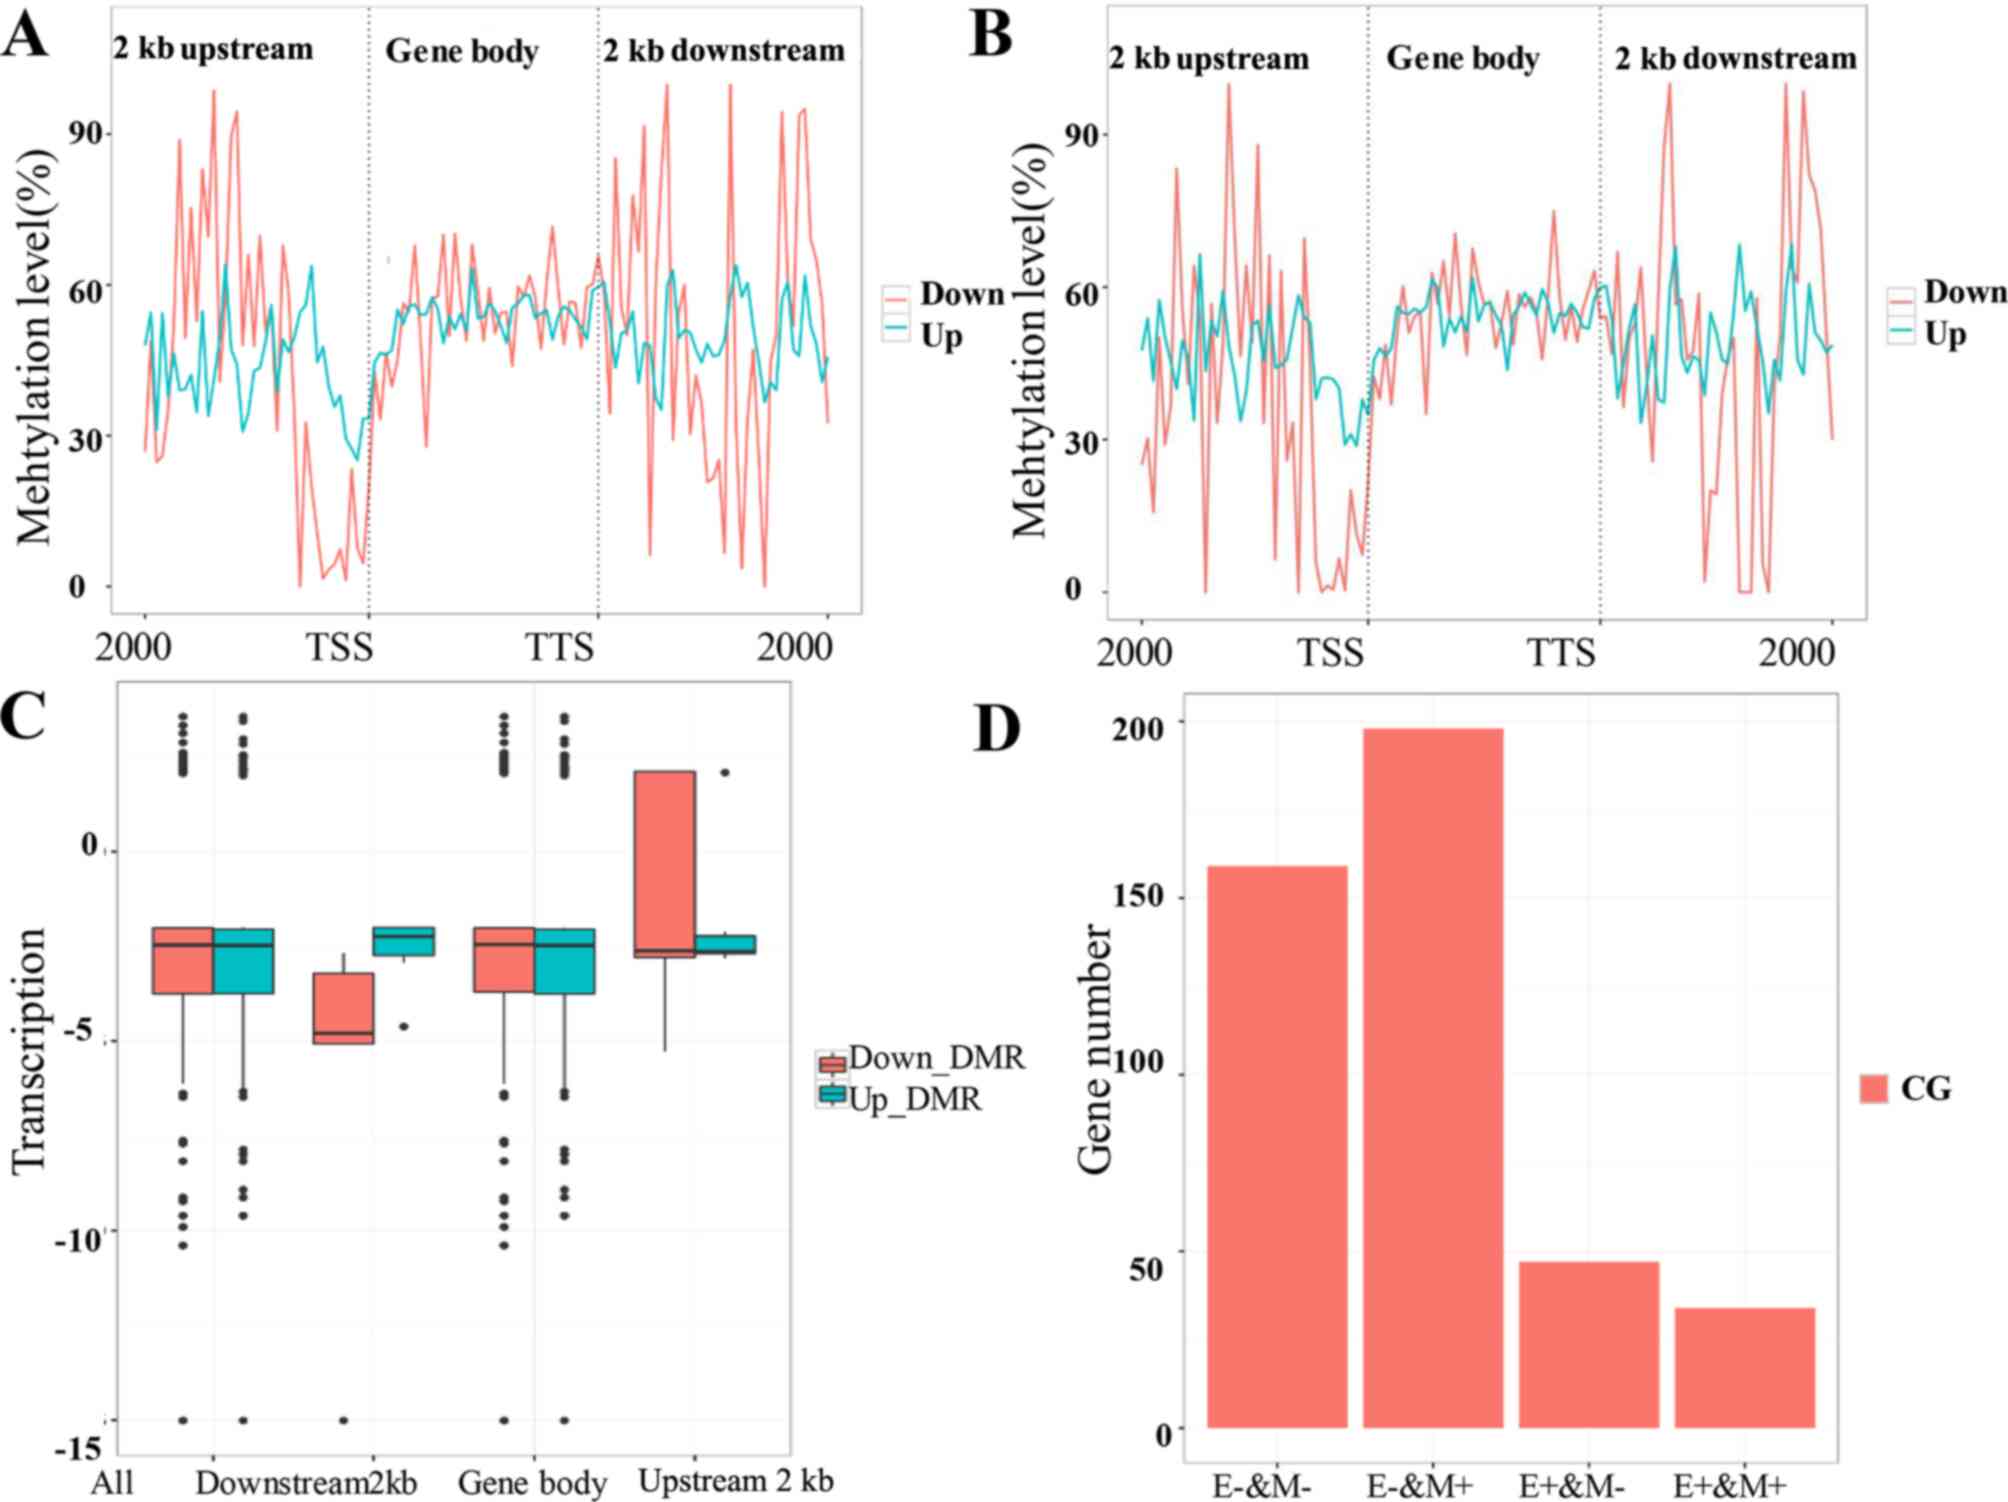 | Figure 7.Association analysis of gene
expression and methylation levels. Gene expression and methylation
levels in (A) the control group and (B) the hydrogen
peroxide-treated group. (C) Gene expression levels of DMRs around
the gene position. Gene expression was presented as median and
interquartile range. (D) Genes in both study groups with different
expression and methylation levels. All, all the DMRs; Downstream 2
kb, DMRs located in promoter downstream 2 kb; Gene body, DMRs
located in gene's body; Upstream 2 kb, DMRs located in promoter
upstream 2 kb; E+, high expression; E-, low expression; M+, high
methylation; M-, low methylation; DMR, differentially methylated
region; NC, negative control. |
Discussion
In the present study, genome-wide analyses of mRNA
expression and DNA methylation profiles were employed to explore
the inhibitory mechanism of H2O2 on the
proliferation of A549 lung cancer cells. Several genes, including
CDKN3, DTL, CENPF, KIF20A, CENPA, KIF11, PAF and GINS2, were
downregulated and hypermethylated in
H2O2-treated A549 cells compared with in
untreated cells, suggesting that they may have important roles in
the inhibitory process of H2O2 on the
proliferation of A549 cells.
Increasing evidence has revealed that gene
expression can be affected by epigenetic regulatory mechanisms,
with DNA methylation at CpG islands occurring around the genomic
promoter regions (17,18). Hypermethylation can repress
transcription and downregulate gene expression by altering the
chromatin framework, thereby leading to cancer initiation and
progression (19). Consistent with a
previous report (19), the present
study identified several genes associated with the progression of
lung cancer that were downregulated and hypermethylated in the gene
bodies in H2O2-treated cells, including
CDKN3, DTL and CENPF. The expression levels of these genes
increased with the progression of LUAD, and low expression levels
were associated with an improved survival, further proving their
critical roles in the pathological processes of lung cancer.
Although the expression levels of HIST1H2BM were not significantly
different between LUAD and normal control samples, this gene was
identified as a candidate epigenetic biomarker in LUAD through
genome-wide analysis comparing the methylation patterns (20). Another study obtained similar
results, revealing that increased expression levels of HIST1H2BM
were associated with a poor survival in patients with LUAD and may
act as a potential biomarker of drug synergy for the future
clinical trials (21). Although in
the previous study CDK3 has been reported as a tumour suppressor by
maintaining the proper number of centrosomes (22), CDKN3 has also been demonstrated to be
a potential poor prognostic marker in LUAD through the systematic
analysis of datasets in Lung Cancer Explorer (23). Another report further proved that
CDKN3 upregulation, which is mainly caused by the increase of
mitotic activity, may be associated with poor survival in patients
with LUAD, arguing against CDKN3 as a tumour suppressor (24).
In the present study, genes including KIF20A, CENPA,
KIF11, PAF and GINS2, were downregulated in
H2O2-treated cells and hypermethylated in the
gene promoters. While these genes were also upregulated in LUAD
tumour samples and their expression levels increased with the
progression of LUAD, suggesting that they may have crucial roles in
the development of tumours. Accumulating evidence has identified
that KIF20A is a major gene associated with various types of
cancer, such as pancreatic cancer (25), gastric cancer (26) and glioma (27). Ni et al (28) identified KIF20A as a potential
prognostic biomarker that was associated with the pathogenesis of
NSCLC through a series of bioinformatics methods. Gasnereau et
al (29) further proved that the
expression levels of KIF20A increased during the proliferation of
hepatocytes and the occurrence of lung cancer.
Epigenetic mechanisms, such as DNA methylation, are
essential for the regulation of gene expression, and aberrant
epigenetic alterations can lead to pathological conditions,
including cancer (30). DNA
methylation close to the promoters of a gene has been reported to
repress gene expression (31),
whereas the effect of methylation in the gene body is unclear. Xie
et al (31) demonstrated that
ROS downregulated the expression levels of the AT-rich interaction
domain 1A via methylation of its promoter during the pathogenesis
of endometriosis, whereas Wang et al (32) revealed that methylation in the
inositol-triphosphate 3-kinase A gene body regulated gene
expression and may serve as an early diagnostic marker in lung
cancer. The results of the present study revealed that in the
upstream region of genes, high methylation levels were associated
with decreased gene expression compared with a low methylation
level, whereas in the gene body or downstream of genes, the
methylation level did not markedly affect gene expression.
Therefore, it was hypothesized that DNA methylation in the upstream
region of genes, particularly near the promoter, may have different
mechanisms than in the gene body region. Future research is
required to increase the understanding of the mechanisms and
critical roles of different methylation regions in various cellular
processes.
The present study identified several genes that were
downregulated and hypermethylated in A549 cells treated with
H2O2, suggesting that they may have vital
roles in H2O2-induced inhibition of the
proliferation of A549 cells. However, further experiments are
required to validate the specific function of these genes in A549
cells. In addition, the association analysis between gene
expression and methylation levels indicated that their association
may be far more complicated than previously thought, with the
effects of DNA methylation on gene expression appearing to be
position-dependent; whether the effects are also sequence-dependent
requires further investigation. In conclusion, the present study
integrated mRNA expression and DNA methylation profiling, providing
novel insights into the molecular mechanisms underlying the
pathological processes of lung cancer, and contributed to the
identification of biomarkers and novel strategies for drug design
for the treatment of lung cancer.
Acknowledgements
Not applicable.
Funding
The present work was supported by grants from the
Affiliated Hospital of Youjiang Medical University for
Nationalities Outstanding Scholar Funding (grant no. R20196313) and
Doctorate Awarding Unit Funding of the Affiliated Hospital of
Youjiang Medical University for Nationalities [grant no. (2019)48].
The funders had no role in the design of the study, the collection,
analyses or interpretation of data, the writing of the manuscript
or the decision to publish the results.
Availability of data and materials
The datasets generated and/or analysed during the
current study are available from the corresponding author on
reasonable request.
Authors' contributions
YL was involved in the design of the study, analysis
and interpretation of data, and drafting the manuscript. BY gave
final approval of the version of the manuscript to be published and
was involved in data analysis. SH revised the manuscript critically
for important intellectual content, and was involved in the
acquisition and analysis of data. ZW made substantial contributions
to conception and design. All authors have read and approved the
final manuscript.
Ethics approval and consent to
participate
Not applicable.
Patient consent for publication
Not applicable.
Competing interests
The authors declare that they have no competing
interests.
References
|
1
|
Collins Y, Chouchani ET, James AM, Menger
KE, Cochemé HM and Murphy MP: Mitochondrial redox signalling at a
glance. J Cell Sci. 125:801–806. 2012.PubMed/NCBI
|
|
2
|
Forkink M, Basit F, Teixeira J, Swarts HG,
Koopman WJH and Willems PHGM: Complex I and complex III inhibition
specifically increase cytosolic hydrogen peroxide levels without
inducing oxidative stress in HEK293 cells. Redox Biol. 6:607–616.
2015.PubMed/NCBI
|
|
3
|
Zhang YW, Zheng Y, Wang JZ, Lu XX, Wang Z,
Chen LB, Guan XX and Tong JD: Integrated analysis of DNA
methylation and mRNA expression profiling reveals candidate genes
associated with cisplatin resistance in non-small cell lung cancer.
Epigenetics. 9:896–909. 2014.PubMed/NCBI
|
|
4
|
Wan M, Bennett BD, Pittman GS, Campbell
MR, Reynolds LM, Porter DK, Crowl CL, Wang X, Su D, Englert NA, et
al: Identification of smoking-associated differentially methylated
regions using reduced representation bisulfite sequencing and cell
type-specific enhancer activation and gene expression. Environ
Health Perspect. 126:0470152018.PubMed/NCBI
|
|
5
|
Deng F, Yang ZF and Sun CQ: The role of
Notch1 genes in lung cancer A594 cells and the impact on
chemosensitivity. Eur Rev Med Pharmacol Sci. 21:2659–2664.
2017.PubMed/NCBI
|
|
6
|
Park W: MAPK inhibitors, particularly the
JNK inhibitor, increase cell death effects in
H2O2-treated lung cancer cells via increased
superoxide anion and glutathione depletion. Oncol Rep. 39:860–870.
2018.PubMed/NCBI
|
|
7
|
Sun C, Jin W and Shi H: Oligomeric
proanthocyanidins protects A549 cells against
H2O2-induced oxidative stress via the
Nrf2-ARE pathway. Int J Mol Med. 39:1548–1554. 2017.PubMed/NCBI
|
|
8
|
Bird A: DNA methylation patterns and
epigenetic memory. Genes Dev. 16:6–21. 2002.PubMed/NCBI
|
|
9
|
Rauscher GH, Kresovich JK, Poulin M, Yan
L, Macias V, Mahmoud AM, Al-Alem U, Kajdacsy-Balla A, Wiley EL,
Tonetti D and Ehrlich M: Exploring DNA methylation changes in
promoter, intragenic, and intergenic regions as early and late
events in breast cancer formation. BMC Cancer.
15:8162015.PubMed/NCBI
|
|
10
|
Chen X, Liu L, Mims J, Punska EC, Williams
KE, Zhao W, Arcaro KF, Tsang AW, Zhou X and Furdui CM: Analysis of
DNA methylation and gene expression in radiation-resistant head and
neck tumors. Epigenetics. 10:545–561. 2015.PubMed/NCBI
|
|
11
|
Cheah SY, Lawford BR, Young RM, Morris CP
and Voisey J: mRNA Expression and DNA methylation analysis of
serotonin receptor 2A (HTR2A) in the human schizophrenic brain.
Genes (Basel). 8:142017.
|
|
12
|
Diederich M, Hansmann T, Heinzmann J,
Barg-Kues B, Herrmann D, Aldag P, Baulain U, Reinhard R, Kues W,
Weissgerber C, et al: DNA methylation and mRNA expression profiles
in bovine oocytes derived from prepubertal and adult donors.
Reproduction. 144:319–330. 2012.PubMed/NCBI
|
|
13
|
Anglim PP, Galler JS, Koss MN, Hagen JA,
Turla S, Campan M, Weisenberger DJ, Laird PW, Siegmund KD and
Laird-Offringa IA: Identification of a panel of sensitive and
specific DNA methylation markers for squamous cell lung cancer. Mol
Cancer. 7:622008.PubMed/NCBI
|
|
14
|
Del Real A, Pérez-Campo FM, Fernández AF,
Sañudo C, Ibarbia CG, Pérez-Núñez MI, Criekinge WV, Braspenning M,
Alonso MA, et al: Differential analysis of genome-wide methylation
and gene expression in mesenchymal stem cells of patients with
fractures and osteoarthritis. Epigenetics. 12:113–122.
2017.PubMed/NCBI
|
|
15
|
Kernaleguen M, Daviaud C, Shen Y, Bonnet
E, Renault V, Deleuze JF, Mauger F and Tost J: Whole-genome
bisulfite sequencing for the analysis of genome-wide dnamethylation
and hydroxymethylation patterns at single-nucleotide resolution.
Methods Mol Biol. 1767:311–349. 2018.PubMed/NCBI
|
|
16
|
Riesewijk A, Martín J, van Os R,
Horcajadas JA, Polman J, Pellicer A, Mosselman S and Simón C: Gene
expression profiling of human endometrial receptivity on days LH+2
versus LH+7 by microarray technology. Mol Hum Reprod. 9:253–264.
2003.PubMed/NCBI
|
|
17
|
Guo K, Elzinga S, Eid S, Figueroa-Romero
C, Hinder LM, Pacut C, Feldman EL and Hur J: Genome-wide DNA
methylation profiling of human diabetic peripheral neuropathy in
subjects with type 2 diabetes mellitus. Epigenetics. 14:766–779.
2019.PubMed/NCBI
|
|
18
|
Navarro A, Yin P, Monsivais D, Lin SM, Du
P, Wei JJ and Bulun SE: Genome-Wide DNA methylation indicates
silencing of tumor suppressor genes in uterine leiomyoma. PLoS One.
7:e332842012.PubMed/NCBI
|
|
19
|
Li P, Shi J, He Q, Hu Q, Wang YY, Zhang
LJ, Chan WT and Chen WX: Streptococcus pneumoniae induces autophagy
through the Inhibition of the PI3K-I/Akt/mTOR Pathway and ROS
Hypergeneration in A549 Cells. PLoS One. 10:e01227532015.PubMed/NCBI
|
|
20
|
Daugaard I, Dominguez D, Kjeldsen TE,
Kristensen LS, Hager H, Wojdacz TK and Hansen LL: Identification
and validation of candidate epigenetic biomarkers in lung
adenocarcinoma. Sci Rep. 6:358072016.PubMed/NCBI
|
|
21
|
Ponsuksili S, Trakooljul N, Basavaraj S,
Hadlich F, Murani E and Wimmers K: Epigenome-wide skeletal muscle
DNA methylation profiles at the background of distinct metabolic
types and ryanodine receptor variation in pigs. BMC Genomics.
20:4922019.PubMed/NCBI
|
|
22
|
Srinivas V, Kitagawa M, Wong J, Liao PJ
and Lee SH: The Tumor suppressor Cdkn3 is required for maintaining
the proper number of centrosomes by regulating the centrosomal
stability of Mps1. Cell Rep. 13:1569–1577. 2015.PubMed/NCBI
|
|
23
|
Zang X, Chen M, Zhou Y, Xiao G, Xie Y and
Wang X: Identifying CDKN3 gene expression as a prognostic biomarker
in lung adenocarcinoma via meta-analysis. Cancer Inform. 14 (Suppl
2):S183–S191. 2015.
|
|
24
|
Fan C, Chen L, Huang Q, Shen T, Welsh EA,
Teer JK, Cai J, Cress WD and Wu J: Overexpression of major CDKN3
transcripts is associated with poor survival in lung
adenocarcinoma. Br J Cancer. 113:1735–1743. 2015.PubMed/NCBI
|
|
25
|
Imai K, Hirata S, Irie A, Senju S, Ikuta
Y, Yokomine K, Harao M, Inoue M, Tomita Y, Tsunoda T, et al:
Identification of HLA-A2-restricted CTL epitopes of a novel
Tumour-associated antigen, KIF20A, overexpressed in pancreatic
cancer. Br J Cancer. 104:300–307. 2011.PubMed/NCBI
|
|
26
|
Yan GR, Zou FY, Dang BL, Zhang Y, Yu G,
Liu X and He QY: Genistein-induced mitotic arrest of gastric cancer
cells by downregulating KIF20A, a proteomics study. Proteomics.
12:2391–2399. 2012.PubMed/NCBI
|
|
27
|
Saito K, Ohta S, Kawakami Y, Yoshida K and
Toda M: Functional analysis of KIF20A, a potential
immunotherapeutic target for glioma. J Neurooncol. 132:63–74.
2017.PubMed/NCBI
|
|
28
|
Ni M, Liu X, Wu J, Zhang D, Tian J, Wang
T, Liu S, Meng Z, Wang K, Duan X, et al: Identification of
candidate biomarkers correlated with the pathogenesis and prognosis
of non-small cell lung cancer via integrated bioinformatics
analysis. Front Genet. 9:4692018.PubMed/NCBI
|
|
29
|
Gasnereau I, Boissan M, Margall-Ducos G,
Couchy G, Wendum D, Bourgain-Guglielmetti F, Desdouets C, Lacombe
ML, Zucman-Rossi J and Sobczak-Thépot J: KIF20A mRNA and its
product MKlp2 Are increased during hepatocyte proliferation and
hepatocarcinogenesis. Am J Pathol. 180:131–140. 2012.PubMed/NCBI
|
|
30
|
Yang H, Chang F, You C, Cui J, Zhu G, Wang
L, Zheng Y, Qi J and Ma H: Whole-genome DNA methylation patterns
and complex associations with gene structure and expression during
flower development in Arabidopsis. Plant J. 81:268–281.
2014.PubMed/NCBI
|
|
31
|
Xie H, Chen P, Huang HW, Liu LP and Zhao
F: Reactive oxygen species downregulate ARID1A expression via its
promoter methylation during the pathogenesis of endometriosis. Eur
Rev Med Pharmacol Sci. 21:4509–4515. 2017.PubMed/NCBI
|
|
32
|
Wang YW, Ma X, Zhang YA, Wang MJ, Yatabe
Y, Lam S, Girard L, Chen JY and Gazdar AF: ITPKA gene body
methylation regulates gene expression and serves as an early
diagnostic marker in lung and other cancers. J Thorac Oncol.
11:1469–1481. 2016.PubMed/NCBI
|