Introduction
Minichromosome maintenance complex component (MCM)3,
one of the highly conserved MCMs, is involved in prokaryotic and
eukaryotic genome replication (1).
MCM forms a hexameric protein complex, which is a key component of
the pre-replication complex. This complex is involved in the
formation of the replication fork and in the recruitment of other
DNA replication proteins (2). MCM3
is a subunit/component of the hexameric protein complex that
consists of MCM2-7 and directly interacts with MCM5 (3). MCM3 is essential for the initiation of
DNA replication and is involved in ensuring that DNA replication is
initiated precisely once per cell cycle (4). The initiation of DNA replication and
cell cycle progression is triggered by acetylation of MCM3
(4), and cells lacking MCM3 fail to
proceed into S phase and proliferate (5). Furthermore, MCM3 is a point of direct
contact between Kelch-like ECH-associated protein 1 (KEAP1; a
substrate adaptor protein for a cullin-3-based E3 ubiquitin ligase)
and the MCM2-7 hexamer. KEAP1-mediated MCM3 ubiquitylation may also
impact helicase activation (6).
Hepatocellular carcinoma (HCC), a common malignant
tumor, accounts for 90% of primary liver malignancies (7). HCC is the second most common cause of
cancer-associated mortality worldwide and this proportion continues
to increase (8). In the United
States alone, annual HCC-related deaths have doubled from 5,112 in
1999 to 11,073 in 2016 (9). A high
incidence of HCC has also been noted in China (10). Hepatitis virus infection (HBV or
HCV), cirrhosis, HIV co-infection, alcoholism, obesity, aflatoxin
B1 intake and inherited factors are associated with increased
incidence of HCC (7–8,10).
Current treatments for HCC, including surgical resection, liver
transplantation and occasionally ablative therapies, only provide
limited benefits. Survival of patients with HCC is limited even
following liver excision or liver transplantation (8). The disease is refractory to classic
chemotherapy and is unsuitable for radiation treatment due to the
chance of developing liver toxicity (7–8,10). Due to the difficulties associated
with early diagnosis and the high incidence of tumor recurrence,
identification of novel HCC treatment methods is required to
improve patient outcomes.
MCM proteins, which are overexpressed in various
neoplasms, can be used as proliferation markers to analyze the
behavior of diverse neoplasms (11,12). A
previous study has demonstrated that overexpression of MCM3
enhances anchorage-independent cell growth, cell migration and
invasion abilities of medulloblastoma cells (13). These results suggest that MCM3 is
likely to be associated with tumor migration and invasion.
Increased MCM3 expression has also been observed in melanoma,
prostate cancer, cervical squamous cell carcinoma and salivary
gland tumors (1,5,14). These
studies indicate that MCM3 may be a potential proliferation marker
in the diagnosis of certain tumors (1,5,13,14). In
certain tumors, MCM3 may also be detected in non-proliferating
cells, which indicates their readiness to enter the cell cycle
(15).
There is limited research regarding MCM3 in HCC.
Therefore, the association between MCM3 and clinical features of
HCC remains unclear. The present study assessed the effect of MCM3
in HCC. MCM3 expression was analyzed using The Cancer Genome Atlas
(TCGA) database. mRNA and protein expression levels were detected
in HCC and paired adjacent tissues. Additionally, the association
between MCM3 expression and the clinicopathological features of
patients with HCC were evaluated, including common diagnostic
marker AFP and noninvasive liver function parameters ALT and AST,
which are commonly tested in clinical practice to indicate
prognosis (16,17). Subsequently, functional and pathway
enrichment analyses were carried out and a protein-protein
interaction (PPI) network of MCM3 was established. The present
study bridges the gap in understanding the underlying molecular
mechanisms of MCM3 and its interacting proteins in HCC. Finally,
the expression of the proteins that interact with MCM3, including
MCM family proteins and non-MCM family proteins, were analyzed in
the context of HCC. Algorithms combining the receiver operating
characteristic (ROC) curves of MCM3 and its interaction partners
were constructed to improve the diagnosis of HCC when compared with
MCM3 alone.
Materials and methods
Patients and HCC specimen
A total of 78 patients (age range, 28–68 years;
median age, 45 years) with HCC who were diagnosed according to the
Chinese primary liver cancer guidelines (18) and treated at the Department of
Hepatobiliary Pancreatic Surgery of the Affiliated Hospital of
Guilin Medical University (Guilin, P.R. China) between January 2017
and August 2018 were prospectively recruited in the present study.
All patients had not received any antitumor therapy prior to
surgery. Surgical indications of these patients met the following
criteria based on the Chinese primary liver cancer guidelines
(18): i) Patients with good liver
function reserve and HCC staging Ia, Ib and IIa; ii) patients with
HCC staging IIb and IIIa who have <3 tumor nodules; and iii)
patients with HCC staging IIb and IIIa that meet particular
conditions, including: a) Patients have >3 tumor nodules that
are localized in the same segment or lobe, or if radiofrequency
ablation can be performed for some lesions during surgery; b) the
tumor is localized in one lobe and the tumor emboli are expected to
be completely resected during surgery; c) patients that have
obstructive jaundice because of tumor emboli in the bile duct and
the intrahepatic tumors are resectable; and d) patients with portal
lymph node metastases, intraoperative lymph node dissection or
postoperative external radiation therapy. HCC samples, including
tumor tissue and adjacent tissues (≥2 cm distance from the tumor
margin) were then collected during radical resection or partial
resection. The demographic and clinicopathological characteristics,
including age, sex, smoking, drinking, Hepatitis B virus infection,
α-fetoprotein (AFP), alanine minotransferase (ALT), aspartate
transaminase (AST), tumor size and pathological Edmondson-Steiner
(E-S) grade (19), were also
obtained. The present study was approved by the Ethics Committee of
The Affiliated Hospital of Guilin Medical University and written
informed consent was obtained from all patients.
Data collection and analysis from
TCGA
RNA-seq data quantified using RNA-Seq by
Expectation-Maximization (RSEM) were downloaded from TCGA
(https://tcga.xenahubs.net). In
particular, the level-3 data were downloaded from TCGA data
coordination center. In order to acquire TCGA data comparable to
the subject of the present research, only patients with HCC were
included in the analysis (n=363), and were paired with non-HCC
(normal liver) samples for statistical analysis (n=50). In
addition, data regarding clinical features of patients for all
downloaded datasets (LIHC_clinicalMatrix) were collected.
Reverse transcription-quantitative PCR
(RT-qPCR)
RT-qPCR was used to determine mRNA expression levels
of different genes in 78 HCC tissue samples. Total RNA from HCC
specimens was isolated using TRIzol reagent (Invitrogen; Thermo
Fisher Scientific, Inc.) according to the manufacturer's protocol.
Total RNA (1 ug) was reverse transcribed to cDNA using a two-step
RT Kit (Takara Biotechnology Co., Ltd.) according to the
manufacturer's protocol. Complementary DNA was amplified using the
StepOnePlus system (Applied Biosystems; Thermo Fisher Scientific,
Inc.) with SYBR Green master mix [Roche Diagnostics (Shanghai) Co.,
Ltd.]. The RT-qPCR conditions used were as follows: Initiation at
95°C for 10 min, followed by 40 cycles of 95°C for 15 sec and 60°C
for 1 min, final extension at 60°C for 10 min. mRNA expression
levels were calculated using the 2−∆∆Cq method (20). β-actin was used as an internal
control. The primers used for RT-qPCR amplification are shown in
Table I.
 | Table I.Primers utilized for reverse
transcription-quantitative PCR amplification. |
Table I.
Primers utilized for reverse
transcription-quantitative PCR amplification.
| Gene | Upstream primer
sequence (5′-3′) | Downstream primer
sequence (5′-3′) |
|---|
| MCM2 |
ATCTACGCCAAGGAGAGGGT |
GTAATGGGGATGCTGCCTGT |
| MCM3 |
TGGCCTCCATTGATGCTACC |
GGACGACTTTGGGACGAACT |
| MCM5 |
TCATCTCCAAGAGCATCGCC |
CCTCGGCGAGTAAGTCCATC |
| CHK1 |
AATGCTCGCTGGAGAATTGC |
CACCACCTGAAGTGACTCGG |
| DHX9 |
GCCAATTTCTGGCCAAAGCA |
CGAGGCTCAATGGGGAGTTT |
| β-actin |
CAGGCACCAGGGCGTGAT |
TAGCAACGTACATGGCTGGG |
Western blotting
Total protein was extracted from tissue (5 mg) using
300 µl ice-cold RIPA lysis buffer (Beyotime Institute of
Biotechnology) with proteinase inhibitor and homogenized using an
electric homogenizer. Samples were centrifuged at 12,000 rpm for 20
min at 4°C and the supernatant was collected. Protein concentration
was determined using a BCA assay (Beijing Leagene Biotech, Co.,
Ltd.). Total protein was mixed with 5X loading buffer mix and
boiled at 100°C for 5 min. Equal amounts of total protein (20
µg/lane) were separated on a 10% SDS-PAGE gel and transferred to a
PVDF membrane using a Bio-Rad SemiDry apparatus. The membranes were
blocked in TBS + Tween 20 (TBST; 0.1% Tween 20) containing 5% BSA
(Beijing Solarbio Science & Technology Co., Ltd.) at room
temperature for 1 h. Anti-MCM3 primary antibody (diluted in TBST;
1:1,000; cat no. ab128923; Abcam) and the loading control
anti-β-actin antibody (diluted in TBST; 1:4,000, cat. no.
HRP-60008; ProteinTech Group, Inc.) were added to the membranes at
4°C overnight. The membranes were rinsed three times for 5 min with
TBST and then incubated with HRP-conjugated secondary antibody
(diluted in TBST; 1:3,000; cat. no. SA00001-2; ProteinTech Group,
Inc.) for 1 h at room temperature. The membranes were rinsed three
times for 5 min with TBST and protein bands were visualized using
the chemiluminescent substrate BeyoECL Plus kit (Beyotime Institute
of Biotechnology). The FluorChem HD2 chemiluminescence system
(ProteinSimple) was used for protein visualization. Protein
expression was semi-quantified using ImageJ software (version
1.52a; National Institutes of Health) with β-actin as the loading
control.
Immunohistochemistry (IHC)
All tissues were fixed in 4% paraformaldehyde for 24
h at room temperature, embedded in paraffin, and sliced into 4-µm
sections. Embedded sections were deparaffinized with xylene and
rehydrated with a descending ethanol series (100, 95, 90 and 85%),
followed by antigen retrieval in citrate acid buffer for 15 min
using an autoclave at 121°C. Subsequently, protein expression was
analyzed using the SP-9000 two-step immunohistochemical staining
kit (OriGene Technologies, Inc.) according to the manufacturer's
protocol. Endogenous peroxidase activity was blocked with hydrogen
peroxide at room temperature for 15 min. After a 10-min incubation
with goat serum at room temperature, sections were incubated with
anti-MCM3 primary antibody (dilution in PBS; 1:1,000; cat. no.
ab128923; Abcam) overnight at 4°C in a humidified chamber. Negative
controls were incubated with PBS instead of the primary antibody.
After washing with PBS, samples were incubated with the
biotinylated secondary antibody at room temperature for 15 min.
Sections were incubated with horseradish peroxidase at room
temperature for 15 min and developed in 3,3′-diaminobenzidine
peroxidase substrate solution. Finally, sections were
counterstained with hematoxylin at room temperature for 5 min,
dehydrated and mounted in resin blocks.
Two independent pathologists evaluated the degree of
IHC staining under a light microscope. In each sample, ≥1,000 cells
were counted and 10 high-power fields (magnification, ×400) were
analyzed. The average number was considered for the whole sample.
The average labelling index of MCM3 from 10 randomly selected
high-power fields was recorded as follows: i) 0, no staining, or
faint staining intensity in <10% of cells; ii) 1+, faint
nuclear/cytoplasmic staining in ≥10% of cells; iii) 2+, moderate
and incomplete nuclear staining in ≥10% of cells; and iv) 3+,
strong nuclear staining in ≥10% of cells (21). Specimens exhibiting immunostaining of
3+ were defined as high expression of MCM3; expression levels of 1+
or 2+ were defined as low expression, and 0 was defined as negative
expression.
PPI network construction and module
analysis
The functional interactions between proteins can
provide context in molecular mechanisms of MCM3 and its interacting
proteins in the development of HCC. In the present study, a PPI
network consisting of MCM3 and its interacting proteins was
constructed using the Search Tool for the Retrieval of Interacting
Genes (STRING) software tool (version 11.0; http://string-db.org). Cytoscape v17 software
(www.cytoscape.org) with Molecular Complex
Detection (MCODE; version 1.6.1) (22) was used to visualize and screen
modules of the PPI network as previously described (23).
Functional and pathway enrichment
analysis
MCM3 and its interacting proteins were used to
perform Gene Ontology (GO; http://www.geneontology.org) and Kyoto Encyclopedia of
Genes and Genomes (KEGG; http://www.genome.jp/kegg) pathway enrichment analysis
in STRING. P<0.05 was set as the cut-off criterion.
Statistical analysis
Statistical analysis was performed using the SPSS
software (version 22.0; IBM Corp.). Data are presented as the mean
± standard deviation. Unpaired comparisons between 363 HCC tissues
and 50 normal tissues were analyzed using Student's unpaired t-test
and Welch t-test. Comparisons between two paired groups (78 HCC
tissues vs. paired adjacent tissues) were conducted using Wilcoxon
signed-rank test for IHC data and Student's paired t-test for
RT-qPCR results. The association between MCM3 expression and
clinicopathological factors in patients with HCC was determined
using χ2 test with Fisher's exact test. The ROC curves
and the area under the curve (AUC) were used to evaluate the
diagnostic value of different genes in HCC. Pairwise comparisons of
ROC curves were conducted using MedCalc (version 9.2.0.1; MedCalc
Software Ltd.) and the best cut-off value for each gene was defined
as the point with maximum Youden index (sensitivity +
specificity-1) on the ROC curve. Based on the mRNA data (RSEM)
extracted from TCGA liver hepatocellular carcinoma dataset, binary
logistic regression analysis was used to generate algorithms
combining ROCs of MCM3 and its interacting proteins. Enrichment
analysis was performed in the STRING database. False discovery rate
<0.05 was considered statistically significant. Overall survival
(OS) and recurrence-free survival (RFS) time were stratified
according to the median expression levels of RSEM of different
genes (high and low). Survival analysis was conducted using
Kaplan-Meier analysis with a log-rank test. P<0.05 was
considered to indicate a statistically significant difference.
Results
Analyses of MCM3 using the TCGA
database
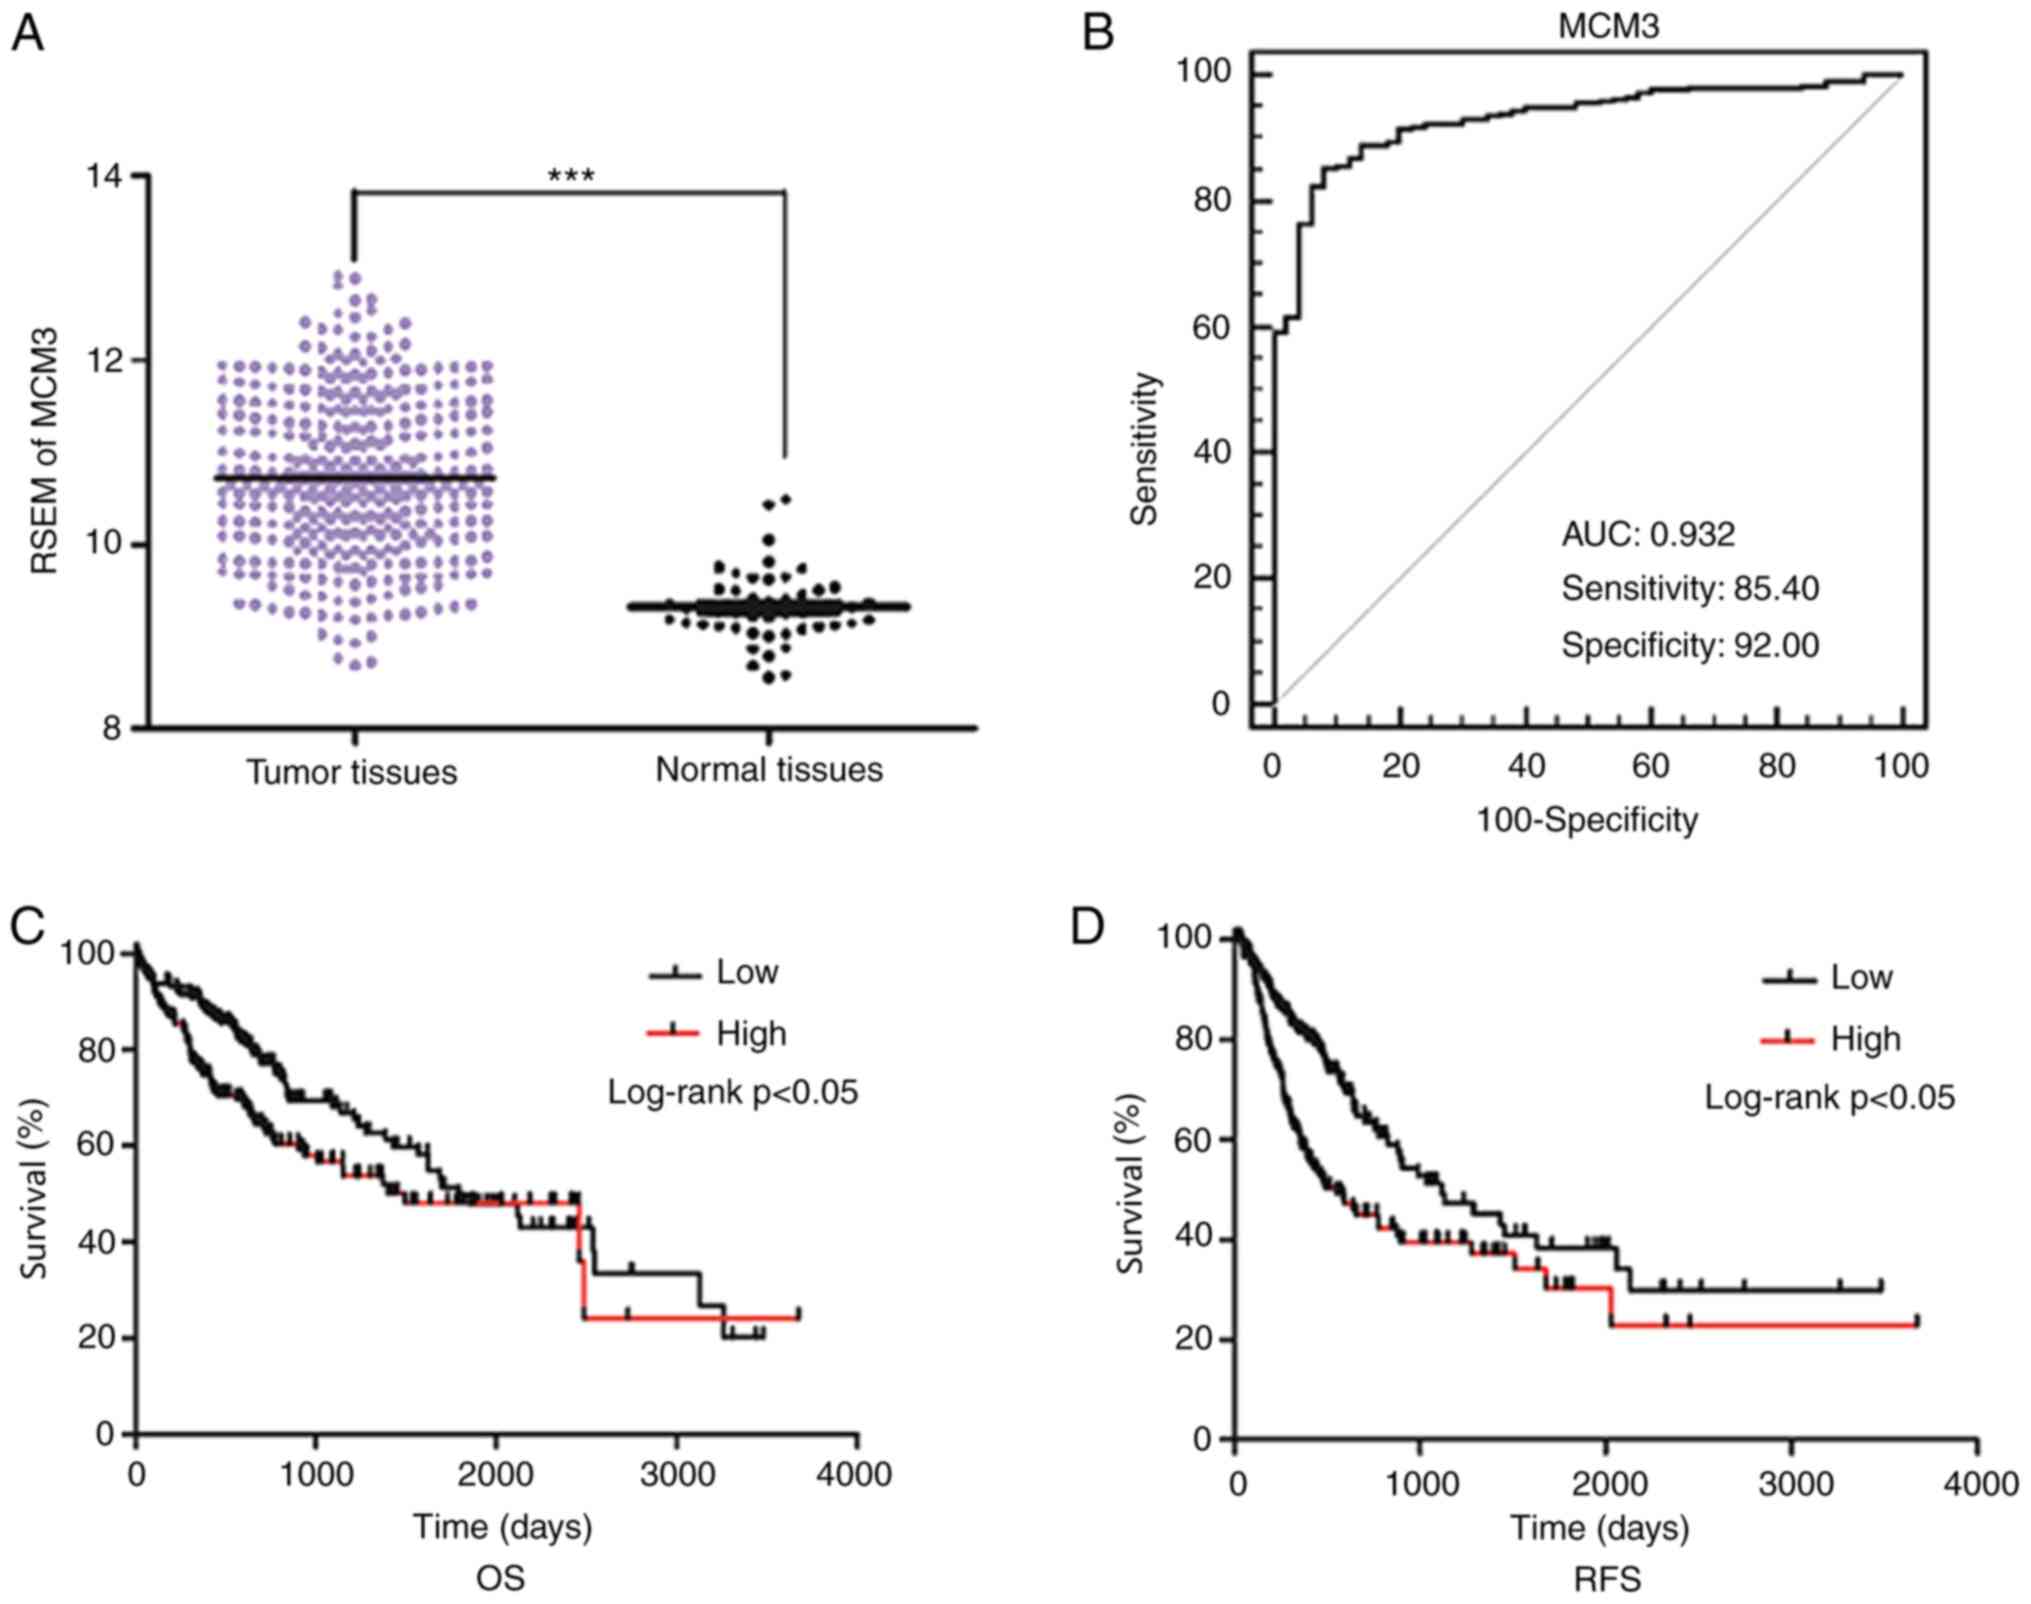
The MCM3 mRNA expression levels in 413
selected tissues (363 tumor tissues and 50 normal tissues) were
obtained from TCGA. Increased MCM3 expression was observed in the
tumor tissues (Fig. 1A). When the
associations between MCM3 and clinical features, including age,
sex, AFP, E-S grade, Child-Pugh classification (24), hepatitis B surface antigen infection
and lymph node metastasis, were evaluated in HCC, elevated MCM3
expression was identified to be associated with high AFP levels, as
well as advanced E-S grade (Table
II). However, no association was observed between MCM3
expression and other clinical factors. In addition, Kaplan-Meier
analysis indicated that patients with high MCM3 expression had
poorer OS and RFS rates than patients with low MCM3 expression
(Fig. 1C and D).
| Table II.Association between MCM3 expression
levels and clinicopathologic characteristics in hepatocellular
carcinoma in The Cancer Genome Atlas dataset (n=363). |
Table II.
Association between MCM3 expression
levels and clinicopathologic characteristics in hepatocellular
carcinoma in The Cancer Genome Atlas dataset (n=363).
| Clinical
features | Cases, n | MCM3 levels (RSEM;
mean ± SD) | P-value |
|---|
| Sample |
|
|
|
|
LIHC | 363 | 10.7220±0.8776 | <0.001 |
|
Normal | 50 | 9.3221±0.3847 |
|
| Age at diagnosis,
years |
|
|
|
|
≤45 | 48 | 10.9396±0.9240 | 0.065 |
|
>45 | 314 | 10.6881±0.8683 |
|
|
Unknown | 1 |
|
|
| Sex |
|
|
|
|
Female | 117 | 10.8264±0.8170 | 0.118 |
|
Male | 246 | 10.6724±0.9024 |
|
| AFP in serum,
ng/ml |
|
|
|
|
≤20 | 143 | 10.4980±0.8607 | <0.001 |
|
>20 | 129 | 10.9507±0.8032 |
|
|
Unknown | 91 |
|
|
| E-S grade |
|
|
|
|
I–II | 225 | 10.5271±0.8640 | <0.001 |
|
III–IV | 133 | 11.0550±0.8095 |
|
|
Unknown | 5 |
|
|
| Child-Pugh
classification |
|
|
|
| A | 213 | 10.6595±0.8948 | 0.806 |
| B | 21 | 10.6102±0.6849 |
|
| C | 1 |
|
|
|
Unknown | 128 |
|
|
| Lymph node |
|
|
|
| N0 | 246 | 10.7852±0.8700 | 0.441 |
| N1 | 3 | 11.1746±0.4966 |
|
|
Unknown | 114 |
|
|
| Metastasis |
|
|
|
| M0 | 260 | 10.7999±0.8767 | 0.432 |
| M1 | 4 | 10.4529±0.7069 |
|
|
Unknown | 99 |
|
|
| HBsAg
infection |
|
|
|
|
Yes | 137 | 10.8366±0.9352 |
|
| No | 0 |
|
|
|
Unknown | 226 |
|
|
To further assess the diagnostic utility of MCM3 in
HCC, a ROC curve with an AUC of 0.932 was constructed by plotting
sensitivity vs. specificity. At a cut-off point of 9.757, which was
determined using the Youden's index, the sensitivity and
specificity were 85.40 and 92.00%, respectively (Fig. 1B).
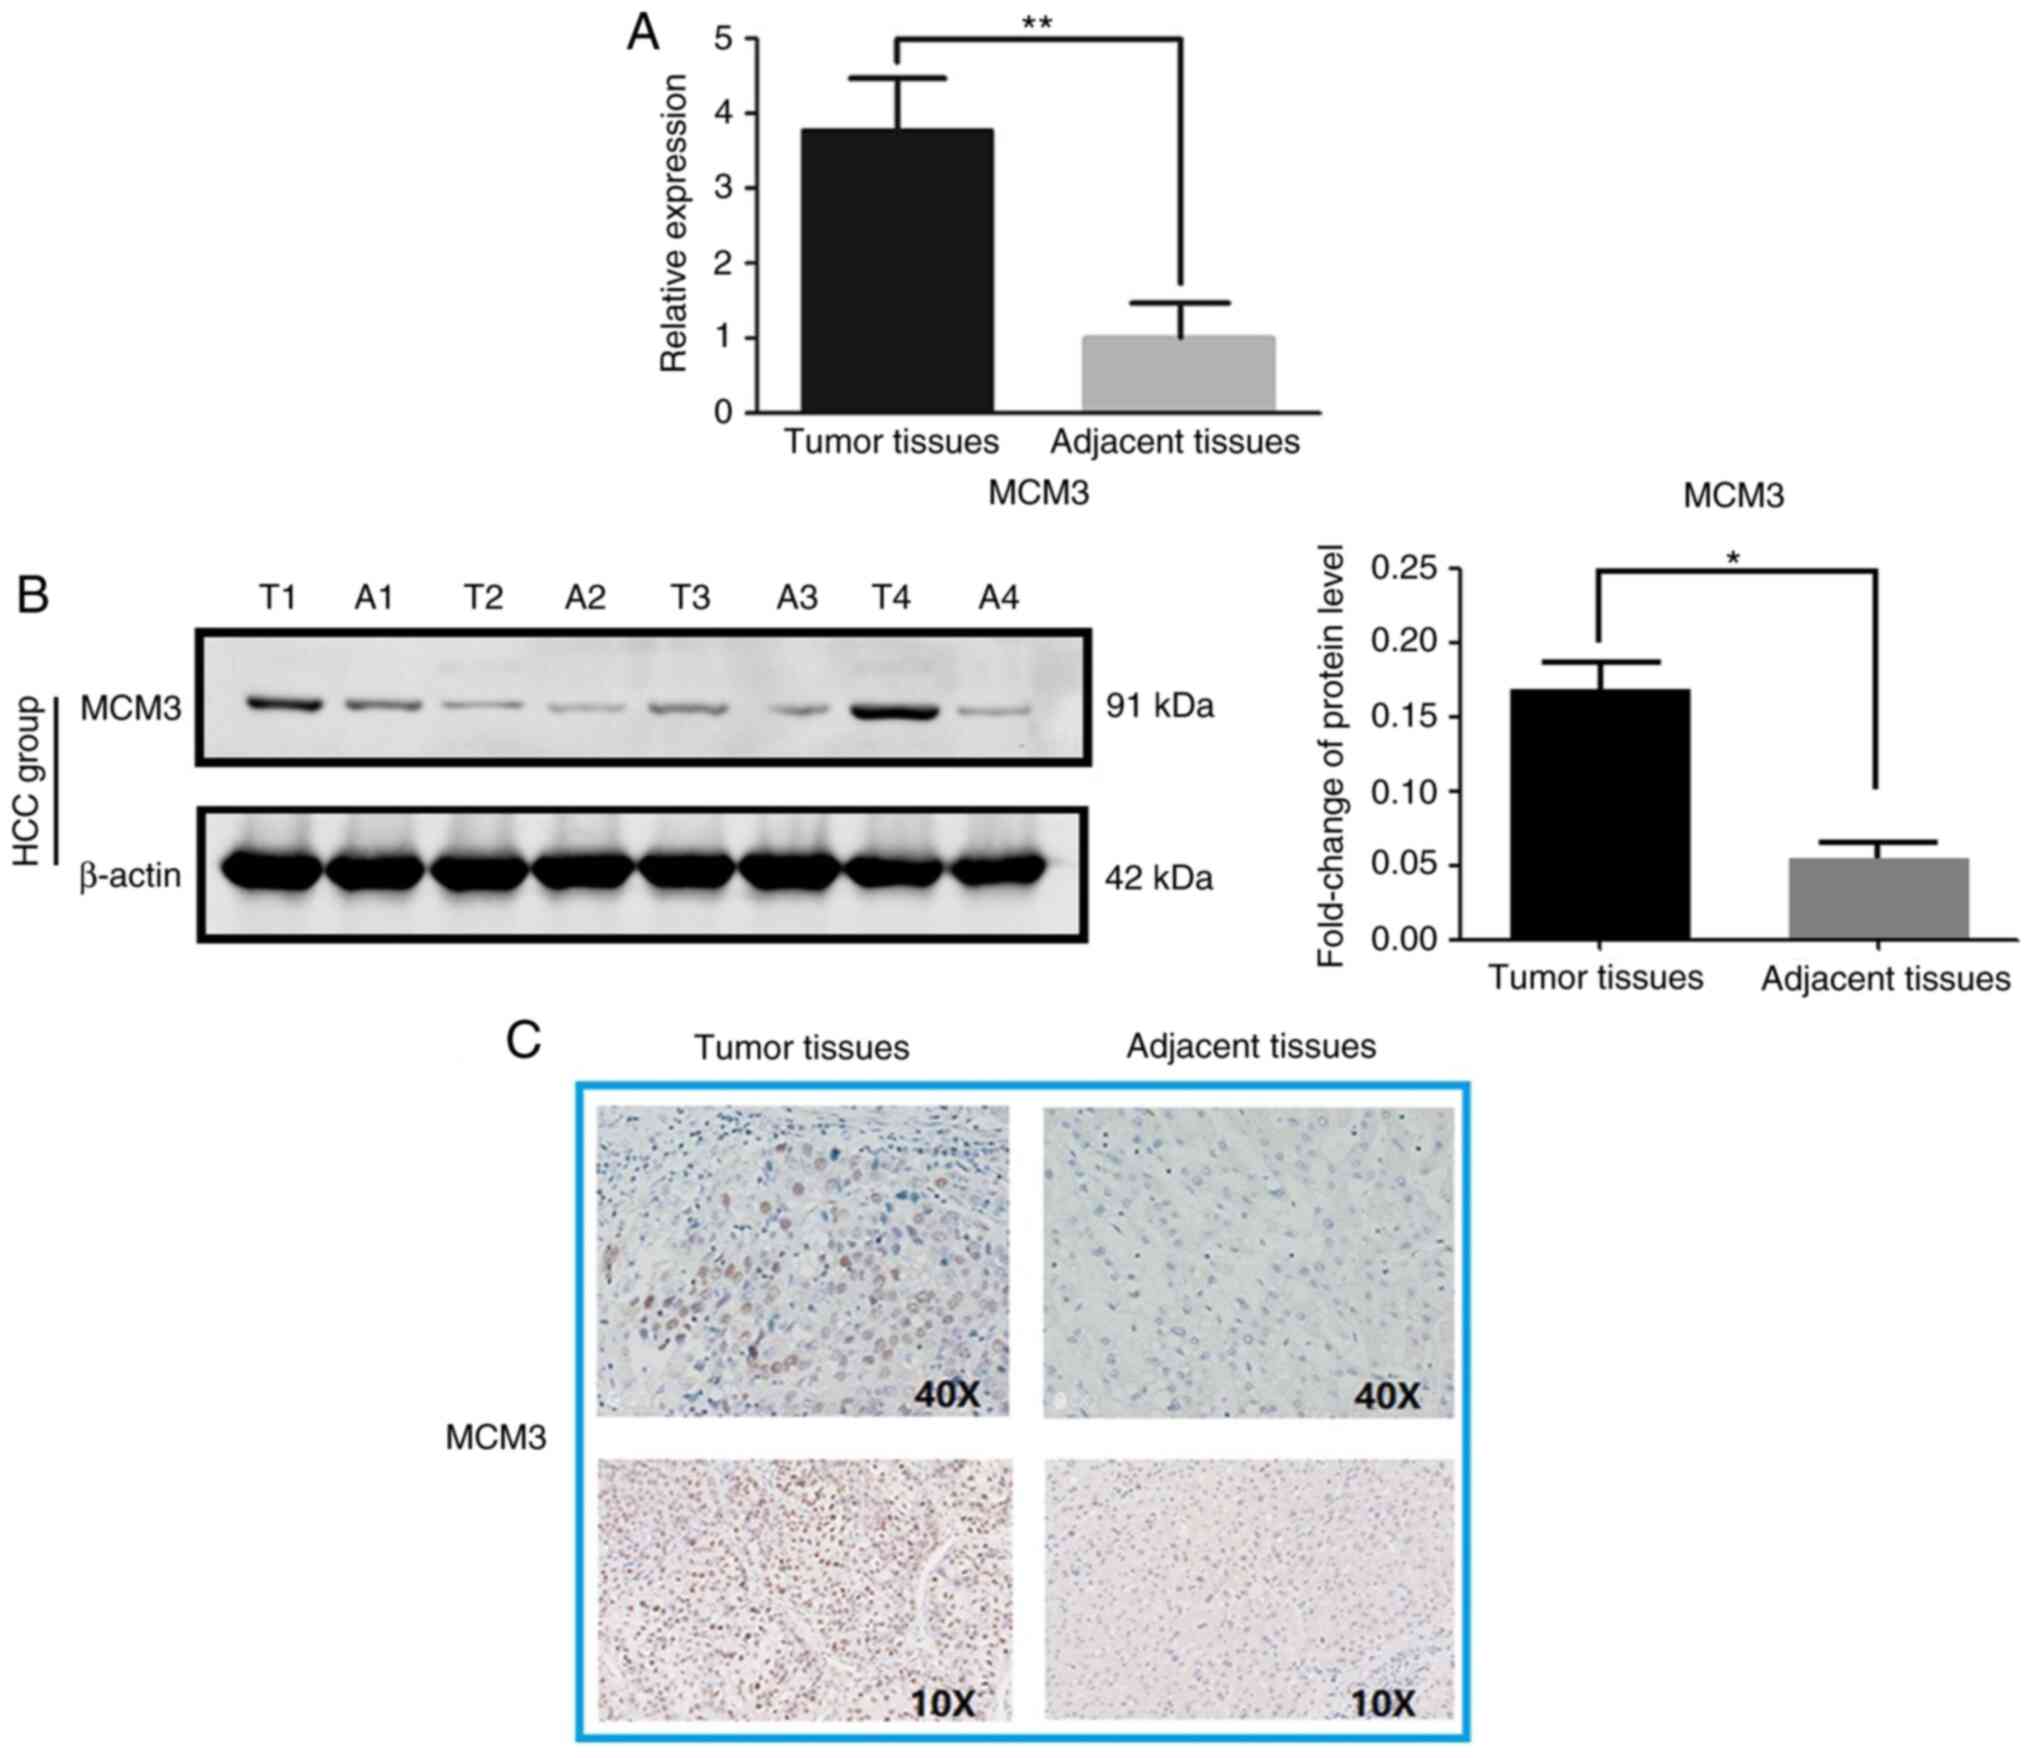
MCM3 expression in HCC and adjacent
tissues
High MCM3 expression at the mRNA and protein levels
in HCC tissues was observed compared with in paired adjacent
tissues (Fig. 2). The RT-qPCR
results indicated that MCM3 mRNA expression was higher in
the HCC tissues than in the adjacent tissues (Fig. 2A). Immunoblotting and IHC
demonstrated increased MCM3 expression in HCC at the protein level
(Fig. 2B and C). Interestingly, MCM3
proteins were primarily observed in the nuclei of tumor cells
(Fig. 2C). The statistical analysis
of IHC data revealed that there was a significant difference
between HCC and adjacent normal tissues, with MCM3 being highly
expressed in 37 (47.4%) of the 78 HCC tissues, whereas there were
only 13 (16.7%) tissues with high MCM3 expression among the
adjacent normal tissues (Table
III).
| Table III.Expression levels of MCM3 in HCC and
adjacent tissues. |
Table III.
Expression levels of MCM3 in HCC and
adjacent tissues.
| MCM3 levels | Labelling
index | HCC tissues, n
(%) | Adjacent tissues, n
(%) | P-value |
|---|
| Negative
expression | 0 | 8 (10.3) | 16 (20.5) | <0.001 |
| Low expression | 1+ | 11 (14.1) | 25 (32.0) |
|
|
| 2+ | 22 (28.2) | 24 (30.8) |
|
| High
expression | 3+ | 37 (47.4) | 13 (16.7) |
|
Association between MCM3 expression
and clinical features of patients with HCC
The analysis of the association between MCM3
expression and the clinical features of the respective patients
revealed that enhanced MCM3 expression was associated with
invasiveness of the tumor cells (Table
IV). However, there was no association identified between MCM3
expression and other clinical features, such as age, sex, smoking,
drinking, HBsAg infection, AFP, E-S grade, ALT, AST and metastasis,
in patients with HCC (Table
IV).
| Table IV.Association between MCM3 expression
levels and clinicopathological characteristics in hepatocellular
carcinoma (n=78). |
Table IV.
Association between MCM3 expression
levels and clinicopathological characteristics in hepatocellular
carcinoma (n=78).
|
|
| MCM3 levels |
|
|---|
|
|
|
|
|
|---|
| Clinical
features | Cases, n | Low/Negative, n
(n=41) | High, n (n=37) | P-value |
|---|
| Age, years |
|
|
|
|
|
≤45 | 31 | 17 | 14 | 0.819 |
|
>45 | 47 | 24 | 23 |
|
| Sex |
|
|
|
|
|
Male | 55 | 31 | 24 | 0.330 |
|
Female | 23 | 10 | 13 |
|
| Smoking |
|
|
|
|
|
Yes | 32 | 19 | 13 | 0.362 |
| No | 46 | 22 | 24 |
|
| Drinking |
|
|
|
|
|
Yes | 36 | 19 | 17 | 1.000 |
| No | 42 | 22 | 20 |
|
| HBsAg
infection |
|
|
|
|
|
Yes | 54 | 28 | 26 | 1.000 |
| No | 24 | 13 | 11 |
|
| AFP, ng/ml |
|
|
|
|
|
≤20 | 26 | 14 | 12 | 1.000 |
|
>20 | 52 | 27 | 25 |
|
| ALT, U/l |
|
|
|
|
|
≤40 | 41 | 23 | 18 | 0.650 |
|
>40 | 37 | 18 | 19 |
|
| AST, U/l |
|
|
|
|
|
≤40 | 37 | 20 | 17 | 0.824 |
|
>40 | 41 | 21 | 20 |
|
| E-S grade |
|
|
|
|
|
I–II | 33 | 17 | 16 | 1.000 |
|
III–IV | 45 | 24 | 21 |
|
| Tumor size
(cm) |
|
|
|
|
| ≤5 | 32 | 18 | 14 | 0.649 |
|
>5 | 46 | 23 | 23 |
|
| Metastasis |
|
|
|
|
|
Yes | 25 | 14 | 11 | 0.809 |
| No | 53 | 27 | 26 |
|
| Invasion |
|
|
|
|
|
Yes | 51 | 22 | 29 | 0.032 |
| No | 27 | 19 | 8 |
|
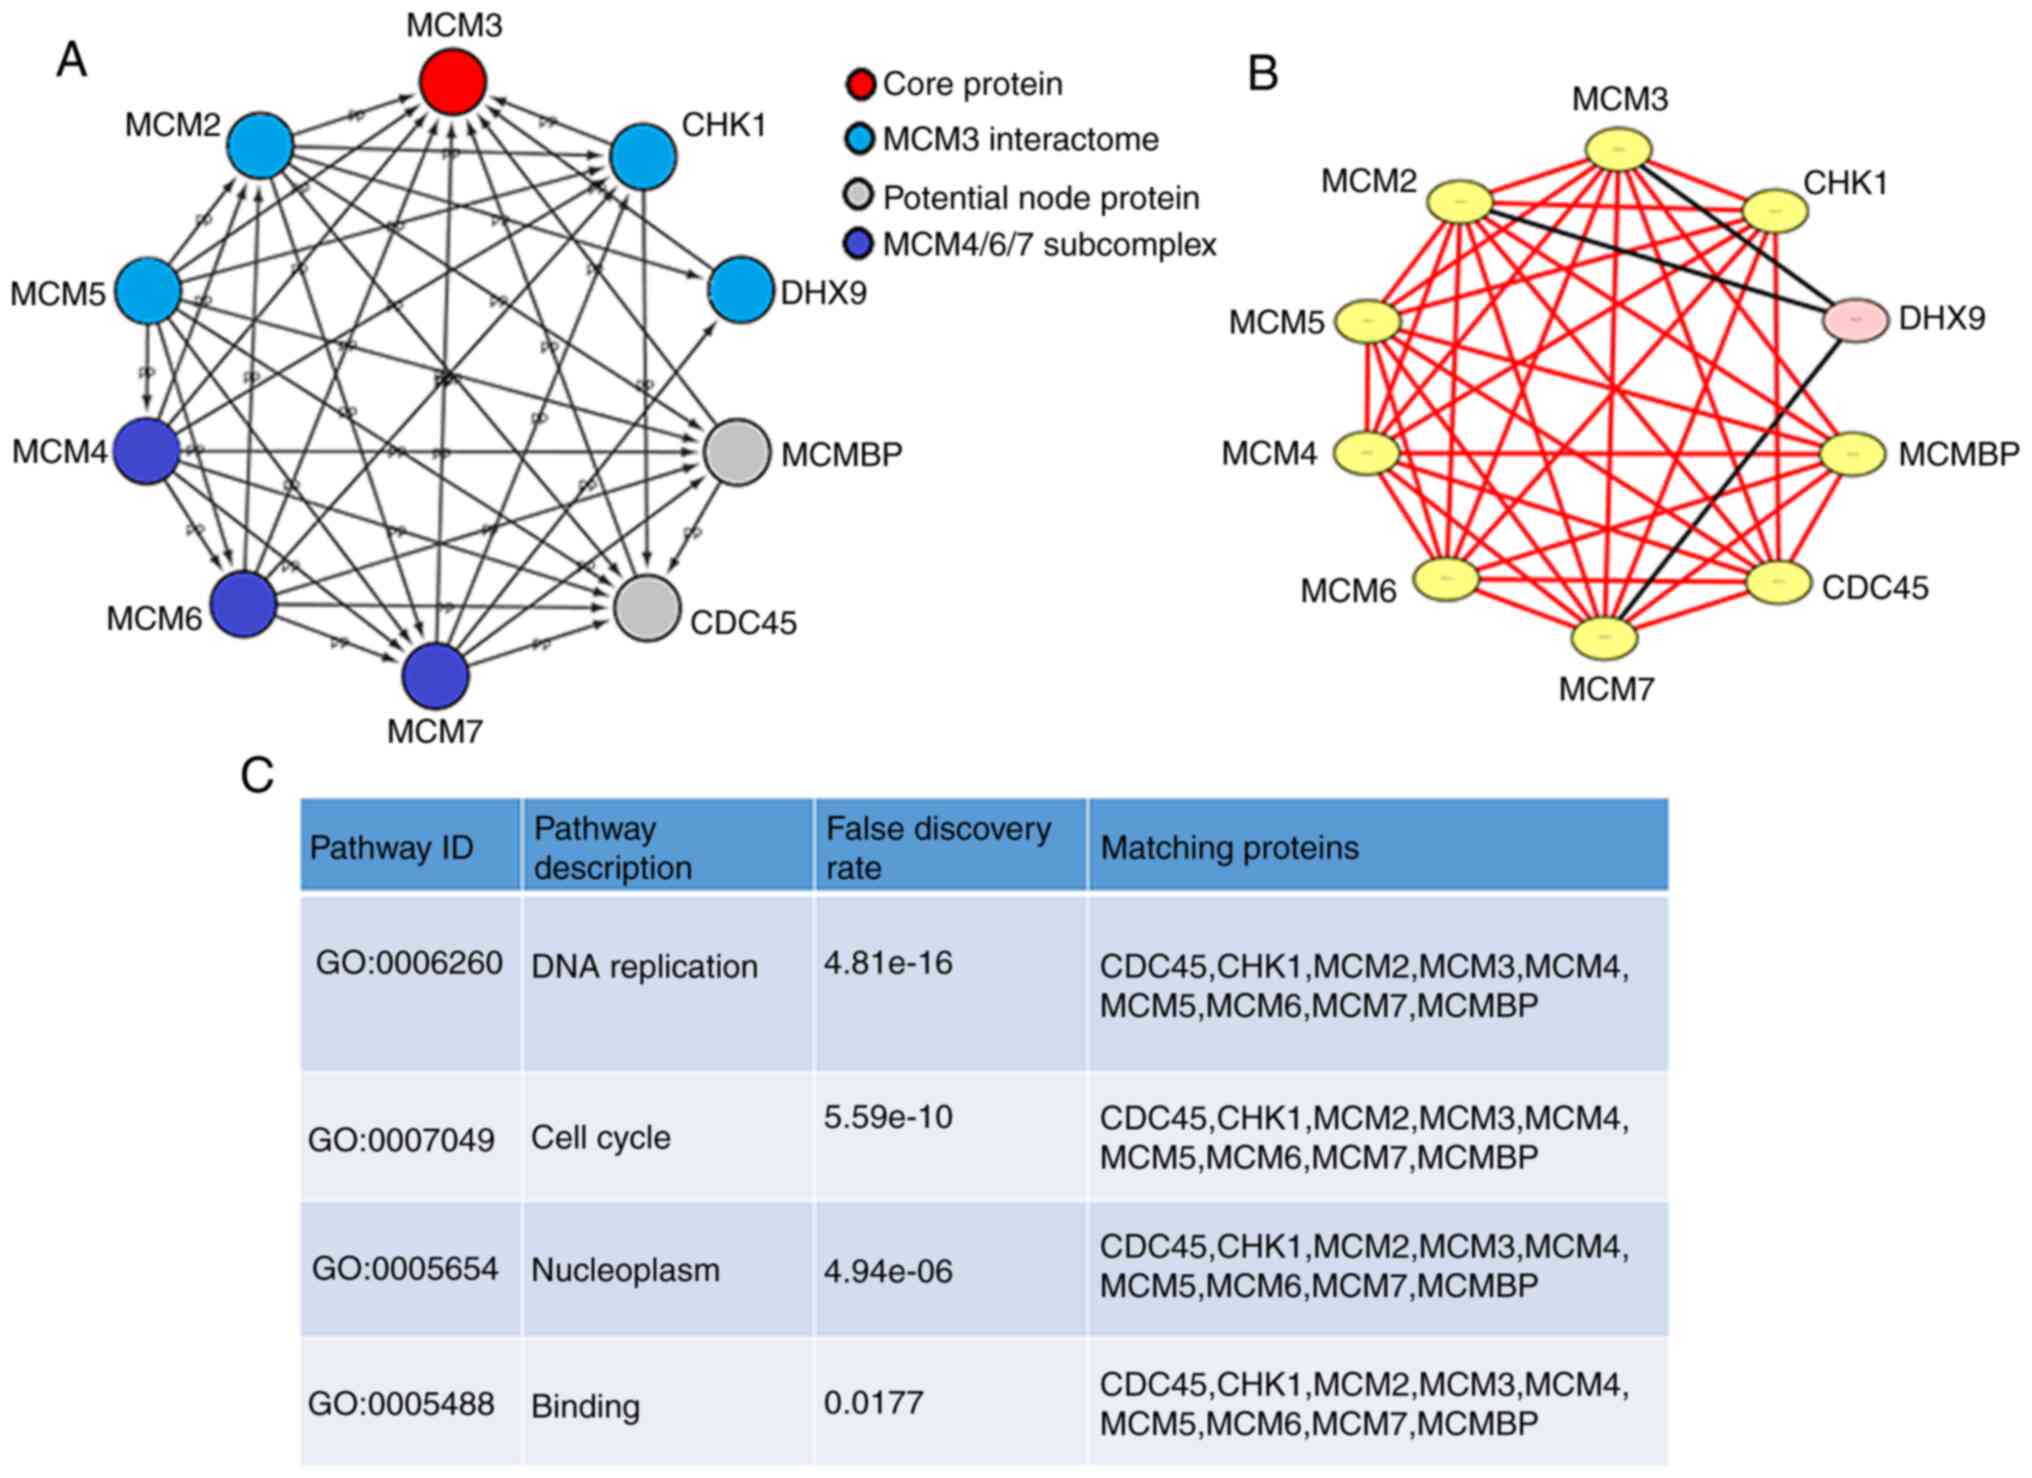
Construction of a PPI network and
module analysis
A PPI network of MCM3 and the proteins that interact
with it, including MCM2-7 and other genes, was generated with
STRING and visualized using Cytoscape (Fig. 3A). MCM4/6/7 formed a core subcomplex,
while MCM3 was associated with both MCM2 and MCM5 and served a
regulatory role in the MCM complex (25). A significant module was obtained from
the PPI network by applying MCODE in Cytoscape (Fig. 3B). The module containing MCM3 was
associated with ‘DNA replication’, ‘cell cycle’, ‘nucleoplasm’ and
‘binding’ (P<0.05, Fig. 3C).
GO functional enrichment analysis and
KEGG pathway enrichment analysis
The significant terms of GO and KEGG enrichment
analysis obtained using STRING are shown in Table V. MCM3 and its interacting proteins
were mainly involved in biological processes, such as ‘DNA
replication’, ‘cell cycle’, ‘cell cycle processes’, and ‘chromosome
organization’. The molecular functions (MFs) mainly included
‘helicase activity’ and numerous binding processes, including ‘ATP
binding’, ‘DNA binding’, ‘heterocyclic compound binding’, ‘organic
cyclic compound binding’ and ‘chromatin binding’. Cell component
annotations suggested that the proteins were enriched predominantly
in the ‘nucleoplasm’ and ‘protein-containing complex’. KEGG
enrichment analysis suggested that MCM3 and its interacting
proteins were associated with the ‘cell cycle’ and ‘DNA
replication’.
| Table V.GO and KEGG pathway enrichment
analyses of MCM3 and its node genes. |
Table V.
GO and KEGG pathway enrichment
analyses of MCM3 and its node genes.
| Category | Pathway ID | Pathway
description | Gene count | Matching
proteins |
|---|
| Biological
process | GO:0006260 | DNA
replication | 10 | CDC45, CHK1, DHX9,
MCM2, MCM3, MCM4, MCM5, MCM6, MCM7, MCMBP |
| Biological
process | GO:0006270 | DNA replication
initiation | 7 | CDC45, MCM2, MCM3,
MCM4, MCM5, MCM6, MCM7 |
| Biological
process | GO:0006261 | DNA-dependent DNA
replication | 8 | CDC45, MCM2, MCM3,
MCM4, MCM5, MCM6, MCM7, MCMBP |
| Biological
process | GO:0000082 | G1/S transition of
mitotic cell cycle | 7 | CDC45, MCM2, MCM3,
MCM4, MCM5, MCM6, MCM7 |
| Biological
process | GO:0032508 | DNA duplex
unwinding | 6 | CDC45, DHX9, MCM2,
MCM4, MCM6, MCM7 |
| Biological
process | GO:0006268 | DNA unwinding
involved in DNA replication | 4 | MCM2, MCM4, MCM6,
MCM7 |
| Biological
process | GO:0007049 | Cell cycle | 9 | CDC45, CHK1, MCM2,
MCM3, MCM4, MCM5, MCM6, MCM7, MCMBP |
| Biological
process | GO:0022402 | Cell cycle
process | 8 | CDC45, MCM2, MCM3,
MCM4, MCM5, MCM6, MCM7, MCMBP |
| Biological
process | GO:0051276 | Chromosome
organization | 8 | CDC45, CHK1, DHX9,
MCM2, MCM4, MCM6, MCM7, MCMBP |
| Biological
process | GO:0033044 | Regulation of
chromosome organization | 3 | CDC45, CHK1,
MCM2 |
| Biological
process | GO:0006282 | Regulation of DNA
repair | 2 | CHK1, DHX9 |
| Biological
process | GO:0060968 | Regulation of gene
silencing | 2 | CDC45, DHX9 |
| Biological
process | GO:0031570 | DNA integrity
checkpoint | 2 | CDC45, CHK1 |
| Biological
process | GO:1902275 | Regulation of
chromatin organization | 2 | CDC45, CHK1 |
| Cell component | GO:0042555 | MCM complex | 6 | MCM2, MCM3, MCM4,
MCM5, MCM6, MCM7 |
| Cell component | GO:0005654 | Nucleoplasm | 10 | CDC45, CHK1, DHX9,
MCM2, MCM3, MCM4, MCM5, MCM6, MCM7, MCMBP |
| Cell component | GO:0044427 | Chromosomal
part | 7 | CDC45, CHK1, DHX9,
MCM2, MCM3, MCM7, MCMBP |
| Cell component | GO:0000228 | Nuclear
chromosome | 6 | CDC45, CHK1, DHX9,
MCM2, MCM3, MCMBP |
| Cell component | GO:0000785 | Chromatin | 5 | CHK1, DHX9, MCM2,
MCM7, MCMBP |
| Cell component | GO:0044454 | Nuclear chromosome
part | 5 | CDC45, DHX9, MCM2,
MCM3, MCMBP |
| Cell component | GO:0032991 | Protein-containing
complex | 9 | CDC45, CHK1, DHX9,
MCM2, MCM3, MCM4, MCM5, MCM6, MCM7 |
| Cell component | GO:0005813 | Centrosome | 4 | CDC45, CHK1, DHX9,
MCM3 |
| Cell component | GO:0043596 | Nuclear replication
fork | 2 | CDC45, MCM3 |
| Cell component | GO:0015630 | Microtubule
cytoskeleton | 5 | CDC45, CHK1, DHX9,
MCM2, MCM3 |
| Cell component | GO:0032993 | Protein-DNA
complex | 2 | CDC45, MCM3 |
| Cell component | GO:0000790 | Nuclear
chromatin | 2 | DHX9, MCMBP |
| Molecular
function | GO:0004386 | Helicase
activity | 8 | CDC45, DHX9, MCM2,
MCM3, MCM4, MCM5, MCM6, MCM7 |
| Molecular
function | GO:0003678 | DNA helicase
activity | 5 | CDC45, DHX9, MCM4,
MCM6, MCM7 |
| Molecular
function | GO:0003688 | DNA replication
origin binding | 4 | CDC45, DHX9, MCM2,
MCM5 |
| Molecular
function | GO:0003697 | Single-stranded DNA
binding | 5 | CDC45, DHX9, MCM4,
MCM6, MCM7 |
| Molecular
function | GO:0005524 | ATP binding | 8 | CHK1, DHX9, MCM2,
MCM3, MCM4, MCM5, MCM6, MCM7 |
| Molecular
function | GO:0003677 | DNA binding | 8 | CDC45, DHX9, MCM2,
MCM3, MCM4, MCM5, MCM6, MCM7 |
| Molecular
function | GO:0043138 | 3′→5′ DNA helicase
activity | 2 | CDC45, DHX9 |
| Molecular
function | GO:1901363 | Heterocyclic
compound binding | 9 | CDC45, CHK1, DHX9,
MCM2, MCM3, MCM4, MCM5, MCM6, MCM7 |
| Molecular
function | GO:0097159 | Organic cyclic
compound binding | 9 | CDC45, CHK1, DHX9,
MCM2, MCM3, MCM4, MCM5, MCM6, MCM7 |
| Molecular
function | GO:0003824 | Catalytic
activity | 9 | CDC45, CHK1, DHX9,
MCM2, MCM3, MCM4, MCM5, MCM6, MCM7 |
| Molecular
function | GO:0003682 | Chromatin
binding | 3 | CDC45, DHX9,
MCMBP |
| Molecular
function | GO:0005488 | Binding | 10 | CDC45, CHK1, DHX9,
MCM2, MCM3, MCM4, MCM5, MCM6, MCM7, MCMBP |
| KEGG | hsa04110 | Cell cycle | 8 | CDC45, CHK1, MCM2,
MCM3, MCM4, MCM5, MCM6, MCM7 |
| KEGG | hsa03030 | DNA
replication | 6 | MCM2, MCM3, MCM4,
MCM5, MCM6, MCM7 |
Expression levels of the MCM3
interactome [MCM2, MCM5, checkpoint kinase 1 (CHK1), and DEAH
(Asp-Glu-Ala-His) box helicase 9 (DHX9)] in HCC
TCGA and RT-qPCR analysis revealed significantly
higher expression levels of MCM2, MCM5, CHK1 and DHX9 in HCC
tissues compared with in normal or adjacent tissues (Fig. 4A and B).
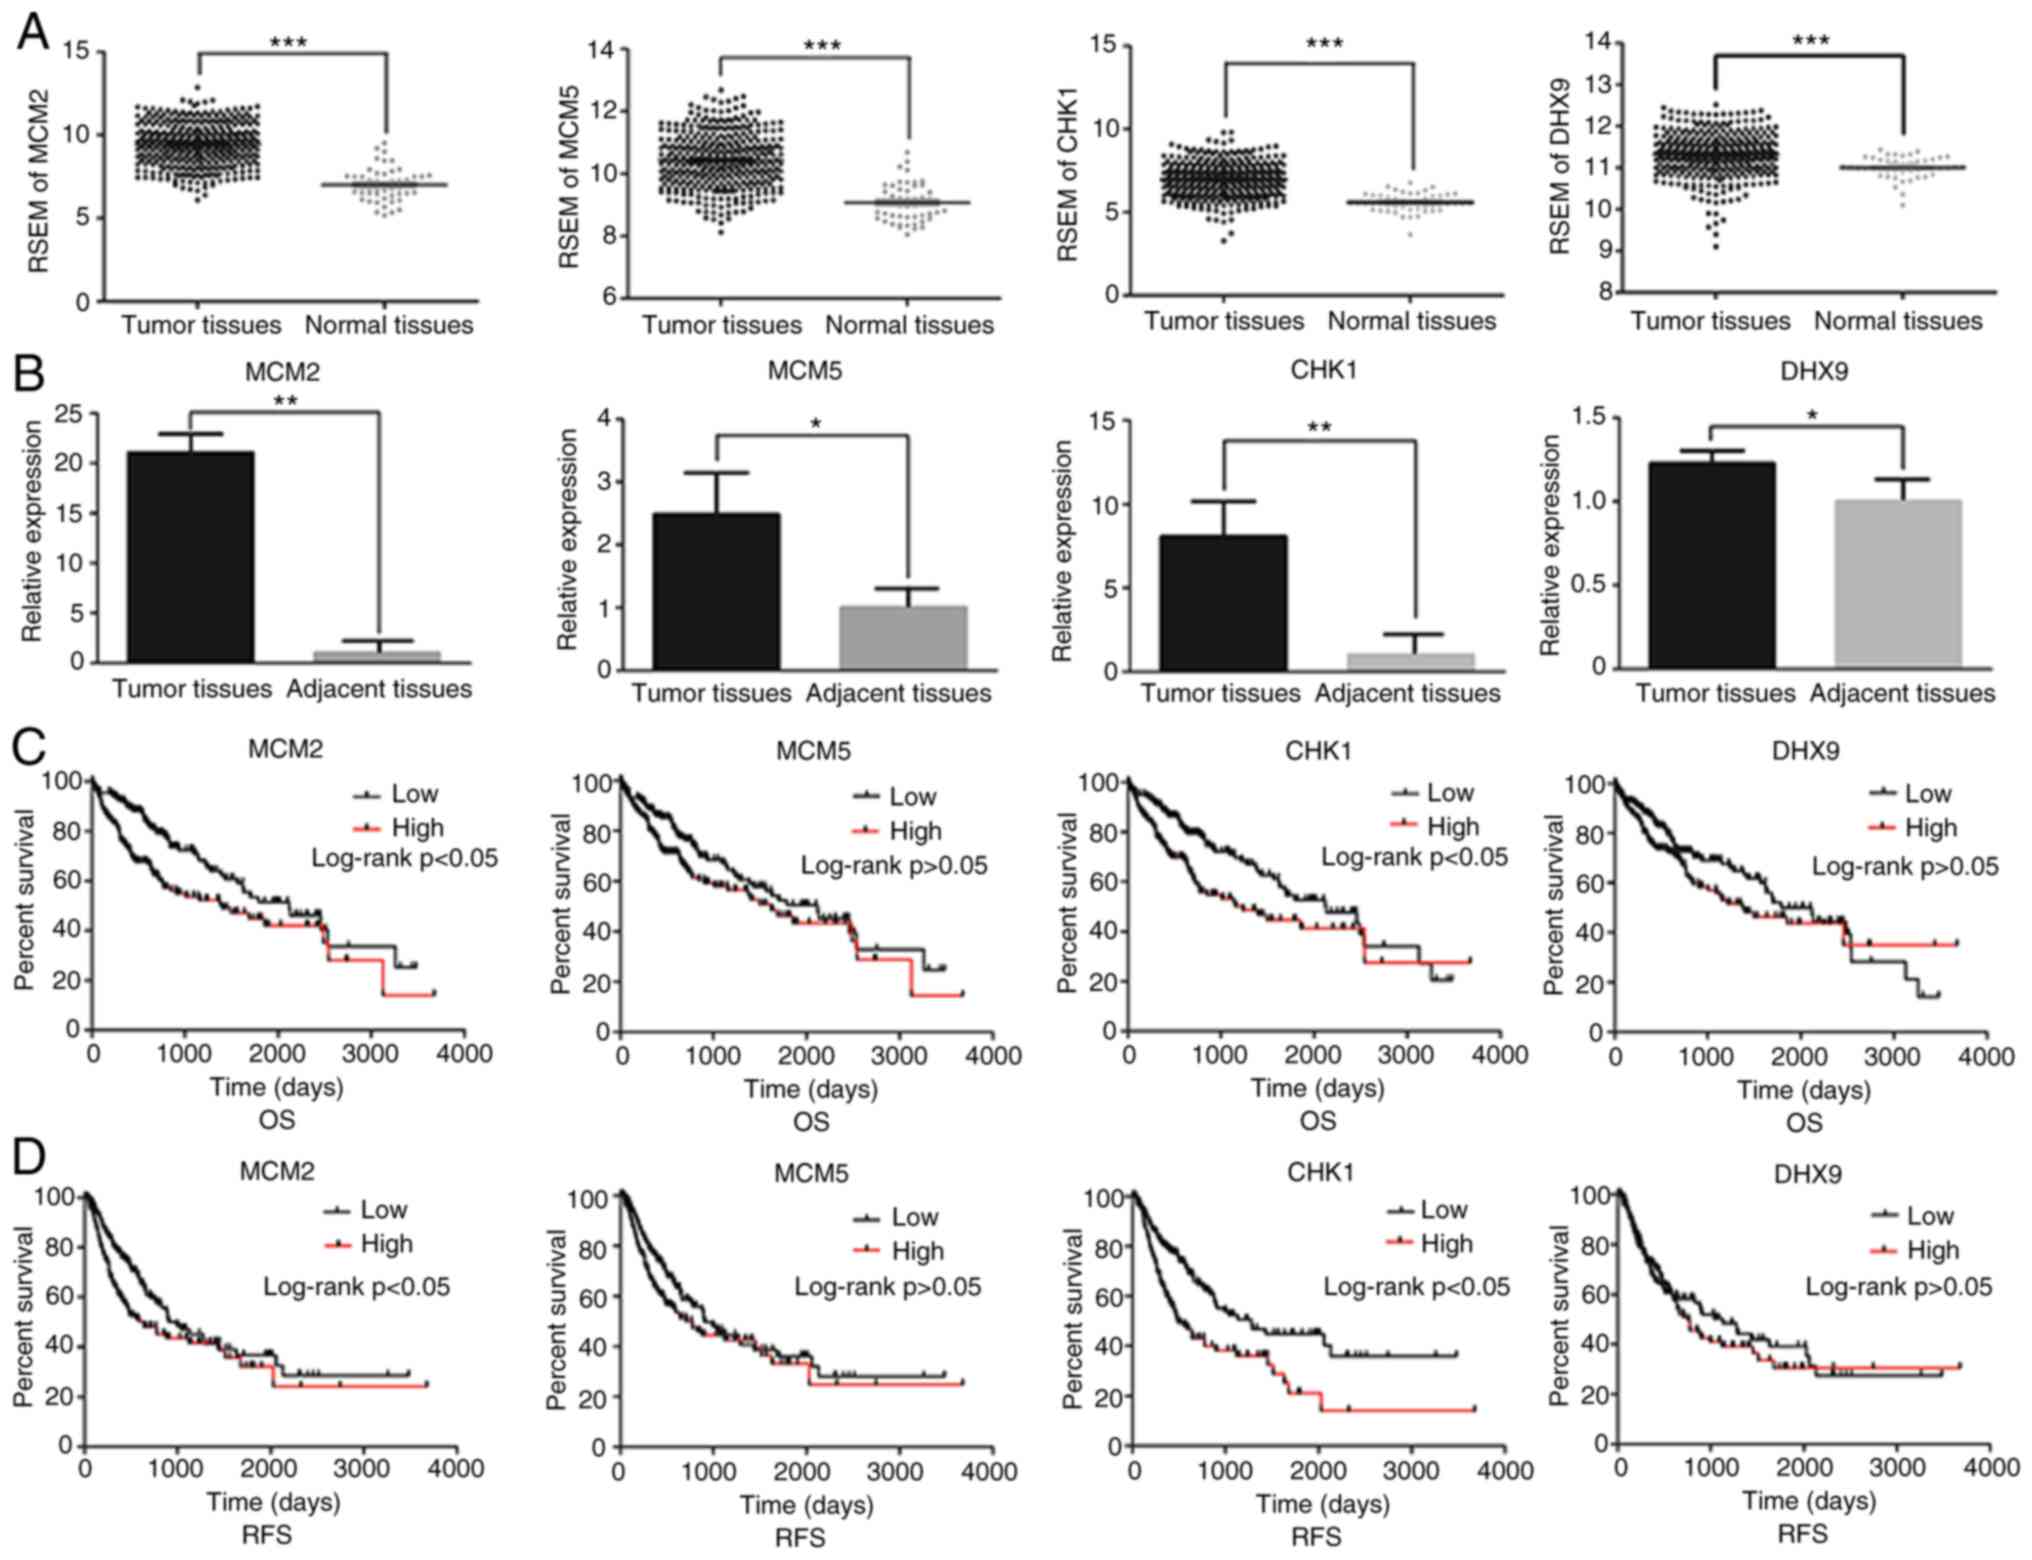 | Figure 4.Impact of MCM3 interacting proteins
in HCC. (A) mRNA expression of MCM2, MCM5, CHK1 and DHX9 in HCC
tissues and normal liver tissues from The Cancer Genome Atlas
database. mRNA expression was normalized by RSEM. (B) Relative mRNA
expression levels of MCM2, MCM5, CHK1 and DHX9 in HCC and adjacent
tissues from the patients recruited in the present study. (C) OS
curves and (D) RFS curves for HCC samples expressing high and low
levels of the indicated MCM3 interacting proteins. MCM,
minichromosome maintenance complex component; CHK1, checkpoint
kinase 1; DHX9, DEAH (Asp-Glu-Ala-His) box helicase 9; HCC,
hepatocellular carcinoma; RSEM, RNA-Seq by
Expectation-Maximization; OS, overall survival; RFS,
recurrence-free survival. *P<0.05, **P<0.01,
***P<0.001. |
Impact of MCM3 interactome (MCM2,
MCM5, CHK1 and DHX9) in patients with HCC
Based on the data from TCGA, the area under the
curve (AUC) of HCC samples expressing MCM2, MCM5, CHK1 and DHX9 was
0.930, 0.895, 0.883 and 0.727, respectively, according to RSEM
analysis (Table VI). The
sensibility and specificity of these genes in indicating HCC
diagnosis are shown in Table VI.
Furthermore, high expression levels of MCM2 and CHK1 were
associated with poor OS and RFS (Fig. 4C
and D).
| Table VI.Sensitivity and specificity of
hepatocellular carcinoma diagnosis by analyzing the expression of
MCM3 and its interacting proteins. |
Table VI.
Sensitivity and specificity of
hepatocellular carcinoma diagnosis by analyzing the expression of
MCM3 and its interacting proteins.
| Diagnostic
marker | AUC | Sensitivity, % | Specificity, % |
|---|
| MCM2 | 0.930 | 85.95 | 88 |
| MCM3 | 0.932 | 85.40 | 92 |
| MCM5 | 0.895 | 74.93 | 92 |
| CHK1 | 0.883 | 75.76 | 90 |
| DHX9 | 0.727 | 52.34 | 96 |
| Model 1 (CHK1 and
MCM3)a | 0.975 | 88.15 | 100 |
| Model 2 (DHX9 and
MCM3)b | 0.967 | 99.17 | 94 |
| Model 3 (MCM2, MCM3
and MCM5)c | 0.989 | 98.35 | 94 |
In order to improve the HCC diagnosis efficiency,
three combined models were generated. The ROC curve of model 1,
which had the highest specificity of any of the models, combined
the utility of CHK1 and MCM3 (Fig.
5A). The sensitivity and specificity of model 1 were 88.15 and
100%, respectively (Table VI).
Model 2, combining the utility of DHX9 and MCM3, had a sensitivity
and specificity of 99.17 and 94.00%, respectively, and its
sensitivity was the highest of the three models (Table VI; Fig.
5B). Model 3 combined the utility of MCM2, MCM3 and MCM5, and
had a sensitivity and specificity of 98.35 and 94.00%, respectively
(Table VI; Fig. 5C). The AUCs of models 1, 2 and 3 were
0.975, 0.967 and 0.989, respectively, which were higher than those
of MCM3 or any of its interacting proteins alone (Table VI; Fig.
5). The specific algorithm of each model is indicated in
Table VI.
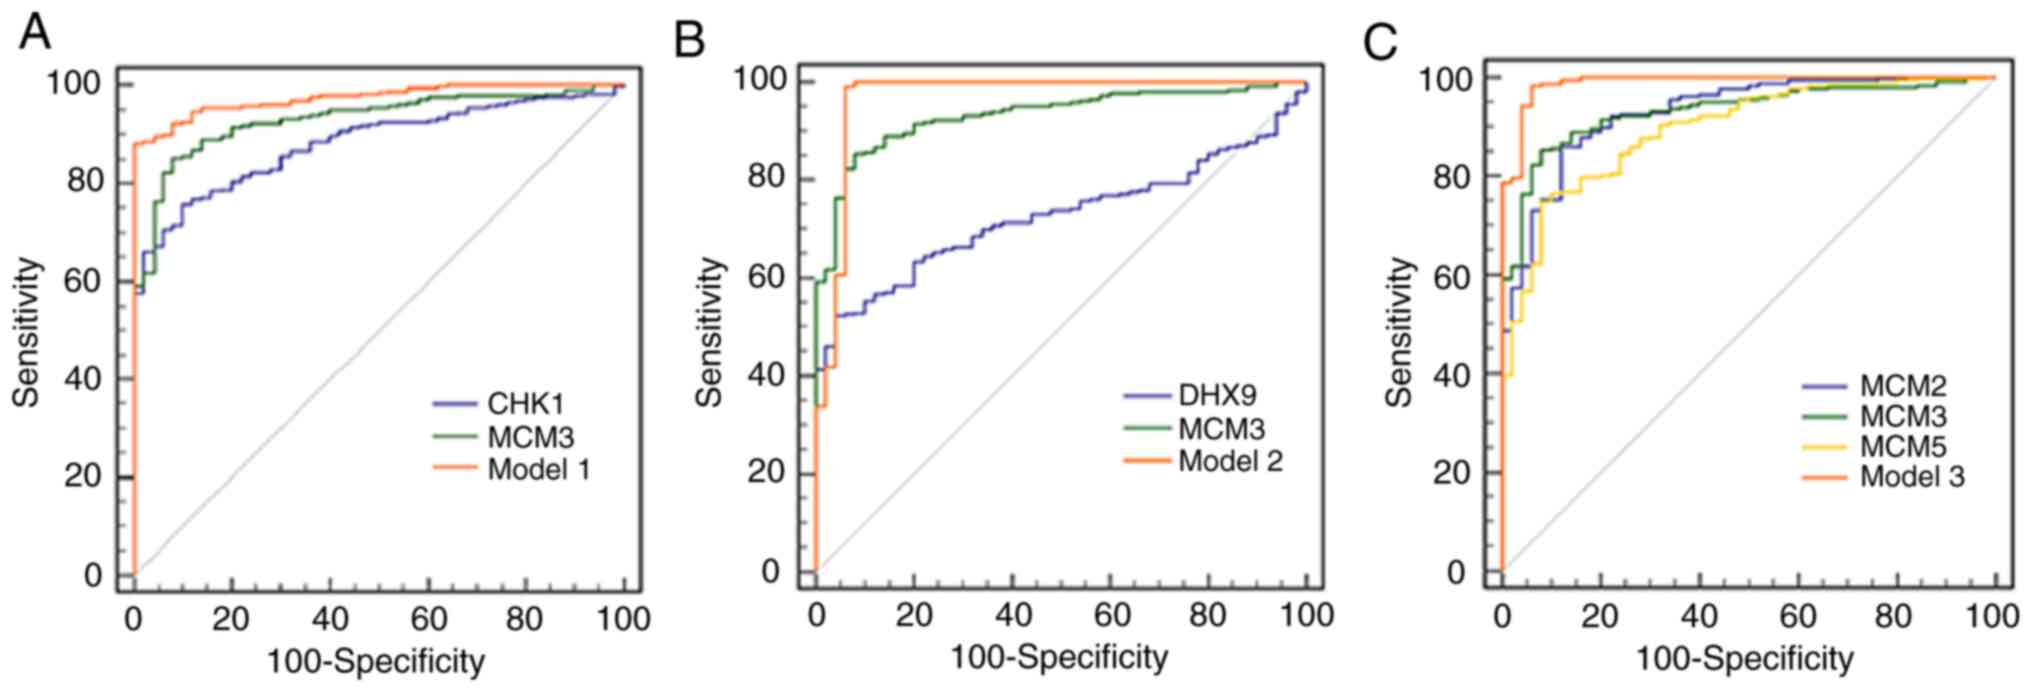 | Figure 5.ROC curves of different genes and
combined models for diagnosis of hepatocellular carcinoma. The
orange solid ROC curve represents models with combined proteins.
(A) ROC curves of CHK1, MCM3 and model 1. Model 1 was the
combination of CHK1 and MCM3. P<0.05 for AUC of Model 1 vs. CHK1
or MCM3. (B) ROC curves of DHX9, MCM3 and model 2. Model 2 was the
combination of DHX9 and MCM3. P<0.05 for AUC of Model 2 vs. DHX9
or MCM3. (C) ROC curves of MCM2, MCM3, MCM5 and model 3. Model 3
was the combination of MCM2, MCM3 and MCM5. P<0.05 for AUC of
Model 3 vs. MCM2, MCM3 or MCM5. ROC, receiver operating
characteristic; CHK1, checkpoint kinase 1; MCM, minichromosome
maintenance complex component; AUC, area under the curve; DHX9,
DEAH (Asp-Glu-Ala-His) box helicase 9. |
Discussion
Studies have indicated that MCM3 is overexpressed in
certain carcinomas, such as melanoma, prostate cancer, cervical
squamous cell carcinoma and salivary gland tumors (1,5,12). However, little research has been
conducted on MCM3 in HCC. Recent studies have only focused on the
prognostic or diagnostic value of MCM3 in HCC (26,27),
whereas the effect of MCM3 in Chinese patients with HCC remains
unclear. Furthermore, the aforementioned studies did not reveal an
association between MCM3 and HCC clinical features or the
diagnostic ability of MCM3 in combination with its interacting
proteins. In the present study, MCM3 mRNA and protein expression
was found to be higher in HCC tissues than in adjacent tissues.
Analysis of MCM3 using the TCGA database revealed that high MCM3
expression was associated with high AFP levels and an advanced E-S
grade. Furthermore, high MCM3 expression was associated with poor
OS and RFS, suggesting that high MCM3 expression levels may be
predictive of a poor OS and RFS in HCC. Furthermore, in HCC tissues
collected from a cohort of Chinese patients, high mRNA expression
levels of MCM3 were associated with HCC invasion. Previous studies
have suggested that tumor invasion is associated with poor outcomes
in numerous types of cancer, including HCC (28–32). The
present study suggested that MCM3 may be a novel prognostic marker
of HCC and that high MCM3 expression may be associated with poor
disease outcomes. AFP is a common diagnostic marker for patients
with HCC, which is also used to evaluate tumor recurrence (17). A previous study demonstrated that
high AFP expression was related to the poor prognosis of patients,
and the higher the expression of serum AFP, the worse the prognosis
of patients (17). However, there
was no association identified between MCM3 expression levels and
AFP levels (or E-S grade) in Chinese patients with HCC. On the one
hand, TCGA mainly consists of data from Caucasian populations,
whereas the current study included HCC tissues from a Chinese
population. Hence, ethnic diversity may be responsible for the
observed difference. However, there was a considerable difference
in the sample size between the collected HCC samples and samples
from TCGA, which may also be a possible reason why there was no
association between MCM3 expression and AFP levels in the current
cohort. Therefore, further analysis including more HCC samples from
Chinese patients and additional ethnicities would help to elucidate
the discrepancy in the outcome observed between TCGA and the
analyzed cohort of Chinese patients. Furthermore, it would be
helpful to understand the association between the expression levels
of MCM3 and AFP levels.
The GO and KEGG enrichment analysis revealed that
MCM3 and its interacting proteins, including DHX9, CHK1 and MCM
components (MCM2/5), were associated with ‘DNA replication’ and
‘cell cycle’. Interestingly, the MFs showed that they participated
in numerous binding processes, indicating that abnormal expression
of MCM3 and its interacting proteins may have adverse effects in
normal cells, which could be a vital trigger leading to HCC.
The regulation of cell proliferation is fundamental
for cell growth and the prevention of cancer. An important step in
the regulation of cell proliferation lies in regulating the
initiation of DNA synthesis (33).
MCM proteins are essential DNA replication factors serving a role
in initiating DNA synthesis once per cell cycle (34). Altered levels of MCM proteins have
been detected in malignant human cancer cells, such as melanoma,
prostate cancer, cervical squamous cell carcinoma, salivary gland
tumors, and pre-cancerous cells undergoing malignant transformation
(34). DNA replication triggered by
the activity of the MCM2-7 complex consists of the MCM4/6/7 core
complex and the loosely associated MCM2 and MCM3/5 (25). Previous studies have indicated that
both the MCM2 protein and MCM3/5 complex inhibit MCM4/6/7 helicase
activity by disassembling the MCM4/6/7 hexamer into the MCM2/4/6/7
and MCM3/4/5/6/7 complexes, respectively (25,35). The
inhibitory role of MCM3 may be based on the simple mechanism that
free MCM3 and/or MCM3/5 decrease the amount of their adjacent MCM
partners, which is associated with the presence of 2–3 times higher
MCM3 levels than those of any of the other five MCM proteins
(35). Furthermore, MCM3/5 has a
direct role in transcription, and increased levels of MCM5 are
associated with the activation of transcription (36).
In the present study, MCM2, MCM3 and MCM5 levels
were identified to be elevated in HCC. Juríková et al
(36) suggested that the expression
levels of all MCM proteins are associated with each other in
disease prognosis and that co-overexpression of the six MCM
proteins is higher in breast cancer compared with control samples.
Depletion or mutation of one MCM protein has been revealed to
decrease the levels of all other MCM proteins (35). The present results indicated that
MCM2, MCM3 and MCM5 expression was increased in HCC. Furthermore,
high levels of MCM2 and MCM3 were associated with poor OS and RFS.
Hua et al (37) reported that
elevated MCM2 and MCM3 mRNA levels are associated with poor
outcomes in patients with glioma and these proteins could be
clinically useful molecular prognostic markers for glioma.
Similarly, research has indicated that MCM2 and MCM3 act as
oncogenes in osteosarcoma by conducting in vitro experiments
(38). However, in HCC, the role and
the underlying mechanism of MCM2, MCM3 and MCM5 remain unclear.
DHX9 is an enzyme that catalyzes the ATP-dependent
unwinding of double-stranded RNA and DNA-RNA complexes. DHX9 mainly
binds to inverted-repeat Alu elements and inhibits the production
of circular RNAs (39). Abnormal
DHX9 expression has been detected in different tumors, including
HCC, colorectal cancer, lung cancer, osteosarcoma, breast cancer
and prostate cancer (38–41). A previous study indicated that DHX9
interacts with MCM2 and MCM3 in osteosarcoma cells (38). In addition, the decreased growth of
osteosarcoma cells due to MCM2 or MCM3 knockdown is reversed by
DHX9 overexpression, indicating that MCM2 and MCM3 activity is
DHX9-dependent (38). In the present
study, DHX9 mRNA levels were found to be increased in HCC tissues
compared with in adjacent tissues. It has been reported that MCM2
and MCM3 function through DHX9 and that the MCM2/3-DHX9 axis may
mediate transcription, translation and DNA replication in
osteosarcoma (42,43). The findings of the present study
revealed that DHX9 may coordinate with MCM2/MCM3 in HCC, suggesting
that targeting the MCM2/3-DHX9 axis may be a feasible and effective
strategy for HCC treatment (38).
However, the exact role of the MCM2/3-DHX9 axis in proliferation of
HCC requires further study.
CHK1 is a central protein involved in the DNA damage
response (DDR), particularly responding to damage caused by
cytotoxic agents. Increased CHK1 expression has been identified in
a variety of human tumors, including breast, colon, gastric and
nasopharyngeal cancer (44). In the
present study, CHK1 was found to be overexpressed in HCC, which is
consistent with previous studies (45,46). Han
et al (47), suggested that
CHK1 serves a fundamental role in the phosphorylation of MCM3 at
Ser-205 under normal cell growth conditions. MCM3 phosphorylation
by CHK1 negatively inhibits normal DNA replication, whereas CHK1
inhibition leads to increased DNA replication (47). The present study demonstrated that
CHK1 and MCM3 were upregulated in HCC, and high CHK1 expression was
associated with poor OS and RFS. As higher CHK1 expression is
associated with an enhanced ability to respond to DNA damage,
thereby promoting DNA replication (44), HCC cells may display increased
proliferation and improved resistance to DNA damage compared with
normal cells. A previous study has also suggested that malignant
tumor cells can survive severe DNA replication stress, which
results in the DDR (48). CHK1 could
phosphorylate multiple targets in the DDR, such as MCM3 and p53
(47,48).
ROC curves were constructed based on the TCGA data.
The AUC for MCM3 was larger than that for MCM2, MCM3, CHK1 and
DHX9, suggesting that MCM3 may be a valuable marker in the
diagnosis of HCC. The three combined models displayed enhanced HCC
diagnostic ability compared with MCM3 alone. At optimal cut-offs
with the maximal Youden index, model 1 had the highest specificity,
model 2 had the highest sensitivity and the AUC of model 3 was the
largest. The results of the present study suggest that the
properties of multi-gene HCC diagnosis are affected by the genes
included in the combined model. MCM3 and its combined models had
higher sensitivities and specificities than existing HCC diagnostic
markers, such as glypican-3 and AFP, which had pooled sensitivities
and specificities of 0.55 (95% CI, 0.52–0.58) and 0.58 (95% CI,
0.54–0.61), and 0.54 (95% CI, 0.51–0.57) and 0.83 (95% CI,
0.80–0.85), respectively (49).
In conclusion, higher MCM3 expression levels were
identified in HCC than in normal liver tissues, and high MCM3
expression was associated with high AFP levels and advanced E-S
grade. Additionally, high MCM3 expression was associated with poor
OS and RFS. Furthermore, in HCC tissues collected from Chinese
patients, high MCM3 expression was associated with HCC invasion.
Functional and pathway enrichment analysis revealed that MCM3 and
its interacting proteins were primarily involved in ‘DNA
replication’, ‘cell cycle’ and in the binding process with numerous
substrates (DNA/protein/organic compounds). Similarly, TCGA and
RT-qPCR analysis demonstrated that the expression levels of MCM3
interactome proteins (MCM2/5, CHK1 and DHX9) were increased in HCC.
An algorithm combining the ROCs of MCM3 and the other interaction
partners was more specific and sensitive for the diagnosis HCC than
other conventional HCC diagnostic markers. The present study
revealed that MCM3 and its interacting proteins may be potential
novel diagnostic markers for HCC.
Acknowledgements
The authors would like to thank Professor Guandou
Yuan (Division of Hepatobiliary Surgery, The First Affiliated
Hospital of Guangxi Medical University, Nanning, China) for his
help in revising the manuscript.
Funding
The present study was supported by The National
Nature Science Foundation of China (grant nos. 81660497 and
81660460), The Natural Science Foundation of Guangxi (grant nos.
GuikeAB17195006, 2016GXNSFDA380010 and 2016GXNSFBA380016) and the
Students' Platform for Innovation and Entrepreneurship Training
Program (grant no. 2018118).
Availability of data and materials
The datasets used and/or analyzed during the present
study are available from the corresponding author on reasonable
request.
Authors' contributions
HTL, XW, BW, ZQL and XLY contributed to the
conception and design of the study, analysis of the data,
interpretation of the results and the writing of the manuscript.
WXJ, XW, HTL, YZX, JYL, MNS, SXC, NFM and DZ conducted the
experiments and contributed to the acquisition of data. XW, WPZ,
JQ, PL and QLZ analyzed the data. XLY reviewed and edited the
manuscript. All authors read and approved the final manuscript.
Ethics approval and consent to
participate
This research project was approved by the Ethics and
Human Subjects Committee (EHSC) of Guilin Medical University and
conformed to the provisions of the Declaration of Helsinki.
Informed consent was obtained from each patient included in the
present study.
Patient consent for publication
Not applicable.
Competing interests
The authors declare that they have no competing
interests.
Glossary
Abbreviations
Abbreviations:
|
MCM3
|
minichromosome maintenance complex
component 3
|
|
HCC
|
hepatocellular carcinoma
|
|
TCGA
|
The Cancer Genome Atlas
|
|
RT-qPCR
|
reverse transcription-quantitative
PCR
|
|
ROC
|
receiver operating characteristic
|
|
AFP
|
α-fetoprotein
|
|
ALT
|
alanine aminotransferase
|
|
AST
|
aspartate transaminase
|
|
PPI
|
protein-protein interaction
|
|
STRING
|
Search Tool for the Retrieval of
Interacting Genes
|
|
MCODE
|
Molecular Complex Detection
|
|
OS
|
overall survival
|
|
RFS
|
recurrence-free survival
|
|
MF
|
molecular functions
|
|
CHK1
|
checkpoint kinase 1
|
|
DHX9
|
DEAH (Asp-Glu-Ala-His) box helicase
9
|
|
DDR
|
DNA damage response
|
|
AUC
|
area under the curve
|
|
RSEM
|
RNA-Seq by
Expectation-Maximization
|
|
GO
|
Gene Ontology
|
|
KEGG
|
Kyoto Encyclopedia of Genes and
Genomes
|
|
E-S grade
|
pathological Edmondson-Steiner
grade
|
References
|
1
|
Maiorano D, Lutzmann M and Mechali M: MCM
proteins and DNA replication. Curr Opin Cell Biol. 18:130–136.
2006. View Article : Google Scholar : PubMed/NCBI
|
|
2
|
Forsburg SL: Eukaryotic MCM proteins:
Beyond replication initiation. Microbiol Mol Biol Rev. 68:109–131.
2004. View Article : Google Scholar : PubMed/NCBI
|
|
3
|
Lee JK and Hurwitz J: Isolation and
characterization of various complexes of the minichromosome
maintenance proteins of Schizosaccharomyces pombe. J Biol Chem.
275:18871–18878. 2000. View Article : Google Scholar : PubMed/NCBI
|
|
4
|
Takei Y and Tsujimoto G: Identification of
a novel MCM3-associated protein that facilitates MCM3 nuclear
localization. J Biol Chem. 273:22177–22180. 1998. View Article : Google Scholar : PubMed/NCBI
|
|
5
|
Stewart PA, Khamis ZI, Zhau HE, Duan P, Li
Q, Chung LWK and Sang QA: Upregulation of minichromosome
maintenance complex component 3 during epithelial-to-mesenchymal
transition in human prostate cancer. Oncotarget. 8:39209–39217.
2017. View Article : Google Scholar : PubMed/NCBI
|
|
6
|
Mulvaney KM, Matson JP, Siesser PF, Tamir
TY, Goldfarb D, Jacobs TM, Cloer EW, Harrison JS, Vaziri C, Cook JG
and Major MB: Identification and characterization of MCM3 as a
Kelch-like ECH-associated protein 1 (KEAP1) substrate. J Biol Chem.
291:23719–23733. 2016. View Article : Google Scholar : PubMed/NCBI
|
|
7
|
Guo J, Ma Z, Ma Q, Wu Z, Fan P, Zhou X,
Chen L, Zhou S, Goltzman D, Miao D and Wu E: 1, 25(OH)2D3 inhibits
hepatocellular carcinoma development through reducing secretion of
inflammatory cytokines from immunocytes. Curr Med Chem.
20:4131–4141. 2013. View Article : Google Scholar : PubMed/NCBI
|
|
8
|
Liu D, Staveley-O'Carroll KF and Li G:
Immune-based therapy clinical trials in hepatocellular carcinoma. J
Clin Cell Immunol. 6:3762015. View Article : Google Scholar : PubMed/NCBI
|
|
9
|
Kim HS and El-Serag HB: The epidemiology
of hepatocellular carcinoma in the USA. Curr Gastroenterol Rep.
21:172019. View Article : Google Scholar : PubMed/NCBI
|
|
10
|
Cui J, Zhou XD, Liu YK, Tang ZY and Zile
MH: Abnormal beta-catenin gene expression with invasiveness of
primary hepatocellular carcinoma in China. World J Gastroenterol.
7:542–546. 2001. View Article : Google Scholar : PubMed/NCBI
|
|
11
|
Ishibashi Y, Kinugasa T, Akagi Y, Ohchi T,
Gotanda Y, Tanaka N, Fujino S, Yuge K, Kibe S, Yoshida N, et al:
Minichromosome maintenance protein 7 is a risk factor for
recurrence in patients with Dukes C colorectal cancer. Anticancer
Res. 34:4569–4575. 2014.PubMed/NCBI
|
|
12
|
Kato K, Toki T, Shimizu M, Shiozawa T,
Fujii S, Nikaido T and Konishi I: Expression of
replication-licensing factors MCM2 and MCM3 in normal,
hyperplastic, and carcinomatous endometrium: Correlation with
expression of Ki-67 and estrogen and progesterone receptors. Int J
Gynecol Pathol. 22:334–340. 2003. View Article : Google Scholar : PubMed/NCBI
|
|
13
|
Lau KM, Chan QK, Pang JC, Li KK, Yeung WW,
Chung NY, Lui PC, Tam YS, Li HM, Zhou L, et al: Minichromosome
maintenance proteins 2, 3 and 7 in medulloblastoma: Overexpression
and involvement in regulation of cell migration and invasion.
Oncogene. 29:5475–5489. 2010. View Article : Google Scholar : PubMed/NCBI
|
|
14
|
Chevalier S and Blow JJ: Cell cycle
control of replication initiation in eukaryotes. Curr Opin Cell
Biol. 8:815–821. 1996. View Article : Google Scholar : PubMed/NCBI
|
|
15
|
Carreon-Burciaga RG, Gonzalez-Gonzalez R,
Molina-Frechero N and Bologna-Molina R: Immunoexpression of Ki-67,
MCM2, and MCM3 in ameloblastoma and ameloblastic carcinoma and
their correlations with clinical and histopathological patterns.
Dis Markers. 2015:6830872015. View Article : Google Scholar : PubMed/NCBI
|
|
16
|
Zhou L, Wang SB, Chen SG, Qu Q and Rui JA:
Prognostic value of ALT, AST, and AAR in hepatocellular carcinoma
with B-Type hepatitis-associated cirrhosis after radical
hepatectomy. Clin Lab. 64:1739–1747. 2018. View Article : Google Scholar : PubMed/NCBI
|
|
17
|
Bi X, Yan T, Zhao H, Zhao J, Li Z, Huang
Z, Zhou J and Cai J: Correlation of alpha fetoprotein with the
prognosis of hepatocellular carcinoma after hepatectomy in an
ethnic Chinese population. Zhonghua Yi Xue Za Zhi. 94:2645–2649.
2014.(In Chinese). PubMed/NCBI
|
|
18
|
Zhou J, Sun HC, Wang Z, Cong WM, Wang JH,
Zeng MS, Yang JM, Bie P, Liu LX, Wen TF, et al: Guidelines for
diagnosis and treatment of primary liver cancer in China (2017
edition). Liver Cancer. 7:235–260. 2018. View Article : Google Scholar : PubMed/NCBI
|
|
19
|
Zhou L, Rui JA, Zhou WX, Wang SB, Chen SG
and Qu Q: Edmondson-Steiner grade: A crucial predictor of
recurrence and survival in hepatocellular carcinoma without
microvascular invasio. Pathol Res Pract. 213:824–830. 2017.
View Article : Google Scholar : PubMed/NCBI
|
|
20
|
Livak KJ and Schmittgen TD: Analysis of
relative gene expression data using real-time quantitative PCR and
the 2(-Delta Delta C(T)) method. Methods. 25:402–408. 2001.
View Article : Google Scholar : PubMed/NCBI
|
|
21
|
Shi K, Wang SL, Shen B, Yu FQ, Weng DF and
Lin JH: Clinicopathological and prognostic values of fibronectin
and integrin alphavbeta3 expression in primary osteosarcoma. World
J Surg Oncol. 17:232019. View Article : Google Scholar : PubMed/NCBI
|
|
22
|
Bader G and Hogue C: An automated method
for finding molecular complexes in large protein interaction
networks. BMC Bioinformatics. 4:22003. View Article : Google Scholar : PubMed/NCBI
|
|
23
|
Cai C, Wang W and Tu Z: Aberrantly DNA
methylated-differentially expressed genes and pathways in
hepatocellular carcinoma. J Cancer. 10:355–366. 2019. View Article : Google Scholar : PubMed/NCBI
|
|
24
|
Korner T, Kropf J, Kosche B, Kristahl H,
Jaspersen D and Gressner AM: Improvement of prognostic power of the
Child-Pugh classification of liver cirrhosis by hyaluronan. J
Hepatol. 39:947–953. 2003. View Article : Google Scholar : PubMed/NCBI
|
|
25
|
Stead BE, Sorbara CD, Brandl CJ and Davey
MJ: ATP binding and hydrolysis by Mcm2 regulate DNA binding by Mcm
complexes. J Mol Biol. 391:301–313. 2009. View Article : Google Scholar : PubMed/NCBI
|
|
26
|
Zhuang L, Yang Z and Meng Z: Upregulation
of BUB1B, CCNB1, CDC7, CDC20, and MCM3 in tumor tissues predicted
worse overall survival and disease-Free survival in hepatocellular
carcinoma patients. Biomed Res Int. 2018:78973462018. View Article : Google Scholar : PubMed/NCBI
|
|
27
|
Liao X, Liu X, Yang C, Wang X, Yu T, Han
C, Huang K, Zhu G, Su H, Qin W, et al: Distinct diagnostic and
prognostic values of minichromosome maintenance gene expression in
patients with hepatocellular carcinoma. J Cancer. 9:2357–2373.
2018. View Article : Google Scholar : PubMed/NCBI
|
|
28
|
Liu Y, Zhang Y, Zhao Y, Gao D, Xing J and
Liu H: High PARP-1 expression is associated with tumor invasion and
poor prognosis in gastric cancer. Oncol Lett. 12:3825–3835. 2016.
View Article : Google Scholar : PubMed/NCBI
|
|
29
|
Chatterjee D, Rashid A, Wang H, Katz MH,
Wolff RA, Varadhachary GR, Lee JE, Pisters PW, Gomez HF, Abbruzzese
JL, et al: Tumor invasion of muscular vessels predicts poor
prognosis in patients with pancreatic ductal adenocarcinoma who
have received neoadjuvant therapy and pancreaticoduodenectomy. Am J
Surg Pathol. 36:552–559. 2012. View Article : Google Scholar : PubMed/NCBI
|
|
30
|
Hong SM, Pawlik TM, Cho H, Aggarwal B,
Goggins M, Hruban RH and Anders RA: Depth of tumor invasion better
predicts prognosis than the current American Joint Committee on
Cancer T classification for distal bile duct carcinoma. Surgery.
146:250–257. 2009. View Article : Google Scholar : PubMed/NCBI
|
|
31
|
Bi XW, Zhang WW, Li ZM, Huang JJ, Xia Y,
Sun P, Wang Y and Jiang WQ: The extent of local tumor invasion
predicts prognosis in stage IE nasal natural killer/T-cell
lymphoma: A novel T staging system for risk stratification. Ann
Hematol. 94:1515–1524. 2015. View Article : Google Scholar : PubMed/NCBI
|
|
32
|
Fan J, Tang ZY, Wu ZQ, Zhou J, Zhou XD, Ma
ZC, Qin LX, Qiu SJ, Yu Y and Huang C: The effects of portal vein
microscopic and macroscopic tumor thrombi on post-operation
patients with hepatocellular carcinoma. Zhonghua Wai Ke Za Zhi.
43:433–435. 2005.(In Chinese). PubMed/NCBI
|
|
33
|
Ryu S and Driever W: Minichromosome
maintenance proteins as markers for proliferation zones during
embryogenesis. Cell Cycle. 5:1140–1142. 2006. View Article : Google Scholar : PubMed/NCBI
|
|
34
|
Lei M: The MCM complex: Its role in DNA
replication and implications for cancer therapy. Curr Cancer Drug
Targets. 5:365–380. 2005. View Article : Google Scholar : PubMed/NCBI
|
|
35
|
Chuang CH, Yang D, Bai G, Freeland A,
Pruitt SC and Schimenti JC: Post-transcriptional homeostasis and
regulation of MCM2-7 in mammalian cells. Nucleic Acids Res.
40:4914–4924. 2012. View Article : Google Scholar : PubMed/NCBI
|
|
36
|
Juríková M, Danihel Ľ, Polák Š and Varga
I: Ki67, PCNA, and MCM proteins: Markers of proliferation in the
diagnosis of breast cancer. Acta Histochem. 118:544–552. 2016.
View Article : Google Scholar : PubMed/NCBI
|
|
37
|
Hua C, Zhao G, Li Y and Bie L:
Minichromosome Maintenance (MCM) Family as potential diagnostic and
prognostic tumor markers for human gliomas. BMC Cancer. 14:5262014.
View Article : Google Scholar : PubMed/NCBI
|
|
38
|
Cheng DD, Zhang HZ, Yuan JQ, Li SJ, Yang
QC and Fan CY: Minichromosome maintenance protein 2 and 3 promote
osteosarcoma progression via DHX9 and predict poor patient
prognosis. Oncotarget. 8:26380–26393. 2017. View Article : Google Scholar : PubMed/NCBI
|
|
39
|
Yu J, Xu QG, Wang ZG, Yang Y, Zhang L, Ma
JZ, Sun SH, Yang F and Zhou WP: Circular RNA cSMARCA5 inhibits
growth and metastasis in hepatocellular carcinoma. J Hepatol.
68:1214–1227. 2018. View Article : Google Scholar : PubMed/NCBI
|
|
40
|
Cao S, Sun R, Wang W, Meng X, Zhang Y,
Zhang N and Yang S: RNA helicase DHX9 may be a therapeutic target
in lung cancer and inhibited by enoxacin. Am J Transl Res.
9:674–682. 2017.PubMed/NCBI
|
|
41
|
Mi J, Ray P, Liu J, Kuan CT, Xu J, Hsu D,
Sullenger BA, White RR and Clary BM: In vivo selection against
human colorectal cancer xenografts identifies an aptamer that
targets RNA helicase protein DHX9. Mol Ther Nucleic Acids.
5:e3152016. View Article : Google Scholar : PubMed/NCBI
|
|
42
|
Lee T, Paquet M, Larsson O and Pelletier
J: Tumor cell survival dependence on the DHX9 DExH-box helicase.
Oncogene. 35:5093–5105. 2016. View Article : Google Scholar : PubMed/NCBI
|
|
43
|
Fidaleo M, Svetoni F, Volpe E, Minana B,
Caporossi D and Paronetto MP: Genotoxic stress inhibits Ewing
sarcoma cell growth by modulating alternative pre-mRNA processing
of the RNA helicase DHX9. Oncotarget. 6:31740–31757. 2015.
View Article : Google Scholar : PubMed/NCBI
|
|
44
|
Zhang Y and Hunter T: Roles of Chk1 in
cell biology and cancer therapy. Int J Cancer. 134:1013–1023. 2014.
View Article : Google Scholar : PubMed/NCBI
|
|
45
|
Jin H, Xu G, Zhang Q, Pang Q and Fang M:
Synaptotagmin-7 is overexpressed in hepatocellular carcinoma and
regulates hepatocellular carcinoma cell proliferation via Chk1-p53
signaling. Onco Targets Ther. 10:4283–4293. 2017. View Article : Google Scholar : PubMed/NCBI
|
|
46
|
Hong J, Hu K, Yuan Y, Sang Y, Bu Q, Chen
G, Yang L, Li B, Huang P, Chen D, et al: CHK1 targets spleen
tyrosine kinase (L) for proteolysis in hepatocellular carcinoma. J
Clin Invest. 122:2165–2175. 2012. View Article : Google Scholar : PubMed/NCBI
|
|
47
|
Han X, Mayca Pozo F, Wisotsky JN, Wang B,
Jacobberger JW and Zhang Y: Phosphorylation of minichromosome
maintenance 3 (MCM3) by checkpoint kinase 1 (Chk1) negatively
regulates DNA replication and checkpoint activation. J Biol Chem.
290:12370–12378. 2015. View Article : Google Scholar : PubMed/NCBI
|
|
48
|
Kitao H, Iimori M, Kataoka Y, Wakasa T,
Tokunaga E, Saeki H, Oki E and Maehara Y: DNA replication stress
and cancer chemotherapy. Cancer Sci. 109:264–271. 2018. View Article : Google Scholar : PubMed/NCBI
|
|
49
|
Xu D, Su C, Sun L, Gao Y and Li Y:
Performance of serum glypican 3 in diagnosis of hepatocellular
carcinoma: A meta-analysis. Ann Hepatol. 18:58–67. 2018. View Article : Google Scholar
|