Introduction
Lung cancer accounts for the majority of
cancer-related deaths worldwide. Despite early detection with
various methods, the majority of lung cancers are diagnosed at an
advanced stage with metastasis to lymph nodes and/or distant
organs. Therefore, lung cancer remains a poor prognostic tumor
(1,2).
Malignant pleural mesothelioma (MPM), which is a
rare tumor compared with lung cancer, is a highly aggressive and
poor prognostic tumor, mainly caused by exposure to asbestos
(3). MPM mainly originates from
mesothelial cells of the parietal pleura and is not likely to show
metastasis to other organs (4).
However, MPM shows locally aggressive invasion to the surrounding
tissues, highlighting the malignancy of MPM (4–6).
Metastasis of cancer cells typically occurs through
a series of steps: growth of cancer cells at the primary site,
invasion to the extracellular matrix and into lymph and blood
vessels, circulation in the vessels, extravasation out of the
vessels, and finally, re-growth at distant organs (7,8). Among
these, invasion is one of the most important processes. The ability
to invade reflects the malignancy of the cancer. In both lung
cancer and MPM, invasion has a significant role in tumor
progression and metastasis. Therefore, controlling invasion may
lead to effective management of these tumors.
Previously, we established a simple 3-dimensional
(3D) in vitro model of an invasion assay, which was referred
to as the double-layered collagen gel hemisphere (DL-CGH) method
(9). This method enables easy
visualization of tumor cell invasion. Our previous study using the
DL-CGH method demonstrated that the lung adenocarcinoma cell line
A549 displayed no invasiveness on its own, but showed invasive
migration in the presence of fibroblast cells (9). Previously, we also demonstrated the
difference in cell invasiveness among MPM cell lines (10). These results indicated that the
DL-CGH method could classify cancer cell lines into invasive or
non-invasive, thereby allowing us to identify potential candidate
gene(s) that are highly expressed in invasive cancer cell
lines.
In the present study, the DL-CGH method was utilized
and multiple cell lines were examined to identify potential
candidate genes involved in cancer cell invasion. Cell invasion and
proliferation were further evaluated in response to knocking down
the candidate gene to determine its oncogenic potential.
Materials and methods
Cell lines
The human lung adenocarcinoma cell lines, A549
(bronchioloalveolar carcinoma of lung) and A110L, were purchased
from the Riken Bioresource Center (A549, RCB0098; A110L, RCB2816).
NCI-H28 (pleural effusion) and MSTO-211H (biphasic mesothelioma)
were purchased from the American Type Culture Collection. These
cells were subjected to mycoplasma testing prior to use in our
experiments. The cells were cultured in RPMI-1640 medium
(Sigma-Aldrich; Merck KGaA), supplemented with penicillin (100
U/ml), streptomycin (100 U/ml; GE Healthcare), and 10% fetal bovine
serum (FBS; Sigma-Aldrich) at 37°C in 5% CO2.
Preparation of DL-CGH
Acid-soluble collagen I (Nitta Gelatin Inc.),
10-fold concentrated Ham's F-12 medium (Nitta Gelatin, NA Inc.),
and reconstruction buffer (2.2 g NaHCO3 + 4.77 g HEPES
in 100 ml 0.05 N NaOH) (Nitta Gelatin, NA Inc.) were mixed at a
volume ratio of 8:1:1 and then seeded with cultured cells at a
density of 3.0×10⁶ cells/ml. Five microliters of the
mixture, containing 1.5×10⁴ cells, were dispensed onto a
plastic dish. Once the mixture had gelled, a second 30 µl drop of
collagen was placed exactly on the top of the first gel drop,
encapsulating it completely (Fig.
1). The gel hemisphere was then submerged in medium and
cultured.
Evaluation of lung adenocarcinoma and
MPM cell invasion
Phase difference images were captured 0, 7, 10 and
14 days after the culture of cell lines with DL-CGH. Next, the
cells were stained with neutral red solution (only taken in the
viable cells) by reacting for 2 h with gentle shaking at 37°C in 5%
CO2. The stained cell lines were subsequently fixed with
10% formalin neutral buffer solution (FUJIFILM Wako Pure Chemical
Corp.) for 45 min at room temperature, washed with running water
for 10 min and the gels were allowed to dry. The invasive activity
of the cells was evaluated by measuring the expansion into the
outer collagen layer. A Moticam 3 digital microscopy system
(Shimadzu Rika Corp.) was used to capture phase difference images,
particularly in evaluating the form of cell invasion. A BZ9000
fluorescence microscope (Keyence Corporation; magnification, ×50)
was used to evaluate the degree of cell invasion. For quantitative
evaluation of viable cells with DL-CGH, Photoshop Elements 15 for
Windows (Adobe Systems Inc.) was used. The red-stained areas in
each image were selected manually. The ‘histogram’ selection in the
pull-down menu then indicated the number of pixels with red-stained
areas.
Total RNA isolation
Total RNA was isolated from the cell lines using
TRIzol reagent (Thermo Fisher Scientific, Inc.) and purified using
SV Total RNA Isolation System (Promega Corporation), according to
the manufacturer's protocol. RNA samples were quantified by an
ND-1000 spectrophotometer (NanoDrop Technologies; Thermo Fisher
Scientific, Inc.) and the quality was confirmed using an Experion
system (Bio-Rad Laboratories, Inc.).
Gene expression microarrays
The cRNA was amplified, labelled and hybridized to a
60K Agilent 60-mer oligomicroarray, according to the manufacturer's
protocol. All hybridized microarray slides were scanned using an
Agilent scanner (Agilent Technologies, Inc.). Relative
hybridization intensities and background hybridization values were
calculated using Agilent Feature Extraction Software (9.5.1.1;
Agilent Technologies, Inc.). The array used was SurePrint G3 Human
Gene Expression Microarray 8×60K v2 (model no. G4851A). A Low Input
Quick Amp Labeling kit (model no. 5190-2305) was used to label
reagent.
Data analysis and filter criteria
Raw signal intensities and flags for each probe were
calculated from hybridization intensities (gProcessedSignal), and
spot information (gIsSaturated), according to the following
procedures recommended by Agilent Flag criteria on GeneSpring
Software: Absent (A): ‘Feature is not positive and significant’ and
‘Feature is not above background’; Marginal (M): ‘Feature is not
Uniform’ ‘Feature is Saturated’ and ‘Feature is a population
outlier’; Present (P): others.
The raw signal intensities of two samples were
log2-transformed and normalized by quantile algorithm
with ‘preprocessCore’ library package (11) on Bioconductor software (12).
Probes that call at least one sample ‘P’ flag,
excluding lincRNA probes, were selected. To identify upregulated or
downregulated genes, Z-scores (13)
and ratios (non-log scaled fold-change) were calculated from the
normalized signal intensities of each probe for comparison between
control and experiment samples. Next, criteria were established for
regulated genes: (upregulated genes) Z-score ≥2.0 and ratio
≥1.5-fold, (downregulated genes) Z-score ≤-2.0 and ratio ≤0.66.
Western blotting
Cultured cells were lysed with 100 µl Laemmli sample
buffer (Cosmo Bio Co., Ltd.), and 10 µl of each sample lysate was
run on SDS-PAGE using Any kD™ Mini-PROTEAN® TGX™ Precast
Gels (Bio-Rad Laboratories, Inc.). Next, the separated bands were
transferred to nitrocellulose membranes (GE Healthcare). After
washing the membranes with phosphate buffered saline-Tween-20
(PBS-T, including 0.05% Tween-20), they were blocked for 60 min at
room temperature, with 2% ECL Prime Blocking Reagent (GE
Healthcare), diluted by PBS-T. Following 3 rinses with PBS-T,
membranes were incubated (60 min, 15–25°C) with the primary rabbit
polyclonal antibody to brain-expressed x-linked protein 1
(Bex1, 15 kDa; cat. no. ab107215; Abcam), which was diluted
1:500 with 5% bovine serum albumin/PBS-T. Following washing with
PBS-T, membranes were incubated (30 min, room temperature) with the
secondary peroxidase-labeled sheep anti-rabbit Ig whole antibody
(cat. no. NA934; GE Healthcare), which was diluted 1:5,000 with
PBS-T. Membranes were then washed with PBS-T and visualized using a
luminoimage analyzer Amersham Imager 600 (Fuji film, Inc.) treated
with a chemiluminescent detection kit (GE Healthcare). When the
expression of Bex1 protein was upregulated, the 15 kDa band
was deeply stained on western blotting.
For the control assay, western blotting was
performed using the same membranes. The primary antibody was
directed against α-tubulin mouse monoclonal antibody (1:1,000; cat.
no. 017-25031; Wako Pure Chemical Industries, Ltd.), and the
secondary antibody was peroxidase-labelled sheep anti-mouse Ig
whole antibody (GE Healthcare).
Real time-polymerase chain reaction
(RT-PCR) analysis in cell lines
Total RNA was extracted as mentioned earlier. Using
1 µg of the collected total RNA, ReverTra Ace® qPCR RT
Master Mix with gDNA Remover (Toyobo Life Science) was used to
decompose chromosomal DNA by DNase treatment, according to the
manufacturer's protocol, and then cDNA was synthesized by reverse
transcription. Gene expression analysis of β-actin (assay ID:
Hs01060665_g1, housekeeping gene) and BEX1 (assay ID:
Hs00218464_m1) were performed by quantitative PCR with
Taqman® Gene Expression Assays (Applied Biosystems;
Thermo Fisher Scientific, Inc.), according to the manufacturer's
protocol.
RNA interference in lung
adenocarcinoma and MPM cell lines
RNA interference (RNAi) was performed with
commercially available siRNAs for Bex1 (#s31681 and
#s226875; Invitrogen) and a non-silencing control siRNA
(Invitrogen), according to the manufacturer's protocol. In the
present study, reverse transfection of RNAi was performed. Briefly,
15 pmol (7.5 pmol #s31681 and 7.5 pmol #s226875) transfection
reagent was suspended in 2.5 µl Lipofectamine RNAiMAX (Invitrogen)
and 500 µl Opti-MEM (Invitrogen), finally containing 5 µM siRNA.
Following a 5-min incubation at room temperature, the complexes
were prepared inside a 35-mm round culture dish, after which the
cell lines were incubated at 37°C in 5% CO2, with 2.5 ml
culture medium containing 10% FBS and the aforementioned
antibiotics and cultured for 48 h. The cell lines were cultured for
48 h (at 37°C, 5% CO2) until they reached 80%
confluence; the final concentration of the siRNA was 5 nM. After 48
h, these cells were used for DL-CGH and cell proliferation assays.
Cell density was calculated to prepare for encapsulation of the
cells in DL-CGH.
Assessment of proliferation in lung
adenocarcinoma and MPM cell lines
Cell lines were cultured on normal tissue culture
plates (60-mm round dish with 4 ml medium, containing 10% FBS and
the aforementioned antibiotics). These plates contained
20×104 cells at day 0, and the cells were cultured and
the cell population counted every 24 h from day 0 to day 3 (72
h).
Statistical analysis
Multiple comparisons of viable cells were assessed
by counting the pixel numbers of red-stained areas using Tukey HSD
test. A repeated measures analysis of variance was used for the
analysis of the comparison of cell proliferative activity in A110L
and MSTO-211H cells. All tests were performed using JMP ver. 12.0
statistical software (SAS Institute, Inc.). P<0.05 was
considered to indicate a statistically significant difference.
Results
Selection of lung adenocarcinoma and
MPM cell lines for invasion
In our previous study assessing invasion in lung
adenocarcinoma cell lines using the DL-CGH methodology, A549 cells
showed no invasion into the outer layer (9). It was also demonstrated that NCI-H28
cells had no invasiveness, while MSTO-211H cells exhibited a high
tendency to invade the outer layer (10). A previous study from another group
revealed that the A110L cell line presented a high invasion ratio
(14), suggesting that A110L would
display invasiveness in the DL-CGH assay. In the present study,
DL-CGH was performed using these cell lines and the invasiveness of
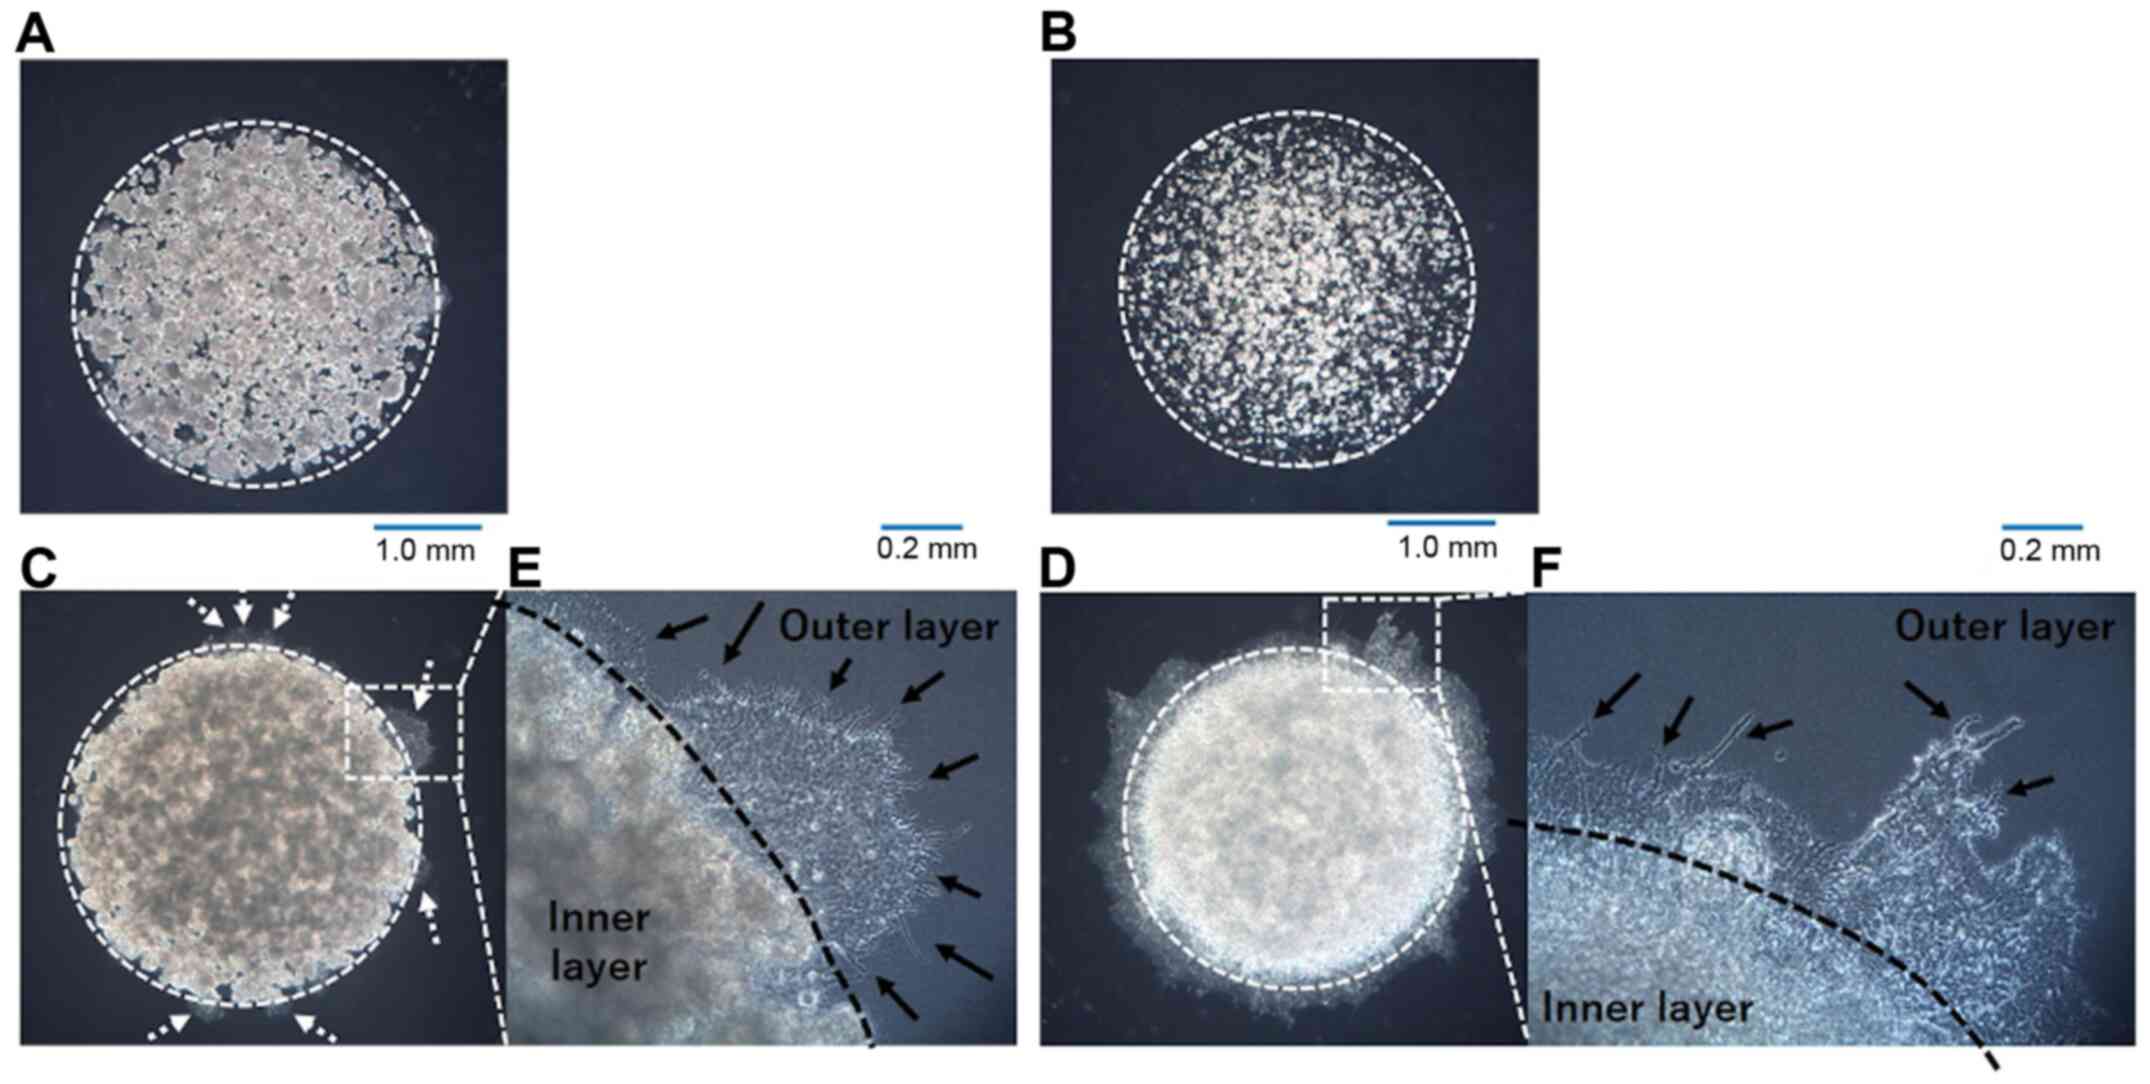
the lung adenocarcinoma and MPM cell lines was confirmed. A549 and
NCI-H28 cells exhibited almost no invasion into the outer layer
(Fig. 2A and B), while A110L and
MSTO-211H cells demonstrated strong invasion to the outer layer
(Fig. 2C and D).
Pattern of invasion observed by
DL-CGH
Invasive cells (A110L and MSTO-211H) was observed at
the boundary between the inner layer and the outer layer in the
DL-CGH. The invasive cells in these cell lines spread with
dendriform extension to the outer layer (Fig. 2E and F). A549 cells, which had almost
no invasive ability, slightly extended to the outer layer. However,
A549 cells did not present with a dendritic shape, and it was
hypothesized that the increased A549 cells were merely pushed out
to the outer layers and did not consider this to be true
invasion.
cDNA microarray: Invasive cells vs.
non-invasive cells
It was assumed that the genes involved in cancer
cell invasion may be common even if the cancer types are different.
Therefore, gene expression was compared between invasive and
non-invasive cells of lung adenocarcinoma and MPM. From the results
of the cDNA microarray, gene expression was compared between the
invasive and non-invasive cells. Next, the focus was on the genes
that were more highly expressed in invasive cells than in
non-invasive cells of lung adenocarcinoma and MPM, respectively
(Fig. 3A). The genes were further
sorted, showing more than 100-fold expression in invasive cells
than in non-invasive cells in both lung adenocarcinoma and MPM
(Fig. 3B; Table I). Among these genes, the brain
expressed X-linked 1 (Bex1) gene was selected as a candidate
gene that was most expressed in invasive cells (A110L and MSTO-211H
cell lines). Upon comparison of the Z score ratio, the expression
of Bex1 in A110L cells was 2,354 times that in A549 cells
(lung adenocarcinoma) and that in MSTO-211H was 3,951 times that in
NCI-H28 (MPM), respectively (Table
I).
 | Table I.cDNA microarray results. |
Table I.
cDNA microarray results.
| Gene Symbol | A549 signal | A110L signal | NCI-H28 signal | MSTO-211H
signal | A549 flag | A110L flag | NCI-H28 flag | MSTO-211H flag | Lung adenocarcinoma
Z-score (ratio) | MPM Z-score
(ratio) |
|---|
| BEX1 | 2.512564 | 5916.631 | 2.515498 | 9938.976 | A | P | A | P | 5.6998952 | 5.5163373 |
|
|
|
|
|
|
|
|
|
| (2354.8183) | (3951.0965) |
| PLAC8 | 144.0021 | 15455.78 | 13.98621 | 10191.95 | P | P | A | P | 5.716828 | 6.0810673 |
|
|
|
|
|
|
|
|
|
| (107.33022) | (728.71428) |
| BNC1 | 2.554902 | 564.58882 | 2.5486203 | 1352.638 | A | P | A | P | 3.4015041 | 3.5291892 |
|
|
|
|
|
|
|
|
|
| (220.98257) | (530.73344) |
| LY6K | 44.04067 | 7153.6476 | 17.484168 | 7433.71575 | P | P | P | P | 4.8086332 | 5.5838905 |
|
|
|
|
|
|
|
|
|
| (162.43275) | (425.16841) |
| DLC1 | 3.074332 | 506.51893 | 6.2842793 | 1769.32025 | A | P | A | P | 3.2174861 | 3.7557529 |
|
|
|
|
|
|
|
|
|
| (164.75739) | (281.54704) |
| ICAM1 | 3.477886 | 1394.9693 | 4.8122205 | 1142.015893 | A | P | M | P | 3.7751178 | 3.641839 |
|
|
|
|
|
|
|
|
|
| (401.09689) | (237.31579) |
| HOXA9 | 8.754307 | 887.27533 | 3.0546805 | 699.648575 | A | P | A | P | 3.4023191 | 3.0533919 |
|
|
|
|
|
|
|
|
|
| (101.35301) | (229.04149) |
| HIST1H1B | 2.731741 | 622.27873 | 2.7374758 | 599.7571238 | A | P | A | P | 3.4205353 | 3.028245 |
|
|
|
|
|
|
|
|
|
| (227.79567) | (219.0913) |
| TRIM58 | 2.890252 | 2703.677 | 11.697094 | 2453.67025 | A | P | A | P | 5.025587 | 3.5595956 |
|
|
|
|
|
|
|
|
|
| (935.44672) | (209.76752) |
| ZNF542P | 2.801404 | 374.8687 | 2.8100225 | 321.1505504 | A | P | A | P | 3.0871117 | 2.6597883 |
|
|
|
|
|
|
|
|
|
| (133.8146) | (114.28754) |
Effect of inhibition of Bex1 in A110L
and MSTO-211H cells on invasion
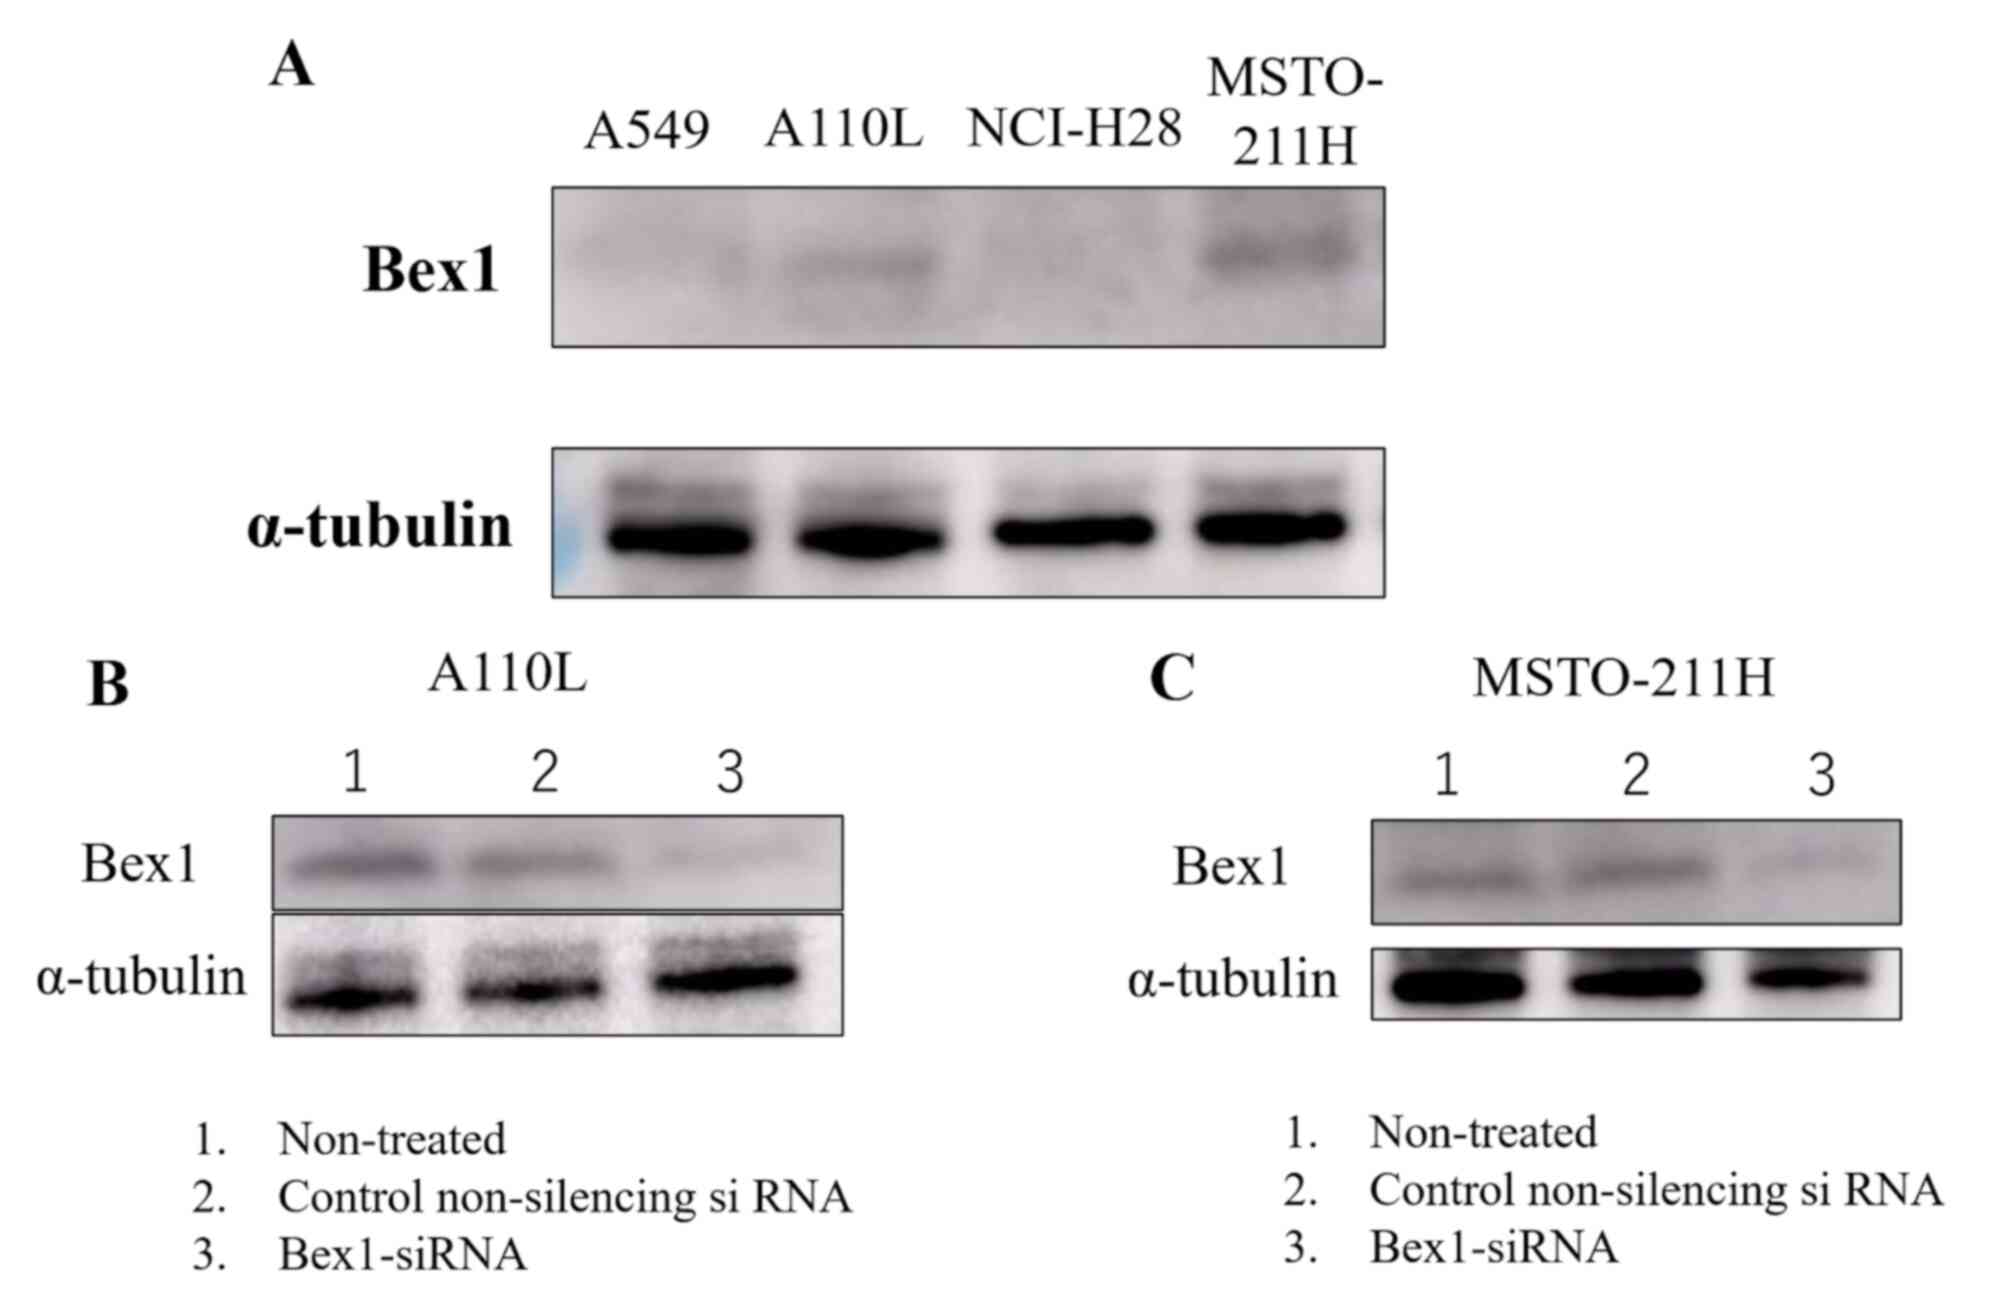
Western blotting was performed to confirm the
expression of Bex1 in the invasive and non-invasive cell
lines. Western blotting revealed strong expression of Bex1
in A110L and MSTO-211H cells (Fig.
4A), along with corresponding high gene expression of
Bex1. Additionally, RT-PCR revealed a higher expression
level of Bex1 in A110L and MSTO-211H cells than in A549 and
NCI-H28 cells (Table II). Next,
RNAi methodology was used to knock down the expression of
Bex1 in A110L and MSTO-211H cells (Fig. 4B and C) and the association between
Bex1 expression and cell invasion was observed using the
DL-CGH. A110L and MSTO-211H cells with reduced Bex1
expression showed almost no invasion to the outer layer according
to DL-CGH (Figs. 5A and 6A). Furthermore, the cells around the
boundary of the inner layer and the outer layer did not present
with a dendriform shape and exhibited almost no tendency to invade
the outer layer (Figs. 5B and
6B). In addition, the comparison of
DL-CGH stained live cells with neutral red at day 0 and day 14
(A110L) or day 10 (MSTO-211H) showed that siRNA-induced
Bex1-knockdown led to a substantial reduction in live cells,
suggesting that Bex1 promotes viability (Figs. 5C and D and 6C and D).
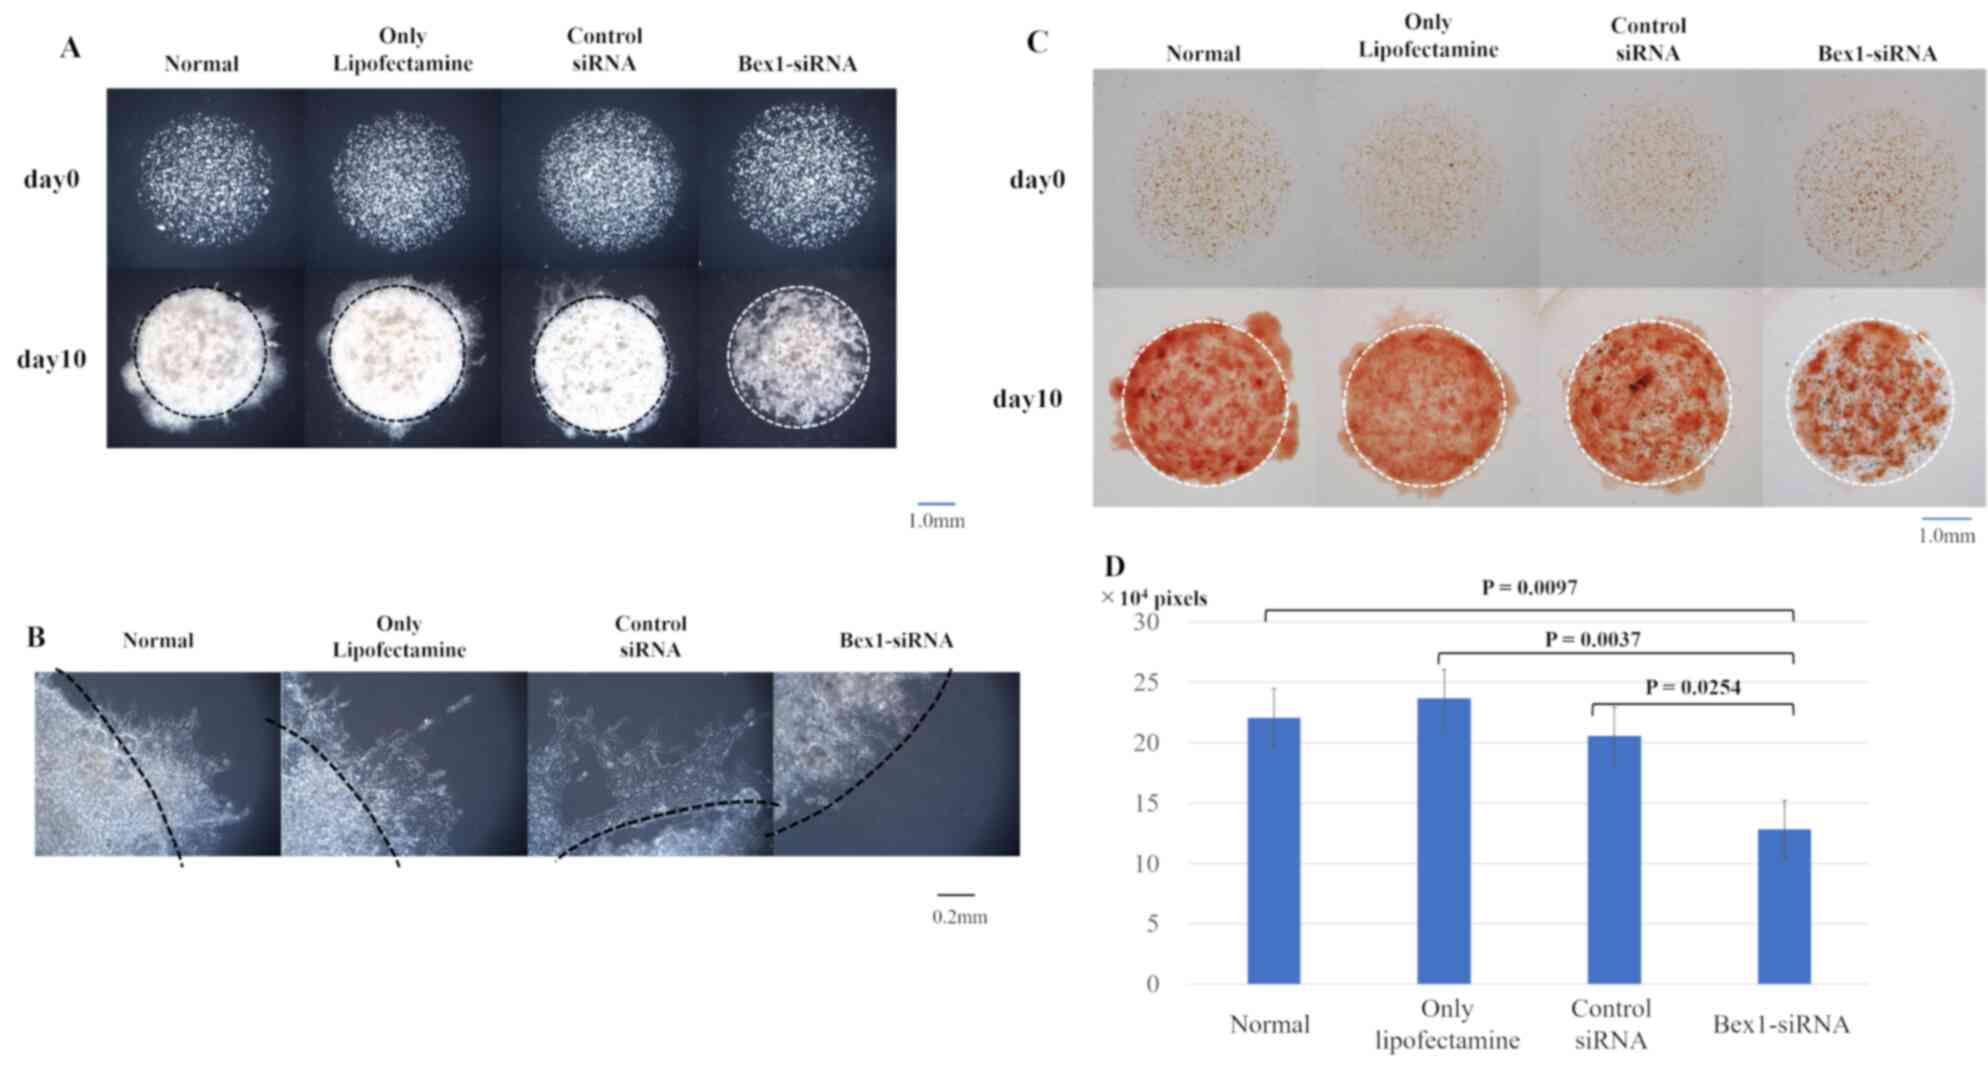
 | Figure 5.Invasion is suppressed in A110L cells
with reduced Bex1 expression. The degree of invasion was
compared in A110L cells using the DL-CGH assay and the following
groups were compared: non-treated, control-treated (only
Lipofectamine), control non-silencing siRNA-treated, and
Bex1-siRNA-treated. (A) The comparison of DL-CGH in phase
difference capture at day 0 and day 14. Knocking down of
Bex1 induced strong suppression of cell invasion to the
outer layer with DL-CGH. (B) Enlarged images of boundary between
the inner layer and the outer layer. A110L with expression of
Bex1 showed dendriform extension (arrow), while A110L with
Bex1 knocked down did not present with a dendriform shape
(dashed arrow). (C) The comparison using DL-CGH of living cells
stained with neutral red at day 0 and day 14. Bex1 RNAi
induced prominent cell reduction. (D) The histogram showed the mean
and standard deviation of numbers of red-stained pixels of each
DL-CGH sample at day 14. The pixel numbers of red-stained areas
were 181,748 in normal (non-treated), 184,928 in control-treated
(only Lipofectamine), 191,934 in control non-silencing
siRNA-treated, and 95,914 in Bex1-siRNA-treated. The pixel
numbers of Bex1 RNAi were significantly decreased.
Bex1, brain-expressed X-linked protein 1; siRNA, small
interfering RNA; DL-CGH, double-layered collagen gel
hemispheres. |
 | Figure 6.Invasion is suppressed in MSTO-211H
cells with reduced Bex1 expression. The degree of invasion
in MSTO-211H cells was compared using the DL-CGH assay and
comparisons were made between the following cells: Non-treated,
control-treated (only Lipofectamine), control non-silencing
siRNA-treated, and Bex1-siRNA-treated. (A) Comparison using
DL-CGH of phase difference capture at day 0 and day 14. (B)
Enlarged images of boundary between the inner layer and the outer
layer. MSTO-211H with Bex1 knocked down showed almost no
cells with dendriform shape. (C) Comparison using DL-CGH of living
cells stained with neutral red at day 0 and day 14. (D) Histogram
showed the mean and standard deviation of numbers of red-stained
pixels of each DL-CGH sample at day 10. The pixel numbers of
red-stained areas were 220,502 in normal (non-treated), 236,713 in
control-treated (only Lipofectamine), 205,433 in control
non-silencing siRNA-treated, and 128,262 in
Bex1-siRNA-treated. The pixel numbers of Bex1 RNAi
were also significantly decreased. Bex1, brain-expressed
X-linked protein 1; siRNA, small interfering RNA; DL-CGH,
double-layered collagen gel hemispheres. |
| Table II.Relative Bex1 expression. |
Table II.
Relative Bex1 expression.
| A549 | A110L | NCI-H28 | MSTO-211H |
|---|
| 0.00306 | 0.507 | ND
(<0.000228) | 1.506 |
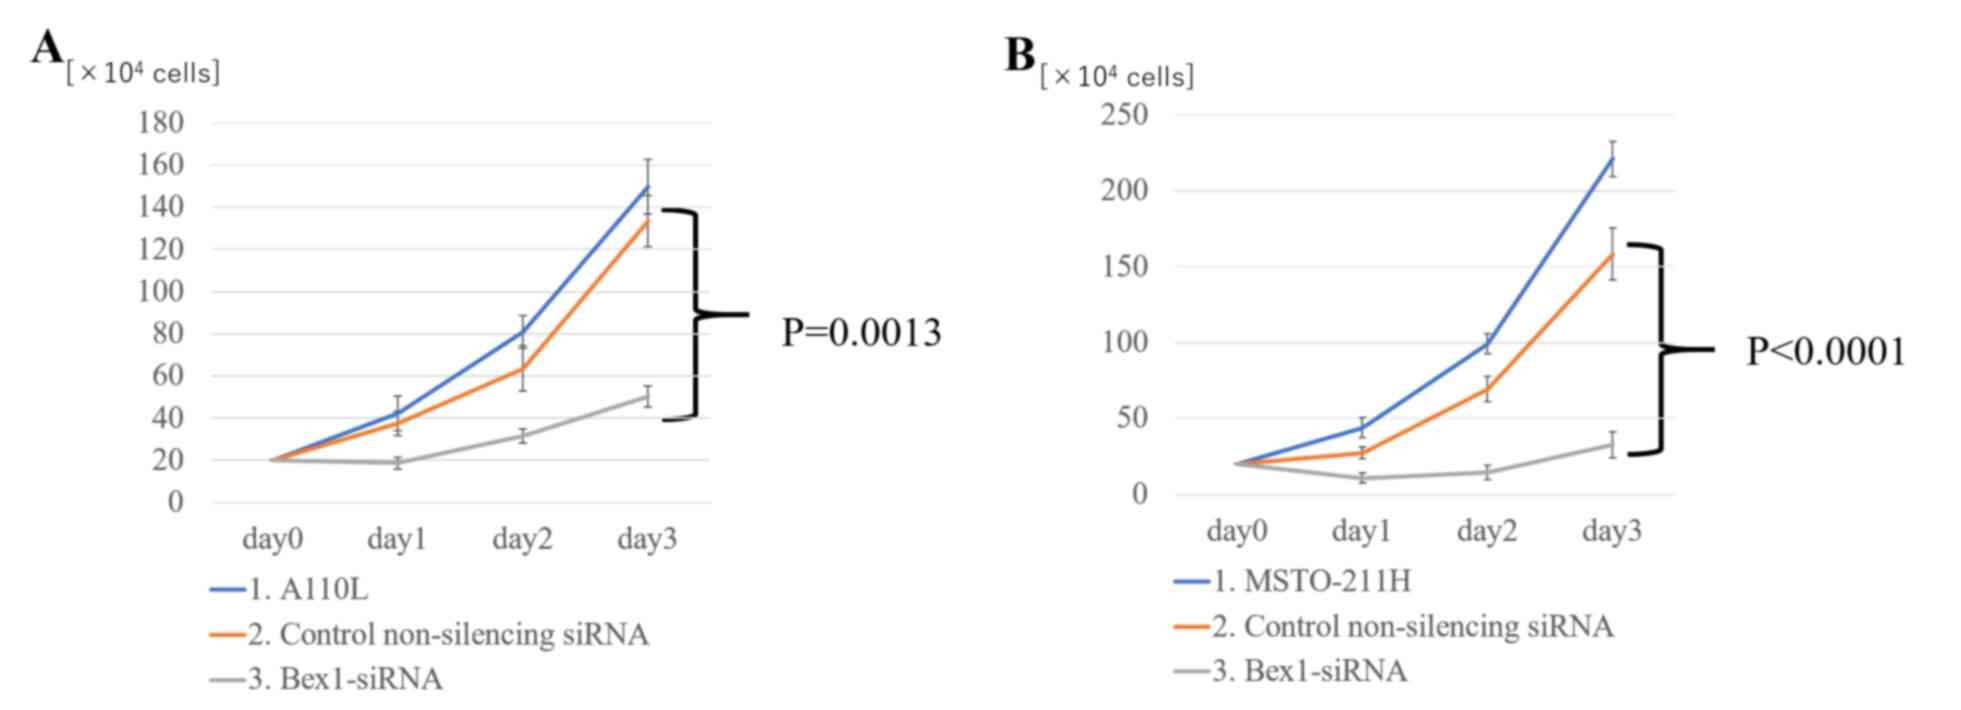
Effect of RNAi-mediated knockdown of
Bex1 on cell proliferation
Notably, suppressing Bex1 expression not only
eliminated the invasive ability of the cells, but also decreased
the cell density in the inner layer of DL-CGH. Using A110L and
MSTO-211H cells with Bex1 knocked down, the proliferative
effects of Bex1 were also assessed. For assessment of cell
proliferation using A110L and MSTO-211H cells, normal cell lines
were compared with control non-silencing siRNA and Bex1 RNAi
in each cell line. As a result of Bex1-knockdown, A110L and
MSTO-211H exhibited significantly reduced cell proliferation
(Fig. 7).
Discussion
The present study used the DL-CGH method to visually
classify the lung adenocarcinoma and MPM cell lines as invasive or
non-invasive. Additionally, it was assumed that genes involved in
cancer cell invasion may be common even if the cancer types were
different, and potential genes were identified that were
overexpressed in the invasive cell lines of lung adenocarcinoma and
MPM, respectively, to a greater extent than in the non-invasive
cell lines. Among these, Bex1 was examined as a candidate
gene that was highly expressed in invasive cell lines.
Previous studies have made use of various methods
for in vitro 3D models of invasion with collagen gel,
including our method (9,15–17).
Among them, our DL-CGH method has an advantage in terms of
simplicity and ease of preparation, only involving two collagen gel
drops with cell lines enclosing the inner collagen gel drop
(9). Furthermore, DL-CGH may aid in
visually categorizing cell lines into invasive or non-invasive, as
the dynamics of cell lines at the boundary between the inner and
outer layer of the DL-CGH can be observed. This visualization of
cell invasion is very useful, not only for observing the mechanics
of cancer cell invasion, but also as a screening technique for cell
invasiveness.
The human brain expressed X-linked (Bex) family
proteins consist of five proteins (Bex1−5) and are known as
material proteins in neuronal development (18). For example, Bex1 is involved
in axon regeneration (19). In
addition to this function, Bex1 interacts with the p75
neurotrophin receptor (NTR) and contributes toward regulation of
the cell cycle (20). Previous
studies have demonstrated that Bex family proteins are associated
with several human cancer types. In breast cancer, overexpression
of Bex1 and Bex2 led to inhibition of tumor cell
apoptosis (21,22) and Bex1 acts as a resistance
marker for chemotherapy (23).
Bex1 is also known to be involved in the tumorigenesis of
neuroendocrine-specific tumors (24). However, in malignant glioma, the
expression of Bex1 and Bex2 was suppressed in human
glioma cell lines and primary patient samples (25). In contrast to our findings,
overexpression of Bex1 in intracranial ependymoma in
children significantly suppressed cell proliferation and colony
formation (26). However, loss of
Bex1 expression in acute myeloid leukemia resulted in
decreased cell proliferation, colony and tumor formation, and
increased apoptosis, suggesting that Bex1 is an oncogene in
this model (27). In other studies,
downregulation of Bex1 contributed toward imatinib
resistance and inhibition of apoptosis in chronic myeloid leukemia
(28,29). Despite numerous studies on the
function of Bex1 in various cancer types, there has been no
investigation into its role in lung adenocarcinoma and MPM, making
this study the first to analyze the association between Bex1
in lung adenocarcinoma and MPM.
The present study demonstrated that Bex1
serves an important role in cell proliferation and the invasive
activity of lung adenocarcinoma and MPM cells. Downregulation of
Bex1 decreased the proliferation and invasion of these
cancer cells, indicating that Bex1 is a candidate oncogene
in lung adenocarcinoma and MPM. Furthermore, we hypothesized that
Bex1 is involved in cell proliferation and cell death. In
the evaluation of Fig. 7 at day 1
(one day after administration of Bex1-siRNA), it was
considered that cell death was induced to a certain degree because
the numbers of A110L and MSTO-211H cells were slightly decreased.
However, subsequent changes in Fig.
7 (day 2 and day 3) and the result of quantification of cell
viability by staining with neutral red revealed that the speed was
decreasing, but the cell proliferation itself was progressing.
These results indicated that Bex1 may be more effective in
suppressing cell proliferation than in inducing cell death.
A previous study revealed that the presence of
fibroblasts was important for cancer cell invasion (30,31) and
that cancer cells with no inherent invasive capacity slipped along
the gaps of extracellular matrix created by the fibroblasts
(9,32). However, certain cancer cells present
inherent invasive ability. In invasive single-cell migration,
cancer cells change their form to spindle-like shapes with
pseudopod protrusion (33–35). In our previous study (10) and in the present study, the DL-CGH
results demonstrated that certain cell lines of both MPM and lung
adenocarcinoma had an inherent ability of invasion, in the absence
of fibroblasts. Specifically, we observed A110L and MSTO-211H cells
independently spread with dendriform extension to the outer layer.
In particular, A110L cells (lung adenocarcinoma) changed their form
into spindle shapes at the site of invasion in the DL-CGH. The
dendritic formation of these cancer cells was suppressed by
knockdown of Bex1, following which they could not spread
into the outer layer at the DL-CGH (Figs. 5B and 6B). This result indicated that Bex1
expression is likely involved, not only in cell proliferation, but
also in the ability of invasion by dendritic formation.
Furthermore, suppression of Bex1 in cancer cells that
overexpress Bex1 may lead to control of local invasiveness
and improved cancer treatment.
The main purpose of the present study was to report
urgently that a candidate gene involved in cell invasion and
proliferation could be sorted by comparing several cell lines
applying the DL-CGH method, and from this result, that Bex1
could be listed as a candidate gene involved in cell invasion and
proliferation. Therefore, the Bex1 gene was successfully
knocked down, which was performed relatively quickly. In a future
study, we are planning an assessment of Bex1 overexpression
in non-invasive cells through an in vivo study and a study
using clinical samples.
In conclusion, the results of the present study
demonstrated that the overexpression of Bex1 promotes tumor
proliferation and invasion to the surrounding tissue, and thus
identifies Bex1 as a candidate oncogene in lung
adenocarcinoma and MPM. Furthermore, knocking down of Bex1
strongly inhibits the ability of cells to invade and proliferate
in vitro, indicating that Bex1 may be a molecular
target for the treatment of lung adenocarcinoma and MPM.
Acknowledgements
Not applicable.
Funding
The present study was supported by the Japan Society
for the Promotion of Science (JSPS) KAKENHI, Grant-in-Aid for
Scientific Research (B) (grant no. 17H04297).
Availability of data and materials
All data generated and/or analyzed during this study
are included in this published article.
Authors' contributions
TD, YH and YM developed the concept, designed the
experiments, and drafted the initial manuscript. TD performed the
experiments and analyzed the data. HO, YT and YM helped analyze the
cDNA microarray data and identify the candidate gene. HO and YT
helped perform western blotting. All authors read and approved the
final manuscript.
Ethics approval and consent to
participate
Not applicable.
Patient consent for publication
Not applicable.
Competing interests
The authors declare that they have no competing
interests.
References
|
1
|
Herbst RS, Heymach JV and Lippman SM: Lung
cancer. N Engl J Med. 359:1367–1380. 2008. View Article : Google Scholar : PubMed/NCBI
|
|
2
|
Cheng TY, Cramb SM, Baade PD, Youlden DR,
Nwogu C and Reid ME: The international epidemiology of lung cancer:
Latest trends, disparities, and tumor characteristics. J Thorac
Oncol. 11:1653–1671. 2016. View Article : Google Scholar : PubMed/NCBI
|
|
3
|
Robinson BW, Musk AW and Lake RA:
Malignant mesothelioma. Lancet. 366:397–408. 2005. View Article : Google Scholar : PubMed/NCBI
|
|
4
|
Pistolesi M and Rusthoven J: Malignant
pleural mesothelioma: Update, current management, and newer
therapeutic strategies. Chest. 126:1318–1329. 2004. View Article : Google Scholar : PubMed/NCBI
|
|
5
|
Antman KH: Natural history and
epidemiology of malignant mesothelioma. Chest. 103:373S–376S. 1993.
View Article : Google Scholar : PubMed/NCBI
|
|
6
|
Zhong J, Gencay MM, Bubendorf L, Burgess
JK, Parson H, Robinson BW, Tamm M, Black JL and Roth M: ERK1/2 and
p38 MAP kinase control MMP-2, MT1-MMP, and TIMP action and affect
cell migration: A comparison between mesothelioma and mesothelial
cells. J Cell Physiol. 207:540–552. 2006. View Article : Google Scholar : PubMed/NCBI
|
|
7
|
Chambers AF, Groom AC and MacDonald IC:
Dissemination and growth of cancer cells in metastatic sites. Nat
Rev Cancer. 2:563–572. 2002. View
Article : Google Scholar : PubMed/NCBI
|
|
8
|
Sahai E: Illuminating the metastatic
process. Nat Rev Cancer. 7:737–749. 2007. View Article : Google Scholar : PubMed/NCBI
|
|
9
|
Takata M, Maniwa Y, Doi T, Tanaka Y, Okada
K, Nishio W, Ohbayashi C, Yoshimura M, Hayashi Y and Okita Y:
Double-layered collagen gel hemisphere for cell invasion assay:
Successful visualization and quantification of cell invasion
activity. Cell Commun Adhes. 14:157–167. 2007. View Article : Google Scholar : PubMed/NCBI
|
|
10
|
Doi T, Maniwa Y, Tanaka Y, Tane S,
Hashimoto S, Ohno Y, Nishio W, Nishimura Y, Ohbayashi C, Okita Y,
et al: MT1-MMP plays an important role in an invasive activity of
malignant pleural mesothelioma cell. Exp Mol Pathol. 90:91–96.
2011. View Article : Google Scholar : PubMed/NCBI
|
|
11
|
Bolstad BM, Irizarry RA, Astrand M and
Speed TP: A comparison of normalization methods for high density
oligonucleotide array data based on variance and bias.
Bioinformatics. 19:185–193. 2003. View Article : Google Scholar : PubMed/NCBI
|
|
12
|
Gentleman RC, Carey VJ, Bates DM, Bolstad
B, Dettling M, Dudoit S, Ellis B, Gautier L, Ge Y, Gentry J, et al:
Bioconductor: Open software development for computational biology
and bioinformatics. Genome Biol. 5:R802004. View Article : Google Scholar : PubMed/NCBI
|
|
13
|
Quackenbush J: Microarray data
normalization and transformation. Nat Genet. 32:496–501. 2002.
View Article : Google Scholar : PubMed/NCBI
|
|
14
|
Izumi H, Takahashi M, Uramoto H, Nakayama
Y, Oyama T, Wang KY, Sasaguri Y, Nishizawa S and Kohno K:
Monocarboxylate transporters 1 and 4 are involved in the invasion
activity of human lung cancer cells. Cancer Sci. 102:1007–1013.
2011. View Article : Google Scholar : PubMed/NCBI
|
|
15
|
Albini A, Iwamoto Y, Kleinman HK, Martin
GR, Aaronson SA, Kozlowski JM and McEwan RN: A rapid in vitro assay
for quantitating the invasive potential of tumor cells. Cancer Res.
47:3239–3245. 1987.PubMed/NCBI
|
|
16
|
Nyström ML, Thomas GJ, Stone M, Mackenzie
IC, Hart IR and Marshall JF: Development of a quantitative method
to analyse tumour cell invasion in organotypic culture. J Pathol.
205:468–475. 2005. View Article : Google Scholar : PubMed/NCBI
|
|
17
|
Duong HS, Le AD, Zhang Q and Messadi DV: A
novel 3-dimensional culture system as an in vitro model for
studying oral cancer cell invasion. Int J Exp Pathol. 86:365–374.
2005. View Article : Google Scholar : PubMed/NCBI
|
|
18
|
Kazi JU, Kabir NN and Rönnstrand L:
Brain-Expressed X-linked (BEX) proteins in human cancers. Biochim
Biophys Acta. 1856:226–233. 2015.PubMed/NCBI
|
|
19
|
Khazaei MR, Halfter H, Karimzadeh F, Koo
JH, Margolis FL and Young P: Bex1 is involved in the regeneration
of axons after injury. J Neurochem. 115:910–920. 2010. View Article : Google Scholar : PubMed/NCBI
|
|
20
|
Vilar M, Murillo-Carretero M, Mira H,
Magnusson K, Besset V and Ibáñez CF: Bex1, a novel interactor of
the p75 neurotrophin receptor, links neurotrophin signaling to the
cell cycle. EMBO J. 25:1219–1230. 2006. View Article : Google Scholar : PubMed/NCBI
|
|
21
|
Naderi A, Teschendorff AE, Beigel J,
Cariati M, Ellis IO, Brenton JD and Caldas C: BEX2 is overexpressed
in a subset of primary breast cancers and mediates nerve growth
factor/nuclear factor-kappaB inhibition of apoptosis in breast
cancer cell lines. Cancer Res. 67:6725–6736. 2007. View Article : Google Scholar : PubMed/NCBI
|
|
22
|
Naderi A, Liu J and Bennett IC: BEX2
regulates mitochondrial apoptosis and G1 cell cycle in breast
cancer. Int J Cancer. 126:1596–1610. 2010.PubMed/NCBI
|
|
23
|
de Ronde JJ, Lips EH, Mulder L, Vincent
AD, Wesseling J, Nieuwland M, Kerkhoven R, Vrancken Peeters MJ,
Sonke GS, Rodenhuis S, et al: SERPINA6, BEX1, AGTR1, SLC26A3, and
LAPTM4B are markers of resistance to neoadjuvant chemotherapy in
HER2-negative breast cancer. Breast Cancer Res Treat. 137:213–223.
2013. View Article : Google Scholar : PubMed/NCBI
|
|
24
|
Hofsli E, Wheeler TE, Langaas M, Laegreid
A and Thommesen L: Identification of novel neuroendocrine-specific
tumour genes. Br J Cancer. 99:1330–1339. 2008. View Article : Google Scholar : PubMed/NCBI
|
|
25
|
Foltz G, Ryu GY, Yoon JG, Nelson T, Fahey
J, Frakes A, Lee H, Field L, Zander K, Sibenaller Z, et al:
Genome-wide analysis of epigenetic silencing identifies BEX1 and
BEX2 as candidate tumor suppressor genes in malignant glioma.
Cancer Res. 66:6665–6674. 2006. View Article : Google Scholar : PubMed/NCBI
|
|
26
|
Karakoula K, Jacques TS, Phipps KP,
Harkness W, Thompson D, Harding BN, Darling JL and Warr TJ:
Epigenetic genome-wide analysis identifies BEX1 as a candidate
tumour suppressor gene in paediatric intracranial ependymoma.
Cancer Lett. 346:34–44. 2014. View Article : Google Scholar : PubMed/NCBI
|
|
27
|
Lindblad O, Li T, Su X, Sun J, Kabir NN,
Levander F, Zhao H, Lu G, Rönnstrand L and Kazi JU: BEX1 acts as a
tumor suppressor in acute myeloid leukemia. Oncotarget.
6:21395–21405. 2015. View Article : Google Scholar : PubMed/NCBI
|
|
28
|
Ding K, Su Y, Pang L, Lu Q, Wang Z, Zhang
S, Zheng S, Mao J and Zhu Y: Inhibition of apoptosis by
downregulation of hBex1, a novel mechanism, contributes to the
chemoresistance of Bcr/Abl+ leukemic cells.
Carcinogenesis. 30:35–42. 2009. View Article : Google Scholar : PubMed/NCBI
|
|
29
|
Xiao Q, Hu Y, Liu Y, Wang Z, Geng H, Hu L,
Xu D, Wang K, Zheng L, Zheng S, et al: BEX1 promotes
imatinib-induced apoptosis by binding to and antagonizing BCL-2.
PLoS One. 9:e917822014. View Article : Google Scholar : PubMed/NCBI
|
|
30
|
Che ZM, Jung TH, Choi JH, Yoon DJ, Jeong
HJ, Lee EJ and Kim J: Collagen-based co-culture for invasive study
on cancer cells-fibroblasts interaction. Biochem Biophys Res
Commun. 346:268–275. 2006. View Article : Google Scholar : PubMed/NCBI
|
|
31
|
Gaggioli C, Hooper S, Hidalgo-Carcedo C,
Grosse R, Marshall JF, Harrington K and Sahai E: Fibroblast-led
collective invasion of carcinoma cells with differing roles for
RhoGTPases in leading and following cells. Nat Cell Biol.
9:1392–1400. 2007. View Article : Google Scholar : PubMed/NCBI
|
|
32
|
Tane S, Maniwa Y, Hokka D, Tauchi S,
Nishio W, Okita Y and Yoshimura M: The role of Necl-5 in the
invasive activity of lung adenocarcinoma. Exp Mol Pathol.
94:330–335. 2013. View Article : Google Scholar : PubMed/NCBI
|
|
33
|
Friedl P and Wolf K: Tumour-cell invasion
and migration: Diversity and escape mechanisms. Nat Rev Cancer.
3:362–374. 2003. View Article : Google Scholar : PubMed/NCBI
|
|
34
|
Wolf K, Mazo I, Leung H, Engelke K, von
Andrian UH, Deryugina EI, Strongin AY, Bröcker EB and Friedl P:
Compensation mechanism in tumor cell migration:
Mesenchymal-amoeboid transition after blocking of pericellular
proteolysis. J Cell Biol. 160:267–277. 2003. View Article : Google Scholar : PubMed/NCBI
|
|
35
|
Friedl P and Alexander S: Cancer invasion
and the microenvironment: Plasticity and reciprocity. Cell.
147:992–1009. 2011. View Article : Google Scholar : PubMed/NCBI
|