Introduction
Head and neck squamous cell carcinoma (HNSCC),
representing a group of tumors in the larynx, pharynx and oral
cavity, is the sixth most common cancer in the world, with ~500,000
new cases worldwide each year (1,2). Among
these cases, oral squamous cell carcinoma (OSCC) and laryngeal
squamous cell carcinoma (LSCC) have a high incidence, especially in
China (3,4), exhibiting high morbidity and mortality
rates (5). According to GLOBOCAN
2012, the incidence and mortality rate of laryngeal cancer in China
was 1.1/100,000 and 0.7/100,000, compared with the global incidence
and mortality rate of which was 2.1/100,000 and 1.1/100,000,
respectively (6). Oral cancer was
also reported to be the 11th most common malignancy in the world in
2017 (7,8). HNSCC is associated with smoking and
alcohol abuse (9), and it is also
linked to infection with the human papillomavirus (10). In the occurrence and development of
HNSCC, epigenetic events play an important role, including DNA
methylation, post-translational covalent modification of histones,
chromatin remodeling and the effects of non-coding RNA (11–14).
Currently, an increasing number of splicing patterns have been
found, such as the splicing variants of laminin subunit α3 (LAMA3),
dystonin (DST), dedicator of cytokinesis (DOCK5), lysyl
oxidase-like 2 (LOXL2) and gelsolin (GSN), and some studies have
shown that these splicing variants can be used as cancer markers
and potential therapeutic targets (15–18).
Some of these variants could even become novel antigens for
specific targeted therapy of HNSCC, such as the splicing variant of
GSN, which was reported to be able to serve as a biomarker of HNSCC
and a neoantigen for HNSCC treatment (18). In addition, HNSCC is characterized by
clinical heterogeneity (19). For
instance, patients with recurrent and/or metastatic HSNCC can be
treated with cetuximab, an anti-EGFR antibody, but only ~13% of
patients with metastasis respond to this therapy (20). In recent years, immune checkpoint
inhibitors (ICIs), such as nivolumab and pembrolizumab, have shown
certain potential in the treatment of HNSCC (21,22).
However, primary resistance to ICIs emerges in the majority of
patients, and the benefits of this therapy is therefore suboptimal
(23) compared with the
anti-programmed death-1 monoclonal antibody (24,25).
Therefore, it is particularly important to identify novel
predictive biomarkers to improve the screening of patients who can
benefit from ICI treatment. At present, more and more evidence has
shown that the progression and metastasis of HNSCC are associated
with polygenic changes (26,27); thus, it is important to improve our
understanding of the mechanisms underlying the pathogenesis of
HNSCC to aid the identification of novel biomarkers.
Apolipoprotein L1 (APOL1) is located at chromosome
22q12.3 and APOL1 gene encodes a trypanolytic factor that
dissolves pathogenic Trypanosoma brucei subspecies in humans and
gorillas (28). Other studies have
shown a link between non-diabetic nephropathy and variations in the
APOL1 gene (29,30), which are also associated with
atherosclerosis (31). APOL1 is one
of six genes of the APOL gene family, which are a set of
genomic hotspots for various diseases (32), including schizophrenia, cancer and
chronic kidney disease (33,34). The APOL gene family is
associated with programmed cell death and mainly encodes proteins
to initiate apoptosis or autophagic death by increasing levels of
free radicals, aggregating macromolecules, and inducing DNA damage
and metabolic defects (35).
Therefore, protein damage caused by apoptosis and autophagy is
associated with the pathogenesis of several cancer types (36,37).
However, there is no relevant literature to report the expression
of APOL1 and its clinical significance in HNSCC, to the best
of our knowledge.
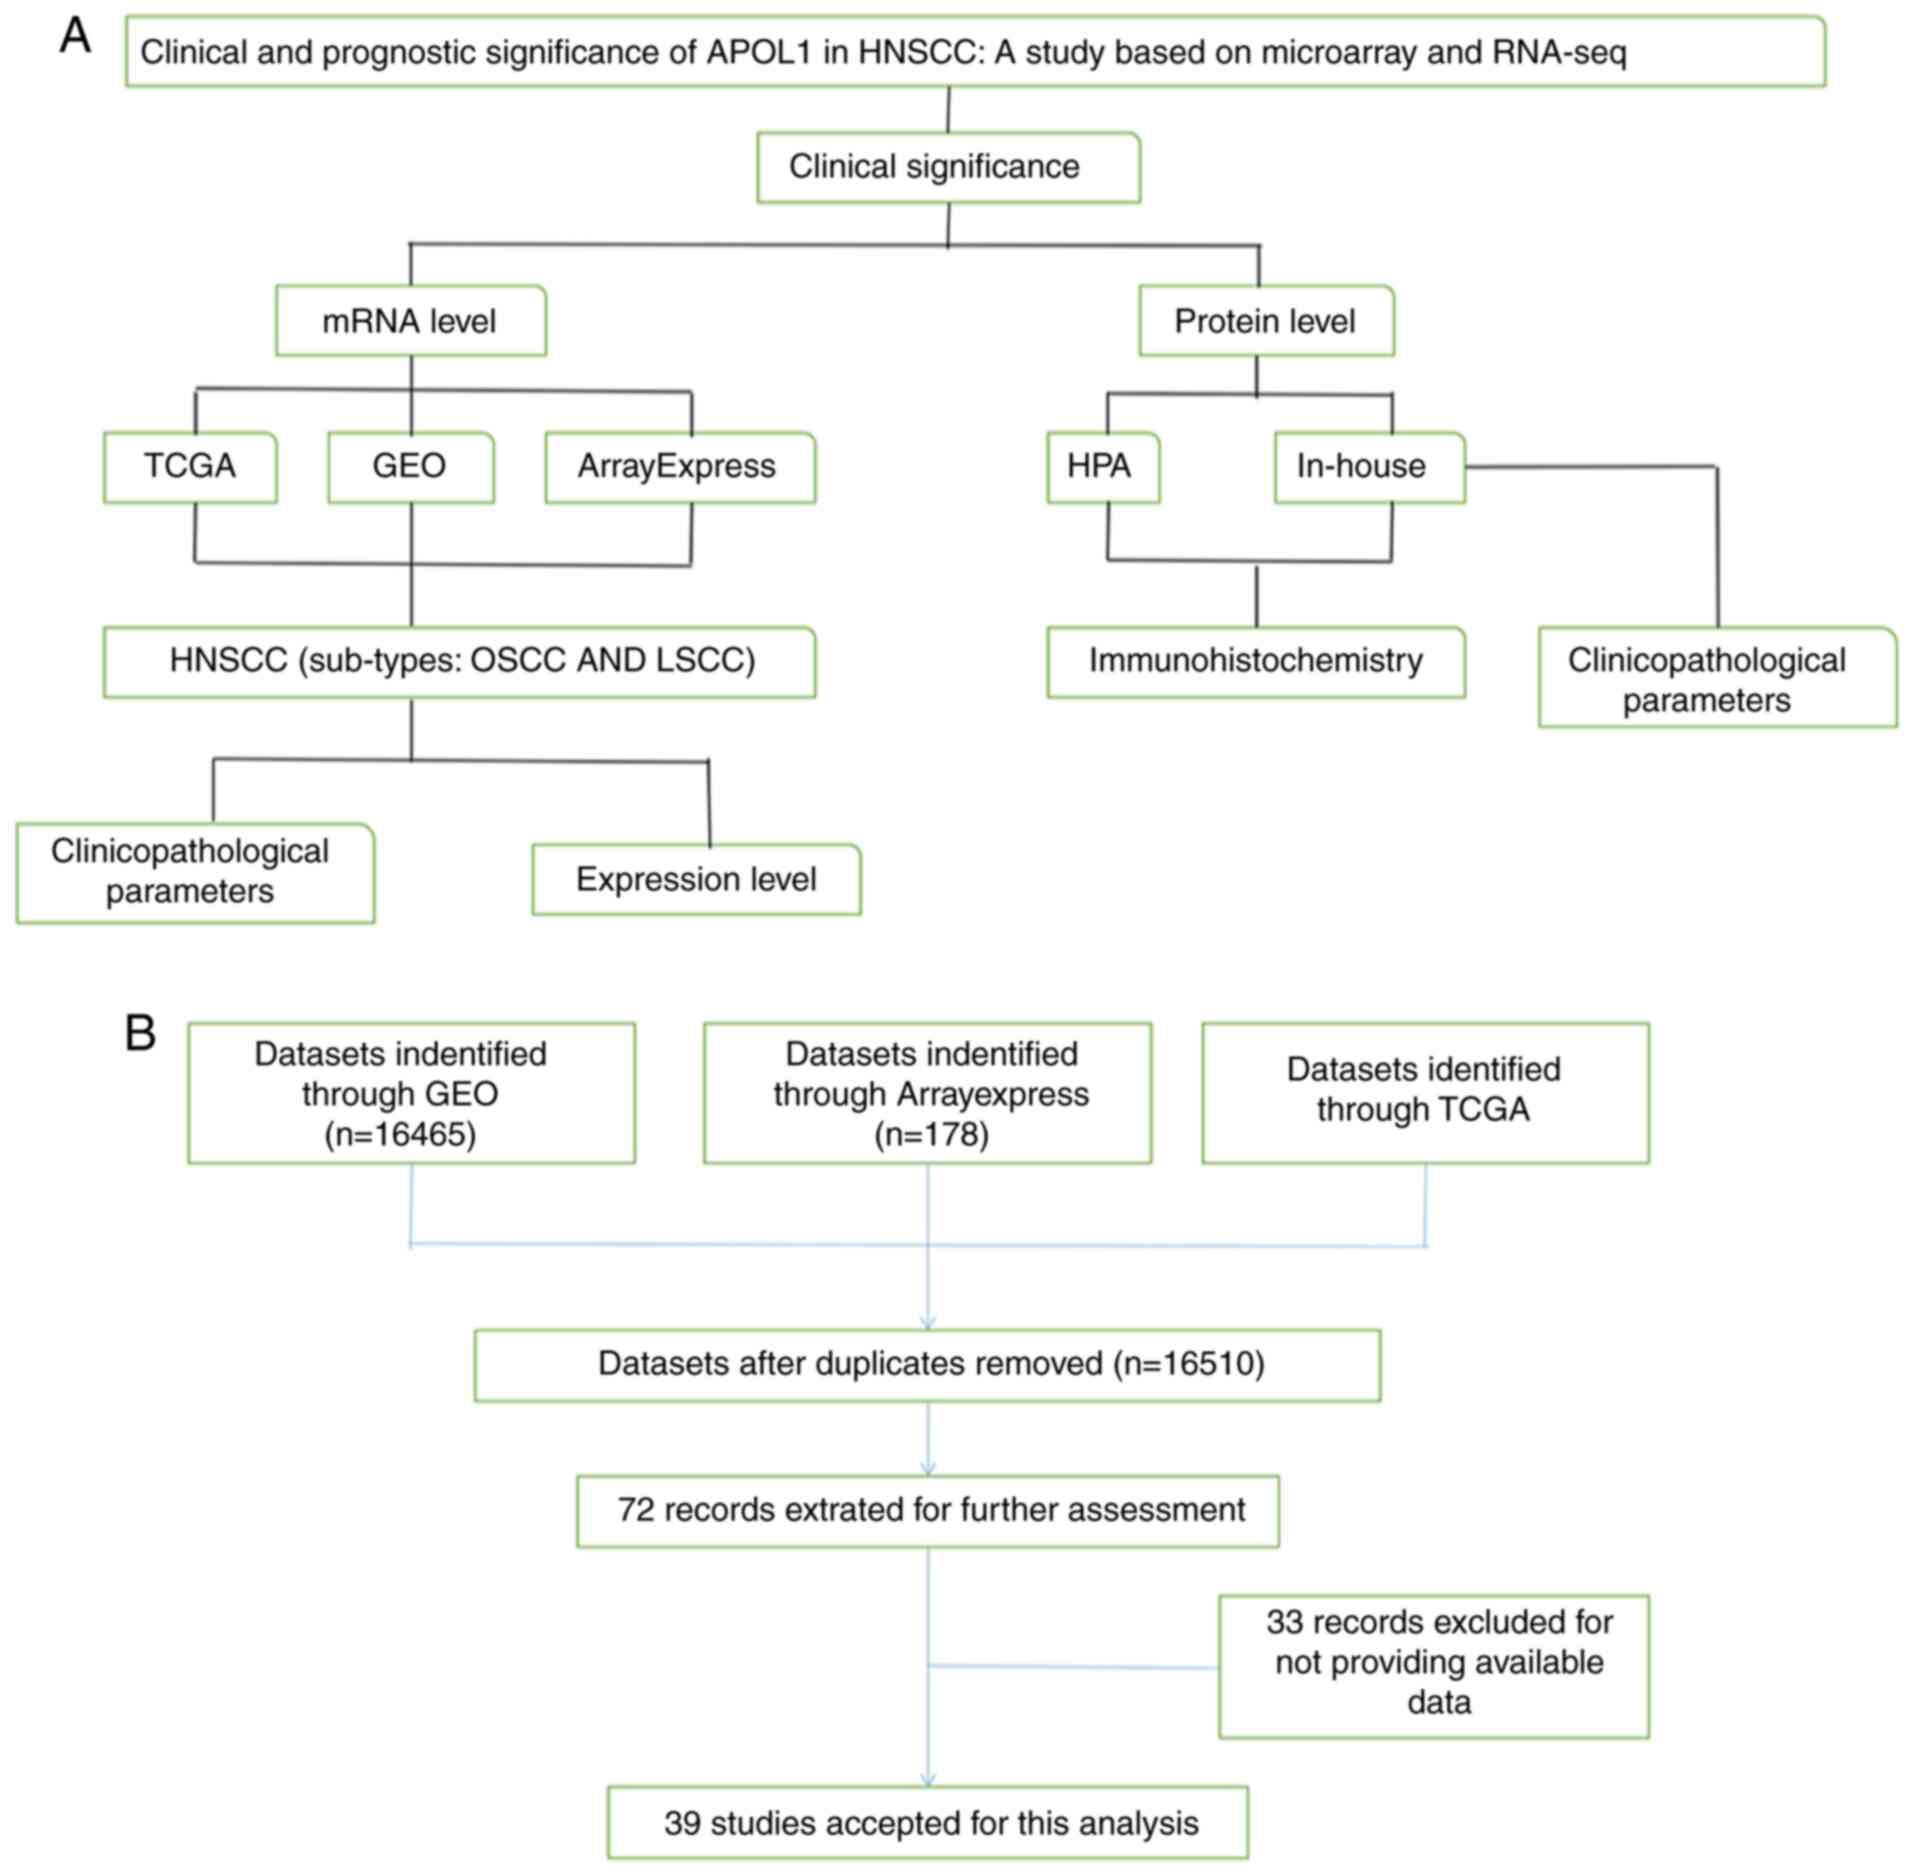
By mining the high-throughput data from
ArrayExpress, Gene Expression Omnibus (GEO), The Cancer Genome
Atlas (TCGA), Human Protein Atlas (HPA), as well as using
immunohistochemistry (IHC), the present study examined the
associations between APOL1 mRNA and protein expression in HNSCC and
related clinical parameters and prognoses. The two most common
sites (oral and larynx) of HNSCC were selected for subgroup
analyses (Fig. 1). Nasopharyngeal
carcinoma was excluded from subgroup analysis due to its unique
pathogenesis (38). The present
results may improve our understanding of the association between
HNSCC and APOL1 that has hitherto been lacking in oncology, and
suggested that APOL1 is a promising biomarker that deserves further
study.
Materials and methods
Study design
At the mRNA level, datasets, including 16,510
individual data points after removing duplicates, were obtained
through TCGA (https://cancergenome.nih.gov/), GEO (http://www.ncbi.nlm.nih.gov/geo/), and
ArrayExpress (http://www.ebi.ac.uk/arrayexpress/) databases. In
total, 39 studies were used for the final analysis, which were
divided into two subgroups: OSCC and LSCC, such as the datasets of
GSE10121 (39), GSE13601 (40), GSE51985 (41). The control group included negative
marginal tissue with squamous cells, healthy nasopharyngeal tissue
and the epithelial tonsil samples. At the protein level, images of
IHC staining results were obtained from the HPA (42–44).
In-house validation with IHC was also used to verify the
APOL1 mRNA expression data collected from the First
Affiliated Hospital of Guangxi Medical University (Nanning, China).
The inclusion criteria were: i) None of patients had received
preoperative chemoradiotherapy and ii) all of the operative tissues
were obtained during resection. The study exclusion criteria were
as follows: i) Multiple primary tumors and ii) lack of
clinicopathological data.
IHC
The HPA, through the use of IHC techniques, aims to
provide information on the distribution of various kinds of human
proteins in cells and tissues and the staining results of images
that are fully representative (42–44).
Thus, this database was used to collect images of IHC staining
results for HNSCC. After obtaining approval from The Ethics
Committee of the First Affiliated Hospital of Guangxi Medical
University (Nanning, China), as well as patient written consent,
HNSCC, non-tumor tissues and corresponding clinical information
were collected at the hospital between January 2017 and September
2018. IHC was then performed on these tissues, including 221 HNSCC
and 24 non-tumor squamous epithelial tissues from 13 cases of the
oral cavity, five of the larynx and six of the nasopharynx. All
clinicopathological features were obtained to analyze the influence
of the APOL1 protein expression on the occurrence and development
of HNSCC.
Pathological sectioning was performed on both the
HNSCC and non-cancerous tissues, which were then fixed in 4%
formaldehyde solution for 24 h at room temperature, followed by
being dehydrated with conventional gradient ethanol (80, 90, 95 and
100%) and embedded. Paraffin-embedded HNSCC and non-cancerous
tissues were cut into 4-µm sections and heated at 75°C for 2 h. The
sections were deparaffined with xylene and rehydrated with
conventional gradient ethanol (100, 95, 85, 75 and 50%). Then these
sections were washed twice under running water and boiled in EDTA
antigen Retrieval Solution (pH=9.0) for 2.5 min in a pressure
cooker for antigen retrieval. After that, the sections were
immersed in 3% hydrogen peroxide for 5 min to block endogenous
peroxidase activity and incubated with diluted anti-APOL1 antibody
(1:100, cat. no. CL0171; Abcam) for 90 min at 37°C and with a
secondary antibody for 25 min at room temperature. After the
sections were incubated with DAB staining for 5 min at room
temperature and counterstained with hematoxylin for 30 sec at room
temperature. Finally, these sections were dehydrated with gradient
ethanol, cleared by xylene, and sealed with resin. Images
(magnification, ×100 and ×200) were captured using an optical
microscope (Motic China Group Co., Ltd.). The score of the IHC
staining results, including HPA and in-house IHC, was generated
from the product of the proportion of stained cancerous cells among
all cells (0, ≤5%; 1, 6–25%; 2, 26–50%; 3, 51–75%; 4, >75%) and
the staining degree of the positive cancerous cells (0, no
staining; 1, light staining; 2, moderate staining; 3, strong
staining), which was assessed manually by two independent
pathologists.
Microarray and RNA-sequencing data
from TCGA, GEO and ArrayExpress databases
By mining TCGA, GEO and ArrayExpress databases,
microarrays and RNA-sequencing (RNA-seq) data regarding HNSCC were
retrieved. The search strategy was (head and neck OR HNSCC OR
laryngeal OR nasopharyngeal OR pharyngeal OR oral OR LSCC OR NPC OR
OSCC) AND (squamous cell carcinoma OR carcinoma OR tumor OR cancer
OR neoplas* OR malignan*). The inclusion criteria for the
microarray and RNA-seq data were as follows: i) Cancer samples came
from HNSCC tissues; ii) the species was Homo sapien; iii)
the included chips contained the expression APOL1; iv) the tissue
sample sources were head and neck tissues and v) chip sequencing or
other high-throughput detection methods were used. The downloaded
data were normalized and log2 transformed. Basic
information of the 39 microarrays of APOL1 expression profiling
involved in the present study is summarized at Table I. There are 21 microarrays with APOL1
expression for OSCC, 4 for LSCC, 3 for NPC and 11 for unclassified
HNSCC tissues. The mRNA expression of APOL1 in HNSCC and normal
tissues were obtained from above databases.
 | Table I.Basic information of the 39
microarrays of APOL1 expression profiling involved in the present
study. |
Table I.
Basic information of the 39
microarrays of APOL1 expression profiling involved in the present
study.
|
|
|
| Number of samples,
n | APOL1 expression,
mean ± SD |
|
|---|
|
|
|
|
|
|
|
|---|
| ID | Year | Tissue type | HNSCC | Normal | HNSCC | Normal | P-value |
|---|
| GSE10121 | 2008 | OSCC | 32 | 6 | 1.774±1.490 | −1.083±0.423 | <0.001 |
| GSE13601 | 2008 | OSCC | 31 | 26 | 7.917±1.284 | 5.466±1.271 | <0.001 |
| GSE19089 | 2009 | OSCC | 3 | 3 | 5.757±0.140 | 5.665±0.128 | 0.449 |
| GSE23558 | 2011 | OSCC | 27 | 5 | 2.107±1.454 | 0.022±1.329 | 0.006 |
| GSE25099 | 2011 | OSCC | 57 | 22 | 7.938±0.870 | 5.985±0.610 | <0.001 |
| GSE30784 | 2011 | OSCC | 167 | 45 | 8.522±1.349 | 5.970±0.951 | <0.001 |
| GSE31056 | 2011 | OSCC | 23 | 73 | 8.267±1.058 | 6.385±1.004 | <0.001 |
| GSE31853 | 2011 | OSCC | 8 | 3 | 6.027±0.948 | 3.933±1.275 | 0.015 |
| GSE34106 | 2012 | OSCC | 28 | 15 | 6.691±0.600 | 5.992±0.367 | <0.001 |
| GSE3524 | 2005 | OSCC | 16 | 4 | 0.054±1.165 | −1.842±1.222 | 0.010 |
| GSE36090 | 2012 | OSCC | 10 | 3 | 2.083±1.861 | 0.170±0.816 | 0.119 |
| GSE37991 | 2013 | OSCC | 40 | 40 | 7.546±0.334 | 8.205±0.566 | <0.001 |
| GSE55550 | 2014 | OSCC | 139 | 16 | 0.191±0.921 | −0.290±0.381 | <0.001 |
| GSE56532 | 2014 | OSCC | 10 | 6 | 10.080±1.340 | 7.661±0.735 | 0.001 |
| GSE6631 | 2007 | OSCC | 22 | 22 | 6.176±0.680 | 5.539±0.411 | 0.001 |
| GSE74530 | 2017 | OSCC | 6 | 6 | 7.033±1.548 | 4.744±0.268 | 0.015 |
| GSE9844 | 2008 | OSCC | 26 | 12 | 7.701±1.217 | 6.053±0.533 | <0.001 |
| GSE55549 | 2014 | OSCC | 8 | 4 | 0.158±0.666 | −0.268±0.424 | 0.276 |
| GSE78060 | 2017 | OSCC | 26 | 4 | 10.801±1.437 | 7.139±2.094 | <0.001 |
| GSE75539 | 2016 | OSCC | 7 | 8 | 6.43±0.258 | 6.143±0.181 | 0.026 |
| GSE75538 | 2016 | OSCC | 14 | 14 | 6.767±1.161 | 6.238±0.331 | 0.113 |
| GSE12452 | 2008 | NPC | 31 | 10 | 8.342±0.618 | 8.394±0.437 | 0.808 |
| GSE53819 | 2014 | NPC | 18 | 18 | 12.169±0.541 | 11.509±0.816 | 0.007 |
| GSE64634 | 2017 | NPC | 12 | 4 | 7.749±1.015 | 7.833±0.471 | 0.877 |
| GSE51985 | 2013 | LSCC | 10 | 10 | 31.337±43.389 | 18.568±26.459 | 0.437 |
| GSE59102 | 2014 | LSCC | 29 | 13 | 11.867±1.163 | 10.753±0.879 | 0.004 |
| GSE29330 | 2014 | LSCC | 13 | 5 | 8.322±1.548 | 6.486±0.619 | 0.002 |
| GSE84957 | 2016 | LSCC | 9 | 9 | 13.326±0.649 | 12.539±0.771 | 0.032 |
| GSE10774 | 2008 | Unclassified
HNSCC | 10 | 4 | −0.812±0.853 | −1.780±0.366 | 0.012 |
| GSE13397 | 2009 | Unclassified
HNSCC | 8 | 8 | 13.087±0.617 | 11.802±0.538 | <0.001 |
| GSE13398 | 2009 | Unclassified
HNSCC | 8 | 8 | 1.484±0.604 | 0.363±0.376 | <0.001 |
| GSE33205 | 2013 | Unclassified
HNSCC | 44 | 25 | 7.032±1.087 | 5.885±0.347 | <0.001 |
| GSE55546 | 2014 | Unclassified
HNSCC | 12 | 4 | 0.395±0.947 | −0.358±0.414 | 0.153 |
| GSE58911 | 2014 | Unclassified
HNSCC | 15 | 15 | 9.085±1.111 | 8.151±0.732 | 0.011 |
| GSE83519 | 2017 | Unclassified
HNSCC | 22 | 22 | 2.672±0.236 | 2.781±0.180 | 0.090 |
| GSE107591 | 2017 | Unclassified
HNSCC | 24 | 23 | 8.602±1.419 | 7.2±0.886 | <0.001 |
| GSE39400 | 2012 | Unclassified
HNSCC | 28 | 11 | 6.585±0.287 | 6.365±0.235 | 0.030 |
| E-MTAB-1516 | NA | Unclassified
HNSCC | 16 | 19 | −5.366±4.091 | −6.925±3.796 | 0.251 |
| TCGA | NA | Unclassified
HNSCC | 502 | 44 | 4.383±0.106 | 4.257±0.104 | <0.001 |
Clinical parameter data of TCGA, GEO
and ArrayExpress databases
Meanwhile, the information of corresponding
clinicopathological parameters, such as sex, age, grade and
Tumor-Node-Metastasis (TNM) stage (45), were extracted for further analysis
and comparison. Kaplan-Meier estimator with log-rank tests were
also used on the RNA-seq data to show the prognostic capability of
APOL1 for HNSCC.
Statistical analysis
The appropriate statistical methods were applied to
clarify the APOL1 expression in HNSCC and its two subgroups (OSCC
and LSCC). SPSS 22.0 (IBM Corp) was used to carry out unpaired
t-tests to investigate the differences in the APOL1 mRNA expression
between tumor and normal tissues based on TCGA, GEO and
ArrayExpress databases. Scatter diagrams and receiver operating
characteristic (ROC) curves were drawn using GraphPad Prism version
7.0 (GraphPad Software). In addition, the summary receiver
operating characteristic (sROC) curves were drawn using Stata 12
(StataCorp LLC). These were used to evaluate the capability of
APOL1 to diagnose tumors, the accuracy of which was confirmed by
the area under the curve (AUC). Comparing the APOL1 expression in
tumor tissues with that in non-tumor tissues, standard mean
differences (SMDs) and 95% confidence intervals (CIs) were used.
The funnel plot and Begg's test were used to examine whether there
was publication bias. χ2 and Fisher's exact tests were
used to compare the IHC staining scores of APOL1 in HNSCC with
those in the normal tissues and analyze the association between the
clinicopathological parameters and expression of APOL1 proteins for
135 patients with HNSCC. χ2 tests were used when all
theoretical frequency T≥5 and total sample size n≥40, while
Fisher's test suitable for sample size n<40 or theoretical
frequency T<1. Fagan's Tests were used to demonstrate the
relationship between the former probability, the latter
probability, the positive likelihood ratio and the negative
likelihood ratio by taking APOL1 expression value as the diagnostic
method and comparing with the gold standard for cancer diagnosis.
If the heterogeneity test was P<0.05 or I2>50%,
meaning the existence of heterogeneity, the random effects model
was used. If the contrary was true, the fixed effects model was
used. Some microarrays were excluded according to the following
criteria: i) Microarrays with low expression, ii) microarrays with
large confidence intervals (CIs) and iii) microarrays with no
statistical significance. Meanwhile, Stata 12 (StataCorp) was also
used to construct the forest plots, sensitivity analysis and to
determine the positive or negative likelihood ratio and publication
bias. P<0.05 was considered to indicate a statistically
significant difference.
Results
APOL1 protein expression in OSCC
detected by IHC and its association with clinicopathological
parameters
In total, 135 cases of OSCC and 13 cases of normal
oral tissues in-house were used to analyze the change of APOL1
expression in OSCC samples. Of the 135 cases with OSCC tissue
samples, APOL1 was positively expressed in 61 cases (45.2%).
Meanwhile, no positive results were observed in the 13 cases of
non-cancerous oral tissues (Table
II). It was demonstrated that the difference of APOL1 protein
was statistically significant (P=0.001; Table II), which indicated a higher
expression of APOL1 in OSCC tissues compared with in normal
tissues. The clinicopathological features of the 135 OSCC are
summarized in Table II. By
analyzing the association between the expression of APOL1 and
clinicopathological parameters in OSCC, it was revealed that there
was a significant association between APOL1 and sex (P=0.015,
Table II). No marked associations
were observed between APOL1 expression and other clinical
parameters. Thus, APOL1 protein expression was upregulated in OSCC
tissues as compared to non-cancerous oral controls.
| Table II.The clinicopathological parameters
and expression of APOL1 protein for 135 patients with oral squamous
cell carcinoma. |
Table II.
The clinicopathological parameters
and expression of APOL1 protein for 135 patients with oral squamous
cell carcinoma.
|
| APOL1 expression,
n |
|
|---|
|
|
|
|
|---|
| Clinicopathological
parameter | High | Low | P-value |
|---|
| Cancerous cases vs.
non-cancerous cases |
|
| 0.001 |
|
Cancerous cases | 61 | 74 |
|
|
Non-cancerous cases | 0 | 13 |
|
| Sex |
|
Male | 53 | 51 | 0.015 |
|
Female | 8 | 23 |
|
| Age, years |
|
≥60 | 24 | 31 | 0.728 |
|
<60 | 37 | 42 |
|
| Grade |
|
1–2 | 25 | 35 | 0.491 |
|
3–4 | 36 | 39 |
|
| Stage |
|
I–II | 25 | 35 | 0.491 |
|
III–IV | 36 | 39 |
|
| Pathological T |
|
T1-T2 | 43 | 15 | 0.840 |
|
T3-T4 | 59 | 18 |
|
| Pathological N |
| N0 | 34 | 45 | 0.601 |
| N1 | 27 | 29 |
|
| Pathological M |
| M0 | 61 | 73 | 0.456 |
| M1 | 0 | 1 |
|
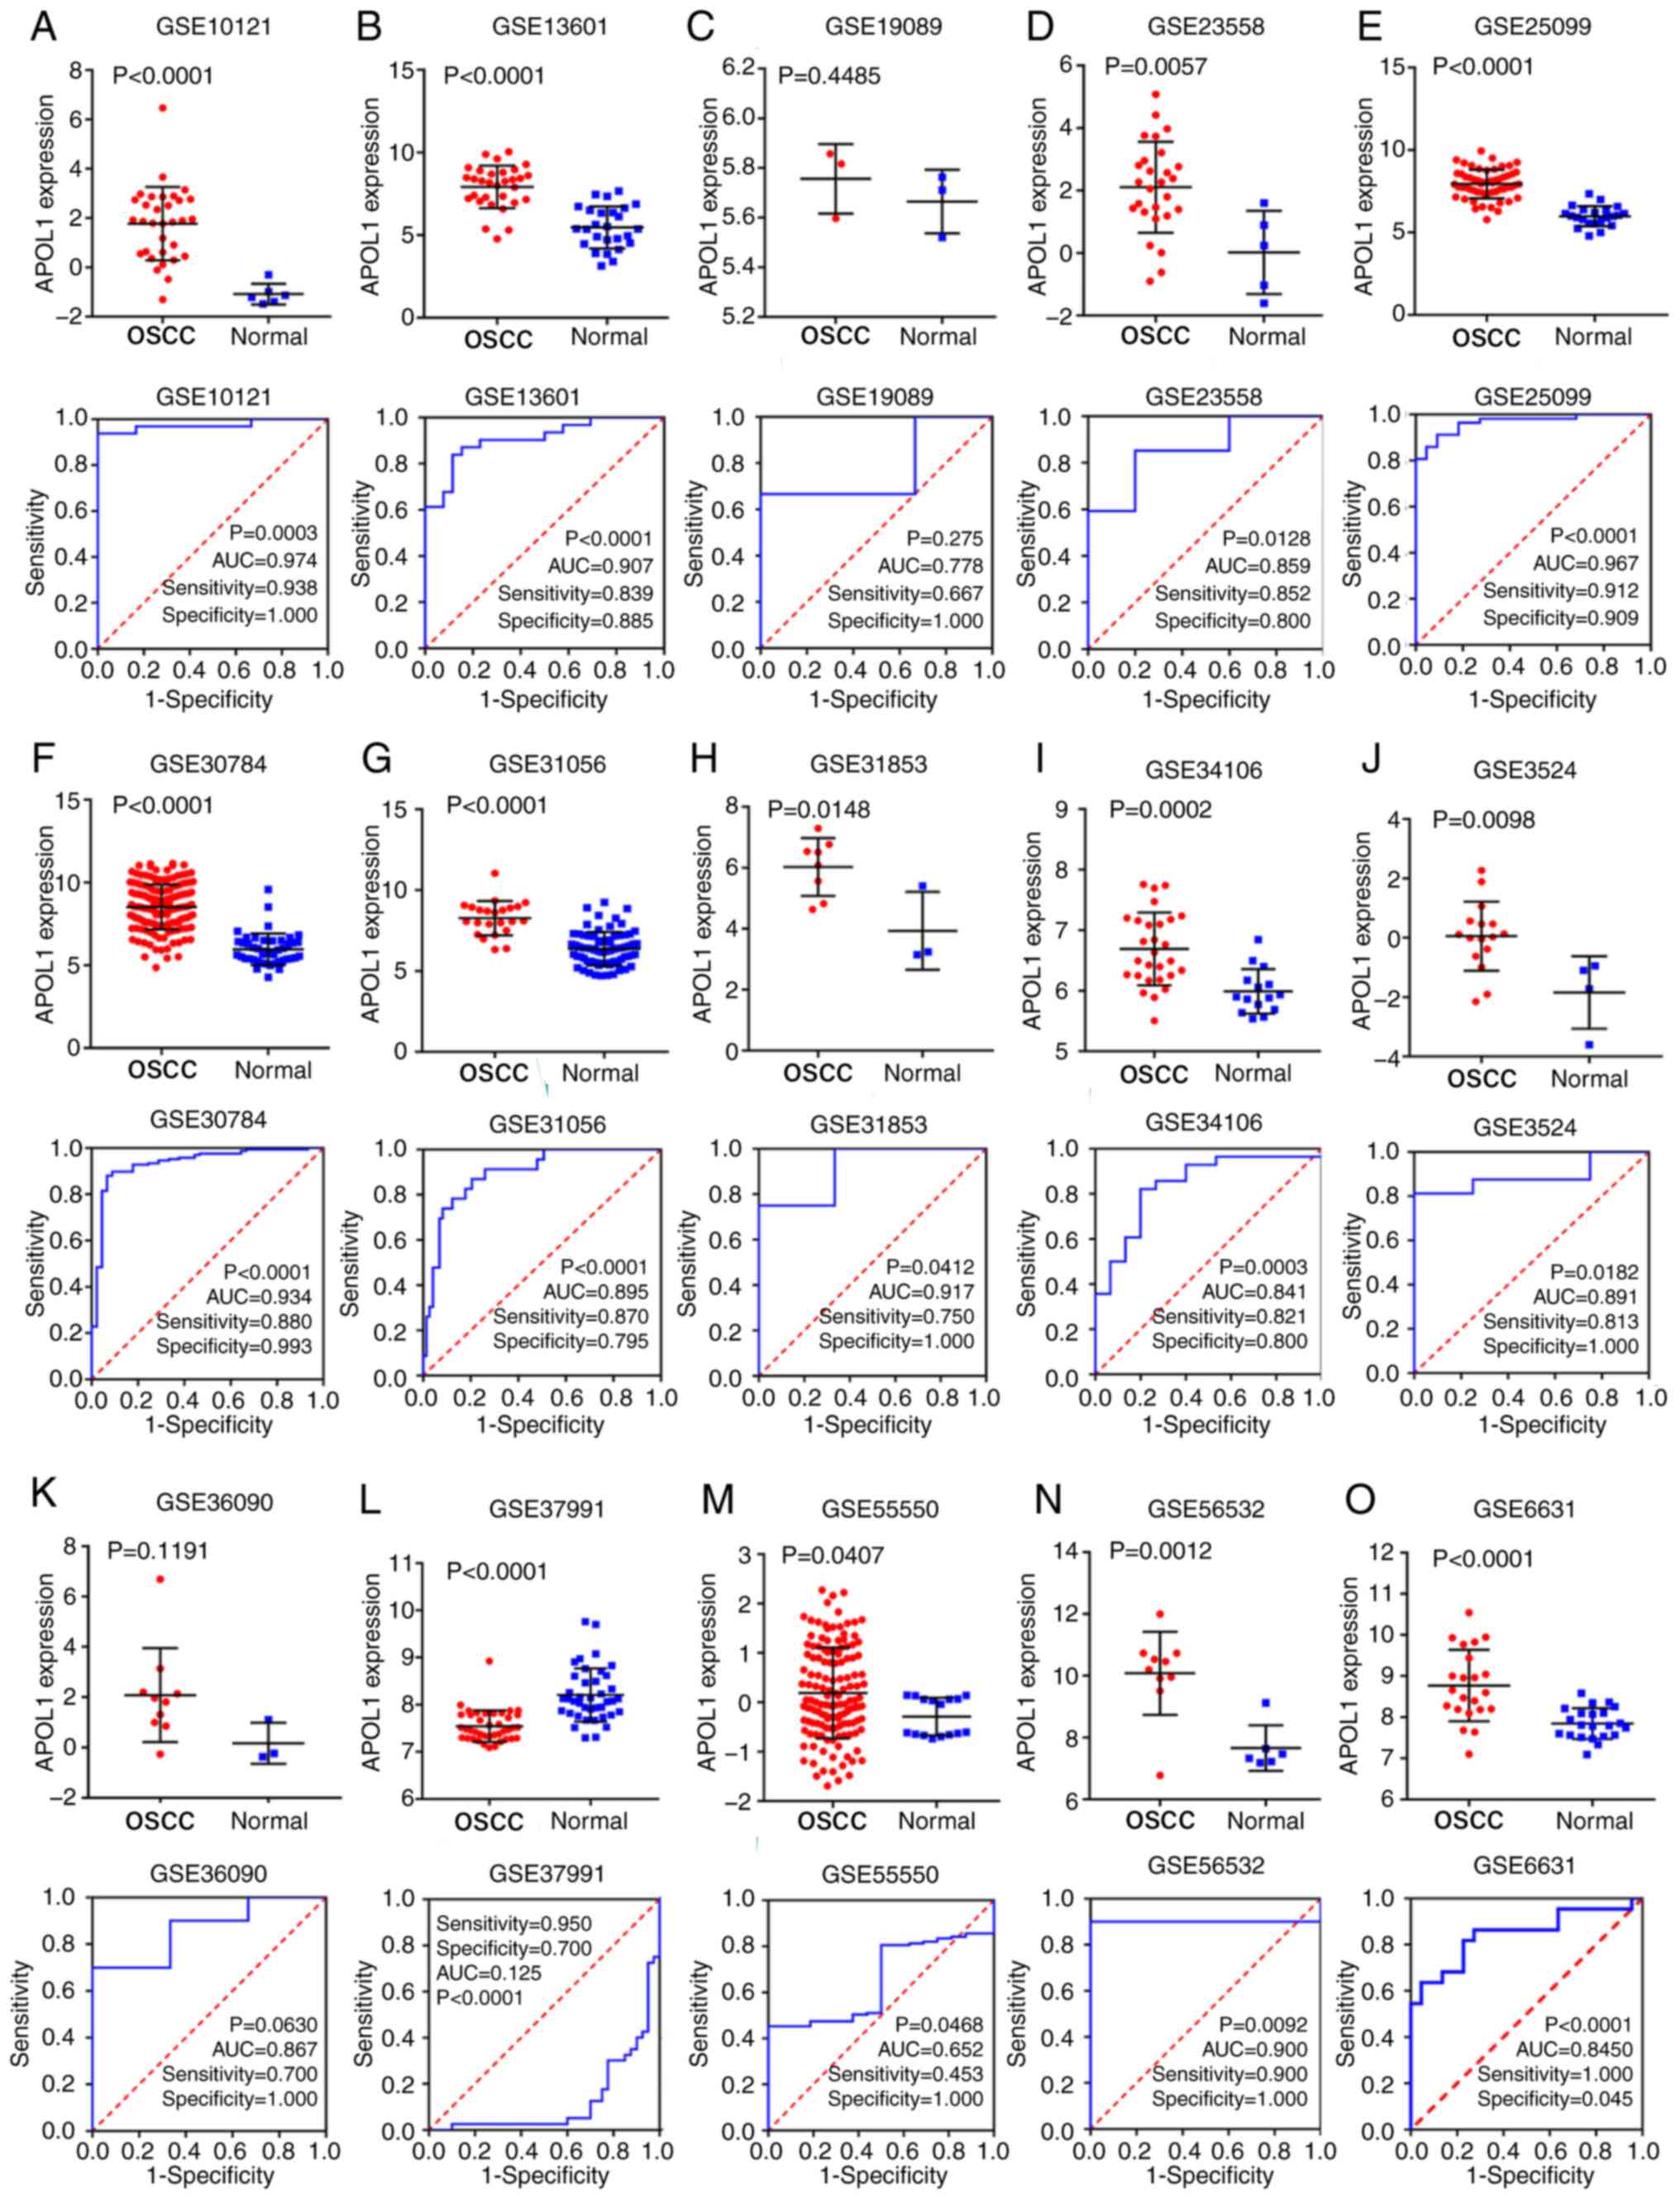
Analysis of APOL1 mRNA expression in
OSCC
TCGA, GEO and ArrayExpress databases were searched
and 21 microarrays containing APOL1 expression profile were
performed with OSCC tissues (Table
I). Of the 21 microarrays (Fig.
2A-O and 3A-F), 20 showed that
APOL1 was highly expressed in OSCC tissues compared with in normal
tissues. Statistically significant differences were found in 17 out
of 21 microarrays, while four microarrays (GSE19089, GSE36090,
GSE55549 and GSE75538 had no statistical significance in the change
of expression level of APOL1 between the OSCC tissues and control
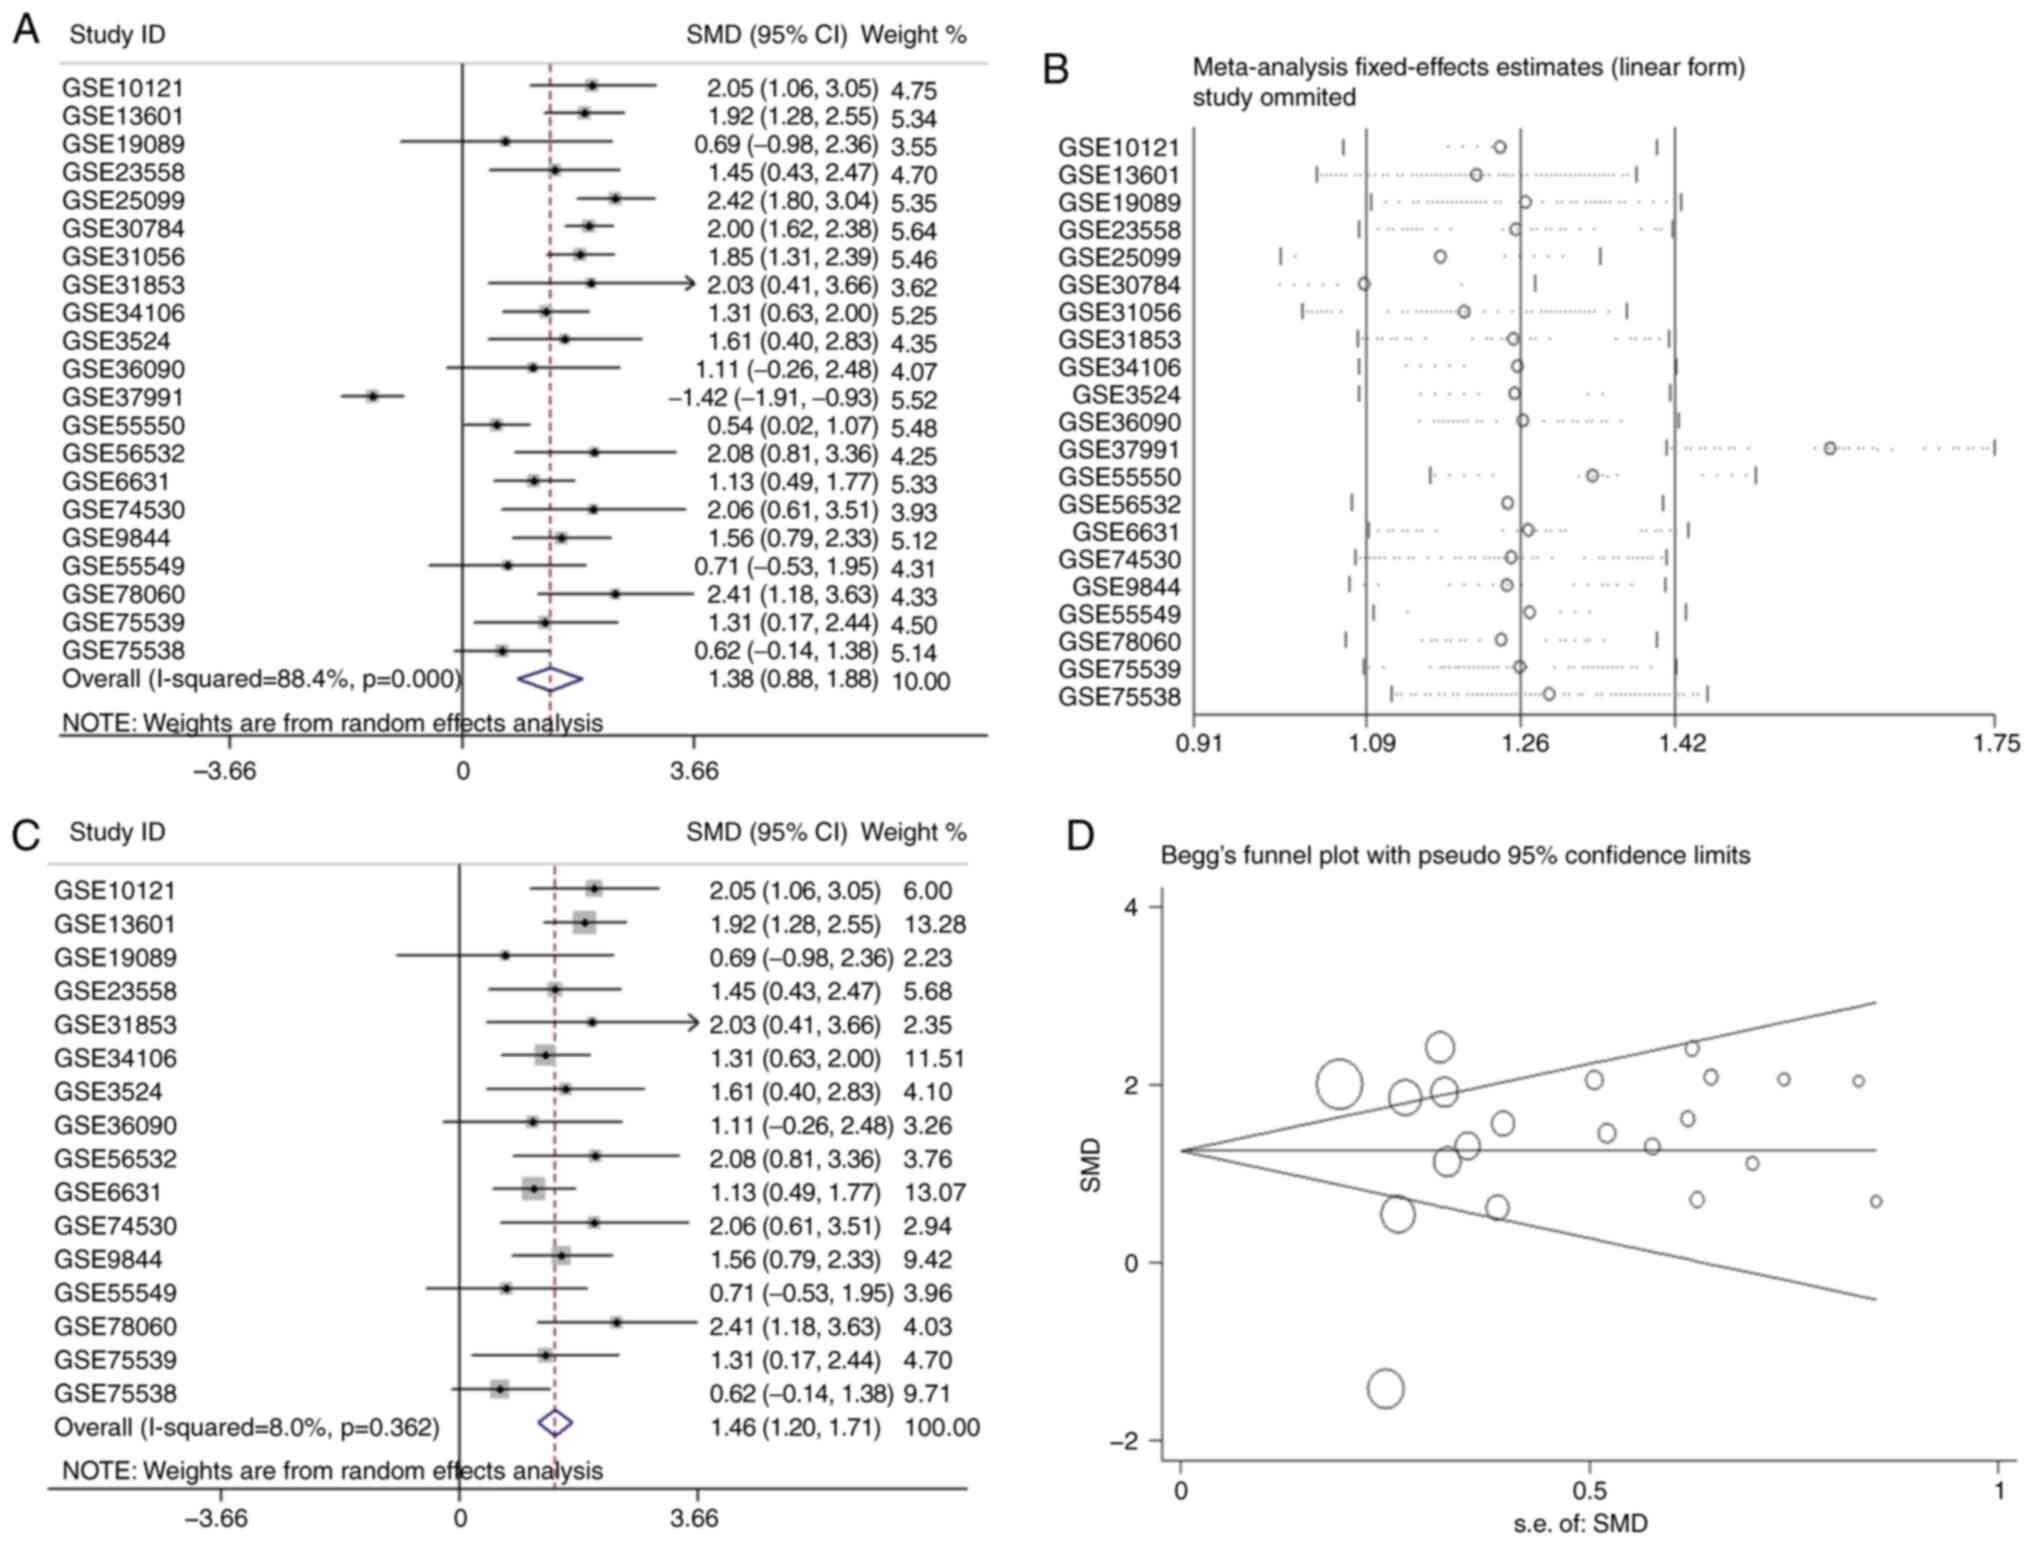
group. Analysis revealed that the overall SMD was 1.38 (95% CI,
0.88–1.88) (Fig. 4A). In other
words, the expression of APOL1 was stronger in OSCC tissues
compared with in normal tissues because the SMD>0 and 0 were not
included in the 95% CI (Fig. 4A).
The heterogeneity test was applied, and the outcome demonstrated
that the analysis was heterogeneous via the random effects model
(Pheterogeneity<0.0001; I2=88.4%; Fig. 4A). The sensitivity analysis was then
conducted (Fig. 4B). After removing
five microarrays (GSE25099, GSE30784, GSE31056, GSE37991 and
GSE55550), the SMD was 1.46 (95% CI, 1.21–1.69); no significant
heterogeneity was found (the fixed effects model:
Pheterogeneity=0.362; I2=8.0%; Fig. 4C). According to the funnel plot and
the results of Begg's test (P=0.608; Fig. 4D), no publication bias was observed.
Thus, the mRNA expression of APOL1 in OSCC tissues was higher than
in normal tissues, which was consistent with the protein level.
To reveal the capacity of the APOL1 expression to
diagnose patients with OSCC, the sROC was used to analyze the AUC
and 95% CI. As Fig. 5A shows, the
AUC of APOL1 was 0.93 (95% CI, 0.79–0.90). The pre-test
probability, post-test probability positive and post-test
probability negative were 20, 63 and 4%, respectively (Fig. 5B), with a sensitivity of 0.85 (95%
CI, 0.79–0.90) and a specificity of 0.88 (95% CI, 0.81–0.92)
(Fig. 5C and D, respectively).
Hence, the results indicated that the upregulation of APOL1 mRNA
has potential as a marker for differentiating OSCC from
non-cancerous oral epithelium.
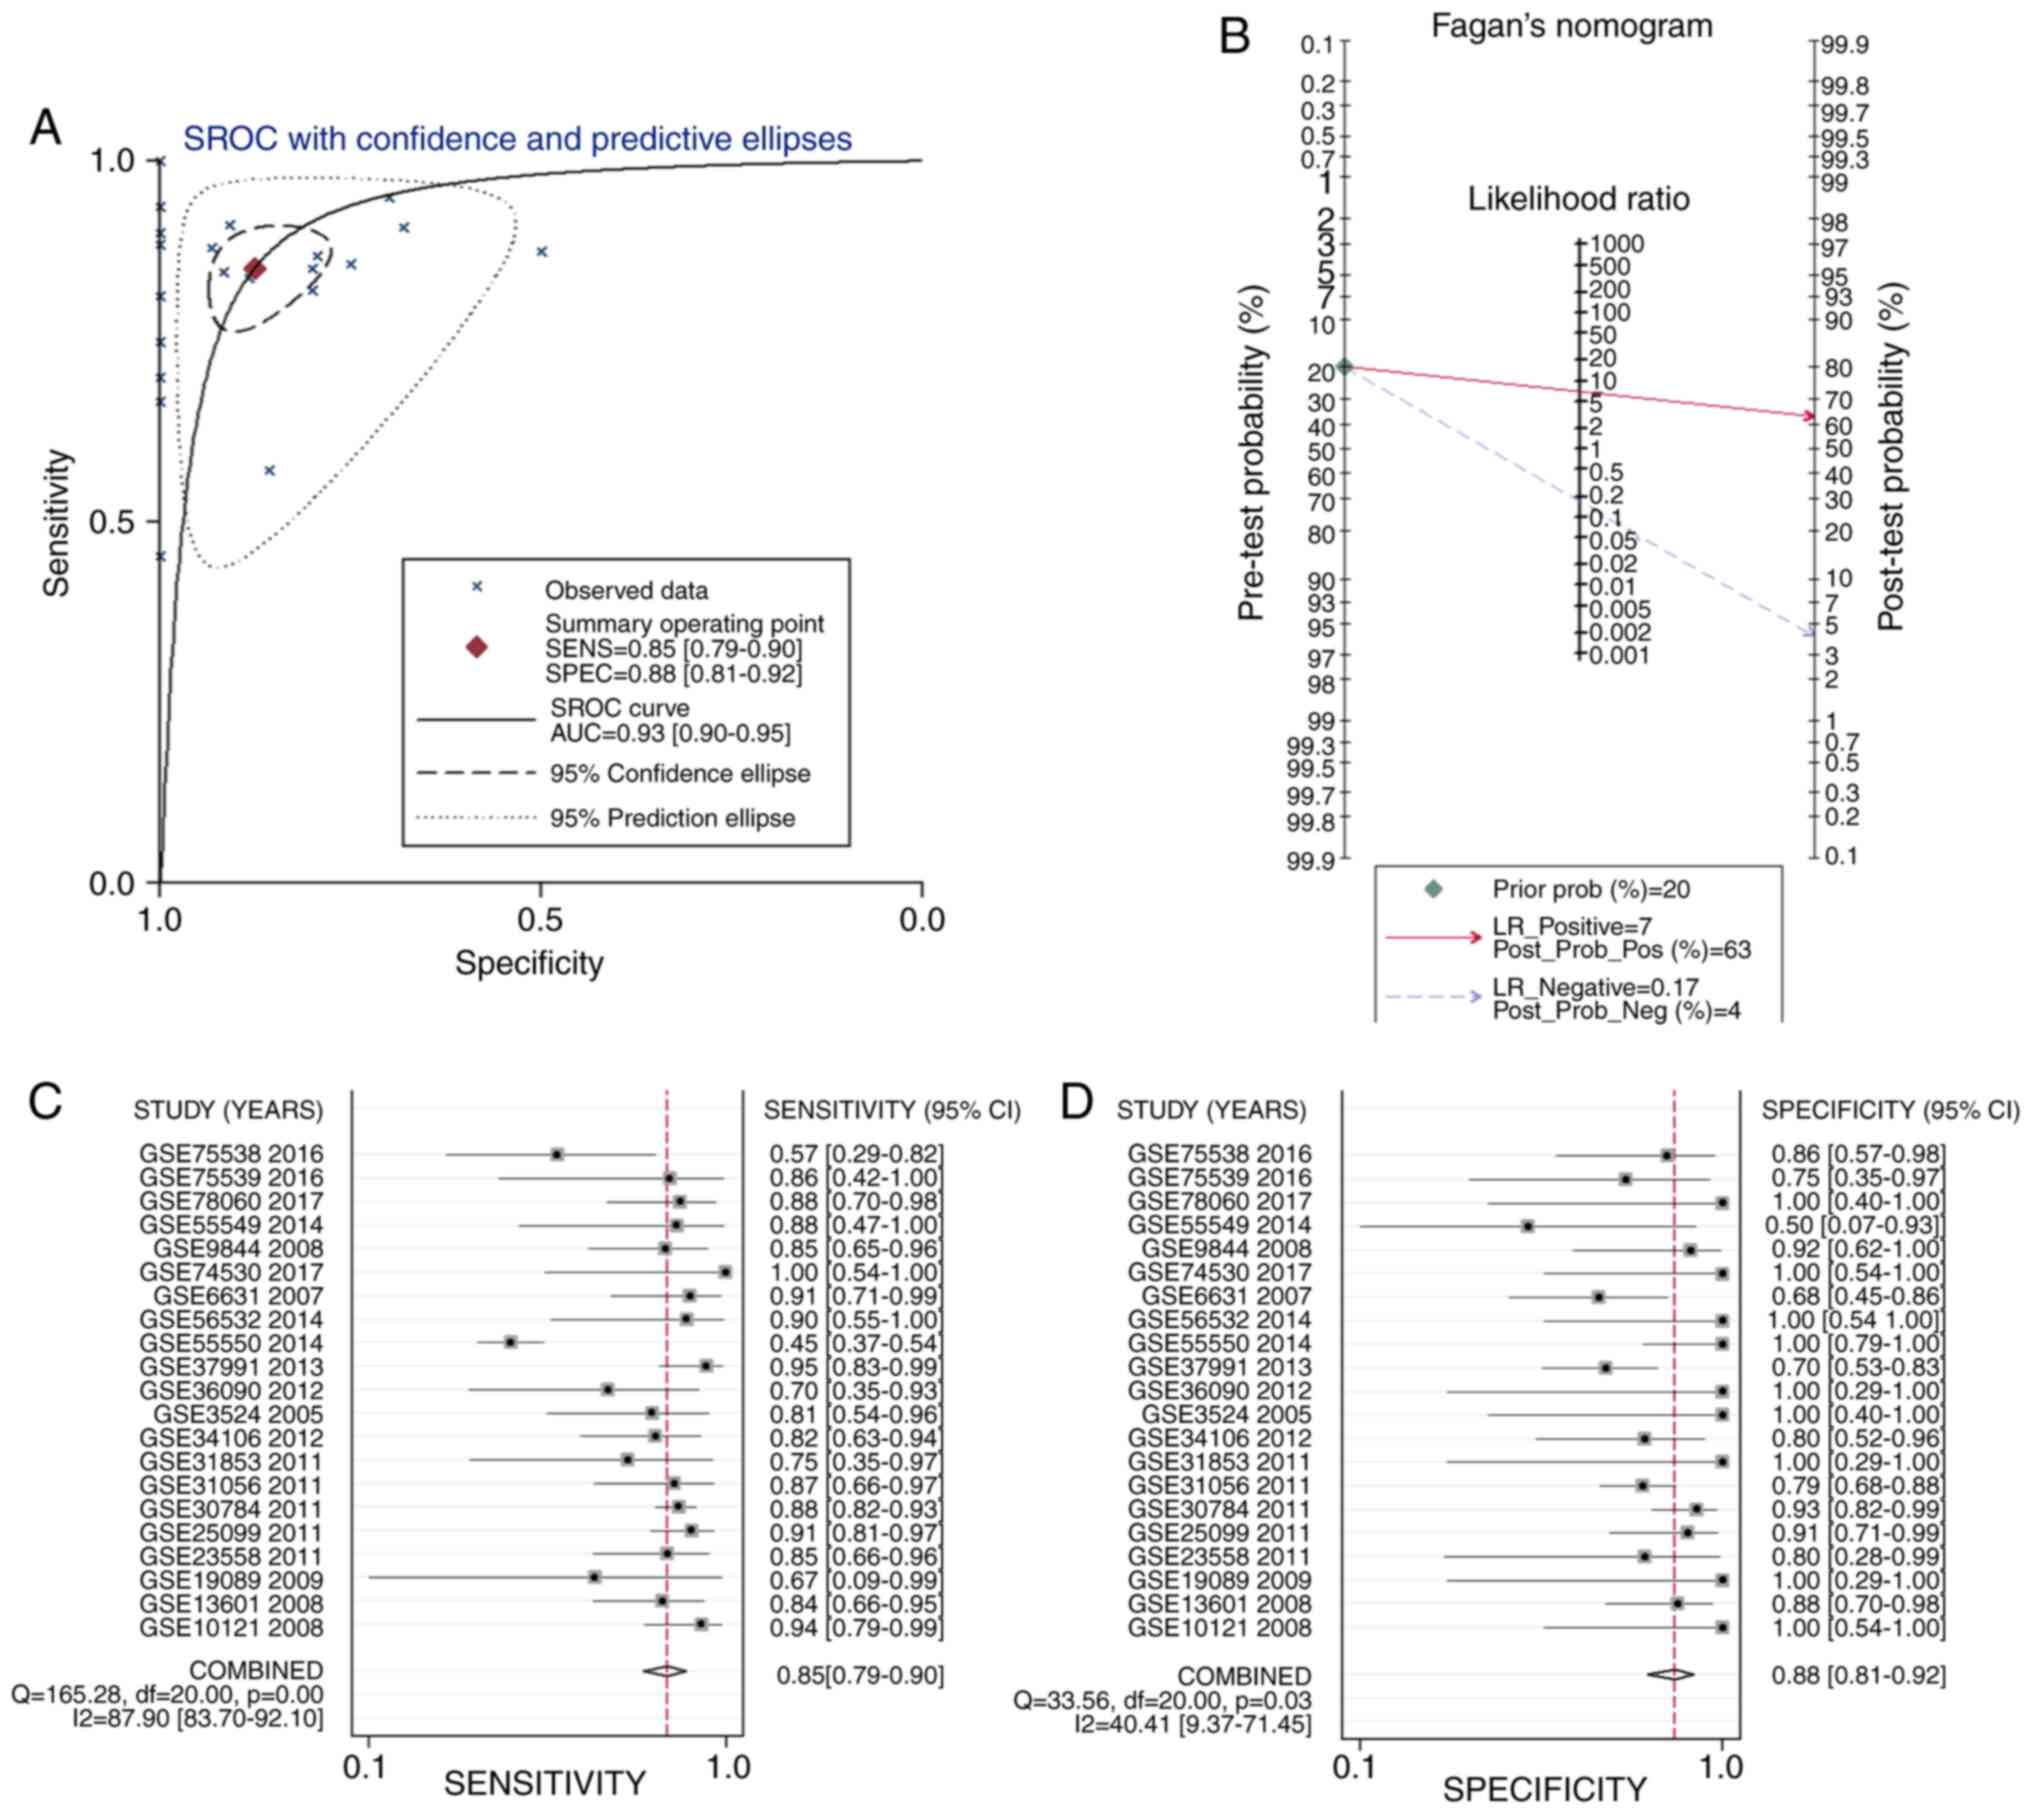 | Figure 5.Analysis of the mRNA expression of
APOL1 in OSCC. (A) sROC analysis of APOL1 for discriminating OSCC
from normal tissues based on GEO datasets. (B) Prior probability
and post-probability positive and negative of the included studies.
The prior probability, post probability positive and negative
reached 20, 63 and 4%, respectively. (C and D) Sensitivity and
specificity values of the included studies. The sensitivity and
specificity values of the included studies were 0.85 (95% CI,
0.79–0.90) and 0.88 (95% CI, 0.81-.92), respectively. Oral squamous
cell carcinoma (OSCC). APOL1, apolipoprotein L1; sROC, Summary
receiver operating characteristic; LR, likelihood ratio; GEO, Gene
Expression Omnibus; OSCC, oral squamous cell carcinoma; CI,
confidence interval. |
Association between APOL1 protein
expression and the clinicopathologic parameters of LSCC
A total of 49 cases of LSCC tissues and 5 cases of
normal laryngeal tissues were collected in-house. Of the 49 LSCC
tissues collected, 45 were positive for APOL1, accounting for 91.8%
(Table III). Meanwhile, all normal
laryngeal tissues showed a low expression. Statistical calculation
revealed that APOL1 levels were higher in LSCC tissues compared
with normal tissues (P<0.0001; Table III). The association between APOL1
expression levels and clinicopathological parameters were analyzed
but no significant relationships were observed (Table III). So, the expression of APOL1
protein was increased in LSCC tissues as compared to non-cancerous
controls.
| Table III.Clinicopathological parameters and
APOL1 expression of 49 patients with LSCC. |
Table III.
Clinicopathological parameters and
APOL1 expression of 49 patients with LSCC.
|
| APOL1 expression,
n |
|
|---|
|
|
|
|
|---|
| Clinicopathological
parameter | High | Low | P-value |
|---|
| Cancerous cases vs.
non-cancerous cases |
|
Cancerous cases | 45 | 4 | <0.0001 |
|
Non-cancerous cases | 0 | 5 |
|
| Sex |
|
Male | 44 | 4 | 0.9180 |
|
Female | 1 | 0 |
|
| Age, years |
|
≥60 | 20 | 0 | 0.1350 |
|
<60 | 25 | 4 |
|
| Grade |
|
1–2 | 29 | 4 | 0.1930 |
|
3–4 | 16 | 0 |
|
| Stage |
|
I–II | 15 | 0 | 0.2190 |
|
III–IV | 30 | 4 |
|
| Pathological T |
|
T1-T2 | 28 | 0 | 0.0600 |
|
T3-T4 | 16 | 3 |
|
| Pathological N |
| N0 | 22 | 0 | 0.0830 |
| N1 | 23 | 4 |
|
| Pathological M |
|
| – |
| M0 | 45 | 4 |
|
| M1 | 0 | 0 |
|
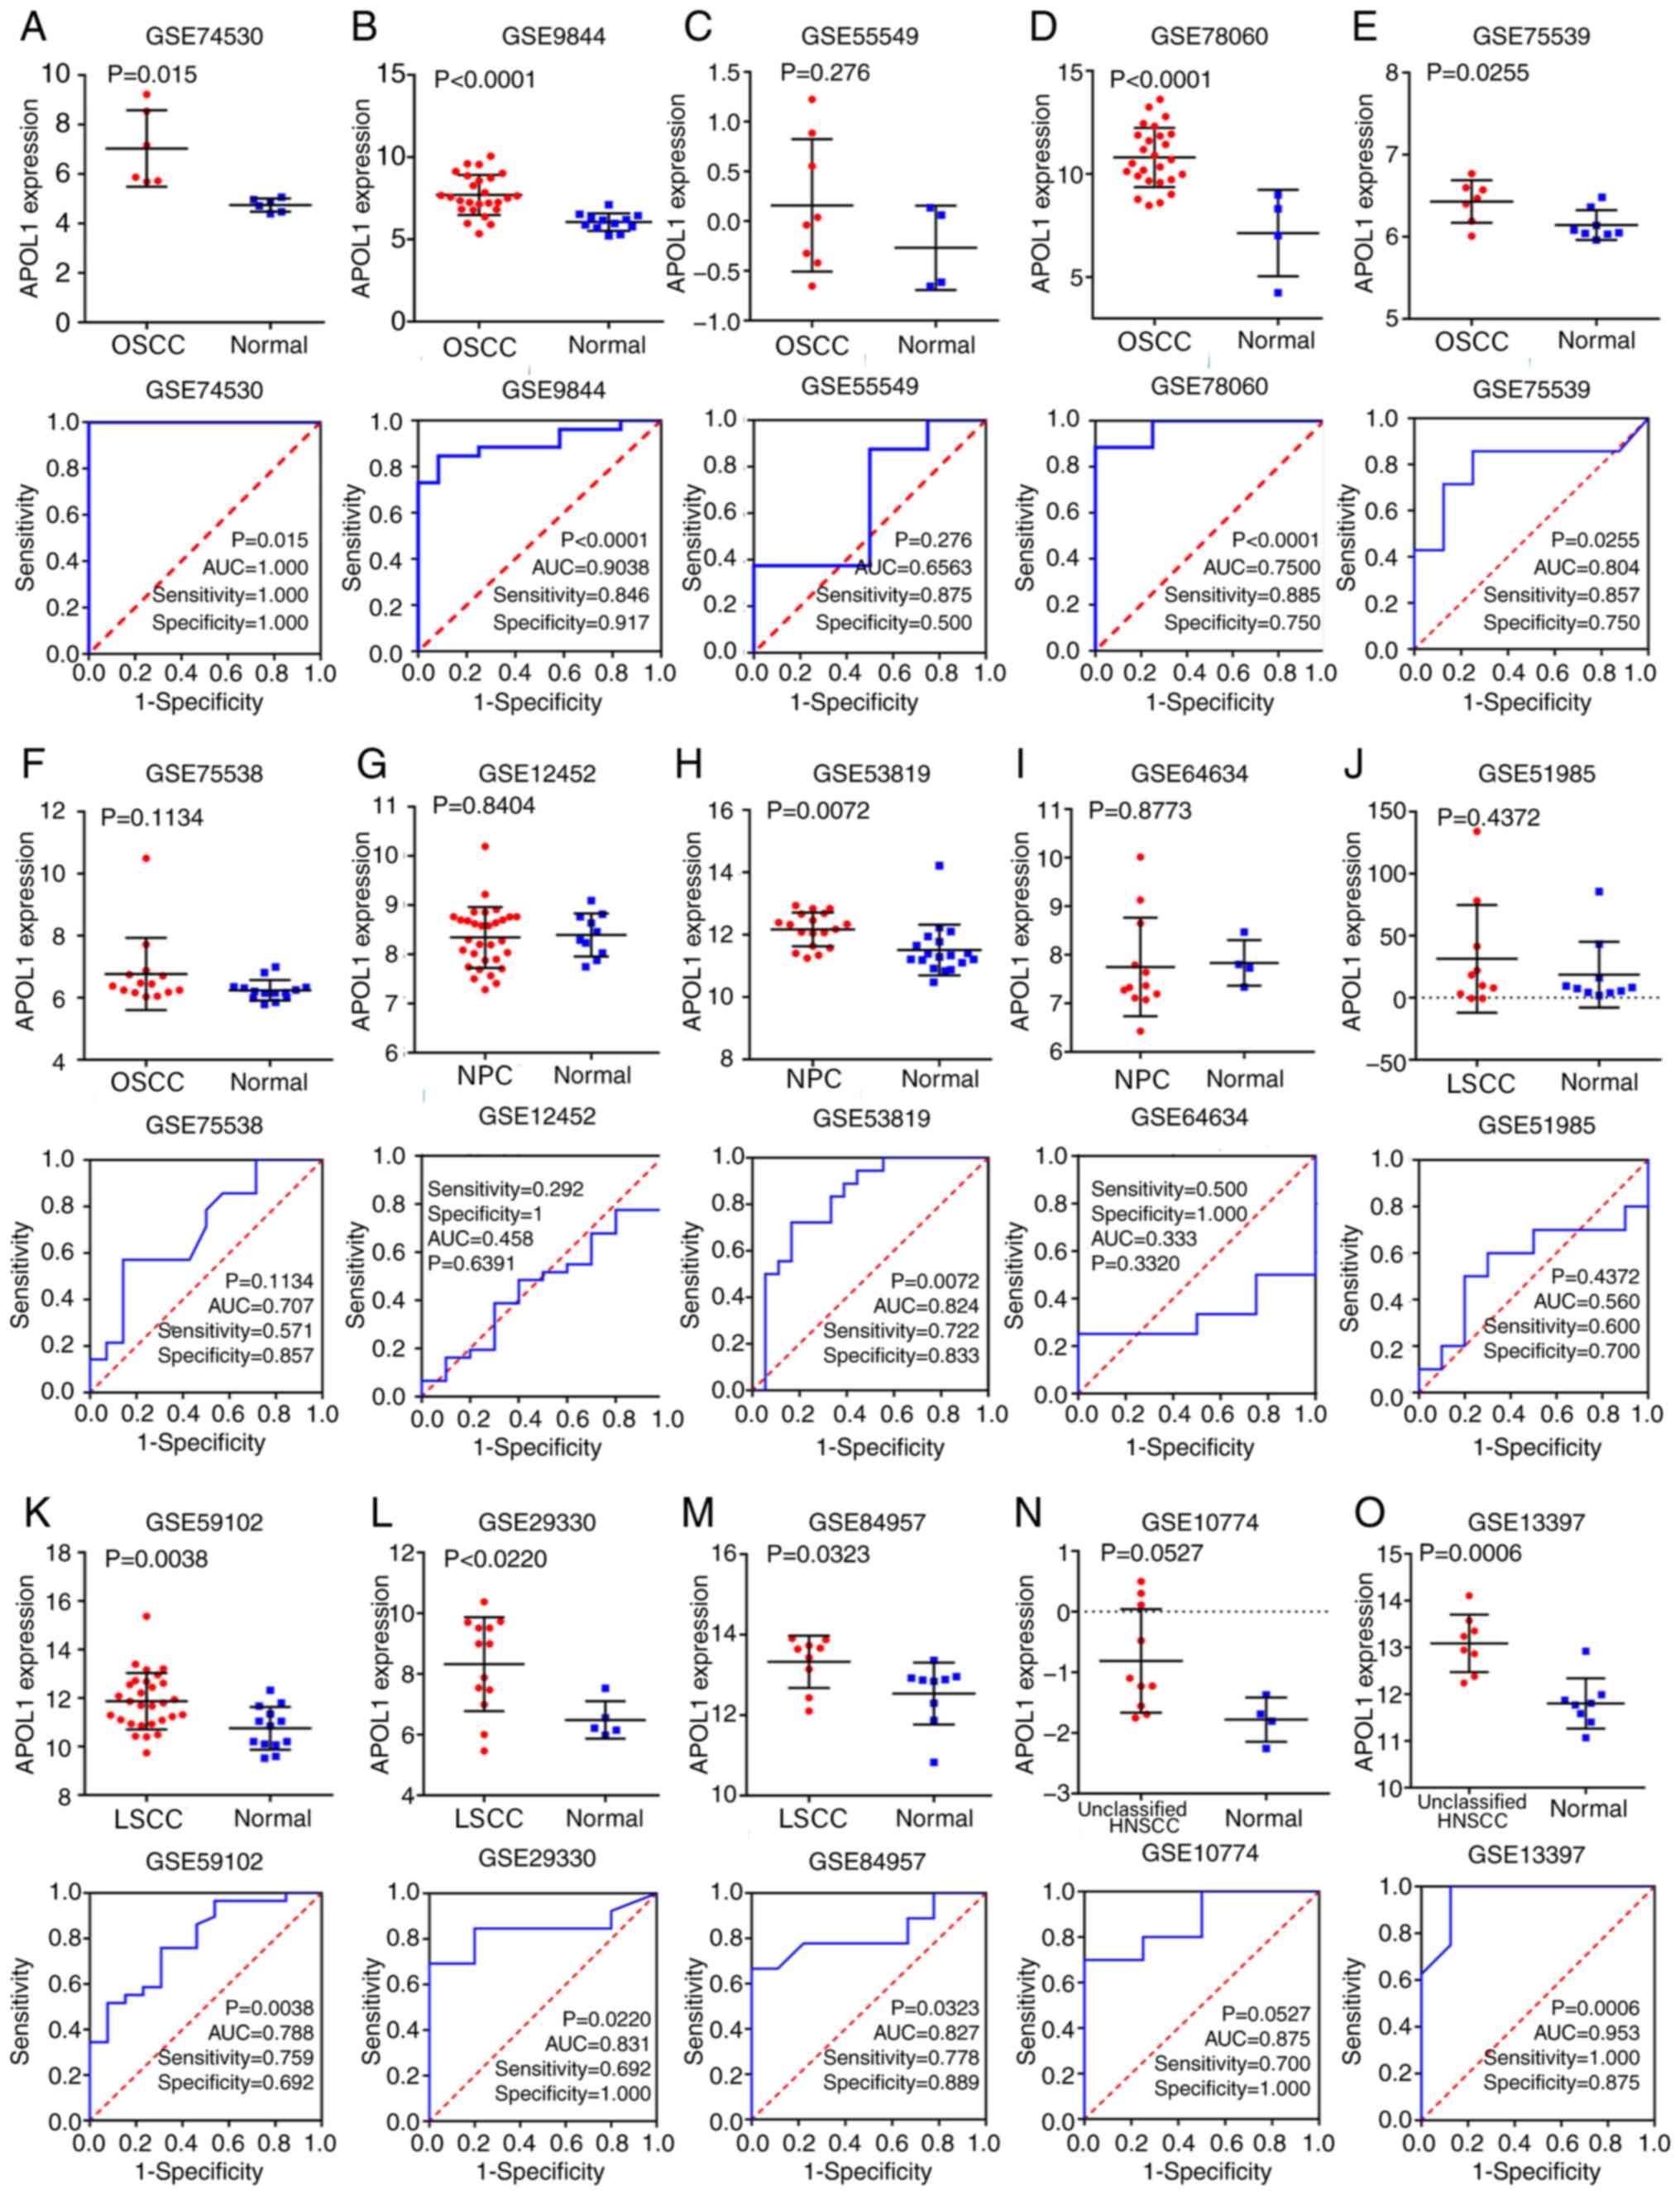
Analysis of mRNA expression of APOL1
in LSCC
Through deep mining the GEO, TCGA and ArrayExpress,
finally the number of microarrays of APOL1 expression in
LSCC and normal tissues was four (Table
I). All of them showed that APOL1 expression was higher in LSCC
tissues compared with in normal tissues (Fig. 3J-M). Besides, three out of four
microarrays of LSCC showed that the differences were significant
according to Table I. The SMD was
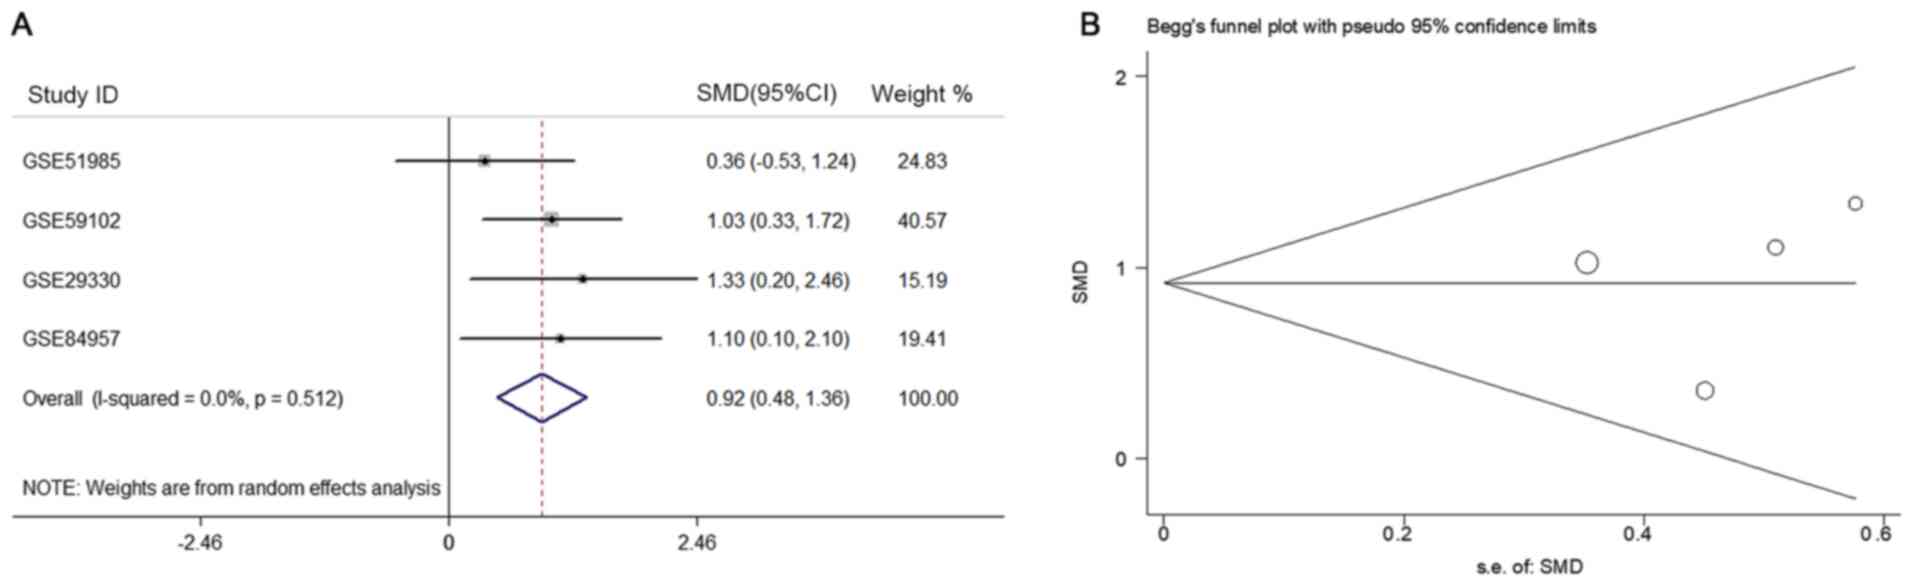
0.92 (95% CI, 0.48–1.36) (Fig. 6A).
As there was no obvious heterogeneity
(Pheterogeneity=0.512; I2=0.0%, Fig. 6A), the fixed effects model was used.
Similarly, according to the funnel plot and the results of Begg's
test (P=0.308, Fig. 6B), no
publication bias was observed for the analysis of APOL1
expression.
In addition, as shown in Fig. 7A, APOL1 had a notable
discriminatory capability for LSCC due to the AUC of the APOL1
upregulation being 0.82 (95% CI, 0.78–0.85). The pre-test
probability, post-test probability positive, and post-test
probability negative were 20, 45 and 8%, respectively (Fig. 7B), with the sensitivity being 0.72
(95% CI, 0.60–0.82) and the specificity 0.78 (95% CI, 0.62–0.89)
(Fig. 7C and D, respectively). So it
was shown that the mRNA expression of APOL1 in LSCC tissues was
higher than in normal tissues, which was in line with the APOL1
protein level.
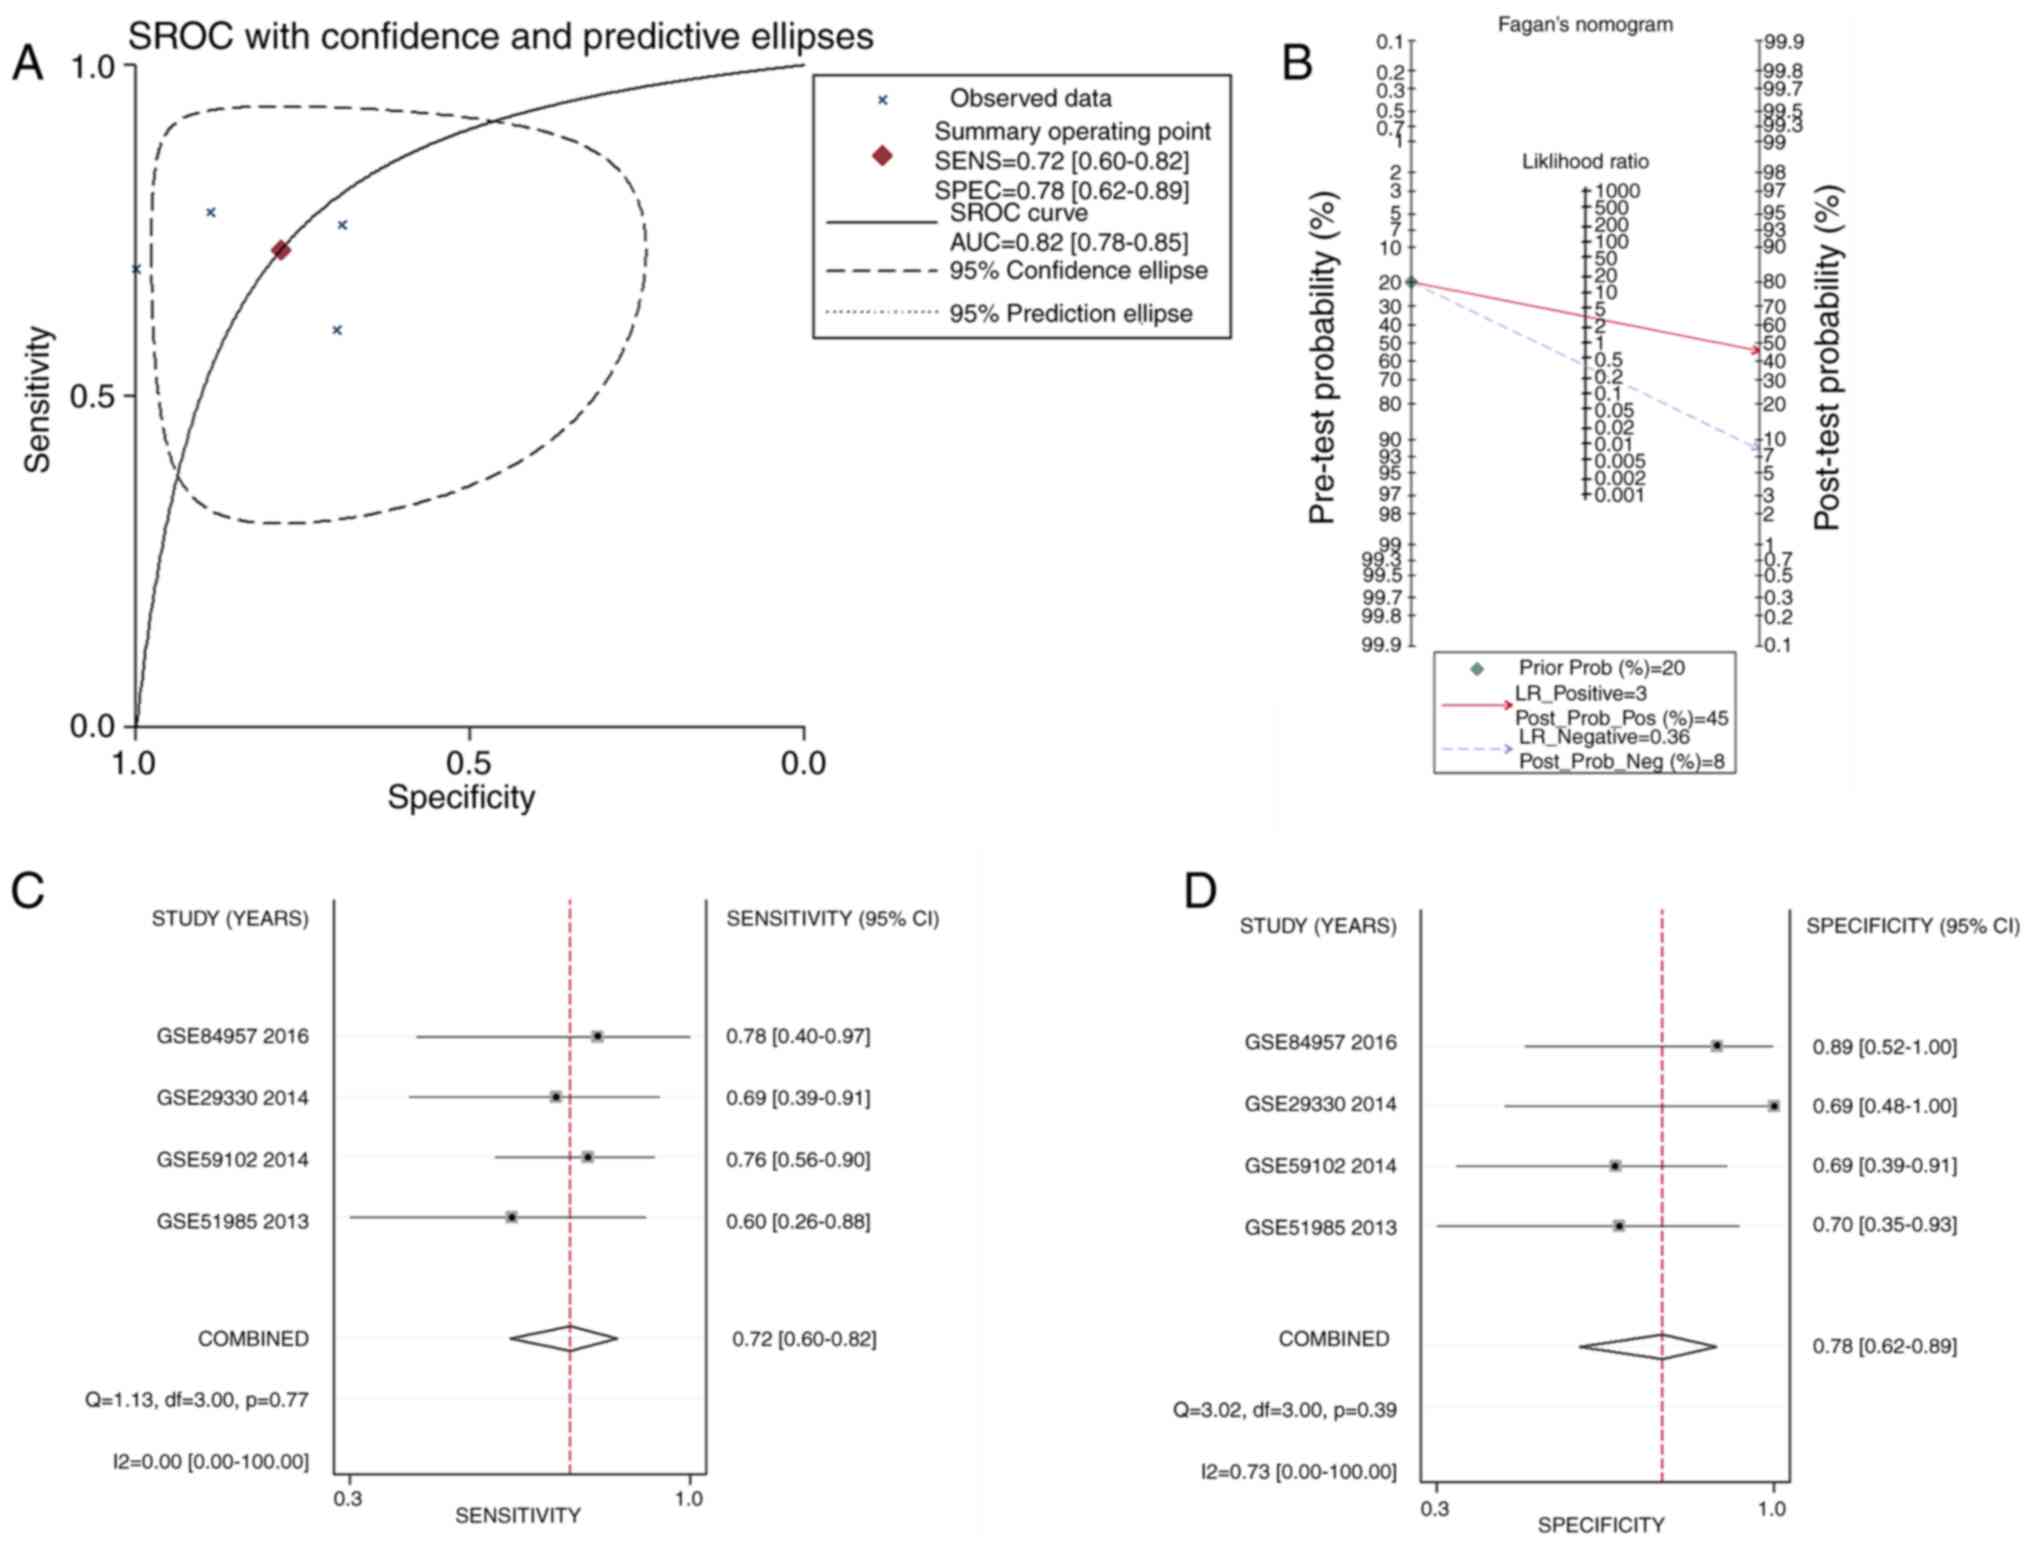 | Figure 7.sROC curves analysis of APOL1 for
discriminating LSCC from normal tissues, prior probability
post-probability, positive and negative of the included studies and
sensitivity and specificity values. (A) The sROC analysis of APOL1
for discriminating LSCC from normal tissues based on GEO datasets.
(B) Prior probability and post-probability positive and negative of
the included studies. The prior probability, post probability
positive and negative reached 20, 45 and 8%, respectively. (C and
D) Sensitivity and specificity values of the included studies. The
sensitivity and specificity values of the included studies were
0.72 (95% CI, 0.60–0.82) and 0.78 (95% CI, 0.62–0.89),
respectively. APOL1, apolipoprotein L1; GEO, Gene Expression
Omnibus; LSCC, laryngeal squamous cell carcinoma; sROC, summary
receiver operating characteristic; LR, likelihood ratio; CI,
confidence interval. |
APOL1 protein level in HNSCC
Overall, the present study analyzed 221 cases of
HNSCC (including OSCC, LSCC, NPC and some HNSCC without specified
sites) and 24 cases of normal head and neck tissues in-house. So,
the entire HNSCC group included the OSCC, LSCC, and non-classified
HNSCC groups, which was analyzed as a whole in order to observe the
association between the APOL1 and the entire HNSCC tissues in
present study. The IHC results and the information of the patients
in-house were also evaluated. Of the 221 cases, APOL1 was highly
expressed in 126 (57%), whereas levels of APOL1 in the normal
tissues showed lower expression. The Fisher's exact test showed
that the proportion of APOL1 in tumor tissues was significantly
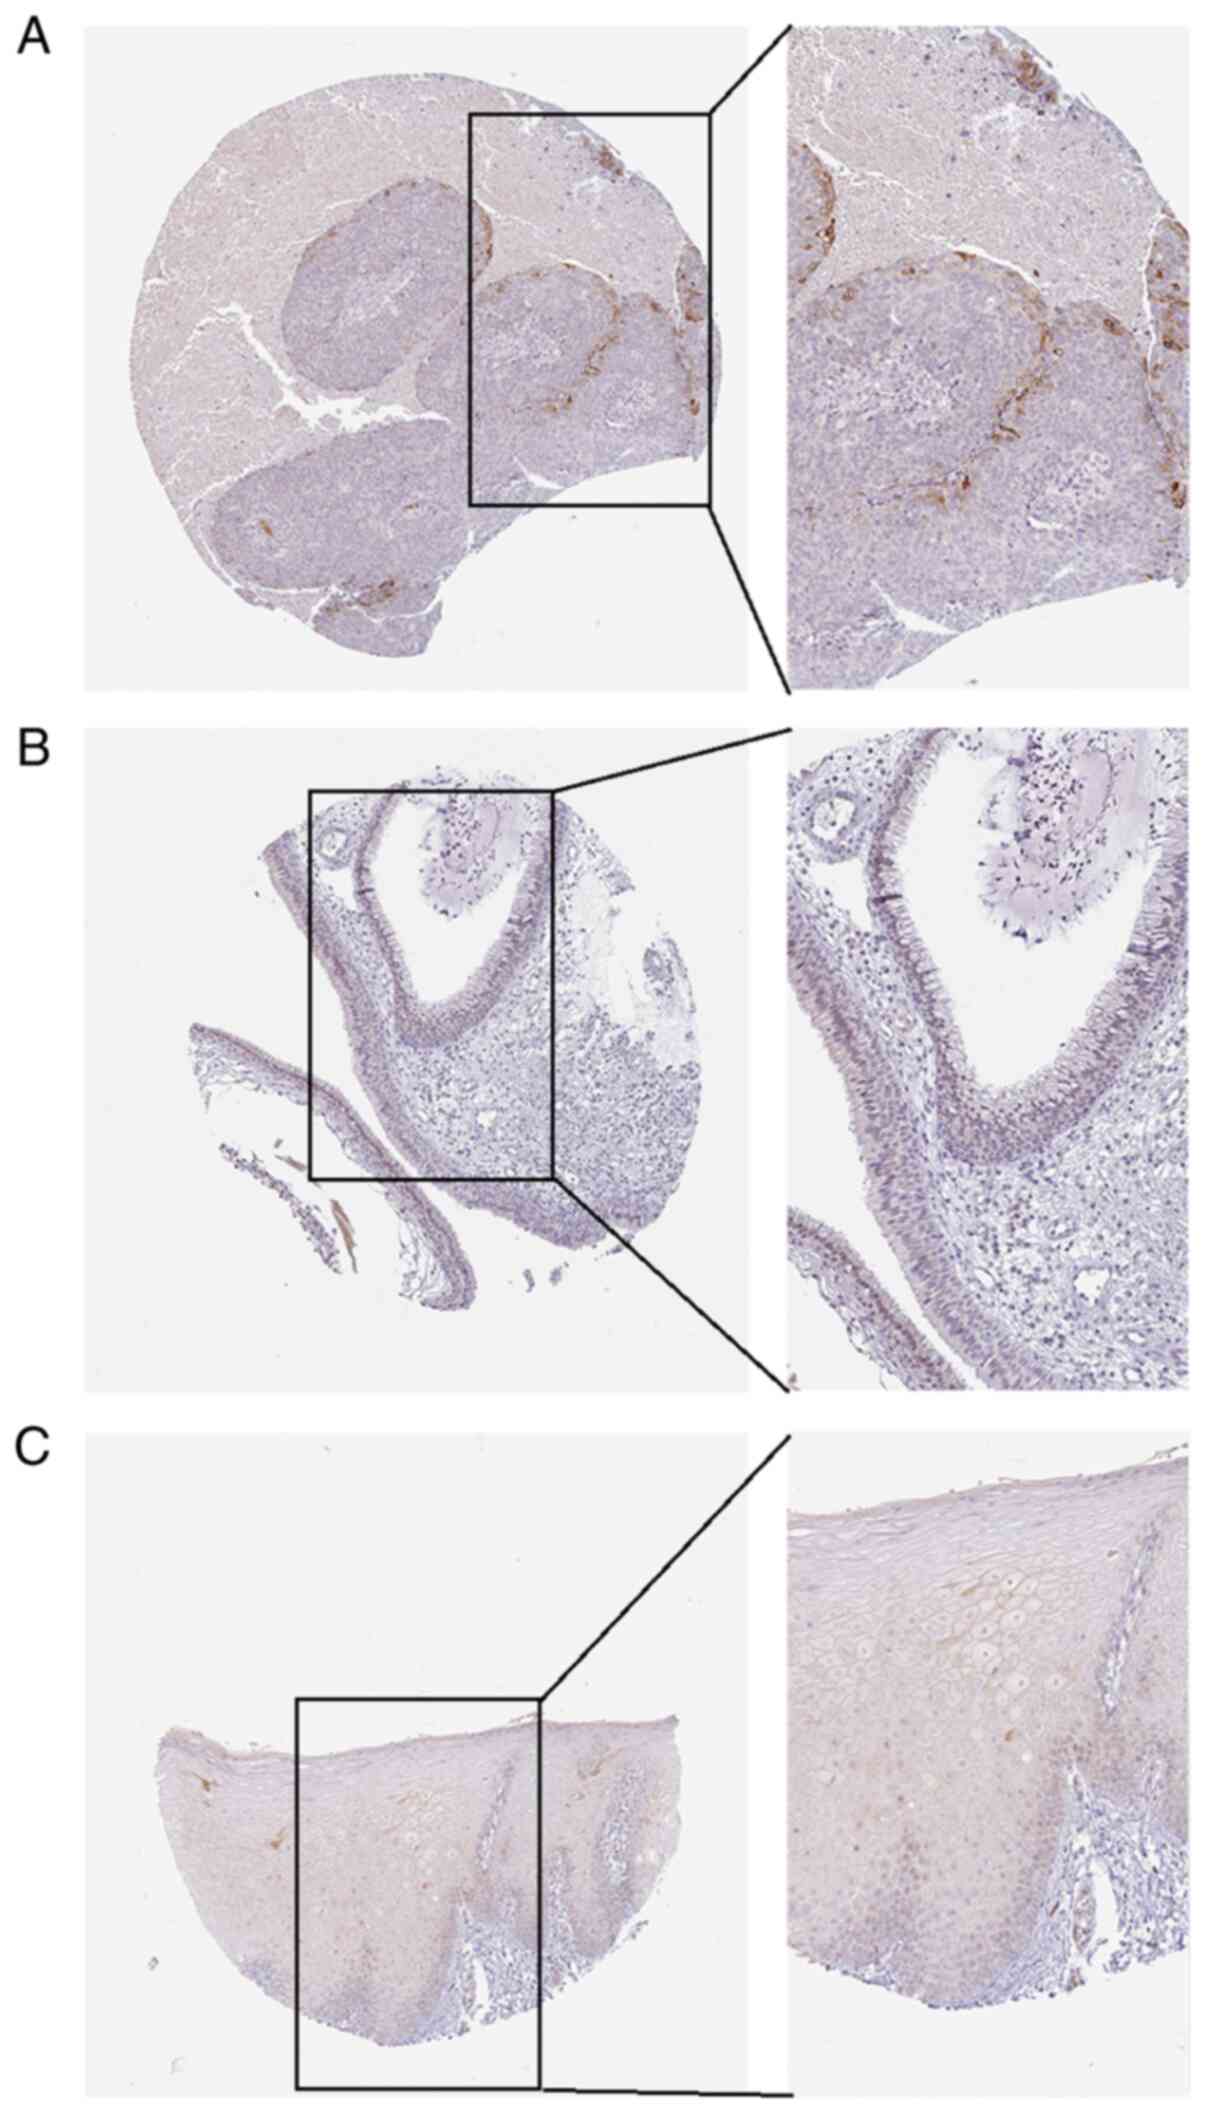
higher compared with in non-cancer tissues (P<0.0001; Table IV). The HPA database was used to
verify the expression of APOL1 (Fig.
8A-C). After analyzing the association between APOL1 expression
and the clinical parameters, it was reported that there was a
significant difference in terms of sex (P=0.004), tumor
pathological grade (P<0.0001) and pathological T stage (P=0.019)
(Table IV). So the APOL1 protein
level was generally upregulated in HNSCC tissues than normal
tissues.
| Table IV.The clinicopathological parameters
and APOL1 expression of 221 patients with HNSCC. |
Table IV.
The clinicopathological parameters
and APOL1 expression of 221 patients with HNSCC.
|
| APOL1 expression,
n |
|
|---|
|
|
|
|
|---|
| Clinicopathological
parameter | High | Low | P-value |
|---|
| Cancerous cases vs.
non-cancerous cases |
|
Cancerous cases | 126 | 95 | <0.0001 |
|
Non-cancerous cases | 0 | 24 |
|
| Sex |
|
Male | 114 | 70 | 0.0040 |
|
Female | 12 | 25 |
|
| Age, years |
|
≥60 | 54 | 38 | 0.6850 |
|
<60 | 72 | 57 |
|
| Grade |
|
1–2 | 89 | 79 | <0.0001 |
|
3–4 | 39 | 14 |
|
| Stage |
|
I–II | 50 | 39 | 0.0870 |
|
III–IV | 76 | 54 |
|
| Pathological T |
|
T1-T2 | 85 | 66 | 0.0190 |
|
T3-T4 | 41 | 27 |
|
| Pathological N |
| N0 | 69 | 54 | 0.7630 |
| N1 | 57 | 39 |
|
| Pathological M |
|
| 0.4270 |
| M0 | 126 | 93 |
|
| M1 | 0 | 0 |
|
Clinical significance of APOL1 mRNA
expression in HNSCC
In the present study, a total of 39 microarrays and
RNA-seq data regarding HNSCC and normal tissues were analyzed.
Among them, 21 OSCC and four LSCC microarrays were used for
subgroup analysis as aforementioned. Three of the remaining
microarrays were nasopharyngeal carcinoma (NPC), the pathogenesis
of which is different from that of other HNSCCs (38), and 11 were not classified any of the
HNSCC subgroups according to the TCGA, GEO and ArrayExpress
databases; thus, these were grouped into the overall HNSCC group.
The 39 studies are listed in Table
I. Of the three microarrays of APOL1 expression profiling in
NPC tissues, one NPC microarray showed that the difference was
significant (P=0.007) according to the Table I. And combining all of the
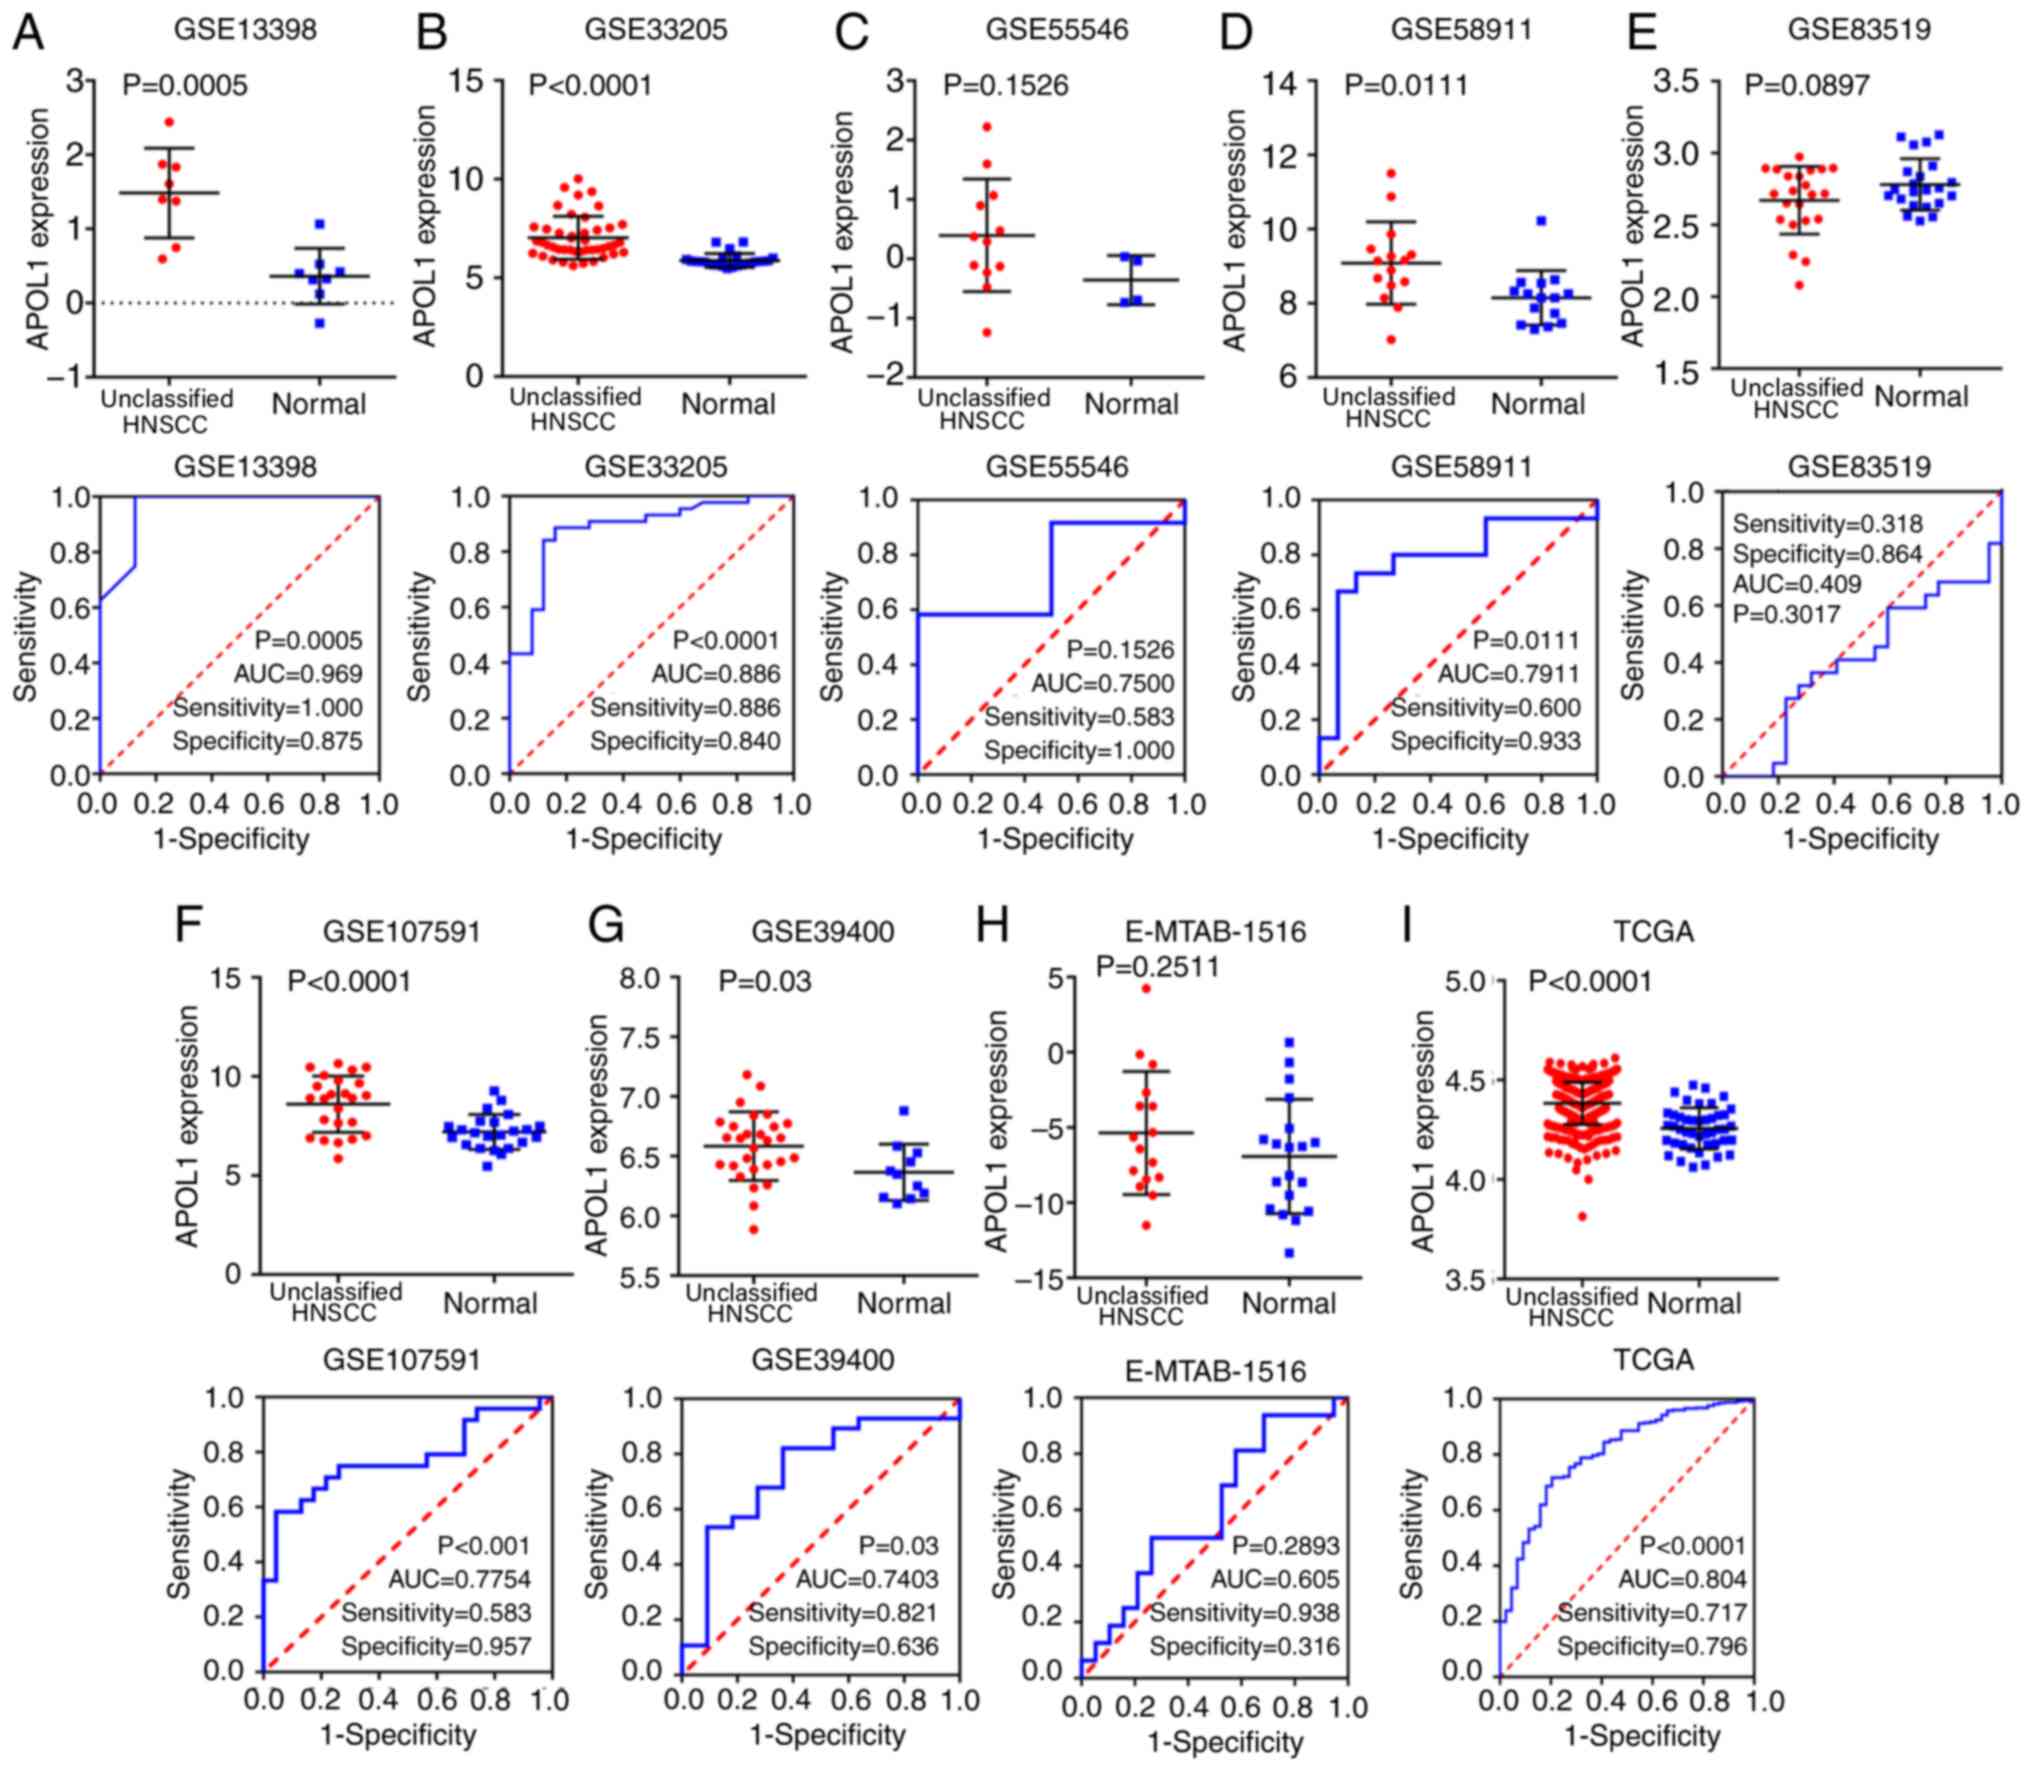
aforementioned studies, it was reported that, in the 39
microarrays, the expression of APOL1 in HNSCC tissues was higher
compared with that in non-cancerous tissues (Figs. 2, 3
and 9). This difference was
statistically significant in 29 out of 39 microarrays (P<0.05;
Table I). However, in the remaining
10 microarrays (GSE19089, GSE55549, GSE75538, GSE12452, GSE64634,
GSE51985, GSE55546, GSE83519, GSE36090 and E-MTAB-1516), there was
no statistical significance in the APOL1 expression between the
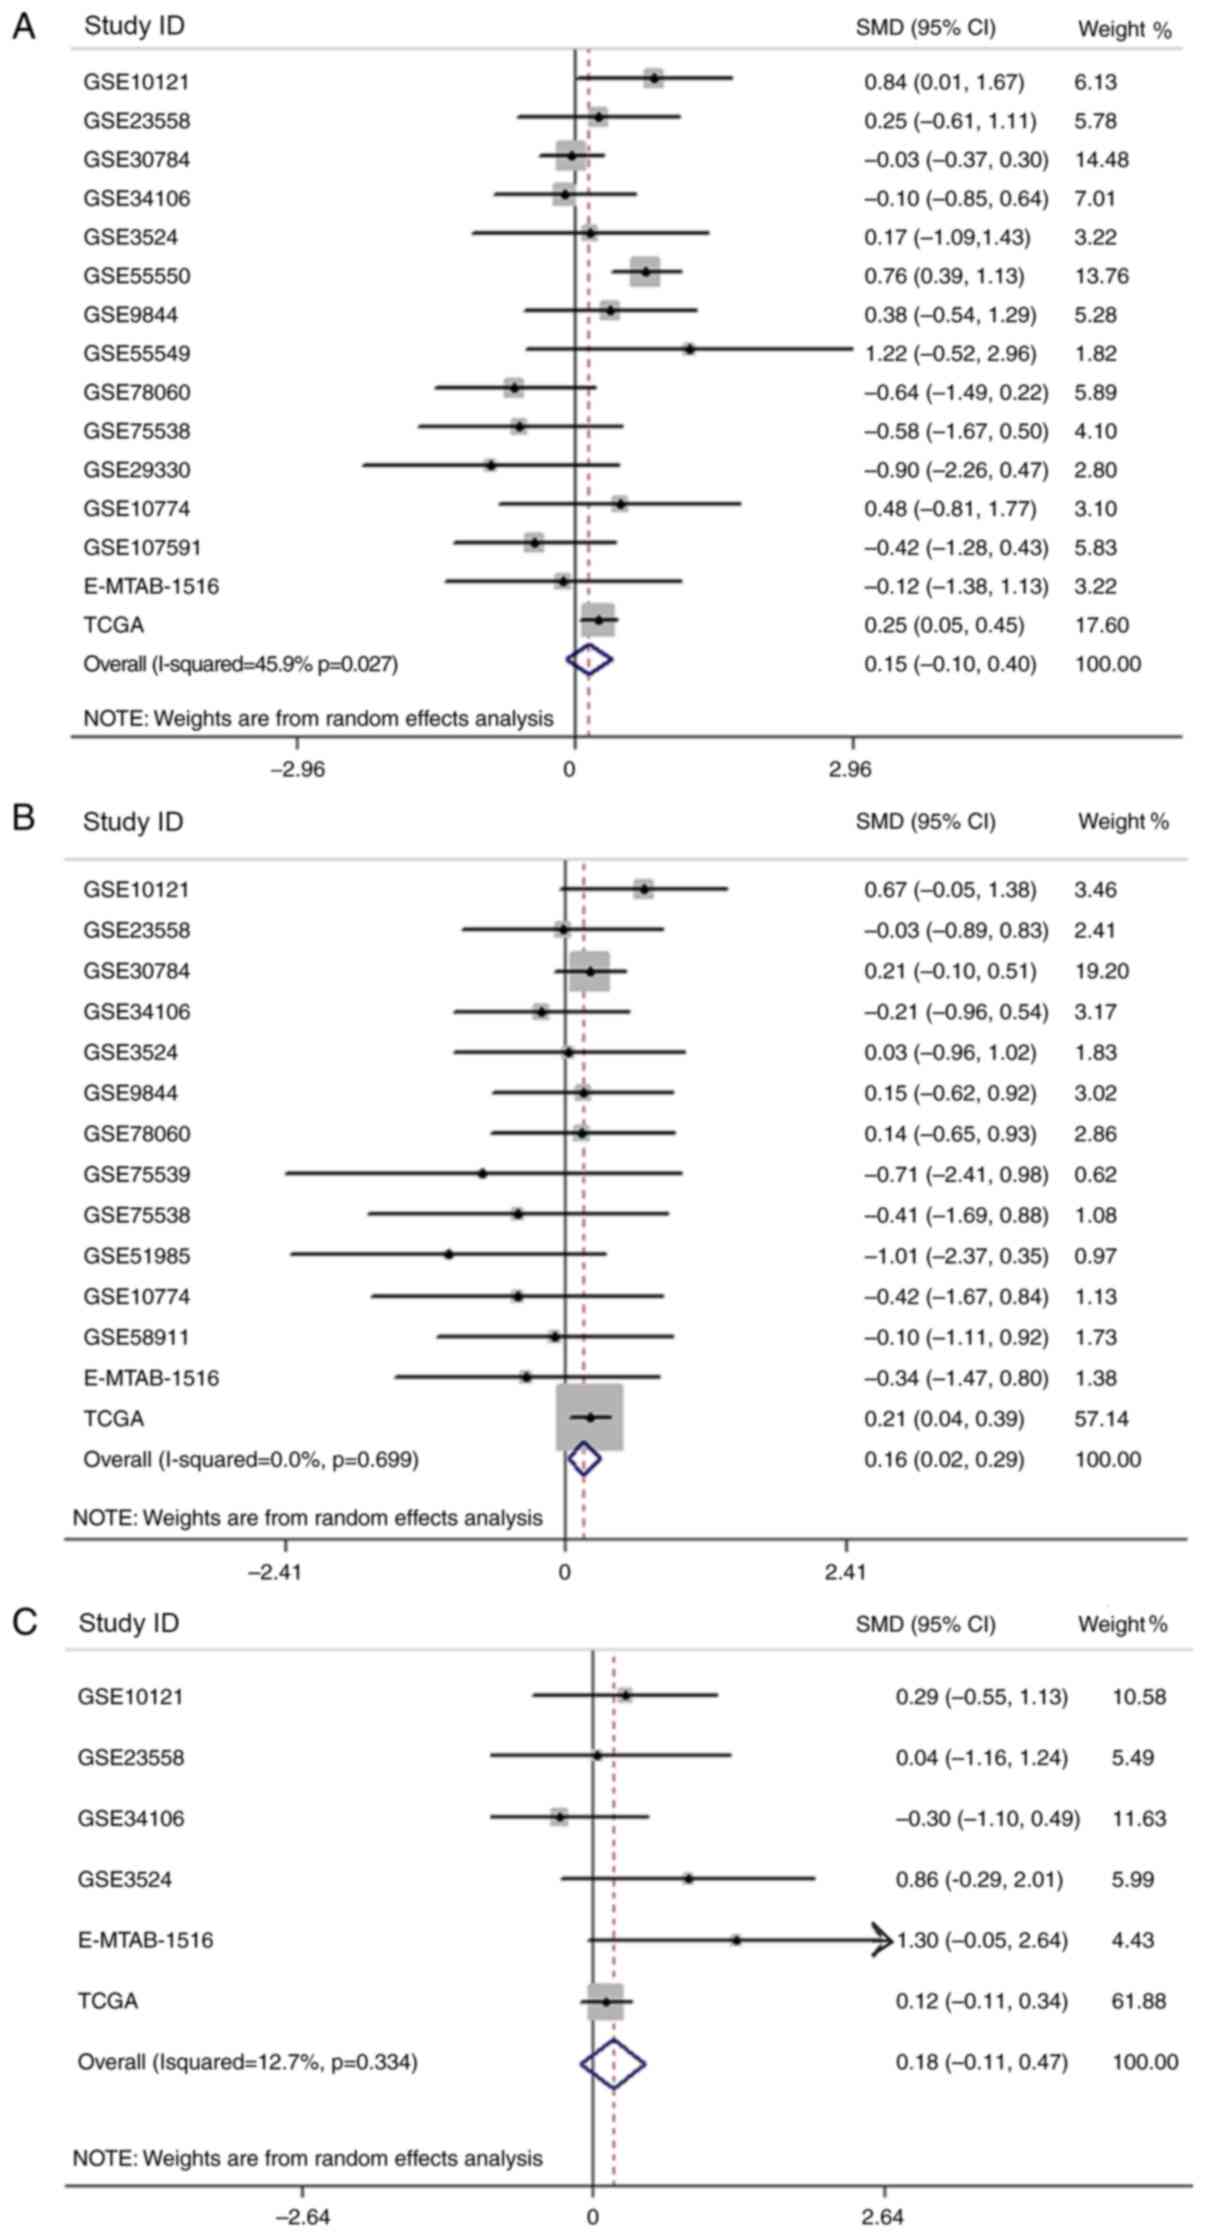
HNSCC and normal tissues. The SMD was 1.14 (95% CI, 0.83–1.44)
(Fig. 10A), which confirmed that
APOL1 expression was higher in HNSCC tissues compared with the
corresponding control group. The heterogeneity test was applied,
and the outcome demonstrated that the analysis was heterogeneous
using the random effects model
(Pheterogeneity<0.0001; I2=83.7%; Fig. 10A). The sensitivity analysis was
then conducted (Fig. 10B). To
determine the datasets with heterogeneity, the 10 microarrays
(GSE25099, GSE30784, GSE31056, GSE37991, GSE55550, GSE12452,
GSE64634, GSE83519, E-MTAB-1516 and all TCGA datasets) were
removed. After the removal of 10 microarrays, which had the
potential to produce heterogeneity, the SMD was 1.28 (95% CI,
1.10–1.45) and we found no obvious heterogeneity among them (the
fixed effects model: Pheterogeneity=0.317;
I2=9.7%; Fig. 10C).
According to the funnel plot, the results of Begg's test (P=0.468,
Fig. 10D), no publication bias was
identified. So it was consistently shown that the expression of
APOL1 mRNA in the HNSCC was higher than in the normal tissues.
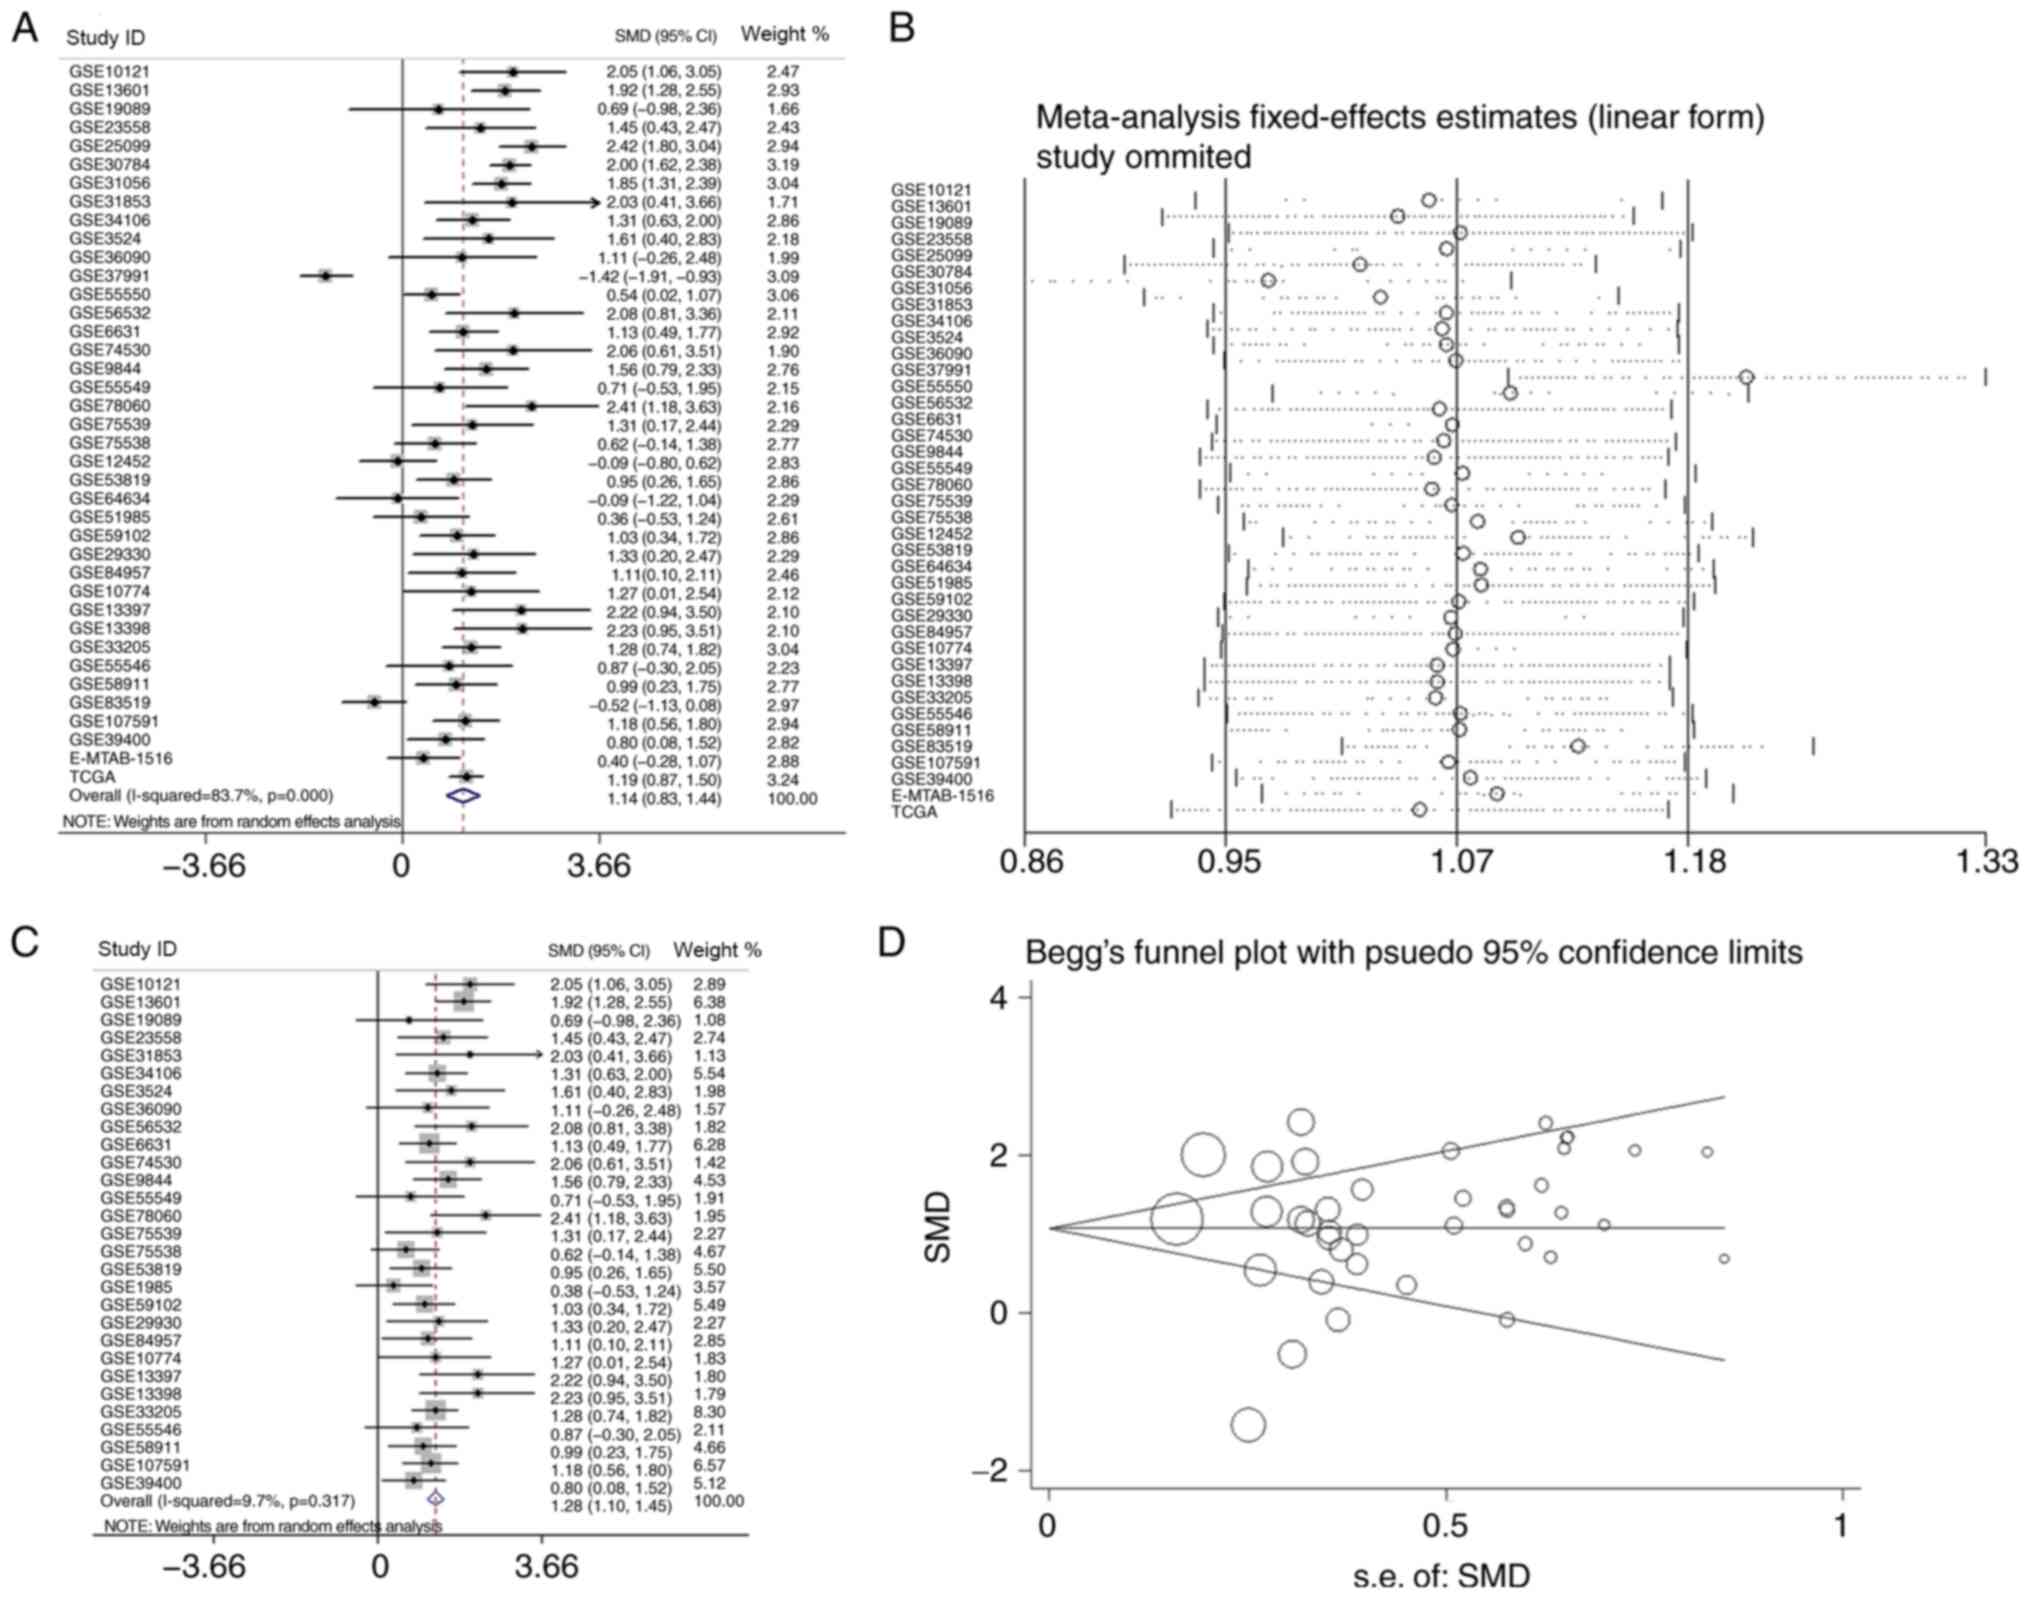 | Figure 10.The analysis of the mRNA expression
of APOL1 in HNSCC. (A) Forest plots of studies evaluating standard
mean difference of APOL1 between HNSCC and non-tumor group. (B)
Sensitivity analysis of the expression level of APOL1 in HNSCC and
non-tumor group. (C) Forest plots of APOL1 expression between HNSCC
and non-tumor group after removing the following studies: GSE25099,
GSE30784, GSE31056, GSE37991, GSE55550, GSE12452, GSE64634,
GSE83519, E-MTAB-1516 and TCGA. (D) Funnel plot for publication
bias test after analysis of the expression level of APOL1 in HNSCC,
The size represented by the Begg's plot circle is the weight of
each data concentration. HNSCC, head and neck squamous cell
carcinoma; APOL1, apolipoprotein L1; SMD, standardized mean
difference; CI, confidence interval. |
sROC was used to analyze the value of APOL1
overexpression regarding the diagnostic potential of HNSCC (AUC,
0.90; 95% CI, 0.87–0.93; Fig. 11A).
The pre-test probability, post-test probability positive and
post-test probability negative were 20, 60 and 6%, respectively
(Fig. 11B), with a sensitivity of
0.79 (95% CI, 0.73–0.84) and a specificity of 0.87 (95% CI,
0.81–0.91) (Fig. 11C and D,
respectively), thereby indicating the notable discriminatory
capability of high APOL1 level for differentiating HNSCC from
non-cancerous lesions.
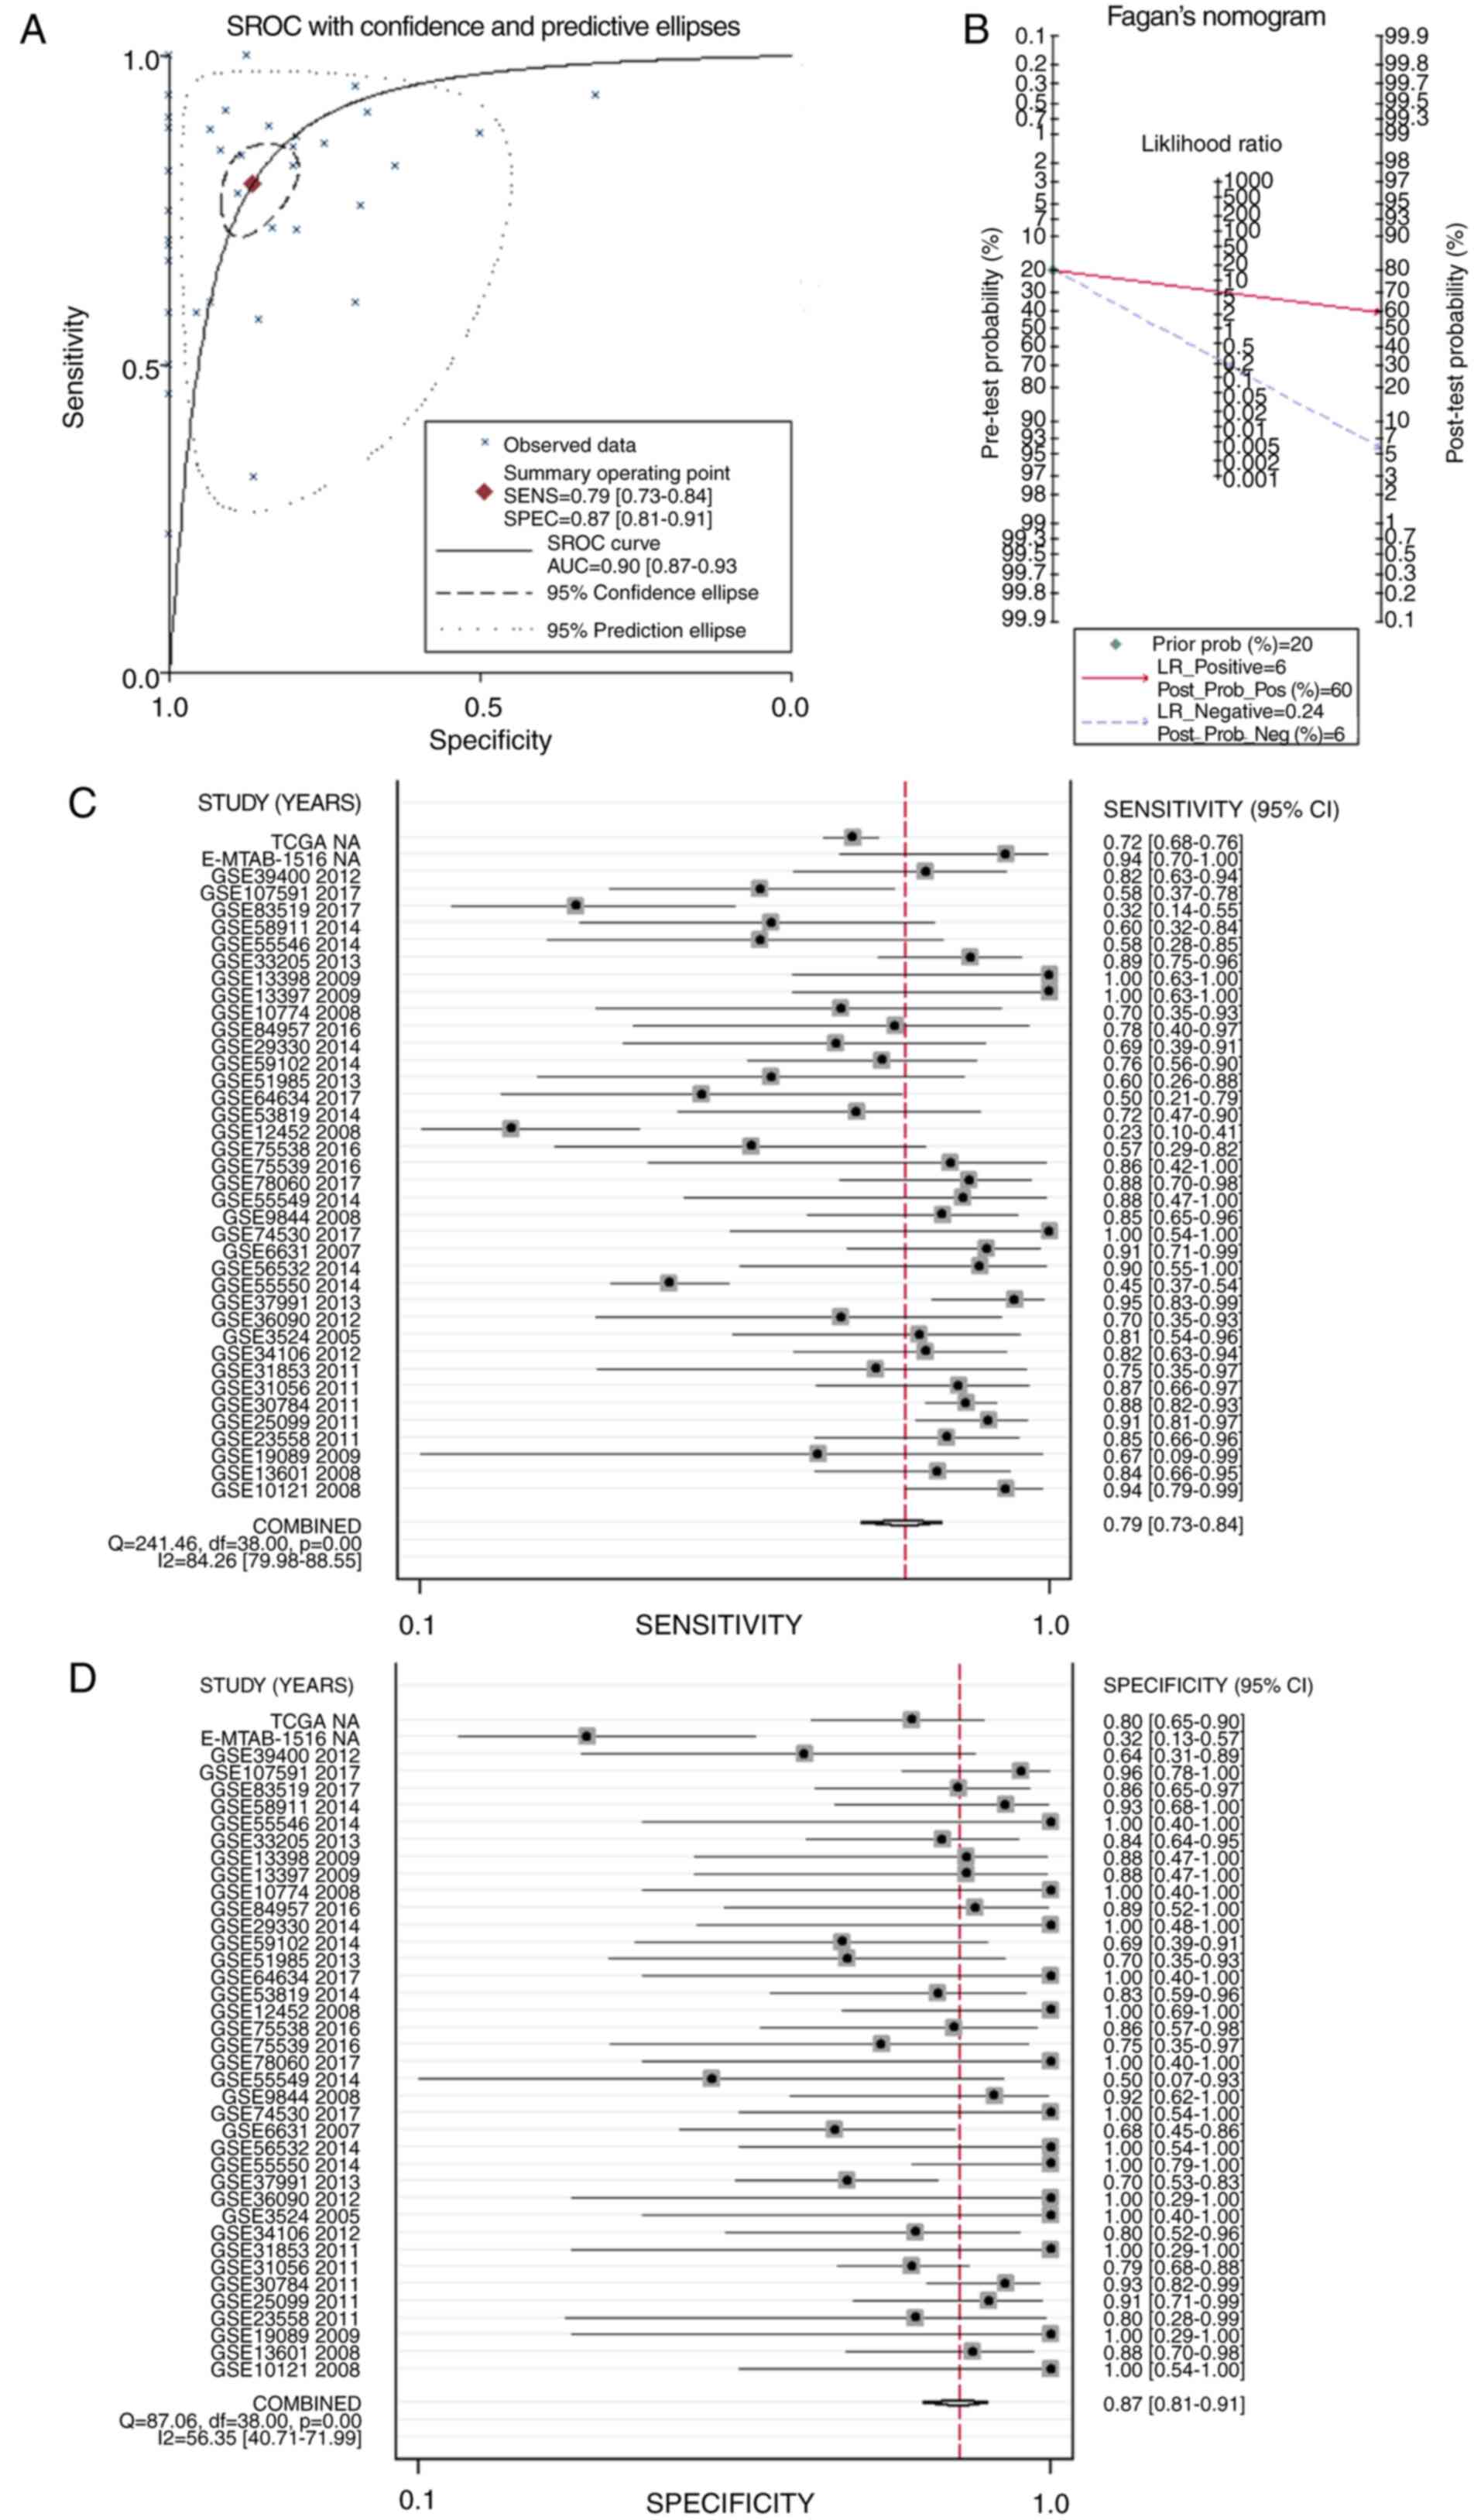 | Figure 11.sROC curves analysis of APOL1 for
discriminating HNSCC from normal tissues, prior probability
post-probability, positive and negative of the included studies and
sensitivity and specificity values. (A) sROC curves analysis of
APOL1 for discriminating HNSCC from normal tissues based on GEO
datasets. (B) Prior probability and post-probability positive and
negative of the included studies. The prior probability, post
probability positive and negative reached 20, 60 and 6%,
respectively. (C and D) Sensitivity and specificity values of the
included studies. The sensitivity and specificity values of the
included studies were 0.79 (95% CI, 0.73–0.84) and 0.87 (95% CI,
0.81–0.91), respectively. HNSCC, head and neck squamous cell
carcinoma; APOL1, apolipoprotein L1; LR, likelihood ratio; sROC,
summary receiver operating characteristic; CI, confidence
interval. |
After analyzing the association between the
expression of APOL1 and clinicopathological parameters in HNSCC,
relevant clinical information from the chips included in the
current study were extracted and SMD analysis was performed in
terms of sex, age and pathological staging (Fig. 12A-C). However, only the results
concerning age were statistically significant (P<0.0001), and
the expression of APOLI in patients >60 years old was higher
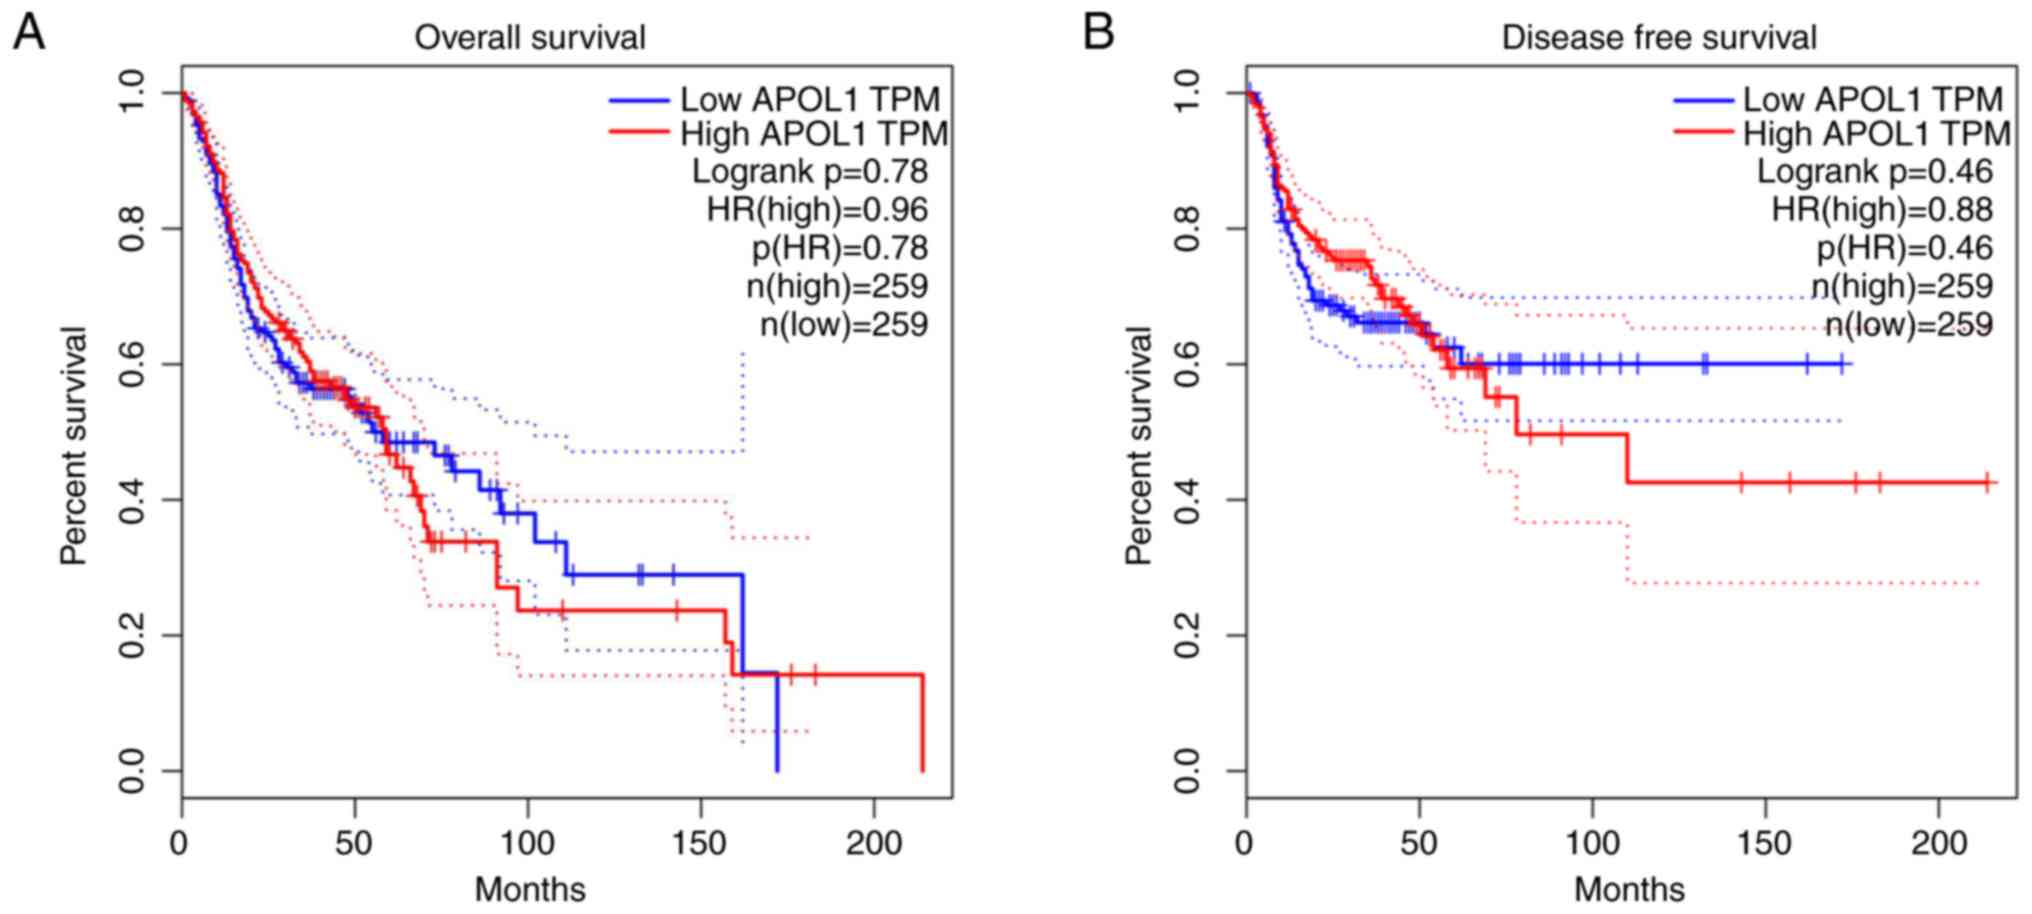
compared with that in patients <60 years old (Fig. 12B). Using the Kaplan-Meier
estimator, it was revealed that there was no significant difference
in terms of survival regarding APOL1 expression (Fig. 13).
Discussion
The human APOL1 gene is located at chromosome
22q13 (28). APOL1 induces
inflammatory cytokines (for example IFN and TNF) and the tumor
suppressor gene p53 (46).
Alterations in APOL1 function can lead to the occurrence of cancer,
chronic nephropathy, atherosclerosis and other diseases (32–34). It
has been reported that autophagy is a cellular pathway that
transmits cytoplasmic components to lysosomes for degradation and
recycling (47). APOL1 is a Bcl-2
homologous domain 3 monolipid-binding protein, which can maintain
sufficient autophagy flux of podocytes under normal physiological
conditions. When APOL1 is overexpressed, it can enhance the
autophagy ability of podocytes, liver cancer cells and melanoma
cells (48–50). A previous study has shown that among
the seven exons of APOL1, exon 4 is the main determinant of APOL1G0
cytotoxicity (51). This
lysosome-related autophagy is triggered by several pathways. First,
APOL1 disrupts intracellular vesicle transport by interfering with
autophagosome maturation, and APOL1 can be inserted into the plasma
membrane to form pH-sensitive cation channels, which can change the
pH value of endocytosis and enhance the activity of trypsin
decomposition (46,48). Second, APOL1 may interact with GTPase
or SNARE proteins, thus interfering with autophagy maturation and
lysosome fusion (52). APOL1 renal
risk alleles (G1 and G2), also called renal risk variants (RRVs),
inhibit the APOL1-miR193a axis of differentiated podocytes (DPDs)
(53), resulting in a decrease in
the assembly of PI3KC3-ATG14L and PI3KC3-anti-UV radiation
resistance associated gene complexes needed for autophagy nucleus
formation and maturation. This is a separate pathway by which APOL1
can trigger lysosome-mediated autophagy (54). Third, APOL1RRVs can affect the
permeability of intracellular and plasma membrane (55), and activate the opening of
mitochondrial pores and form oligomers, resulting in cytotoxicity
(56). The process of the activation
of the cGAS/IFI16-STING pathway begins by binding of cytosolic
nsDNA by cyclic GMP-AMP synthase (cGAS) and interferon-inducible
protein 16 (IFI16), which activates stimulator of interferon genes
(STING), and the cGAS/IFI16-STING pathway finally promotes the
transcription of APOL1 through signaling cascade (57). The expression of APOL1 induced by
nucleosome-associated double-stranded DNA fragments is mediated by
the IFN β-dependent signaling pathway, which is triggered by the
activation of the cGAS/IFI16-STING pathway (57). It has been demonstrated that a high
level of APOL1 expression can cause autophagy and autophagy-related
cell death in various tissues that are associated with the
occurrence of cancer, cardiomyopathy, obesity and neurodegenerative
diseases (58,59). Autophagy plays a dual role
oncogenesis and the development of tumors (60,61). In
normal physiological conditions, autophagy helps to degrade
denatured proteins and damaged organelles, which aids in preventing
cells from becoming cancerous (62).
However, when tumor cells are formed, adjacent normal cells can
also provide nutrients for the growth of tumors through autophagy
(63). These factors led to the
hypothesis that APOL1 may be associated with the development of
HNSCC. Based on the present results, it was speculated that the
expression of APOL1 would make it more easily to promote the
development of HNSCC through inducing autophagy, which leads to
tumor growth and invasion.
The present study collected a mass of chips by
mining TCGA, ArrayExpress and GEO databases. The HPA was also used
to verify differences in the APOL1 protein expression between HNSCC
and normal tissues. HNSCC tissues and normal tissues were also
collected in-house for IHC analysis. The current study had several
highlights. First of all, a total of 39 sets of microarrays and
RNA-seq data were collected to show the mRNA level of APOL1, and
221 cases of HNSCC tissues and 24 cases of normal head and neck
tissues were used in IHC detection for protein level. Secondly,
several methods were used to analyze APOL1 expression in HNSCC
tissues, such as IHC on tissue microarrays, gene microarrays,
RNA-sequencing, and also the integrated analysis. Therefore, the
association between the HNSCC tissues and the expression of APOL1
could be observed at both the mRNA and protein levels in multiple
cohorts using multiple detection methods. This provided more
evidence demonstrating APOL1 upregulation in HNSCC than results
from a single cohort and single detection method approach
would.
In order to make the study more applicable, OSCC and
LSCC cases were selected for HNSCC subgroup analysis. By applying
IHC to analyze the protein expression levels of APOL1 in 135 cases
of OSCC tissues, it was demonstrated that the protein content of
APOL1 in OSCC was higher compared with that in healthy tissues.
However, after analyzing the association between APOL1 expression
and the clinicopathological parameters in OSCC, significant
differences were only identified in terms of sex. In the analysis
of APOL1 mRNA expression in OSCC, APOL1 was expressed at
significantly higher levels in OSCC tissues compared with in normal
tissues. In addition, the results of sROC, pre-test probability,
post-test probability positive and post-test probability negative
indicated that APOL1 had a notable discriminatory capability for
OSCC.
By applying IHC to analyze the protein expression
levels of APOL1 in 49 cases of LSCC tissues, it was revealed that
the protein expression levels of APOL1 in LSCC tissues were
significantly higher compared with those in normal tissues. The
association between APOL1 expression levels and clinicopathological
parameters (including sex, age, tumor grade and clinical stage)
were investigated but no significant differences were observed. In
the analysis of APOL1 mRNA expression in LSCC microarrays, APOL1
levels were significantly higher in LSCC tissues compared with
those in normal tissues. In addition, the results of sROC, the
pre-test probability, the post-test probability positive and the
post-test probability negative indicated that APOL1 had a notable
discriminatory capability for LSCC.
It has been reported that APOL1 expression is higher
in papillary thyroid carcinoma (PTC) and renal cell carcinoma (RCC)
tissues compared with respective normal tissues (64,65).
However, Liu et al (34)
demonstrated that the expression of APOL1 in paracancerous tissues
is greater compared with that in pancreatic cancer (PC) tissues
(34). This may be because PTC is
derived from squamous epithelial cells. Similarly, OSCC and LSCC
are also derived from squamous epithelial cells, therefore the
expression of APOL1 in cancer may be dependent on the cell type.
However, the dominant histological type of PC was pancreatic ductal
adenocarcinoma, derived from ductal or acinar cells, and RCC
originates in proximal renal tubular epithelial cells (65,66).
There were several similarities in the expression of
APOL1 in OSCC and LSCC subgroups. First, by applying IHC to measure
the levels of APOL1, it was reported that APOL1 was significantly
expressed in OSCC and LSCC tumor tissues compared with respective
normal tissues. Second, analysis of APOL1 mRNA expression revealed
that APOL1 levels were higher in tumor tissues compared with
normal tissues. Third, no significant difference was found between
APOL1 expression levels and certain clinicopathological parameters,
including age, tumor grade and TNM stage (45) for both subtypes. Fourth, APOL1 had a
valuable discriminatory capability for OSCC and LSCC to be
separated from non-cancerous SCC tissues.
According to Table
III, of the three microarrays of APOL1 expression profiling in
NPC tissues, one NPC microarray showed that the upregulation of
APOL1 was significant (P=0.007). The result was quite different
from that of OSCC and LSCC. It has been shown that the initiation
and progress of NPC is closely associated with the status of
Epstein-Barr virus (EBV) infection (67). Some EBV gene products are involved in
tumor progression and play a vital part in epithelial-mesenchymal
transition, angiogenesis and metastasis in NPC (67,68). The
APOL1 gene may have a limited contribution to the initiation
and progress of NPC.
By analyzing the data from the HPA database and our
IHC results, it was observed that the content of APOL1 protein in
tumor tissue higher compared with that in non-tumor tissue. In the
analysis of the mRNA expression of APOL1 in HNSCC by microarrays
and RNA-seq, the same pattern was observation. The results of sROC,
the pre-test probability, the post-test probability positive and
the post-test probability negative indicated that APOL1
upregulation had potential diagnostic value for HNSCC. When
overexpressed, APOL1 induces autophagy and autophagy-related cell
death (65). Through autophagy,
adjacent normal cells are degraded and provide nutrition for the
growing tumor (63).
Despite the aforementioned findings, the present
study has some limitations. For example, we did not perform in
vitro studies to investigate the mechanisms underpinning APOL1
function in HNSCC cells, and the sample size used in present study
could be enlarged. The pathological mechanism of the disease is
still not clear, and further research is underway. However, the
present results may aid the development of potential interventions
in the future. High expression of APOL1 may directly or indirectly
result in the occurrence of HNSCC, therefore APOL1 is expected to
be a biomarker for HNSCC. The present results may help improve our
understanding of the occurrence and prognosis of HNSCC and provide
new avenues for future research.
In conclusion, compared with non-cancerous head and
neck tissues, APOL1 expression was significantly elevated in most
HNSCC tissues. This indicated that APOL1 might play a vital role in
the oncogenesis and development of HNSCC. The present study is the
first to identify an association between HNSCC and APOL1, to the
best of our knowledge. The current findings also suggest that APOL1
has the potential to be a promising biomarker, which warrants
further study. However, further research is needed to resolve the
molecular mechanisms underpinning the function of APOL1 in
HNSCC.
Acknowledgements
Not applicable.
Funding
The study was supported by the Guangxi Medical and
Health Appropriate Technology Development, and Popularization and
Application Project (grant no. S2017020) and the Promoting Project
of Basic Capacity for Young and Middle-aged University Teachers in
Guangxi, China (grant no. 2018KY0123).
Availability of data and materials
The datasets generated and/or analyzed during the
current study are available in the TCGA (http://cancergenome.nih.gov/), the GEO (https://www.ncbi.nlm.nih.gov/geo/) and
ArrayExpress (http://www.ebi.ac.uk/arrayexpress/) data portals. The
in-house IHC data from the present study can be acquired from the
correspondence author on reasonable request.
Authors' contributions
XGZ, YL, MXL, GSL, XYC, YXY and YYQ collected data
from public datasets, analyzed the data and performed the
statistical analysis. HPL, YWD and ZGH performed in-house IHC
experiments. FZ and GC participated in the conception and design of
the study and in manuscript correction. MM, KLZ, HD and ZXW
conceived and designed the study and assisted in the drafting of
the manuscript. All authors have read and approved the final
manuscript.
Ethics approval and consent to
participate
This research program was approved by The Ethics
Committee of the First Affiliated Hospital of Guangxi Medical
University (Nanning, China). All participants signed informed
consent forms.
Patient consent for publication
Not applicable
Competing interests
The authors declare that they have no competing
interests.
References
|
1
|
Siegel RL, Miller KD and Jemal A: Cancer
statistics, 2018. CA Cancer J Clin. 68:7–30. 2018. View Article : Google Scholar : PubMed/NCBI
|
|
2
|
Huang C, Cintra M, Brennan K, Zhou M,
Colevas AD, Fischbein N, Zhu S and Gevaert O: Development and
validation of radiomic signatures of head and neck squamous cell
carcinoma molecular features and subtypes. EBioMedicine. 45:70–80.
2019. View Article : Google Scholar : PubMed/NCBI
|
|
3
|
Xu Q, Wang C, Li B, Kim K, Li J, Mao M,
Qin L, Li H, Huang X, Xing R, et al: The impact of age on oral
squamous cell carcinoma: A longitudinal cohort study of 2,782
patients. Oral Dis. 25:730–741. 2019. View Article : Google Scholar : PubMed/NCBI
|
|
4
|
Liu Y, Zhao Q, Ding G, Zhu Y, Li W and
Chen W: Incidence and mortality of laryngeal cancer in China,
2008–2012. Chin J Cancer Res. 30:299–306. 2018. View Article : Google Scholar : PubMed/NCBI
|
|
5
|
Jin Y and Yang Y: Bioinformatics-based
discovery of PYGM and TNNC2 as potential biomarkers of head and
neck squamous cell carcinoma. Biosci Rep Jul. 39:BSR201916122019.
View Article : Google Scholar
|
|
6
|
Torre LA, Bray F, Siegel RL, Ferlay J,
Lortet-Tieulent J and Jemal A: Global cancer statistics, 2012. CA
Cancer J Clin. 65:87–108. 2015. View Article : Google Scholar : PubMed/NCBI
|
|
7
|
Ghantous Y and Abu Elnaaj I: Global
incidence and risk factors of oral cancer. Harefuah. 156:645–649.
2017.(In Hebrew). PubMed/NCBI
|
|
8
|
Jemal A, Bray F, Center MM, Ferlay J, Ward
E and Forman D: Global cancer statistics. CA Cancer J Clin.
61:69–90. 2011. View Article : Google Scholar : PubMed/NCBI
|
|
9
|
Zhou C, Shen Z, Ye D, Li Q, Deng H, Liu H
and Li J: The association and clinical significance of CDKN2A
promoter methylation in head and neck squamous cell carcinoma: A
meta-analysis. Cell Physiol Biochem. 50:868–882. 2018. View Article : Google Scholar : PubMed/NCBI
|
|
10
|
Stjernstrøm KD, Jensen JS, Jakobsen KK,
Grønhøj C and von Buchwald C: Current status of human
papillomavirus positivity in oropharyngeal squamous cell carcinoma
in Europe: A systematic review. Acta Otolaryngol. 139:1112–1116.
2019. View Article : Google Scholar : PubMed/NCBI
|
|
11
|
Gaździcka J, Gołąbek K, Strzelczyk JK and
Ostrowska Z: Epigenetic modifications in head and neck cancer.
Biochem Genet. 58:213–244. 2020. View Article : Google Scholar : PubMed/NCBI
|
|
12
|
Bhat S, Kabekkodu SP, Jayaprakash C,
Radhakrishnan R, Ray S and Satyamoorthy K: Gene promoter-associated
CpG island hypermethylation in squamous cell carcinoma of the
tongue. Virchows Arch. 470:445–454. 2017. View Article : Google Scholar : PubMed/NCBI
|
|
13
|
Ferlazzo N, Currò M, Zinellu A, Caccamo D,
Isola G, Ventura V, Carru C, Matarese G and Ientile R: Influence of
MTHFR genetic background on p16 and MGMT methylation in oral
squamous cell cancer. Int J Mol Sci. 18:7242017. View Article : Google Scholar
|
|
14
|
Wang K, Zheng M and Ren Y: Overexpression
of TRMT12 may independently predict poor overall survival in
patients with head and neck squamous cell carcinoma. OncoTargets
Ther. 12:7269–7279. 2019. View Article : Google Scholar
|
|
15
|
Liu C, Guo T, Xu G, Sakai A, Ren S,
Fukusumi T, Ando M, Sadat S, Saito Y, et al: Characterization of
alternative splicing events in HPV-negative head and neck squamous
cell carcinoma identifies an oncogenic DOCK5 variant. Clin Cancer
Res. 24:5123–5132. 2018. View Article : Google Scholar : PubMed/NCBI
|
|
16
|
Li R, Ochs MF, Ahn SM, Hennessey P, Tan M,
Soudry E, Gaykalova DA, Uemura M, Brait M, Shao C, et al:
Expression microarray analysis reveals alternative splicing of
LAMA3 and DST genes in head and neck squamous cell carcinoma. PLoS
One. 9:e912632014. View Article : Google Scholar : PubMed/NCBI
|
|
17
|
Liu C, Guo T, Sakai A, Ren S, Fukusumi T,
Ando M, Sadat S, Saito Y and Califano JA: A novel splice variant of
LOXL2 promotes progression of human papillomavirus-negative head
and neck squamous cell carcinoma. Cancer. 126:737–748. 2020.
View Article : Google Scholar : PubMed/NCBI
|
|
18
|
Kelley DZ, Flam EL, Guo T, Danilova LV,
Zamuner FT, Bohrson C, Considine M, Windsor EJ, Bishop JA, Zhang C,
et al: Functional characterization of alternatively spliced GSN in
head and neck squamous cell carcinoma. Transl Res. 202:109–119.
2018. View Article : Google Scholar : PubMed/NCBI
|
|
19
|
Li ZX, Zheng ZQ, Wei ZH, Zhang LL, Li F,
Lin L, Liu RQ, Huang XD, Lv JW, Chen FP, et al: Comprehensive
characterization of the alternative splicing landscape in head and
neck squamous cell carcinoma reveals novel events associated with
tumorigenesis and the immune microenvironment. Theranostics.
9:7648–7665. 2019. View Article : Google Scholar : PubMed/NCBI
|
|
20
|
Licitra L, Mesia R, Rivera F, Remenár É,
Hitt R, Erfán J, Rottey S, Kawecki A, Zabolotnyy D, Benasso M, et
al: Evaluation of EGFR gene copy number as a predictive biomarker
for the efficacy of cetuximab in combination with chemotherapy in
the first-line treatment of recurrent and/or metastatic squamous
cell carcinoma of the head and neck: EXTREME study. Ann Oncol.
22:1078–1087. 2011. View Article : Google Scholar : PubMed/NCBI
|
|
21
|
Ferris RL, Blumenschein G Jr, Fayette J,
Guigay J, Colevas AD, Licitra L, Harrington KJ, Kasper S, Vokes EE,
Even C, et al: Nivolumab vs investigator's choice in recurrent or
metastatic squamous cell carcinoma of the head and neck: 2-year
long-term survival update of CheckMate 141 with analyses by tumor
PD-L1 expression. Oral Oncol. 81:45–51. 2018. View Article : Google Scholar : PubMed/NCBI
|
|
22
|
Bauml J, Seiwert TY, Pfister DG, Worden F,
Liu SV, Gilbert J, Saba NF, Weiss J, Wirth L, Sukari A, et al:
Pembrolizumab for platinum- and cetuximab-refractory head and neck
cancer: Results from a single-arm, phase II study. J Clin Oncol.
35:1542–1549. 2017. View Article : Google Scholar : PubMed/NCBI
|
|
23
|
Napolitano M, Schipilliti FM, Trudu L and
Bertolini F: Immunotherapy in head and neck cancer: The great
challenge of patient selection. Crit Rev Oncol Hematol.
144:1028292019. View Article : Google Scholar : PubMed/NCBI
|
|
24
|
Kao HF and Lou PJ: Immune checkpoint
inhibitors for head and neck squamous cell carcinoma: Current
landscape and future directions. Head Neck. 41 (Suppl 1):4–18.
2019. View Article : Google Scholar : PubMed/NCBI
|
|
25
|
Ferris RL, Blumenschein G Jr, Fayette J,
Guigay J, Colevas AD, Licitra L, Harrington K, Kasper S, Vokes EE,
Even C, et al: Nivolumab for recurrent squamous-cell carcinoma of
the head and neck. N Engl J Med. 375:1856–1867. 2016. View Article : Google Scholar : PubMed/NCBI
|
|
26
|
Wang J, Lippman SM, Lee JJ, Yang H, Khuri
FR, Kim E, Lin J, Chang DW, Lotan R, Hong WK, et al: Genetic
variations in regulator of G-protein signaling genes as
susceptibility loci for second primary tumor/recurrence in head and
neck squamous cell carcinoma. Carcinogenesis. 31:1755–1761. 2010.
View Article : Google Scholar : PubMed/NCBI
|
|
27
|
Wu X, Spitz MR, Lee JJ, Lippman SM, Ye Y,
Yang H, Khuri FR, Kim E, Gu J, Lotan R, et al: Novel susceptibility
loci for second primary tumors/recurrence in head and neck cancer
patients: Large-scale evaluation of genetic variants. Cancer Prev
Res (Phila). 2:617–624. 2009. View Article : Google Scholar : PubMed/NCBI
|
|
28
|
Thomson R, Genovese G, Canon C, Kovacsics
D, Higgins MK, Carrington M, Winkler CA, Kopp J, Rotimi C, Adeyemo
A, et al: Evolution of the primate trypanolytic factor APOL1. Proc
Natl Acad Sci USA. 111:E2130–E2139. 2014. View Article : Google Scholar : PubMed/NCBI
|
|
29
|
Riella C, Siemens TA, Wang M, Campos RP,
Moraes TP, Riella LV, Friedman DJ, Riella MC and Pollak MR:
APOL1-associated kidney disease in Brazil. Kidney Int Rep.
4:923–929. 2019. View Article : Google Scholar : PubMed/NCBI
|
|
30
|
Freedman BI, Spainhour M, Hicks PJ, Turner
J, Robertson J, Langefeld CD, Murea M and Divers J: Nephropathy
progression in African Americans with a family history of ESKD:
Implications for Clinical Trials in APOL1-associated nephropathy.
Am J Kidney Dis. 74:284–286. 2019. View Article : Google Scholar : PubMed/NCBI
|
|
31
|
Franceschini N, Kopp JB, Barac A, Martin
LW, Li Y, Qian H, Reiner AP, Pollak M, Wallace RB, Rosamond WD, et
al: Association of APOL1 with heart failure with preserved ejection
fraction in postmenopausal African American women. JAMA Cardiol.
3:712–720. 2018. View Article : Google Scholar : PubMed/NCBI
|
|
32
|
Fontaine F, Lecordier L, Vanwalleghem G,
Uzureau P, Van Reet N, Fontaine M, Tebabi P, Vanhollebeke B,
Büscher P, Pérez-Morga D, et al: APOLs with low pH dependence can
kill all African trypanosomes. Nat Microbiol. 2:1500–1506. 2017.
View Article : Google Scholar : PubMed/NCBI
|
|
33
|
Okamoto K, Rausch JW, Wakashin H, Fu Y,
Chung JY, Dummer PD, Shin MK, Chandra P, Suzuki K, Shrivastav S, et
al: APOL1 risk allele RNA contributes to renal toxicity by
activating protein kinase R. Commun Biol. 1:1882018. View Article : Google Scholar : PubMed/NCBI
|
|
34
|
Liu X, Zheng W, Wang W, Shen H, Liu L, Lou
W, Wang X and Yang P: A new panel of pancreatic cancer biomarkers
discovered using a mass spectrometry-based pipeline. Br J Cancer.
117:1846–1854. 2017. View Article : Google Scholar : PubMed/NCBI
|
|
35
|
O'Toole JF, Bruggeman LA, Madhavan S and
Sedor JR: The cell biology of APOL1. Semin Nephrol. 37:538–545.
2017. View Article : Google Scholar : PubMed/NCBI
|
|
36
|
Kardideh B, Samimi Z, Norooznezhad F,
Kiani S and Mansouri K: Autophagy, cancer and angiogenesis: Where
is the link? Cell Biosci. 9:652019. View Article : Google Scholar : PubMed/NCBI
|
|
37
|
Codogno P and Morel E: FOXO3a provides a
quickstep from autophagy inhibition to apoptosis in cancer therapy.
Dev Cell. 44:537–539. 2018. View Article : Google Scholar : PubMed/NCBI
|
|
38
|
Tao Q and Chan AT: Nasopharyngeal
carcinoma: Molecular pathogenesis and therapeutic developments.
Expert Rev Mol Med. 9:1–24. 2007. View Article : Google Scholar : PubMed/NCBI
|
|
39
|
Sticht C, Freier K, Knöpfle K,
Flechtenmacher C, Pungs S, Hofele C, Hahn M, Joos S and Lichter P:
Activation of MAP kinase signaling through ERK5 but not ERK1
expression is associated with lymph node metastases in oral
squamous cell carcinoma (OSCC). Neoplasia. 10:462–470. 2008.
View Article : Google Scholar : PubMed/NCBI
|
|
40
|
Estilo CL, O-charoenrat P, Talbot S, Socci
ND, Carlson DL, Ghossein R, Williams T, Yonekawa Y, Ramanathan Y,
Boyle JO, et al: Oral tongue cancer gene expression profiling:
Identification of novel potential prognosticators by
oligonucleotide microarray analysis. BMC Cancer. 9:112009.
View Article : Google Scholar : PubMed/NCBI
|
|
41
|
Lian M, Fang J, Han D, Ma H, Feng L, Wang
R and Yang F: Microarray gene expression analysis of tumorigenesis
and regional lymph node metastasis in laryngeal squamous cell
carcinoma. PLoS One. 8:e848542013. View Article : Google Scholar : PubMed/NCBI
|
|
42
|
Uhlen M, Zhang C, Lee S, Sjöstedt E,
Fagerberg L, Bidkhori G, Benfeitas R, Arif M, Liu Z, Edfors F, et
al: A pathology atlas of the human cancer transcriptome. Science.
357:eaan25072017. View Article : Google Scholar : PubMed/NCBI
|
|
43
|
Uhlén M, Fagerberg L, Hallström BM,
Lindskog C, Oksvold P, Mardinoglu A, Sivertsson Å, Kampf C,
Sjöstedt E, Asplund A, et al: Proteomics. Tissue-based map of the
human proteome. Science. 347:12604192015. View Article : Google Scholar : PubMed/NCBI
|
|
44
|
Thul PJ, Åkesson L, Wiking M, Mahdessian
D, Geladaki A, Blal HA, Alm T, Asplund A, Björk L, Breckels LM, et
al: A subcellular map of the human proteome. Science.
356:eaal33212017. View Article : Google Scholar : PubMed/NCBI
|
|
45
|
Huang SH and O'Sullivan B: Overview of the
8th edition TNM classification for head and neck cancer. Curr Treat
Options Oncol. 18:402017. View Article : Google Scholar : PubMed/NCBI
|
|
46
|
Zhaorigetu S, Wan G, Kaini R, Jiang Z and
Hu CA: ApoL1, a BH3-only lipid-binding protein, induces autophagic
cell death. Autophagy. 4:1079–1082. 2008. View Article : Google Scholar : PubMed/NCBI
|
|
47
|
Ho CJ and Gorski SM: Molecular nechanisms
underlying autophagy-mediated treatment resistance in Cancer.
Cancers (Basel). 11:17752019. View Article : Google Scholar
|
|
48
|
O'Toole JF, Schilling W, Kunze D, Madhavan
SM, Konieczkowski M, Gu Y, Luo L, Wu Z, Bruggeman LA and Sedor JR:
ApoL1 overexpression drives variant-independent cytotoxicity. J Am
Soc Nephrol. 29:869–879. 2018.PubMed/NCBI
|
|
49
|
Kruzel-Davila E, Shemer R, Ofir A,
Bavli-Kertselli I, Darlyuk-Saadon I, Oren-Giladi P, Wasser WG,
Magen D, Zaknoun E, Schuldiner M, et al: APOL1-mediated cell injury
involves disruption of conserved trafficking processes. J Am Soc
Nephrol. 28:1117–1130. 2017. View Article : Google Scholar : PubMed/NCBI
|
|
50
|
Cheng D, Weckerle A, Yu Y, Ma L, Zhu X,
Murea M, Freedman BI, Parks JS and Shelness GS: Biogenesis and
cytotoxicity of APOL1 renal risk variant proteins in hepatocytes
and hepatoma cells. J Lipid Res. 56:1583–1593. 2015. View Article : Google Scholar : PubMed/NCBI
|
|
51
|
Khatua AK, Cheatham AM, Kruzel ED, Singhal
PC, Skorecki K and Popik W: Exon 4-encoded sequence is a major
determinant of cytotoxicity of apolipoprotein L1. Am J Physiol Cell
Physiol. 309:C22–C37. 2015. View Article : Google Scholar : PubMed/NCBI
|
|
52
|
Beckerman P, Bi-Karchin J, Park AS, Qiu C,
Dummer PD, Soomro I, Boustany-Kari CM, Pullen SS, Miner JH, Hu CA,
et al: Transgenic expression of human APOL1 risk variants in
podocytes induces kidney disease in mice. Nat Med. 23:429–438.
2017. View Article : Google Scholar : PubMed/NCBI
|
|
53
|
Kumar V, Paliwal N, Ayasolla K, Vashistha
H, Jha A, Chandel N, Chowdhary S, Saleem MA, Malhotra A, Chander
PN, et al: Disruption of APOL1-miR193a axis induces disorganization
of podocyte actin cytoskeleton. Sci Rep. 9:35822019. View Article : Google Scholar : PubMed/NCBI
|
|
54
|
Kumar V, Ayasolla K, Jha A, Mishra A,
Vashistha H, Lan X, Qayyum M, Chinnapaka S, Purohit R, Mikulak J,
et al: Disrupted apolipoprotein L1-miR193a axis dedifferentiates
podocytes through autophagy blockade in an APOL1 risk milieu. Am J
Physiol Cell Physiol. 317:C209–C225. 2019. View Article : Google Scholar : PubMed/NCBI
|
|
55
|
Bruno J, Pozzi N, Oliva J and Edwards JC:
Apolipoprotein L1 confers pH-switchable ion permeability to
phospholipid vesicles. J Biol Chem. 292:18344–18353. 2017.
View Article : Google Scholar : PubMed/NCBI
|
|
56
|
Shah SS, Lannon H, Dias L, Zhang JY, Alper
SL, Pollak MR and Friedman DJ: APOL1 kidney risk variants induce
cell death via mitochondrial translocation and opening of the
mitochondrial permeability transition pore. J Am Soc Nephrol.
30:2355–2368. 2019. View Article : Google Scholar : PubMed/NCBI
|
|
57
|
Davis SE, Khatua AK and Popik W:
Nucleosomal dsDNA Stimulates APOL1 expression in human cultured
podocytes by activating the cGAS/IFI16-STING signaling pathway. Sci
Rep. 9:154852019. View Article : Google Scholar : PubMed/NCBI
|
|
58
|
Choi AM, Ryter SW and Levine B: Autophagy
in human health and disease. N Engl J Med. 368:651–662. 2013.
View Article : Google Scholar : PubMed/NCBI
|
|
59
|
Kundu M and Thompson CB: Autophagy: Basic
principles and relevance to disease. Annu Rev Pathol. 3:427–455.
2008. View Article : Google Scholar : PubMed/NCBI
|
|
60
|
Antunes F, Erustes AG, Costa AJ,
Nascimento AC, Bincoletto C, Ureshino RP, Pereira GJ and Smaili SS:
Autophagy and intermittent fasting: The connection for cancer
therapy? Clinics (Sao Paulo). 73 (Suppl 1):e814s2018. View Article : Google Scholar : PubMed/NCBI
|
|
61
|
Salminen A, Kaarniranta K and Kauppinen A:
Beclin 1 interactome controls the crosstalk between apoptosis,
autophagy and inflammasome activation: Impact on the aging process.
Ageing Res Rev. 12:520–534. 2013. View Article : Google Scholar : PubMed/NCBI
|
|
62
|
Yu L, Chen Y and Tooze SA: Autophagy
pathway: Cellular and molecular mechanisms. Autophagy. 14:207–215.
2018. View Article : Google Scholar : PubMed/NCBI
|
|
63
|
Levy JM, Towers CG and Thorburn A:
Targeting autophagy in cancer. Nat Rev Cancer. 17:528–542. 2017.
View Article : Google Scholar : PubMed/NCBI
|
|
64
|
Chidiac M, Fayyad-Kazan M, Daher J,
Poelvoorde P, Bar I, Maenhaut C, Delrée P, Badran B and Vanhamme L:
ApolipoproteinL1 is expressed in papillary thyroid carcinomas.
Pathol Res Pract. 212:631–635. 2016. View Article : Google Scholar : PubMed/NCBI
|
|
65
|
Hu CA, Klopfer EI and Ray PE: Human
apolipoprotein L1 (ApoL1) in cancer and chronic kidney disease.
FEBS Lett. 586:947–955. 2012. View Article : Google Scholar : PubMed/NCBI
|
|
66
|
Xu Y, Liu J, Nipper M and Wang P: Ductal
vs. acinar? Recent insights into identifying cell lineage of
pancreatic ductal adenocarcinoma. Ann Pancreat Cancer. Jun
17–2019.(Epub ahead of print). doi: 10.21037/apc.2019.06.03.
View Article : Google Scholar : PubMed/NCBI
|
|
67
|
Zhang J, Jia L, Tsang CM and Tsao SW: EBV
infection and glucose metabolism in nasopharyngeal carcinoma. Adv
Exp Med Biol. 1018:75–90. 2017. View Article : Google Scholar : PubMed/NCBI
|
|
68
|
Elgui de Oliveira D, Müller-Coan BG and
Pagano JS: Viral carcinogenesis beyond malignant Transformation:
EBV in the progression of human cancers. Trends Microbiol.
24:649–664. 2016. View Article : Google Scholar : PubMed/NCBI
|