Introduction
Diffuse large B-cell lymphoma (DLBCL) is a type of
lymphoma with high heterogeneity in regards to immunophenotype,
gene expression, morphology, clinical symptoms and prognosis
(1). The International Prognostic
Index (IPI) is the most commonly used prognostic index for
predicting the outcome in clinics for patients with DLBCL.
Prognostic evaluation and risk stratification are made by IPI based
on 5 aspects, including age, Ann Arbor stage, lactate dehydrogenase
(LDH) levels, physical condition score, and the number of
extranodal organ involvement. However, DLBCL patients with the same
IPI score might still have different outcomes after undergoing
similar chemotherapy due to tumor heterogeneity. Furthermore, the
prognostic value of an intermediate IPI score still remains to be
unclear (2,3). With the introduction of rituximab into
the first-line chemotherapy regimens (R-CHOP), the prognostic value
of IPI still faced great challenges. Thus, more reliable prognostic
indicators or evaluation models are urgently needed to identify
patients who are more likely to relapse in clinical practice
(4,5). Some scholars have carried out relevant
basic research and proposed gene predictors such as cell origin,
MYC and BCL2/BCL6 double expression, but their application value
still requires further confirmation (6,7).
According to previous studies, baseline
18F-FDG PET/CT parameters, such as metabolism of tumor
volume (MTV) and total lesion glycolysis (TLG), could provide
personalized information on metabolic activity and metabolic volume
of the tumor, and have important prognostic value in patients with
DLBCL (8,9). However, the results of these studies
are not completely consistent, and this may be due to the
distribution bias of enrolled cases, different threshold selection
methods and standards for measurement of PET/CT parameters.
Assessment of interim treatment response based on PET/CT has great
prognostic value in DLBCL patients and it has been included in
criteria for response assessment (10,11).
Interim treatment response has attracted much clinical attention,
but some patients with a good interim treatment response and
negative interim PET/CT may still have recurrence and progression.
Currently, there are relatively few studies that have discussed the
prognostic value of the combination of baseline PET/CT quantitative
parameters and interim treatment response in DLBCL patients
(12,13).
Hence, in the present study, the relationship
between baseline PET/CT quantitative parameters, interim treatment
response and prognostic survival of 64 patients with DLBCL
receiving R-CHOP chemotherapy was analyzed, and the predictive
efficacy of the combination of baseline PET/CT parameters and
interim treatment response for survival was evaluated with the aim
to guide the implementation of appropriate treatment and follow-up
strategies for high-risk patients and to improve their long-term
survival.
Patients and methods
Patient selection
The inclusion criteria were as follows: i) Patients
with pathologically and immunohistochemically confirmed DLBCL after
surgery or biopsy, ii) patients who received first-line R-CHOP
(rituximab, cyclophosphamide, hydroxydaunomycin, oncovin and
prednisone) chemotherapy, iii) patients who underwent
18F-FDG PET/CT scans before and after 3 or 4 cycles of
R-CHOP chemotherapy, respectively, iv) patients no less than 18
years of age, and v) patients with complete clinical records. The
exclusion criteria were as follows: i) Patients with primary
central nervous system lymphoma, ii) patients with a history of
malignancy or with other malignancies at present, iii) patients who
received chemotherapy, radiotherapy or surgical resection before
PET/CT scan prior to the study enrollment, iv) patients who dropped
out during the treatment due to any reason, and v) patients with
incomplete clinical records. Between July 2014 and December 2018, a
total of 358 patients with DLBCL were admitted to our institution,
and 294 patients of these were excluded, including those who did
not receive rituximab treatment (n=67), did not undergo baseline
and interim PET/CT scan (n=65), with primary central nervous system
lymphoma (n=17), with a history of malignancy or with other
malignancies at present (n=9), received other therapies before
PET/CT scan (n=76), dropped out during the course of treatment or
follow-up (n=29), or with incomplete clinical records (n=31).
Finally, a total of 64 patients were enrolled in this study.
Clinical data such as sex, age, B symptoms, Ann Arbor staging, IPI,
LDH, β2-MG and immunohistochemical results were obtained according
to the medical records. This study was approved by the Ethics
Committee of the Affiliated Hospital of Xuzhou Medical University
(XYFY2016-KL002-01), and patient informed consent was waived due to
the retrospective nature of the present study.
PET/CT imaging
18F-FDG PET/CT image acquisition was
performed with Discovery PET/CT Elite scanner (GE Healthcare).
After fasting for at least 6 h, patients were intravenously
injected with 18F-FDG (3.5 to 4.0 MBq/kg). The weight of
the patients was obtained and the fasting blood glucose levels were
controlled to less than 150 mg/dl before injection. Patients after
injection were advised to rest for 1 h before initiating the PET/CT
scan. Patients were placed in a supine position with quiet
breathing. CT images were acquired from the skull vertex to
proximal thigh initially and then the corresponding PET data were
collected. CT data were used for attenuation correction and the
standard protocol settings were as follows: 120 KV, 180 mA, slice
thickness of 3.75 mm. PET scanning images were acquired in 7 to 8
bed positions and the acquisition time was 3 min per bed position.
Image fusion was performed after reconstruction by iterative
method.
PET/CT parameters
All PET/CT images were reconstructed and reviewed
using Volume Viewer software on Workstation AW 4.5 (GE Healthcare)
by two experienced radiologists and a nuclear medicine physician
who were blinded to the clinical information. Visual assessment and
semi-quantitative analysis were used for image analysis. Tumor
contours covering the entire lesion volume in axial, coronal and
sagittal images were delineated automatically or manually as and
when necessary, and then the quantitative parameters such as
maximum standardized uptake value (SUVmax), mean standardized
uptake value (SUVmean), metabolic tumor volume of the maximum
lesion (MTVmax), sum of the metabolic tumor volume (MTVsum), total
lesion glycolysis of the maximum lesion (TLGmax), sum of total
lesion glycolysis (TLGsum), maximum diameter of the maximum lesion
(Dmax) were measured or calculated. MTV was measured with a
threshold of 40% SUVmax. TLG was the product of MTV and
SUVmean.
Interim treatment response
evaluation
Response to 3 or 4 cycles of R-CHOP chemotherapy was
assessed according to the Lugano criteria (11) and patients were categorized into four
types: Complete remission (CR), partial remission (PR), stable
disease (SD) and progressive disease (PD) as described here. CR:
PET/CT-based response: Score 1, 2, or 3 with or without a residual
mass on 5PS (1, no uptake above background; 2, uptake ≤
mediastinum; 3, uptake > mediastinum but ≤ liver; 4, uptake
moderately > liver; 5, uptake markedly higher than liver and/or
no new lesions; X, new areas of uptake unlikely to be related to
lymphoma), no new lesions and no evidence of FDG-avid disease in
marrow. PR: Score 4 or 5 with reduced uptake compared with baseline
and residual mass(es) of any size, no new lesions, residual uptake
higher than uptake in normal marrow but reduced compared with
baseline. SD: Score 4 or 5 with no significant change in FDG uptake
from baseline at interim or end of treatment, no new lesions, no
change in marrow uptake from baseline. PD: Score 4 or 5 with an
increase in intensity of uptake from baseline, new FDG-avid foci
consistent with lymphoma rather than another etiology (eg.
infection, inflammation), new or recurrent FDG-avid foci in marrow.
In the present study, all patients were divided into two groups
including CR group and non-CR group. Patients with CR were included
in the CR group and patients with PR, SD or PD were included in the
non-CR group.
Follow-up assessment
Follow-up was performed by conducting phone
interview or reviewing of hospital records. Progression-free
survival (PFS) was defined as the time from initial diagnosis until
the first occurrence of disease recurrence, progression, death due
to any cause or at the end of the follow-up period. Overall
survival (OS) was defined as the time from initial diagnosis until
death due to any cause or the end of follow-up period.
Statistical analysis
Non-normally distributed data are expressed as
median (Q1 and Q3). Intraclass correlation coefficient (ICC) was
used to assess interobserver consistency of PET/CT parameters. Cox
proportional hazard models were used in the univariate and
multivariate analyses. Survival curves were constructed using
Kaplan-Meier method. Receiver operating characteristic (ROC)
analysis was performed to evaluate the predictive efficacy of the
indicators. A P-value of less than 0.05 was considered to be
statistically significant. All statistical analyses were performed
using SPSS software (version 21.0) (IBM Corp.).
Results
Patient characteristics
A total of 64 patients, including 33 men (51.6%) and
31 women (48.4%), were enrolled in this study. The median age at
diagnosis was 57 years (range, 25–80 years). The clinical
characteristics of the 64 patients with DLBCL are listed in
Table I. Of the entire cohort, 39
(60.9%) patients achieved CR and 25 (39.1%) patients had non-CR
after 3 or 4 cycles of R-CHOP chemotherapy. Follow-up time ranged
from 6 to 62 months, and the median follow-up time was 25 months.
Relapse and progression occurred in 23 patients, while 17 patients
died within two years. The 2-year PFS rate and 2-year OS rate were
64.1 and 73.4%, respectively.
 | Table I.Clinical characteristics of the 64
patients with DLBCL. |
Table I.
Clinical characteristics of the 64
patients with DLBCL.
|
Characteristics | No. of
patients | Percentage (%) |
|---|
| Sex |
|
Male | 33 | 51.6 |
|
Female | 31 | 48.4 |
| Age (years) |
|
≤60 | 34 | 53.1 |
|
>60 | 30 | 46.9 |
| B symptoms |
|
Yes | 17 | 26.6 |
| No | 47 | 73.4 |
| Ann Arbor
stage |
|
I+II | 22 | 34.4 |
|
III+IV | 42 | 65.6 |
| IPI |
| ≤2 | 40 | 62.5 |
|
>2 | 24 | 37.5 |
| LDH |
|
Normal | 34 | 53.1 |
|
Abnormal | 30 | 46.9 |
|
β2-MG |
|
Normal | 37 | 57.8 |
|
Abnormal | 27 | 42.2 |
| Nln |
|
<2 | 14 | 21.9 |
| ≥2 | 50 | 78.1 |
| Neo |
|
<2 | 49 | 76.6 |
| ≥2 | 15 | 23.4 |
| BMI |
| No | 52 | 81.2 |
|
Yes | 12 | 18.8 |
| Necrosis |
| No | 49 | 76.6 |
|
Yes | 15 | 23.4 |
Interobserver agreement
Baseline PET/CT parameters were measured by two
observers. Consistency test showed intraclass correlation
coefficient (ICC) that ranged between 0.663 and 0.991, showing good
agreement. ICC values are shown in Table SI and baseline PET/CT parameters of
the patients are listed in Table
SII.
Univariate analysis
The median SUVmax, SUVmean, MTVmax, MTVsum, TLGmax,
TLGsum and Dmax of the entire population were 17.6, 10.6, 63.5
cm3, 132.6 cm3, 628.7 g, 1135.9 g and 5.7 cm,
respectively.
Of all the clinical indicators, baseline PET/CT
parameters and interim treatment response evaluated, Ann Arbor
stage, IPI, LDH, necrosis, MTVmax, TLGmax, Dmax and interim
treatment response showed association with 2-year PFS (P<0.05).
LDH, necrosis, MTVmax, MTVsum, TLGmax, TLGsum, Dmax and interim
treatment response showed association with 2-year OS (P<0.05)
(Tables II and III).
| Table II.Univariate analyses of the clinical
characteristics for PFS and OS. |
Table II.
Univariate analyses of the clinical
characteristics for PFS and OS.
|
| 2-year PFS | 2-year OS |
|---|
|
|
|
|
|---|
|
Characteristics | RR | 95% CI | P-value | RR | 95% CI | P-value |
|---|
| Sex |
|
Male | 1 |
|
| 1 |
|
|
|
Female | 0.418 | 0.170–1.028 | 0.057 | 0.274 | 0.090–0.835 | 0.061 |
| Age (years) |
|
≤60 | 1 |
|
| 1 |
|
|
|
>60 | 0.544 | 0.228–1.300 | 0.171 | 0.439 | 0.163–1.180 | 0.103 |
| B symptoms |
|
Yes | 1 |
|
| 1 |
|
|
| No | 0.513 | 0.214–1.227 | 0.134 | 0.410 | 0.159–1.062 | 0.066 |
| Ann Arbor
stage |
|
I+II | 1 |
|
| 1 |
|
|
|
III+IV | 2.754 | 1.013–7.485 | 0.047a | 1.927 | 0.686–5.414 | 0.213 |
| IPI score |
| ≤2 | 1 |
| 1 |
|
|
|
|
>2 | 2.501 | 1.076–5.816 | 0.033a | 2.381 | 0.943–6.012 | 0.066 |
| LDH level |
|
Normal | 1 |
|
| 1 |
|
|
|
Abnormal | 5.926 | 1.986–17.680 | 0.001a | 4.495 | 1.469–13.758 | 0.008a |
|
β2-MG |
|
Normal | 1 |
|
| 1 |
|
|
|
Abnormal | 1.252 | 0.535–2.930 | 0.605 | 1.469 | 0.579–3.726 | 0.418 |
| Nln |
|
<2 | 1 |
|
| 1 |
|
|
| ≥2 | 2.139 | 0.723–6.327 | 0.170 | 2.381 | 0.686–8.256 | 0.172 |
| Neo |
|
<2 | 1 |
|
| 1 |
|
|
| ≥2 | 2.124 | 0.886–5.092 | 0.091 | 2.202 | 0.850–5.703 | 0.104 |
| BMI |
| No | 1 |
|
| 1 |
|
|
|
Yes | 1.307 | 0.442–3.868 | 0.629 | 0.977 | 0.280–3.401 | 0.970 |
| Necrosis |
| No | 1 |
|
| 1 |
|
|
|
Yes | 3.594 | 1.526–8.465 | 0.003a | 4.085 | 1.612–10.356 | 0.003a |
| Table III.Univariate analyses of baseline
PET/CT parameters and interim treatment response for PFS and
OS. |
Table III.
Univariate analyses of baseline
PET/CT parameters and interim treatment response for PFS and
OS.
|
| 2-year PFS | 2-year OS |
|---|
|
|
|
|
|---|
| Variables | RR | 95% CI | P-value | RR | 95% CI | P-value |
|---|
| SUVmax |
|
<17.6 | 1 |
|
| 1 |
|
|
|
≥17.6 | 1.575 | 0.673–3.690 | 0.295 | 1.531 | 0.591–3.969 | 0.381 |
| SUVmean |
|
<10.6 | 1 |
|
| 1 |
|
|
|
≥10.6 | 1.208 | 0.522–2.798 | 0.659 | 1.531 | 0.591–3.969 | 0.381 |
| MTVmax
(cm3) |
|
<63.5 | 1 |
|
| 1 |
|
|
|
≥63.5 | 4.716 | 1.722–12.916 | 0.003a | 6.683 | 1.924–23.209 | 0.003a |
| MTVsum
(cm3) |
|
<132.6 | 1 |
|
| 1 |
|
|
|
≥132.6 | 2.267 | 0.946–5.434 | 0.067 | 3.564 | 1.265–10.043 | 0.016a |
| TLGmax (g) |
|
<628.7 | 1 |
|
| 1 |
|
|
|
≥628.7 | 4.716 | 1.722–12.916 | 0.003a | 6.433 | 1.852–22.350 | 0.003a |
| TLGsum (g) |
|
<1135.9 | 1 |
|
| 1 |
|
|
|
≥1135.9 | 2.076 | 0.868–4.968 | 0.101 | 3.267 | 1.159–9.211 | 0.025a |
| Dmax (cm) |
|
<5.7 | 1 |
|
| 1 |
|
|
|
≥5.7 | 4.716 | 1.722–12.916 | 0.003a | 6.895 | 1.982–23.984 | 0.002a |
| Interim treatment
response |
| CR | 1 |
|
| 1 |
|
|
|
Non-CR | 4.642 | 1.699–11.685 | 0.003a | 6.496 | 1.855–21.176 | 0.002a |
Multivariate analysis
The statistical significant indicators in univariate
analysis were included in the multivariate analysis. Due to the
close relationship between MTVmax and TLGmax, MTVsum and TLGsum,
only TLGmax and TLGsum were included in multivariate analysis.
Ann Arbor stage, Dmax and interim treatment response
were considered as independent prognostic factors for 2-year PFS
(P<0.05). Dmax and interim treatment response were shown to be
independent prognostic factors for 2-year OS (P<0.05) (Table IV).
| Table IV.Multivariate analyses of clinical
characteristics, baseline PET/CT parameters and interim treatment
response for PFS and OS. |
Table IV.
Multivariate analyses of clinical
characteristics, baseline PET/CT parameters and interim treatment
response for PFS and OS.
|
| 2-year PFS | 2-year OS |
|---|
|
|
|
|
|---|
| Variables | RR | 95% CI | P-value | RR | 95% CI | P-value |
|---|
| Ann Arbor
stage | 2.415 | 0.836–6.976 | 0.043 |
| – |
|
| Dmax | 2.854 | 0.946–8.609 | 0.036 | 4.016 | 1.103–14.629 | 0.035 |
| Interim treatment
response | 11.437 | 3.594–36.397 | <0.001 | 7.619 | 2.092–27.742 | 0.002 |
Survival curves
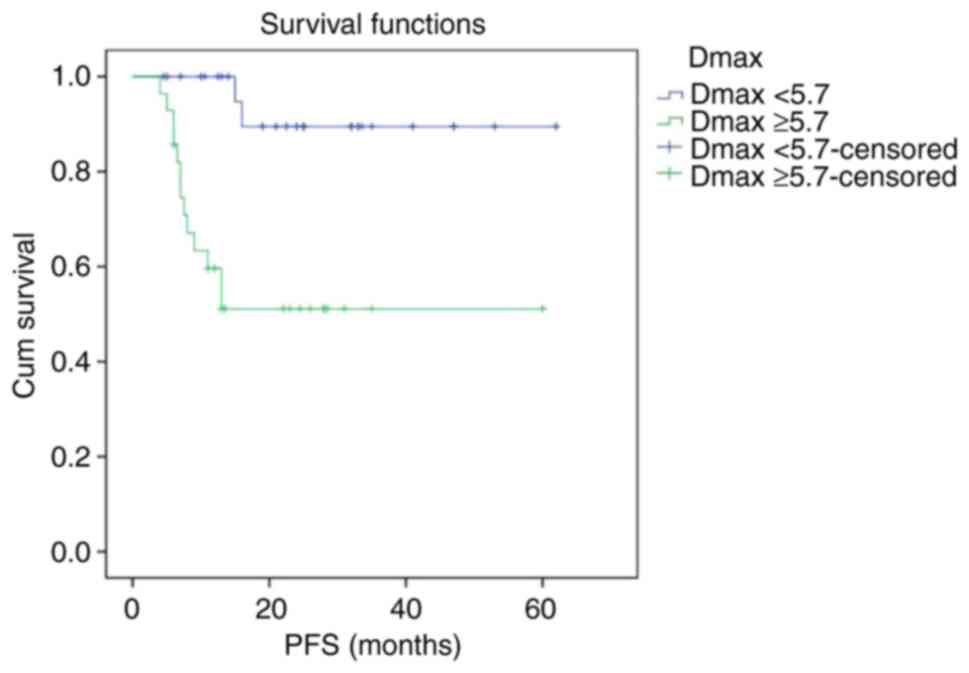
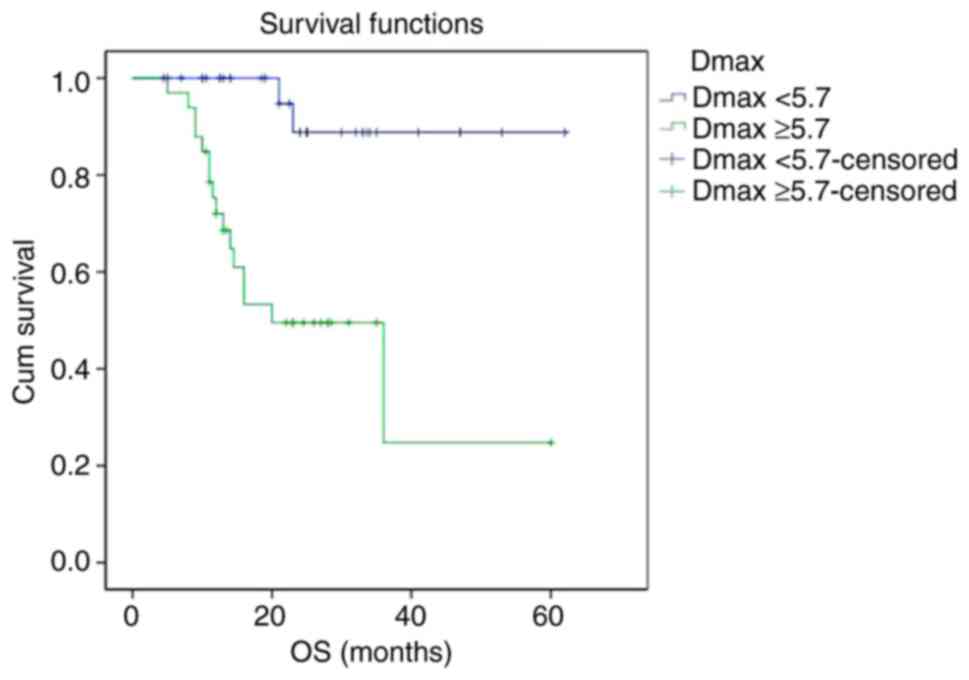
Kaplan-Meier survival curves showed that PFS and OS
curves of the Dmax ≥5.7 cm group were shown to be significantly
lower than that of the Dmax <5.7 cm group, respectively. The
2-year PFS rate of the Dmax <5.7 cm group and Dmax ≥5.7 cm group
were 88.8 and 49.5%, respectively (P<0.001). The 2-year OS rate
of the Dmax <5.7 cm group and Dmax ≥5.7 cm group were 89.5 and
51.1%, respectively (P<0.001) (Figs.
1 and 2).
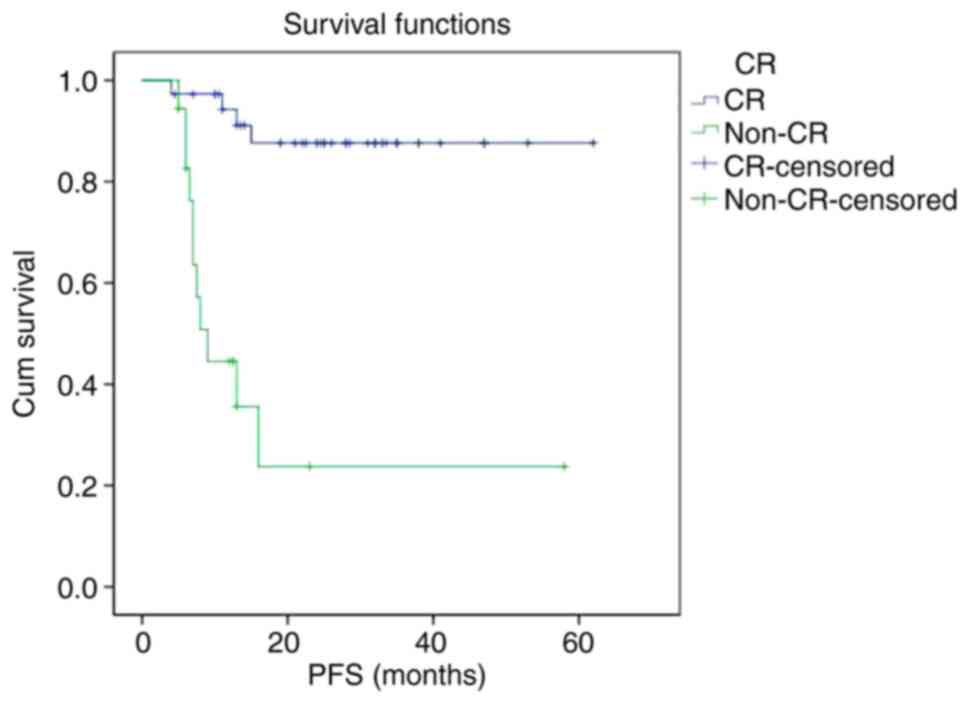
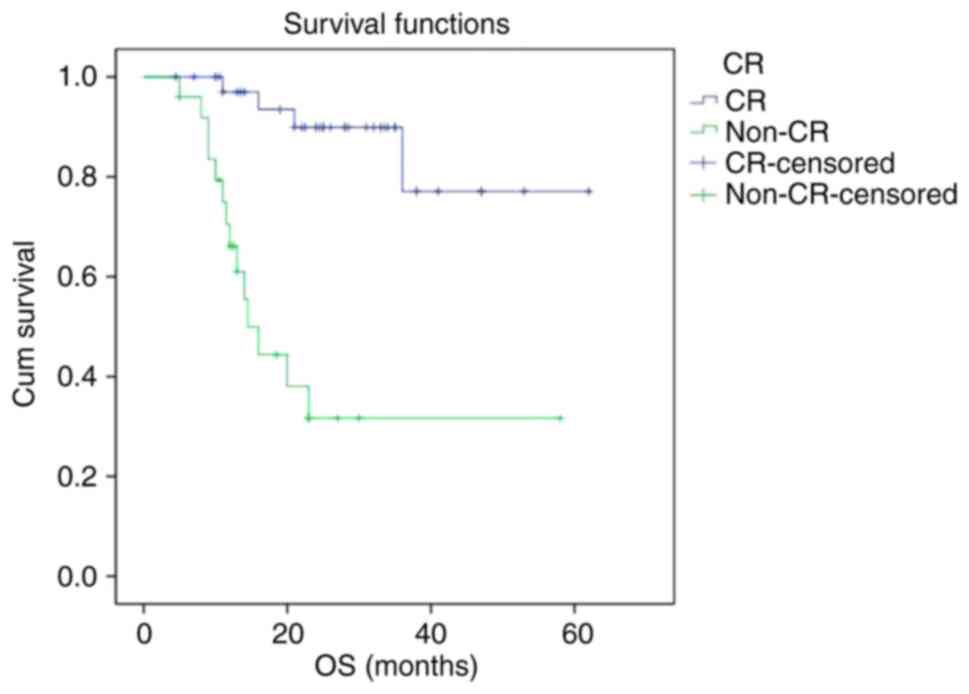
The PFS and OS curves of the non-CR group were
significantly lower than that of CR group, respectively. The 2-year
PFS rate of the CR group and non-CR group were 87.6 and 23.7%,
respectively (P<0.001). The 2-year OS rate of the CR group and
non-CR group were 89.9 and 31.7%, respectively (P<0.001)
(Figs. 3 and 4).
Prognostic value of the combination of
two factors
The AUC, sensitivity and specificity of the
combination of Dmax and interim treatment response for predicting
the 2-year PFS were 0.801, 73.9 and 92.7%, respectively. Compared
with single index Dmax, the predictive performance of the
combination was found to be slightly improved, the specificity was
significantly increased, while the sensitivity was slightly
decreased (Fig. 5). The AUC,
sensitivity and specificity of the combination of Dmax and interim
treatment response for predicting the 2-year OS were found to be
0.689, 76.5 and 76.6%, respectively. Compared with single index
Dmax, the predictive performance of the combination was decreased,
the specificity was slightly improved, and the sensitivity was
decreased (Fig. 6).
Discussion
The prognostic factors associated with diffuse large
B-cell lymphoma (DLBCL) patients receiving R-CHOP chemotherapy have
been the main research focus of both domestic as well as foreign
scholars. It is crucial to identify the patients who are at
high-risk of relapse and to select proper treatment strategies for
them. The International Prognostic Index (IPI), Revised R-IPI and
an Enhanced International Prognostic Index (NCCN-IPI) are currently
the internationally recognized prognostic indicators (14,15), and
are widely used in risk stratification before treatment, but their
prognostic value is challenged to some extent in the rituximab
treatment era. The present study confirmed the correlation between
IPI and 2-year progression-free survival (PFS) and overall survival
(OS) in DLBCL patients receiving R-CHOP chemotherapy, while
multivariate analysis showed that IPI is not an independent
predictor. This is similar to the results obtained by Kwon et
al (16). Clinical studies have
also revealed that although IPI can accurately evaluate the
prognosis in most of the patients with DLBCL, a part of patients
with similar IPI score still have different rates of long-term
survival (3,14). Therefore, individual characteristics
and response to chemotherapy of each patient are regarded as the
best indicators of prognosis.
Compared with IPI, baseline PET/CT parameters can
assist in quantifying the invasion and burden of tumors of
individuals, which may in turn be more advantageous in predicting
the prognosis and guiding personalized treatment plans. Of all the
baseline PET/CT parameters, Dmax was the only independent predictor
of 2-year PFS and OS in this study. This result suggests that the
tumor burden of the largest lesion acts as a more important
prognostic factor than the gross tumor burden. This is similar to
the result put forwarded by the previous clinical study by Parvez
et al (17). This study
further confirmed that patients with large masses usually have a
poor prognosis. Compared with other PET/CT parameters such as MTV
and TLG, Dmax can be easily obtained, and measurement of the
largest lesion might be the simplest and most feasible method for
predicting patient prognosis. In the present study, although MTV
and TLG were not found to be independent predictors of 2-year PFS
and OS, they were shown to be significantly associated with 2-year
PFS and OS. This further confirmed the prognostic value of baseline
PET/CT quantitative parameters. Kim et al (18) found TLG to be a better prognostic
indicator than IPI in DLBCL patients. A study conducted by Esfahani
et al (19) demonstrated that
TLG of the baseline PET/CT is the only independent risk factor for
PFS. Parvez et al (17)
studied 82 patients with invasive B-cell lymphoma and found that
MTV with SUV=3 or 6 as the threshold showed an association with OS.
Song et al (20) also suggest
that MTV is a prognostic factor for DLBCL. Although it is not
completely consistent with the results of our study, all the
findings discussed above indicate that baseline PET/CT quantitative
parameters are valuable for prognostic prediction and can assist
clinicians in identifying patients who are at high risk for
recurrence before treatment initiation. Yet, a few scholars have
come to a negative conclusion (21).
Gallicchio et al (22)
demonstrated that SUVmax is the most influential factor of
event-free survival (EFS) in DLBCL patients, while MTV and TLG are
not related with EFS. Adams et al (23) studied 73 DLBCL patients and found
that MTV and TLG were not associated with disease prognosis. The
main reason for this inconsistency might include distribution bias
of the enrolled patients, different methods and standards of
threshold selection for measurement and calculation of MTV and TLG,
different chemotherapy regimens and different predictive cut-off
time of survival. In the present study, relative threshold method
of 40% SUVmax was adopted as the threshold to measure MTV. For
patients with higher SUVmax, the absolute value of the threshold
remained relatively high, which may in turn lead to underestimation
of the actual tumor burden. Currently, there is no clear consensus
as to which threshold selection method is the most appropriate and
there are few literature data available on this (24). In this study, Dmax was found to act
as an independent predictor of 2-year PFS and OS, while MTV and TLG
did not. We speculated that this might be due to necrosis in the
large masses in some patients. In these patients, no uptake of
18F-FDG was observed in necrosis, and MTV and TLG might
underestimate the true tumor burden. In addition, there was no
significant correlation between SUVmax, SUVmean and PFS, OS in our
study, which is consistent with the results obtained by Manohar
et al (25). This indicates
that the tumor metabolism level is not the key factor that affects
prognosis. According to the results of this study, DLBCL patients
with high Dmax, MTV and TLG, even if the IPI score was low and
might have poor survival prospects, intensive treatment was
considered to improve their prognosis.
Previous literature has reported that interim
treatment response to first-line chemotherapy acts as an important
prognostic factor in DLBCL patients. Patients with poor interim
treatment response and positive interim PET are more likely to have
recurrence and progression, and the prognosis generally remains
worsened (26–29). Poor interim treatment response is an
indication for early clinical intervention, including salvage
treatment, intensive treatment or autologous stem cell
transplantation (30). The present
study showed that the risk of recurrence, progression and death
within 2 years in the non-CR patients were significantly higher
than that in CR patients, and interim treatment response acted as
an independent predictor of 2-year PFS and OS. This result is
similar to that obtained by previous studies. Huntington et
al (31) also believed that
patients with interim negative PET/CT or those who reached interim
CR had longer PFS and OS. Pregno et al (32) found that patients with interim
negative PET generally had a better prognosis, while interim
positive PET indicated no greater risk of recurrence.
Interim treatment response evaluation based on
PET/CT is regarded as an important prognostic factor in DLBCL
patients. The prognosis of patients who fail to respond to mid-term
chemotherapy was found to remain poor, but there is no clear
evidence that the prognostic value is better than IPI (33). In clinical practice, even patients
with a good interim treatment response and interim negative PET may
still have the potential to recur or progress to a later stage.
Therefore, it is not sufficient to judge prognosis based solely on
interim response to chemotherapy. In the present study, we combined
the two risk factors, baseline PET/CT parameters and interim
treatment response, in order to identify high-risk patients with
poor prognosis, aiming to provide valuable information for early
intervention. At present, there are few scholars who have evaluated
the prognosis of DLBCL patients with the combination of baseline
PET/CT metabolic parameters and interim treatment response, and
relevant reports are rare and the indicators adopted are different
(12,13,34).
Mikhaeel et al (12)
demonstrated improvement in the prognostic value of interim PET and
screened out the population with poor prognosis by combining the
baseline MTV and interim PET results. Zhang et al combined
baseline TLG >1036.61 g and ΔSUVmax <86.02% to predict the
recurrence or progression, showing good screening ability (13). Recently, Islam et al (8) found that baseline and interim PET/CT
parameters of MTV show important predictive value for PFS, and
could be helpful for guiding further treatment strategies in DLBCL
patients. In the present study, baseline PET/CT parameter Dmax was
screened through univariate and multivariate analyses. Compared
with single indicator Dmax, the combination of Dmax and interim
treatment response showed improved predictive efficiency for 2-year
PFS, but showed no improvement in the predictive efficiency of
2-year OS.
The limitations of this study mainly include four
aspects. Firstly, the sample size of this study is relatively small
and the results of this study require external verification in the
future. Secondly, we directly selected the median PET/CT parameters
as the cutoff value for classification of patients in this study.
Thus, the correlation of other cutoff points of variables with
survival need to be discussed. Thirdly, DLBCL subgroup analysis was
not performed in this study. The survival outcomes of DLBCL
patients in different molecular subtypes and gene expression
warrant further investigation. Finally, the follow-up time of some
cases was relatively short. Most of the positive events such as
recurrence, progression or death occur within 2 years after
diagnosis. Therefore, this study only conducted univariate and
multivariate analysis of 2-year PFS and OS. In future, follow-up of
these patients will be continued and 3- or 5-year survival analysis
will be conducted to further explore the prognostic value of
baseline PET/CT parameters.
In conclusion, baseline 18F-FDG PET/CT
parameters and interim treatment response have important prognostic
value in DLBCL patients receiving R-CHOP chemotherapy. Combined
application of Dmax and interim treatment response assists in
improving the predictive efficacy of 2-year PFS. It may be helpful
to identify patients who are at high risk of relapse and to guide
early clinical intervention for these patients.
Supplementary Material
Supporting Data
Acknowledgements
Not applicable.
Funding
No funding was received.
Availability of data and materials
The datasets used and/or analyzed during the current
study are available from the corresponding author on reasonable
request.
Authors contributions
LZ and YM designed the study and drafted the
manuscript. LG, HZ, YS and SL were responsible for the collection
and analysis of the experimental data. AW, XZ, JS, JZ and KX
revised the manuscript critically for important intellectual
content evaluating literature data. All authors read and approved
the final manuscript.
Ethics approval and consent to
participate
The study was approved by the Ethics Committee of
Affiliated Hospital of Xuzhou Medical University
(XYFY2016-KL002-01). Patient informed consent was waived due to the
retrospective nature of the present study.
Patient consent for publication
Not applicable.
Competing interests
The authors declare that they have no competing
interests.
References
|
1
|
Crombie JL and Armand P: Diffuse large
B-cell lymphoma and high-grade B-cell lymphoma: Genetic
classification and its implications for prognosis and treatment.
Hematol Oncol Clin North Am. 33:575–585. 2019. View Article : Google Scholar
|
|
2
|
International Non-Hodgkins Lymphoma
Prognostic Factors Project: A predictive model for aggressive
non-Hodgkins lymphoma. N Engl J Med. 329:987–994. 1993. View Article : Google Scholar
|
|
3
|
Vaidya R and Witzig TE: Prognostic factors
for diffuse large B-cell lymphoma in the R(X)CHOP era. Ann Oncol.
25:2124–2133. 2014. View Article : Google Scholar
|
|
4
|
Sampedro F, Domenech A and Escalera S:
Obtaining quantitative global tumoral state indicators based on
whole-body PET/CT scans: A breast cancer case study. Nucl Med
Commun. 35:362–371. 2014. View Article : Google Scholar
|
|
5
|
Park S, Moon SH, Park LC, Hwang DW, Ji JH,
Maeng CH, Cho SH, Ahn HK, Lee JY, Kim SJ, et al: The impact of
baseline and interim PET/CT parameters on clinical outcome in
patients with diffuse large B cell lymphoma. Am J Hematol.
87:937–940. 2012. View Article : Google Scholar
|
|
6
|
Koff JL and Flowers CR: Prognostic
modeling in diffuse large B-cell lymphoma in the era of
immunochemotherapy: Where do we go from here? Cancer.
123:3222–3225. 2017. View Article : Google Scholar
|
|
7
|
Reddy A, Zhang J, Davis NS, Moffitt AB,
Love CL, Waldrop A, Leppa S, Pasanen A, Meriranta L,
Karjalainen-Lindsberg ML, et al: Genetic and functional drivers of
diffuse large B cell lymphoma. Cell. 171:481–494.e15. 2017.
View Article : Google Scholar
|
|
8
|
Islam P, Goldstein J and Flowers CR:
PET-derived tumor metrics predict DLBCL response and
progression-free survival. Leuk Lymphoma. 60:1965–1971. 2019.
View Article : Google Scholar
|
|
9
|
Cottereau AS, Lanic H, Mareschal S,
Meignan M, Vera P, Tilly H, Jardin F and Becker S: Molecular
profile and FDG-PET/CT total metabolic tumor volume improve risk
classification at diagnosis for patients with diffuse large B-cell
lymphoma. Clin Cancer Res. 22:3801–3809. 2016. View Article : Google Scholar
|
|
10
|
Barrington SF, Mikhaeel NG, Kostakoglu L,
Meignan M, Hutchings M, Müeller SP, Schwartz LH, Zucca E, Fisher
RI, Trotman J, et al: Role of imaging in the staging and response
assessment of lymphoma: Consensus of the international conference
on malignant lymphomas imaging working group. J Clin Oncol.
32:3048–3058. 2014. View Article : Google Scholar
|
|
11
|
Cheson BD, Fisher RI, Barrington SF,
Cavalli F, Schwartz LH, Zucca E, Lister TA; Alliance, Australasian
Leukaemia and Lymphoma Group and Eastern Cooperative Oncology
Group; European Mantle Cell Lymphoma Consortium, ; et al:
Recommendations for initial evaluation, staging, and response
assessment Hodgkin and non-Hodgkin lymphoma: The Lugano
classification. J Clin Oncol. 32:3059–3068. 2014. View Article : Google Scholar
|
|
12
|
Mikhaeel NG, Smith D, Dunn JT, Phillips M,
Møller H, Fields PA, Wrench D and Barrington SF: Combination of
baseline metabolic tumour volume and early response on PET/CT
improves progression-free survival prediction in DLBCL. Eur J Nucl
Med Mol Imaging. 43:1209–1219. 2016. View Article : Google Scholar
|
|
13
|
Zhang YY, Song L, Zhao MX and Hu K: A
better prediction of progression-free survival in diffuse large
B-cell lymphoma by a prognostic model consisting of baseline TLG
and %ΔSUVmax. Cancer Med. 5:5137–5147. 2019. View Article : Google Scholar
|
|
14
|
Sehn LH, Berry B, Chhanabhai M, Fitzgerald
C, Gill K, Hoskins P, Klasa R, Savage KJ, Shenkier T, Sutherland J,
et al: The revised international prognostic index (R-IPI) is a
better predictor of outcome than the standard IPI for patients with
diffuse large B-cell lymphoma treated with R-CHOP. Blood.
109:1857–1861. 2007. View Article : Google Scholar
|
|
15
|
Zhou Z, Sehn LH, Rademaker AW, Gordon LI,
Lacasce AS, Crosby-Thompson A, Vanderplas A, Zelenetz AD, Abel GA,
Rodriguez MA, et al: An enhanced international prognostic index
(NCCN-IPI) for patients with diffuse large B-cell lymphoma treated
in the rituximab era. Blood. 123:837–842. 2014. View Article : Google Scholar
|
|
16
|
Kwon SH, Kang DR, Kim J, Yoon JK, Lee SJ,
Jeong SH, Lee HW and An YS: Prognostic value of negative interim
2-[18F]-fluoro-2-deoxy-d-glucose PET/CT in diffuse large
B-cell lymphoma. Clin Radiol. 71:280–286. 2016. View Article : Google Scholar
|
|
17
|
Parvez A, Tau N, Hussey D, Maganti M and
Metser U: 18F-FDG PET/CT metabolic tumor parameters and
radiomics features in aggressive non-Hodgkins lymphoma as
predictors of treatment outcome and survival. Ann Nucl Med.
32:410–416. 2018. View Article : Google Scholar
|
|
18
|
Kim TM, Paeng JC, Chun IK, Keam B, Jeon
YK, Lee SH, Kim DW, Lee DS, Kim CW, Chung JK, et al: Total lesion
glycolysis in positron emission tomography is a better predictor of
outcome than the international prognostic index for patients with
diffuse large B cell lymphoma. Cancer. 119:1195–1202. 2013.
View Article : Google Scholar
|
|
19
|
Esfahani SA, Heidari P, Halpern EF,
Hochberg EP, Palmer EL and Mahmood U: Baseline total lesion
glycolysis measured with 18F-FDG PET/CT as a predictor
of progression-free survival in diffuse large B-cell lymphoma: A
pilot study. Am J Nucl Med Mol Imaging. 3:272–281. 2013.
|
|
20
|
Song MK, Chung JS, Shin HJ, Lee SM, Lee
SE, Lee HS, Lee GW, Kim SJ, Lee SM and Chung DS: Clinical
significance of metabolic tumor volume by PET/CT in stages II and
III of diffuse large B cell lymphoma without extranodal site
involvement. Ann Hematol. 91:697–703. 2012. View Article : Google Scholar
|
|
21
|
Tatsumi M, Isohashi K, Matsunaga K, Watabe
T, Kato H, Kanakura Y and Hatazawa J: Volumetric and texture
analysis on FDG PET in evaluating and predicting treatment response
and recurrence after chemotherapy in follicular lymphoma. Int J
Clin Oncol. 24:1292–1300. 2019. View Article : Google Scholar
|
|
22
|
Gallicchio R, Mansueto G, Simeon V,
Nardelli A, Guariglia R, Capacchione D, Soscia E, Pedicini P,
Gattozzi D, Musto P and Storto G: F-18 FDG PET/CT quantization
parameters as predictors of outcome in patients with diffuse large
B-cell lymphoma. Eur J Haematol. 92:382–389. 2014. View Article : Google Scholar
|
|
23
|
Adams HJ, de Klerk JM, Fijnheer R,
Heggelman BG, Dubois SV, Nievelstein RA and Kwee TC: Prognostic
superiority of the national comprehensive cancer network
international prognostic index over pretreatment whole-body
volumetric-metabolic FDG PET/CT metrics in diffuse large B-cell
lymphoma. Eur J Haematol. 94:532–539. 2015. View Article : Google Scholar
|
|
24
|
Xie M, Zhai W, Cheng S, Zhang H, Xie Y and
He W: Predictive value of F-18 FDG PET/CT quantization parameters
for progression-free survival in patients with diffuse large B-cell
lymphoma. Hematology. 21:99–105. 2016. View Article : Google Scholar
|
|
25
|
Manohar K, Mittal BR, Bhattacharya A,
Malhotra P and Varma S: Prognostic value of quantitative parameters
derived on initial staging 18F-fluorodeoxyglucose positron emission
tomography/computed tomography in patients with high-grade
non-Hodgkins lymphoma. Nucl Med Commun. 33:974–981. 2012.
View Article : Google Scholar
|
|
26
|
Fuertes S, Setoain X, Lopez-Guillermo A,
Carrasco JL, Rodríguez S, Rovira J and Pons F: Interim FDG PET/CT
as a prognostic factor in diffuse large B-cell lymphoma. Eur J Nucl
Med Mol Imaging. 40:496–504. 2013. View Article : Google Scholar
|
|
27
|
Wu X, Pertovaara H, Korkola P, Vornanen M,
Järvenpää R, Dastidar P, Eskola H and Kellokumpu-Lehtinen PL: Early
interim PET/CT predicts post-treatment response in diffuse large
B-cell lymphoma. Acta Oncol. 53:1093–1099. 2014. View Article : Google Scholar
|
|
28
|
Oñate-Ocaña LF, Cortés V, Castillo-Llanos
R, Terrazas A, Garcia-Perez O, Pitalúa-Cortes Q, Ponce M,
Dueñas-Gonzalez A and Candelaria M: Metabolic tumor volume changes
assessed by interval 18fluorodeoxyglucose positron
emission tomography-computed tomography for the prediction of
complete response and survival in patients with diffuse large
B-cell lymphoma. Oncol Lett. 16:1411–1418. 2018.
|
|
29
|
Tateishi U, Tatsumi M, Terauchi T, Ando K,
Niitsu N, Kim WS, Suh C, Ogura M and Tobinai K: Prognostic
significance of metabolic tumor burden by positron emission
tomography/computed tomography in patients with relapsed/refractory
diffuse large B-cell lymphoma. Cancer Sci. 106:186–193. 2015.
View Article : Google Scholar
|
|
30
|
Petrich AM, Gandhi M, Jovanovic B,
Castillo JJ, Rajguru S, Yang DT, Shah KA, Whyman JD, Lansigan F,
Hernandez-Ilizaliturri FJ, et al: Impact of induction regimen and
stem cell transplantation on outcomes in double-hit lymphoma: A
multicenter retrospective analysis. Blood. 124:2354–2361. 2014.
View Article : Google Scholar
|
|
31
|
Huntington SF, Nasta SD, Schuster SJ,
Doshi JA and Svoboda J: Utility of interim and end-of-treatment
[18F]-fluorodeoxyglucose positron emission
tomography-computed tomography in front line therapy of patients
with diffuse large B-cell lymphoma. Leuk Lymphoma. 56:2579–2584.
2015. View Article : Google Scholar
|
|
32
|
Pregno P, Chiappela A, Bellò M, Botto B,
Ferrero S, Franceschetti S, Giunta F, Ladetto M, Limerutti G, Menga
M, et al: Interim 18-FDG-PET/CT failed to predict the outcome in
diffuse large B-cell lymphoma patients treated at the diagnosis
with rituximab-CHOP. Blood. 119:2066–2073. 2012. View Article : Google Scholar
|
|
33
|
Adams HJ and Kwee TC: Prognostic value of
interim FDG-PET in R-CHOP-treated diffuse large B-cell lymphoma:
Systematic review and meta-analysis. Crit Rev Oncol Hematol.
106:55–63. 2016. View Article : Google Scholar
|
|
34
|
Jiang SY, Qin Y, Liu P, Yang J, Yang S, He
X, Zhou S, Gui L, Zhang C, Zhou L, et al: A prognostic nomogram
constructed for relapsed or refractory diffuse large B-cell
lymphoma patients. Asia Pac J Clin Oncol. July 1–2019.(Online ahead
of print). simplehttps://doi.org/10.1111/ajco.13222 View Article : Google Scholar
|