Introduction
Rectosigmoid junction cancer accounts for 9% of
colorectal cancer (CRC) cases (1),
ranking third in terms of incidence (10.2%) and with the
second-highest mortality rate (9.2%) worldwide in 2018 (2). The rectosigmoid junction (C19.9) is
encoded as an independent segment of the intesimum crassum in the
International Classification of Disease for Oncology of the World
Health Organization (3).
To the best of our knowledge, few studies have
discussed rectosigmoid junction cancer, in which the rectosigmoid
junction was not entirely researched separately and was either
included in the colon or the rectum (4–7).
Meanwhile, the treatment of colorectal tumors has become
increasingly differentiated and individualized. Hence, there is an
urgent need of identifying effective potential molecular biomarkers
for the early diagnosis, prognosis and treatment of rectosigmoid
junction cancer.
In the last decade, regulatory networks composed of
long non-coding RNAs (lncRNAs), microRNAs (miRs/miRNAs) and mRNAs
have stimulated great interest in the research of molecular
biological mechanisms participating in the pathogenesis and
prognosis of tumors (8–10). The ceRNA theory was proposed by
Salmena et al (11) in 2011,
which established the existence of a complex post-transcriptional
regulatory network, where lncRNAs, mRNAs and other non-coding RNAs
share mutual miRNA response elements (MREs) with miRNAs, and that
ceRNAs can act as natural miRNA sponges to suppress miRNA function
by competitively binding to MREs on the target mRNA. In the ceRNA
network, lncRNAs function as ceRNAs to adjust the level of
protein-coding genes and take part in the regulation of cell
biology by sponging miRNAs (11).
In recent years, lncRNA-mediated ceRNA regulatory
networks were proven to be implicated in the tumorigenesis and
progression of CRC (12–17). Nevertheless, to the best of our
knowledge, a comprehensive analysis of the rectosigmoid junction
cancer-associated lncRNA-mediated ceRNA network has not been
performed.
The present study compared integrated RNA expression
profiles based on The Cancer Genome Atlas (TCGA) database between
69 tumor tissues and 7 normal tissues of rectosigmoid junction
cancer. Next, an integrated analysis was performed to select
aberrantly expressed lncRNAs, miRNAs and mRNAs. Finally, 9 lncRNAs,
16 miRNAs and 71 mRNAs were screened to build the lncRNA-miRNA-mRNA
ceRNA network. Furthermore, relevant overall survival (OS) analysis
of differentially expressed (DE)RNAs involved in the ceRNA network
was performed to screen significant prognostic biomarkers.
Materials and methods
Sequencing and clinical data
The RNA expression and corresponding clinical data
of patients with rectosigmoid junction cancer embedded in the
comprehensive analysis were obtained from the TCGA database
(https://portal.gdc.cancer.gov/). The
following exclusion criteria were used: i) Patients suffering
malignancies other than rectosigmoid junction cancer; ii) samples
with incomplete data for analysis; iii) duplicate samples; and iv)
patients who underwent preoperative neoadjuvant radiotherapy and
chemotherapy. Overall, data from a total of 69 tumor tissues and 7
normal tissues adjacent to surgically removed tumors were obtained
from 69 patients with rectosigmoid junction cancer. The patients
consisted of 35 males and 34 females, with a mean age of 63.9 years
and a median age of 67 years (age range, 31–90 years). The RNA and
miRNA sequence data from the 76 cases originated from Illumina
HiSeq2000 and Illumina Genome Analyzer IIX platforms. Their
detailed information is shown in Table
SI. The Union for International Cancer Control/American Joint
Committee on Cancer TNM staging system was used (18).
Aberrant expression analysis
Multiple data, including sequencing and clinical
data, were analyzed by running the ‘gdcDEAnalysis’ package in
R-Portable language software (v3.5.1; http://www.r-project.org/). Adjusted P<0.01 and
log2[fold-change (FC)]>2.0 were set as statistical significance
for DElncRNAs and DEmRNAs, while log2(FC)>2.5 and
adjusted P<0.01 were considered for DEmiRNAs. LogFC >0 was
set to high expression, and logFC <0 was set to low expression.
For the screening of DElncRNAs, DEmiRNAs and DEmRNAs, volcano maps
were generated using the ‘gdcVolcanoPlot’ package (v1.1.1) in
R.
Functional enrichment analysis
The Gene Ontology (GO) analysis and the Kyoto
Encyclopedia of Genes and Genomes (KEGG) pathway analysis of
DEmRNAs were performed using the R platform. A KEGG pathway or GO
term with a false discovery rate (FDR) <0.01 was considered
statistically significant. The GO analysis of the cellular
component (CC), molecular function (MF) and biological process
(BP), and the enriched pathways of DEmRNAs were ranked by
enrichment score [-log10(P-value)] and performed to
investigate the underlying function of all DEmRNAs.
Formation of the lncRNA-miRNA-mRNA
network
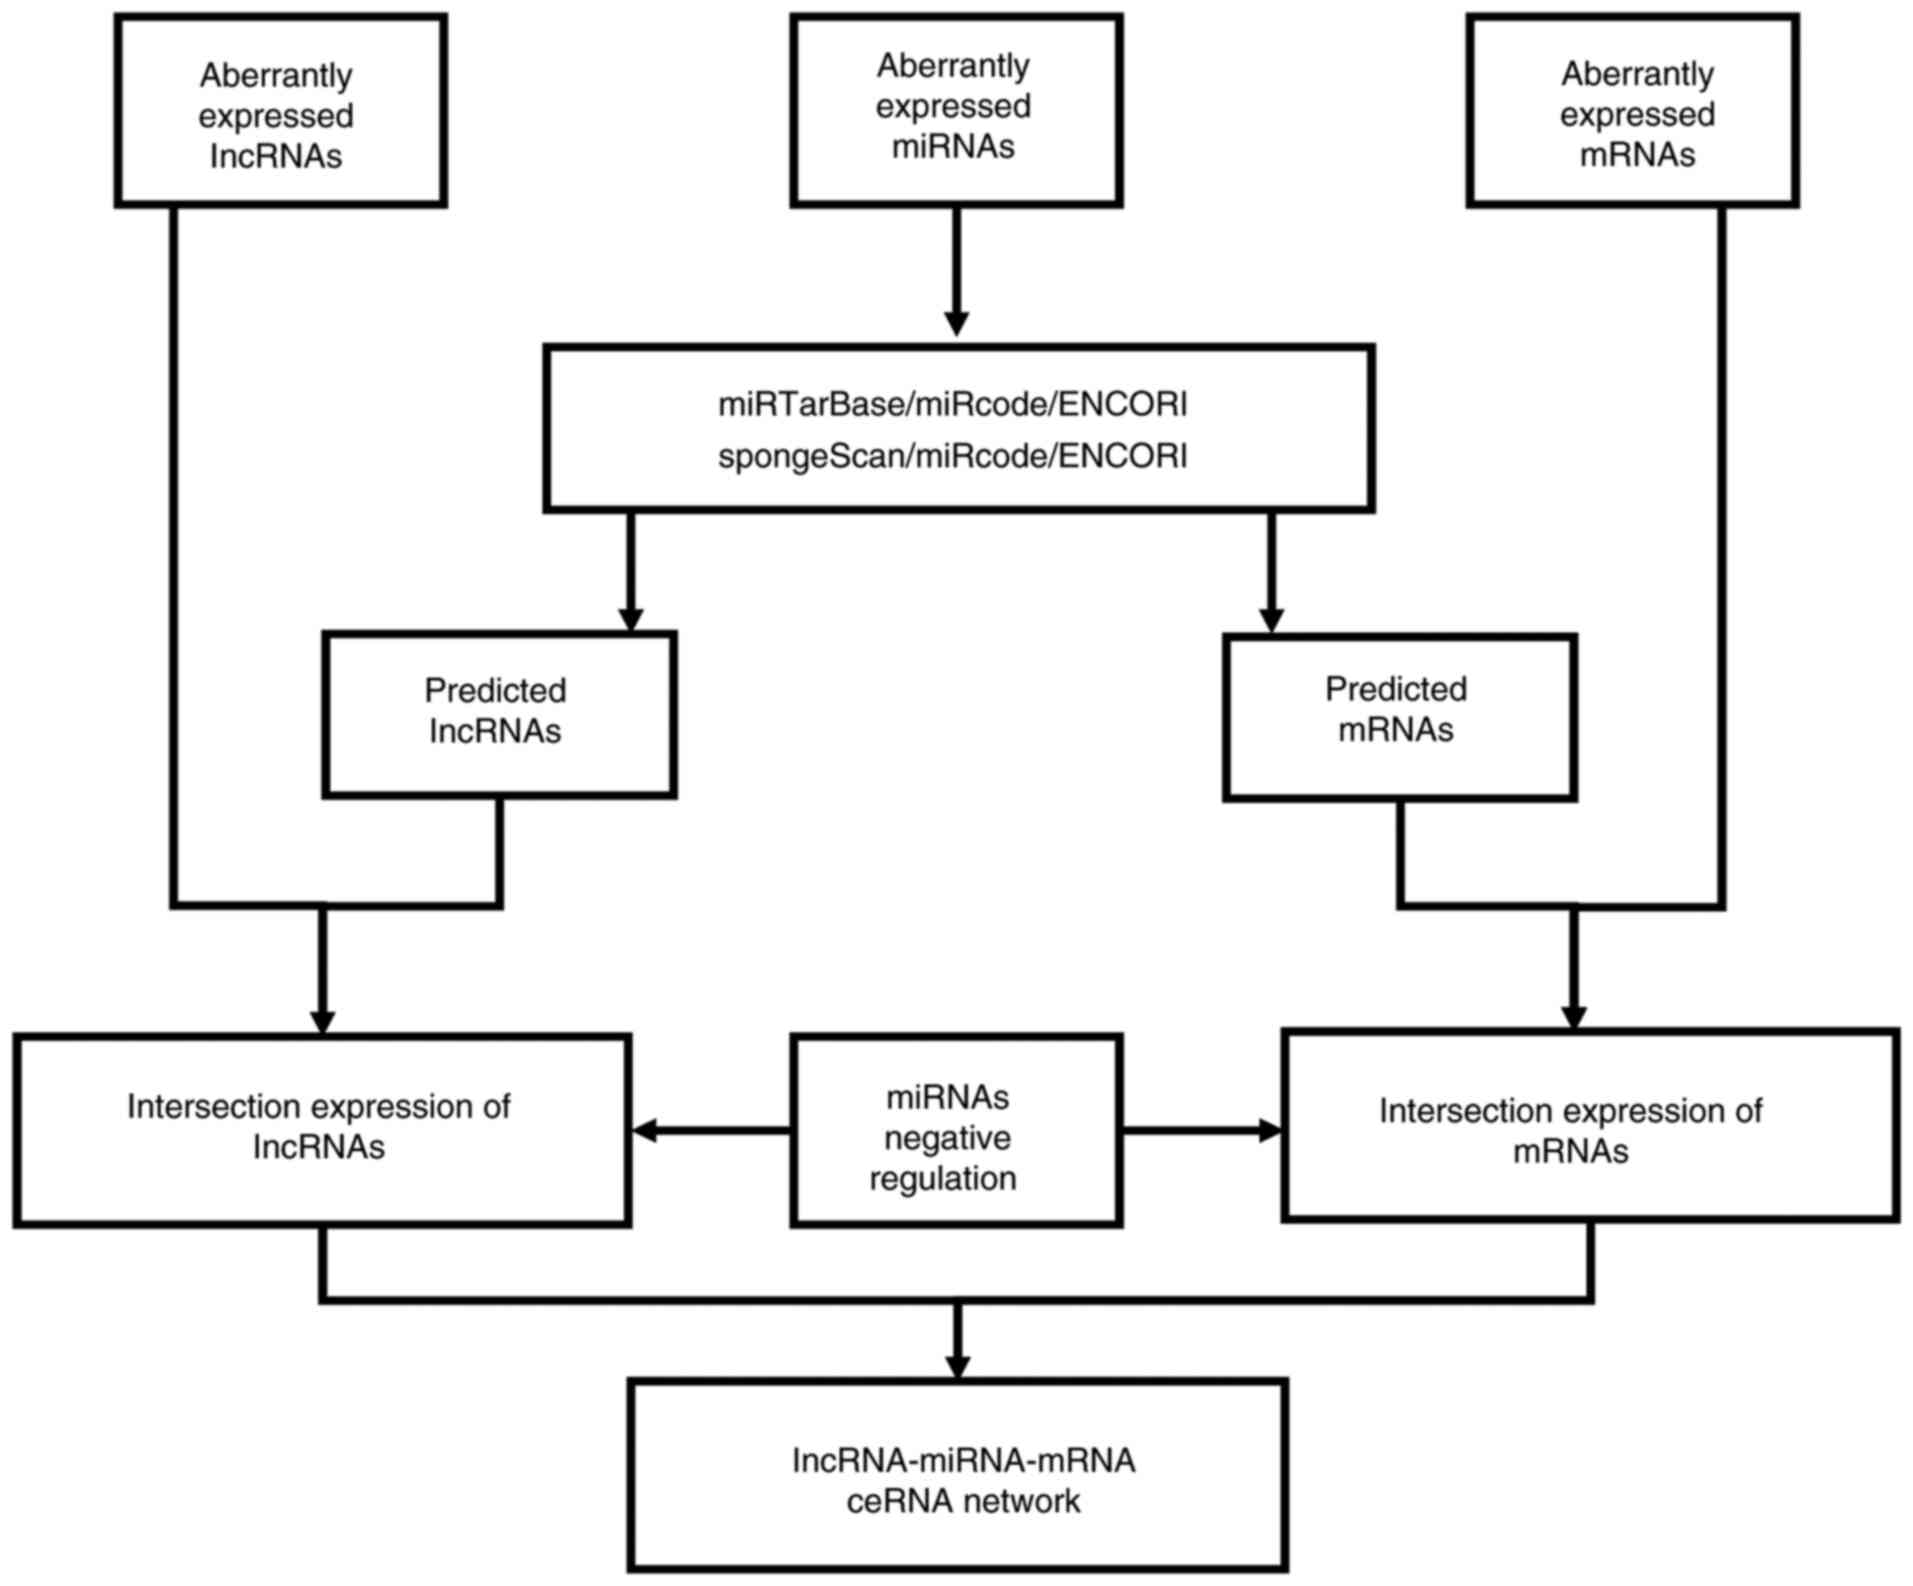
The lncRNA-miRNA-mRNA ceRNA network was based on the
hypothesis that lncRNAs can directly interact with miRNA sponges to
influence the bioactivity of mRNAs (11). The ceRNA network of rectosigmoid
junction cancer was established as follows.
Firstly, highly reliable miRNA reference databases
[mirTarBase (19) (http://mirtarbase.mbc.nctu.edu.tw/php/index.php),
miRcode (http://www.mircode.org/) and ENCORI
(20) (http://starbase.sysu.edu.cn/)] were utilised to
determine miRNA-targeted mRNAs. Subsequently, miRNA-targeted
lncRNAs were retrieved from SpongeScan (http://spongescan.rc.ufl.edu/), miRcode and ENCORI
databases. The intersection of the overlapping predicted results,
DElncRNAs and DEmRNAs was then obtained. Furthermore, the miRNAs
negatively regulating the intersection expression of lncRNAs and
mRNAs were selected based on the aforementioned ceRNA hypothesis.
The lncRNA-miRNA-mRNA network was visualized using Cytoscape v3.6.1
(https://cytoscape.org/). The process of ceRNA
network construction is shown in the flowchart presented in
Fig. 1.
Generation of functional
lncRNA-miRNA-mRNA regulatory modules
In order to screen the functional lncRNA-miRNA-mRNA
regulatory modules of rectosigmoid junction cancer, the degree,
Maximal Clique Centrality (MCC), betweenness centrality and
closeness centrality of lncRNAs were calculated using the cytoHubba
plugin on Cytoscape v3.6.1. The overlapping top-ranked lncRNAs
among the four calculation methods were extracted.
Survival analysis of candidate
RNAs
To identify prognostic DERNA signatures, the
survival curves of all RNAs involved in the ceRNA network were
plotted using the R survival package (v1.1.1). Univariate survival
analysis was estimated based on the Kaplan-Meier curve analysis
using the log-rank test. Unless otherwise stated, P<0.05 was
considered to indicate a statistically significant difference.
Results
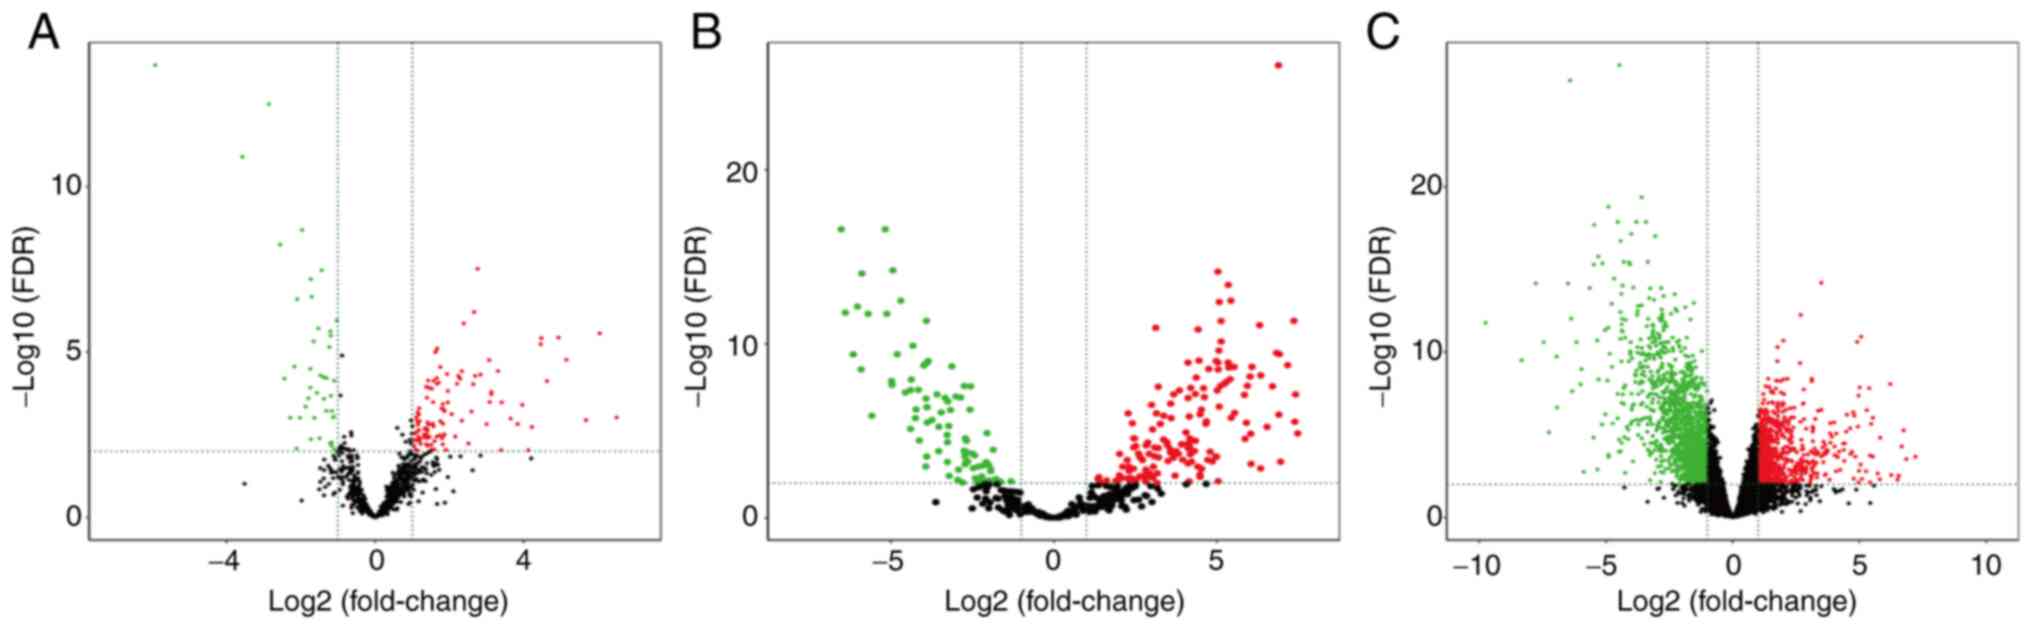
Identification of DElncRNAs
A total of 151 DElncRNAs were identified by running
the ‘gdcDEAnalysis’ package in R. As a result, 109 (72.19%)
upregulated and 42 (27.81%) downregulated DElncRNAs were identified
(Fig. 2A). The top 21 upregulated
and 21 downregulated lncRNAs, and the related logFC, P-values and
FDR values, are listed in Table
I.
 | Table I.Top 21 upregulated and 21
downregulated differentially expressed long non-coding RNAs in
rectosigmoid junction cancer samples. |
Table I.
Top 21 upregulated and 21
downregulated differentially expressed long non-coding RNAs in
rectosigmoid junction cancer samples.
| A, Upregulated |
|---|
|
|---|
| Name | log(FC) | P-value | FDR |
|---|
| MAFG-AS1 | 2.752340839 |
6.67×10⁻¹⁰ |
3.10×10−08 |
| PVT1 | 2.657857958 |
2.18×10−08 |
6.25×10−07 |
| SNHG17 | 2.378579537 |
5.72×10−08 |
1.39×10−06 |
| LINC02253 | 6.040229343 |
1.30×10−07 |
2.77×10−06 |
| BLACAT1 | 4.927333574 |
1.84×10−07 |
3.72×10−06 |
| AC021218.1 | 4.467747207 |
1.93×10−07 |
3.85×10−06 |
| MGC32805 | 4.452660405 |
3.21×10−07 |
5.85×10−06 |
| SNHG15 | 1.667019645 |
4.62×10−07 |
8.02×10−06 |
| CAPN10-AS1 | 1.622484665 |
6.05×10−07 |
1.01×10−05 |
| CASC21 | 5.142108745 |
1.14×10−06 |
1.73×10−05 |
| LINC01605 | 3.06645948 |
1.16×10−06 |
1.76×10−05 |
| LINC01232 | 1.751414603 |
2.04×10−06 |
2.84×10−05 |
| CRNDE | 3.301683337 |
2.89×10−06 |
3.79×10−05 |
| AL121832.3 | 2.327872764 |
2.93×10−06 |
3.84×10−05 |
| MIR4435-2HG | 1.932326125 |
3.66×10−06 |
4.68×10−05 |
| MIR17HG | 2.827330119 |
3.84×10−06 |
4.86×10−05 |
| VPS9D1-AS1 | 2.686552396 |
4.25×10−06 |
5.29×10−05 |
| AC073335.2 | 2.234963344 |
4.26×10−06 |
5.29×10−05 |
| ZFAS1 | 1.656374536 |
5.13×10−06 |
6.19×10−05 |
| FOXP4-AS1 | 2.284408492 |
5.42×10−06 |
6.49×10−05 |
| SNHG20 | 1.424697676 |
6.31×10−06 |
7.32×10−05 |
|
| B,
Downregulated |
|
| Name | log(FC) | P-value | FDR |
|
| CDKN2B-AS1 | −5.926520656 |
4.05×10⁻¹⁷ |
2.15×10⁻¹⁴ |
| MBNL1-AS1 | −2.861799886 |
9.56×10⁻¹⁶ |
3.30×10⁻¹³ |
| HAGLR | −3.577536261 |
6.83×10⁻¹⁴ |
1.28×10⁻¹¹ |
| AC016027.1 | −1.97046862 |
2.68×10⁻¹¹ |
2.06×10−09 |
| AC106869.1 | −2.561290755 |
9.22×10⁻¹¹ |
5.72×10−09 |
| PDCD4-AS1 | −1.440015713 |
7.53×10⁻¹⁰ |
3.44×10−08 |
| MIR22HG | −1.735841168 |
1.49×10−09 |
6.29×10−08 |
| B4GALT1-AS1 | −1.711349731 |
6.23×10−09 |
2.17×10−07 |
| ZNF667-AS1 | −2.1010172 |
7.62×10−09 |
2.57×10−07 |
| LINC00294 | −1.035031181 |
4.44×10−08 |
1.14×10−06 |
| LINC00641 | −1.533058923 |
8.46×10−08 |
1.94×10−06 |
| AL691432.2 | −1.206788789 |
1.09×10−07 |
2.39×10−06 |
| AC006333.2 | −1.201587737 |
1.57×10−07 |
3.25×10−06 |
| ZNF710-AS1 | −1.66124648 |
2.57×10−07 |
4.85×10−06 |
| U91328.2 | −1.235272793 |
4.09×10−07 |
7.20×10−06 |
| FENDRR | −2.175974452 |
2.00×10−06 |
2.79×10−05 |
| AC016888.1 | −1.749061747 |
2.42×10−06 |
3.27×10−05 |
| AL135905.2 | −1.476920272 |
4.08×10−06 |
5.13×10−05 |
| AP002761.4 | −1.384651324 |
4.75×10−06 |
5.79×10−05 |
| AL662844.4 | −1.308823325 |
5.14×10−06 |
6.19×10−05 |
| LINC02441 | −2.443144586 |
5.33×10−06 |
6.38×10−05 |
Identification of DEmiRNAs
A total of 243 DEmiRNAs were identified using the
‘gdcDEAnalysis’ package in R. As shown in Fig. 2B, there were 155 (63.79%) upregulated
and 88 (36.21%) downregulated DEmiRNAs. The top 21 upregulated and
21 downregulated lncRNAs, and the related logFC, P-values and FDR
values are listed in Table II.
| Table II.Top 21 upregulated and 21
downregulated differentially expressed miRNAs in rectosigmoid
junction cancer samples. |
Table II.
Top 21 upregulated and 21
downregulated differentially expressed miRNAs in rectosigmoid
junction cancer samples.
| A, Upregulated |
|---|
|
|---|
| Name | log(FC) | P-value | FDR |
|---|
| hsa-miR-21-5p | 6.884706944 |
2.22×10⁻²⁹ |
1.01×10⁻²⁶ |
| hsa-miR-126-3p | 5.027647848 |
9.38×10⁻¹⁷ |
7.12×10⁻¹⁵ |
| hsa-miR-101-3p | 5.347152405 |
7.17×10⁻¹⁶ |
4.08×10⁻¹⁴ |
|
hsa-miR-106b-5p | 5.429063826 |
7.18×10⁻¹⁵ |
3.27×10⁻¹³ |
|
hsa-miR-24-2-5p | 5.070084953 |
9.31×10⁻¹⁵ |
3.85×10⁻¹³ |
| hsa-miR-452-5p | 7.358520015 |
1.68×10⁻¹³ |
4.71×10⁻¹² |
| hsa-miR-192-5p | 5.126016035 |
1.92×10⁻¹³ |
4.85×10⁻¹² |
| hsa-miR-141-3p | 6.308116527 |
3.48×10⁻¹³ |
8.33×10⁻¹² |
| hsa-miR-24-3p | 3.122933649 |
5.22×10⁻¹³ |
1.19×10⁻¹¹ |
| hsa-miR-194-5p | 4.418901392 |
6.84×10⁻¹³ |
1.48×10⁻¹¹ |
| hsa-miR-379-5p | 5.130530865 |
3.49×10⁻¹² |
7.22×10⁻¹¹ |
| hsa-miR-889-3p | 5.058722699 |
1.26×10⁻¹¹ |
2.38×10⁻¹⁰ |
| hsa-miR-429 | 6.825921399 |
1.78×10⁻¹¹ |
3.24×10⁻¹⁰ |
| hsa-miR-19b-3p | 6.910550025 |
2.17×10⁻¹¹ |
3.80×10⁻¹⁰ |
|
hsa-miR-130b-3p | 4.447213787 |
5.73×10⁻¹¹ |
8.99×10⁻¹⁰ |
| hsa-miR-140-5p | 4.976522784 |
6.45×10⁻¹¹ |
9.47×10⁻¹⁰ |
| hsa-miR-16-5p | 5.352104156 |
9.06×10⁻¹¹ |
1.17×10−09 |
| hsa-miR-141-5p | 5.336691795 |
8.98×10⁻¹¹ |
1.17×10−09 |
|
hsa-miR-200a-3p | 5.028635315 |
9.22×10⁻¹¹ |
1.17×10−09 |
| hsa-miR-26b-5p | 4.109853806 |
9.13×10⁻¹¹ |
1.17×10−09 |
|
hsa-miR-374a-3p | 7.166807838 |
1.32×10⁻¹⁰ |
1.63×10−09 |
|
| B,
Downregulated |
|
| Name | log(FC) | P-value | FDR |
|
| hsa-miR-766-3p | −5.176574242 |
2.30×10⁻¹⁹ |
2.61×10⁻¹⁷ |
| hsa-miR-197-3p | −5.178244912 |
2.09×10⁻¹⁹ |
2.61×10⁻¹⁷ |
| hsa-miR-328-3p | −6.527470364 |
2.25×10⁻¹⁹ |
2.61×10⁻¹⁷ |
| hsa-let-7d-3p | −4.940073713 |
6.56×10⁻¹⁷ |
5.97×10⁻¹⁵ |
| hsa-miR-139-5p | −5.893898996 |
1.40×10⁻¹⁶ |
9.09×10⁻¹⁵ |
|
hsa-miR-1306-5p | −4.697991354 |
6.86×10⁻¹⁵ |
3.27×10⁻¹³ |
|
hsa-miR-6511b-3p | −6.027857145 |
1.86×10⁻¹⁴ |
7.07×10⁻¹³ |
| hsa-miR-129-5p | −6.398340279 |
4.50×10⁻¹⁴ |
1.57×10⁻¹² |
| hsa-miR-574-3p | −5.128565486 |
6.02×10⁻¹⁴ |
1.83×10⁻¹² |
| hsa-miR-149-5p | −5.701365419 |
5.87×10⁻¹⁴ |
1.83×10⁻¹² |
| hsa-miR-99b-5p | −3.912360633 |
1.76×10⁻¹³ |
4.71×10⁻¹² |
| hsa-miR-195-3p | −4.325681902 |
6.36×10⁻¹² |
1.26×10⁻¹⁰ |
|
hsa-miR-125a-5p | −4.807276424 |
2.32×10⁻¹¹ |
3.91×10⁻¹⁰ |
| hsa-miR-139-3p | −6.158797314 |
2.43×10⁻¹¹ |
3.94×10⁻¹⁰ |
| hsa-let-7e-3p | −3.856910446 |
6.25×10⁻¹¹ |
9.47×10⁻¹⁰ |
| hsa-miR-1976 | −3.895162028 |
9.09×10⁻¹¹ |
1.17×10−09 |
|
hsa-miR-378a-5p | −3.988573695 |
1.40×10⁻¹⁰ |
1.68×10−09 |
| hsa-let-7b-3p | −3.134133079 |
1.61×10⁻¹⁰ |
1.88×10−09 |
| hsa-miR-486-5p | −5.916429249 |
2.81×10⁻¹⁰ |
2.85×10−09 |
|
hsa-miR-193a-5p | −4.373097741 |
1.21×10−09 |
1.10×10−08 |
|
hsa-miR-642a-5p | −4.982818274 |
1.48×10−09 |
1.32×10−08 |
Identification of DEmRNAs
A total of 2,231 DEmRNAs were selected using the
‘gdcDEAnalysis’ package. As shown in Fig. 2C, 793 (35.54%) DEmRNAs were
upregulated and 1,438 (64.46%) DEmRNAs were downregulated. The top
21 upregulated and 21 downregulated lncRNAs, and the related logFC,
P-values and FDR values are listed in Table III.
| Table III.Top 21 upregulated and 21
downregulated differentially expressed mRNAs in rectosigmoid
junction cancer samples. |
Table III.
Top 21 upregulated and 21
downregulated differentially expressed mRNAs in rectosigmoid
junction cancer samples.
| A, Upregulated |
|---|
|
|---|
| Name | log(FC) | P-value | FDR |
|---|
| TGFBI | 3.490648701 |
8.74×10⁻¹⁸ |
6.49×10⁻¹⁵ |
| NFE2L3 | 2.676746374 |
1.85×10⁻¹⁵ |
5.72×10⁻¹³ |
| ETV4 | 5.060920019 |
6.19×10⁻¹⁴ |
1.19×10⁻¹¹ |
| NEBL | 1.988240629 |
1.25×10⁻¹³ |
2.06×10⁻¹¹ |
| CDH3 | 4.902363409 |
1.52×10⁻¹³ |
2.45×10⁻¹¹ |
| GRAMD1A | 1.756550954 |
3.72×10⁻¹³ |
5.09×10⁻¹¹ |
| KAT2A | 1.753706981 |
3.56×10⁻¹² |
3.55×10⁻¹⁰ |
| FUT1 | 2.650628542 |
4.84×10⁻¹² |
4.67×10⁻¹⁰ |
| GTF2IRD1 | 2.158124288 |
5.98×10⁻¹¹ |
4.17×10−09 |
| CARD14 | 3.115786643 |
6.05×10⁻¹¹ |
4.18×10−09 |
| DKC1 | 1.389511094 |
6.06×10⁻¹¹ |
4.18×10−09 |
| SOX9 | 1.996396591 |
6.43×10⁻¹¹ |
4.41×10−09 |
| CBX8 | 1.700207115 |
8.05×10⁻¹¹ |
5.24×10−09 |
| ENC1 | 1.754690772 |
8.47×10⁻¹¹ |
5.42×10−09 |
| SLC6A6 | 3.116405062 |
9.10×10⁻¹¹ |
5.70×10−09 |
| VEGFA | 1.894191494 |
9.10×10⁻¹¹ |
5.70×10−09 |
| KRT80 | 6.211404628 |
1.52×10⁻¹⁰ |
8.69×10−09 |
| XPO5 | 1.289131767 |
2.15×10⁻¹⁰ |
1.17×10−08 |
| NOP2 | 1.428528716 |
2.53×10⁻¹⁰ |
1.35×10−08 |
| SALL4 | 5.004008301 |
2.62×10⁻¹⁰ |
1.38×10−08 |
| STPG4 | 5.379593583 |
3.00×10⁻¹⁰ |
1.55×10−08 |
|
| B,
Downregulated |
|
| Name | log(FC) | P-value | FDR |
|
| CLEC3B | −4.476185728 |
2.90×10⁻³² |
4.31×10⁻²⁸ |
| BEST4 | −6.422652094 |
4.95×10⁻³¹ |
3.67×10⁻²⁷ |
| GCNT2 | −3.601840574 |
8.79×10⁻²⁴ |
4.34×10⁻²⁰ |
| LYVE1 | −4.911974763 |
4.40×10⁻²³ |
1.63×10⁻¹⁹ |
| FAM107A | −3.43110438 |
6.40×10⁻²² |
1.36×10⁻¹⁸ |
| LIFR | −3.8063879 |
5.06×10⁻²² |
1.36×10⁻¹⁸ |
| ABCG2 | −4.544022652 |
5.74×10⁻²² |
1.36×10⁻¹⁸ |
| ABCA8 | −5.474165401 |
1.09×10⁻²¹ |
2.02×10⁻¹⁸ |
| GLDN | −4.008350765 |
4.32×10⁻²¹ |
7.12×10⁻¹⁸ |
| GNG7 | −3.06421636 |
6.59×10⁻²¹ |
9.78×10⁻¹⁸ |
| PKIB | −4.432199222 |
1.41×10⁻²⁰ |
1.90×10⁻¹⁷ |
| MT1M | −5.317272589 |
1.35×10⁻¹⁹ |
1.67×10⁻¹⁶ |
| RNF152 | −3.354536011 |
3.38×10⁻¹⁹ |
3.58×10⁻¹⁶ |
| SCN9A | −4.300397577 |
3.17×10⁻¹⁹ |
3.58×10⁻¹⁶ |
| C2orf88 | −4.094084525 |
3.87×10⁻¹⁹ |
3.82×10⁻¹⁶ |
| ALPI | −5.148481336 |
4.75×10⁻¹⁹ |
4.40×10⁻¹⁶ |
| SULT1A2 | −4.06180475 |
6.24×10⁻¹⁹ |
5.15×10⁻¹⁶ |
| SFRP1 | −5.485109328 |
6.03×10⁻¹⁹ |
5.15×10⁻¹⁶ |
| TNXB | −4.688553804 |
4.63×10⁻¹⁸ |
3.61×10⁻¹⁵ |
| ADH1B | −6.502588649 |
1.03×10⁻¹⁷ |
7.12×10⁻¹⁵ |
| AQP8 | −7.780183426 |
1.06×10⁻¹⁷ |
7.12×10⁻¹⁵ |
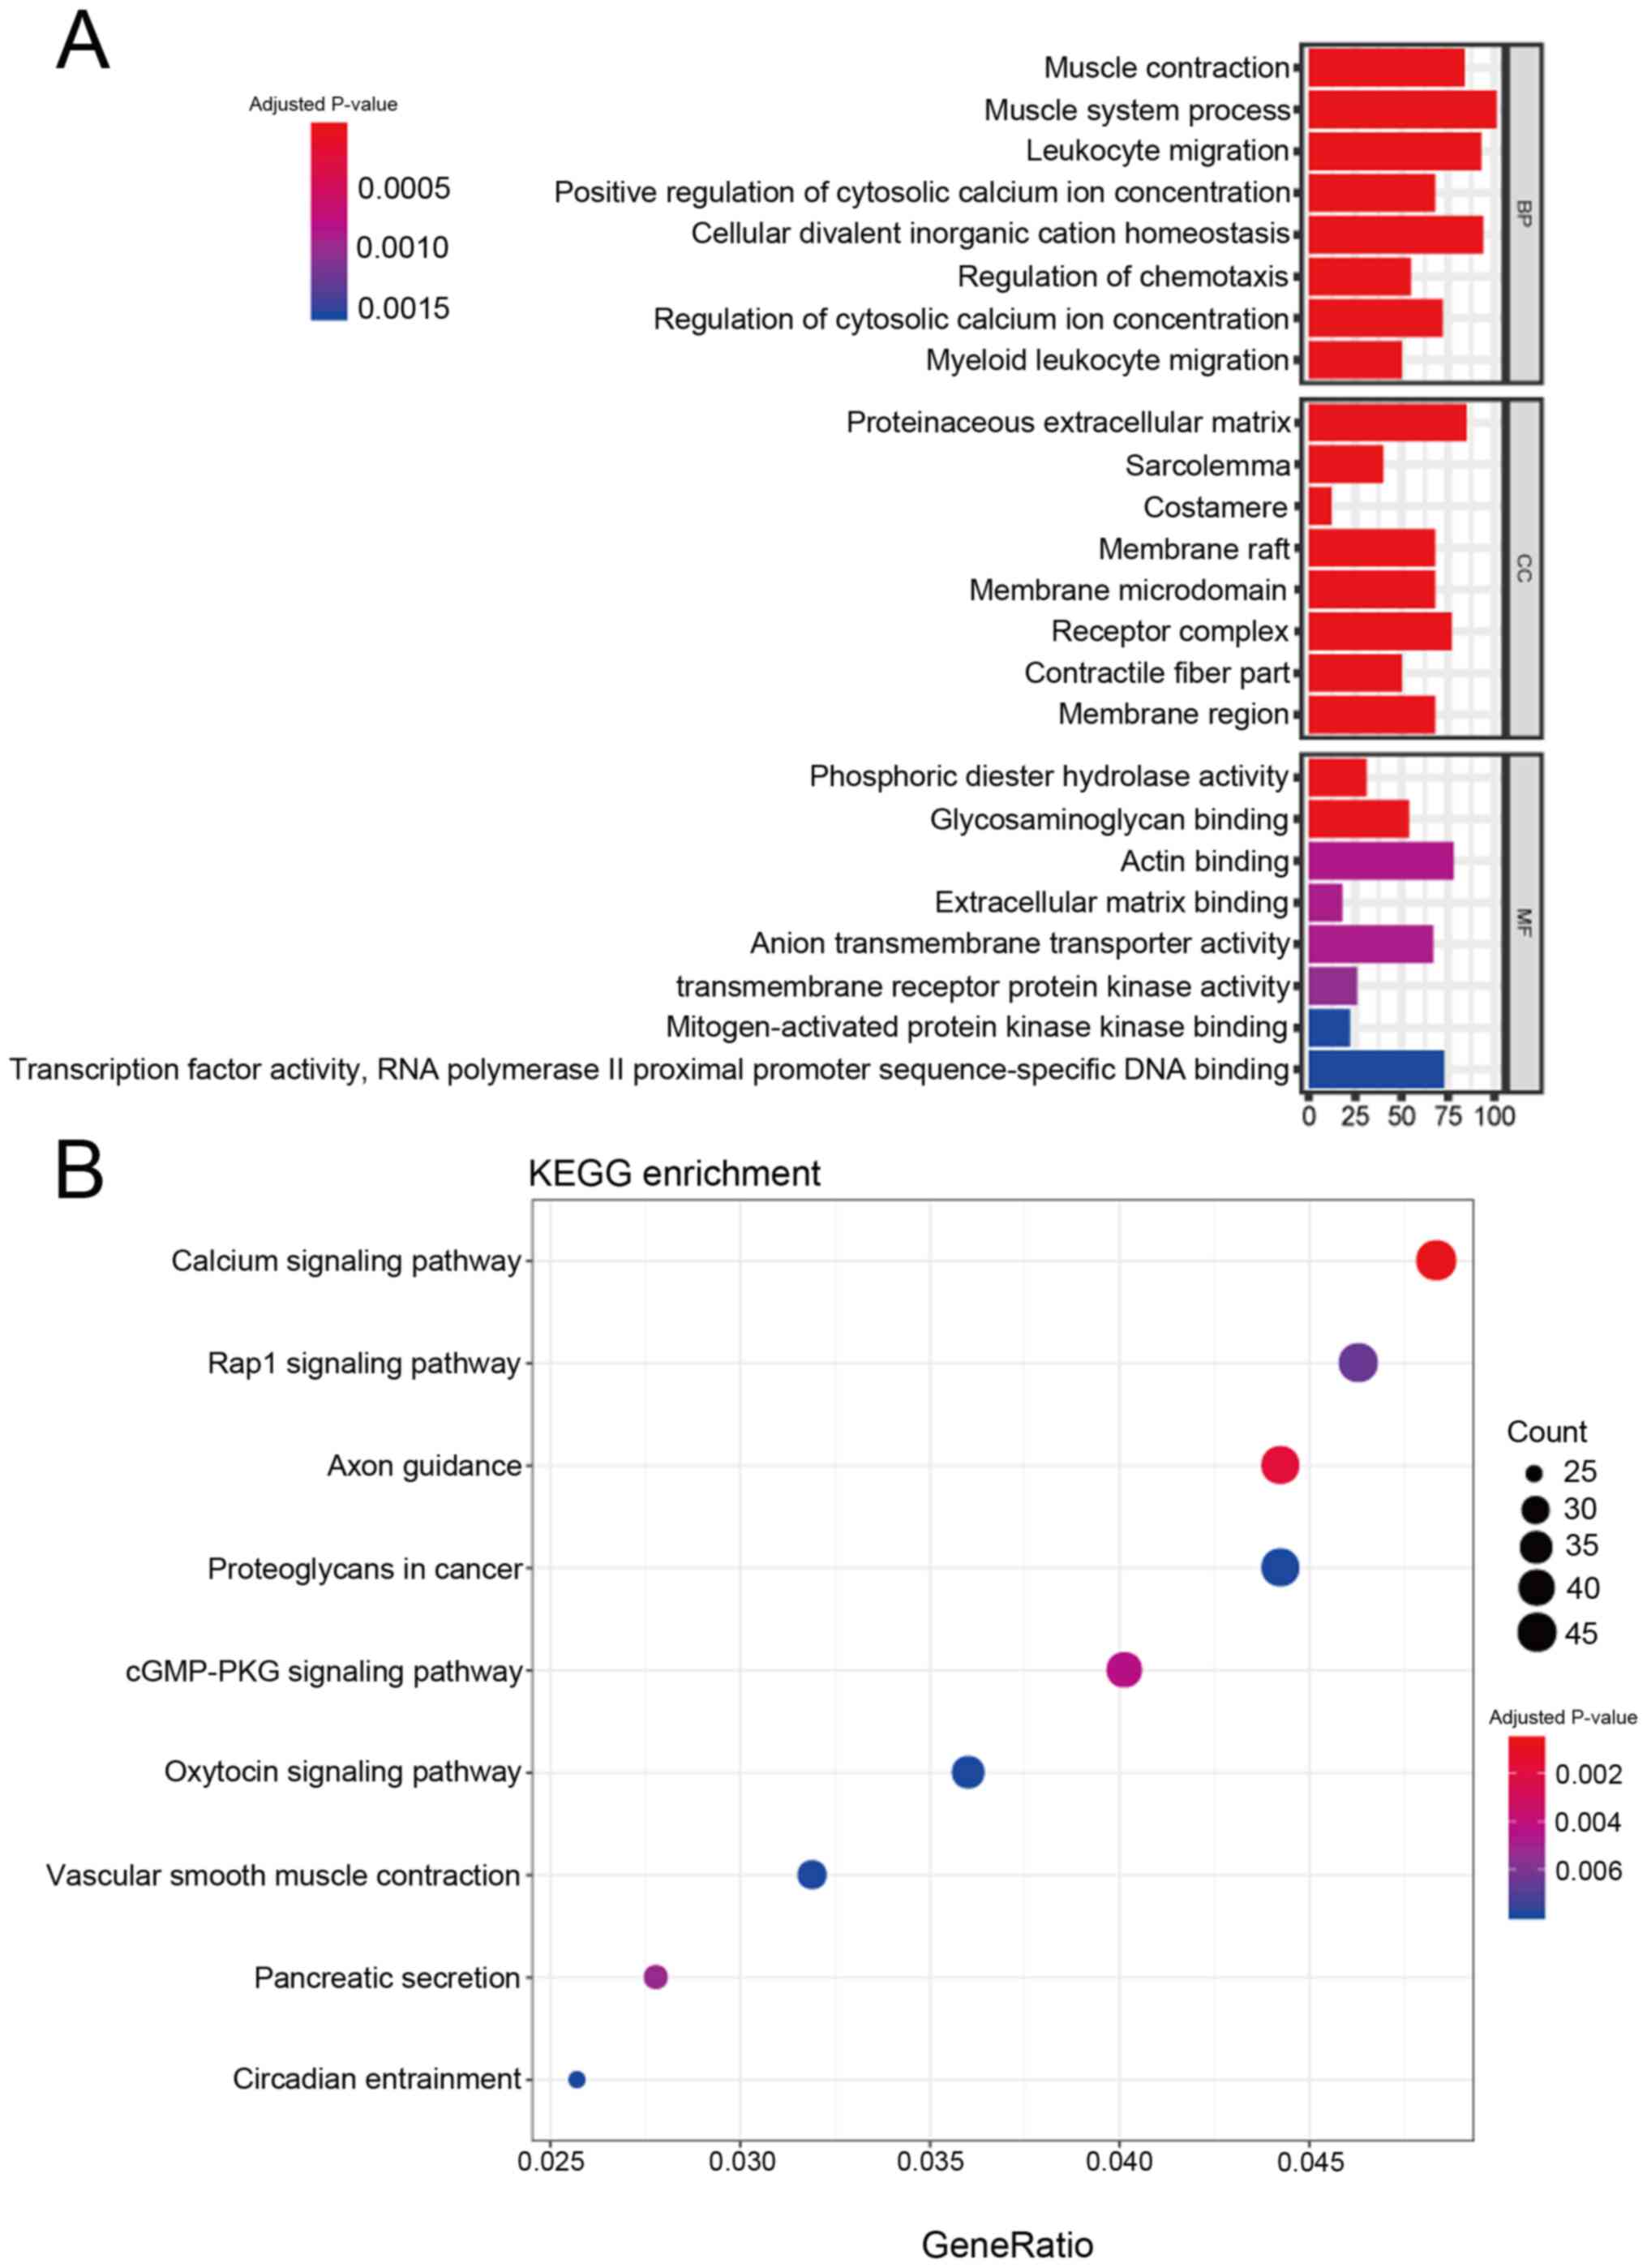
GO functional enrichment and KEGG
pathway analysis of DEmRNAs
GO analysis indicated significant enrichment in the
BP of ‘leukocyte migration’, ‘positive regulation of cytosolic
calcium ion concentration’ and ‘regulation of chemotaxis’. CC
analysis suggested enrichment in the ‘proteinaceous extracellular
matrix’, ‘sarcolemma’ and ‘costamere’. Additionally, the DEmRNAs
exhibited MF enrichment in ‘transcription factor activity, RNA
polymerase II proximal promoter sequence-specific DNA binding’
(Fig. 3A).
KEGG pathway analysis allows for the functional
annotation of DEmRNAs. The present study obtained nine KEGG
pathways. The dotplot in Fig. 3B
shows the results of the KEGG pathway with P-values ranging from
low to high. The complete results of the KEGG pathway analysis are
shown in Table IV. Only one
cancer-associated pathway, ‘Proteoglycans in cancer’, was
identified, which contained 43 genes (Table SII) and a P-value of 0.007893. This
signaling pathway became the focus of subsequent analyses.
| Table IV.Kyoto Encyclopedia of Genes and
Genomes pathways enriched in differentially expressed mRNAs in
rectosigmoid junction cancer. |
Table IV.
Kyoto Encyclopedia of Genes and
Genomes pathways enriched in differentially expressed mRNAs in
rectosigmoid junction cancer.
| PathwayID | Description | P-value | Count |
|---|
| hsa04020 | Calcium signaling
pathway |
2.01×10−06 | 47 |
| hsa04360 | Axon guidance |
1.07×10−05 | 43 |
| hsa04022 | cGMP-PKG signaling
pathway |
4.12×10−05 | 39 |
| hsa04972 | Pancreatic
secretion |
6.59×10−05 | 27 |
| hsa04015 | Rap1 signaling
pathway | 0.000102002 | 45 |
| hsa04921 | Oxytocin signaling
pathway | 0.000156228 | 35 |
| hsa04713 | Circadian
entrainment | 0.00019243 | 25 |
| hsa05205 | Proteoglycans in
cancer | 0.00021282 | 43 |
| hsa04270 | Vascular smooth
muscle contraction | 0.000221981 | 31 |
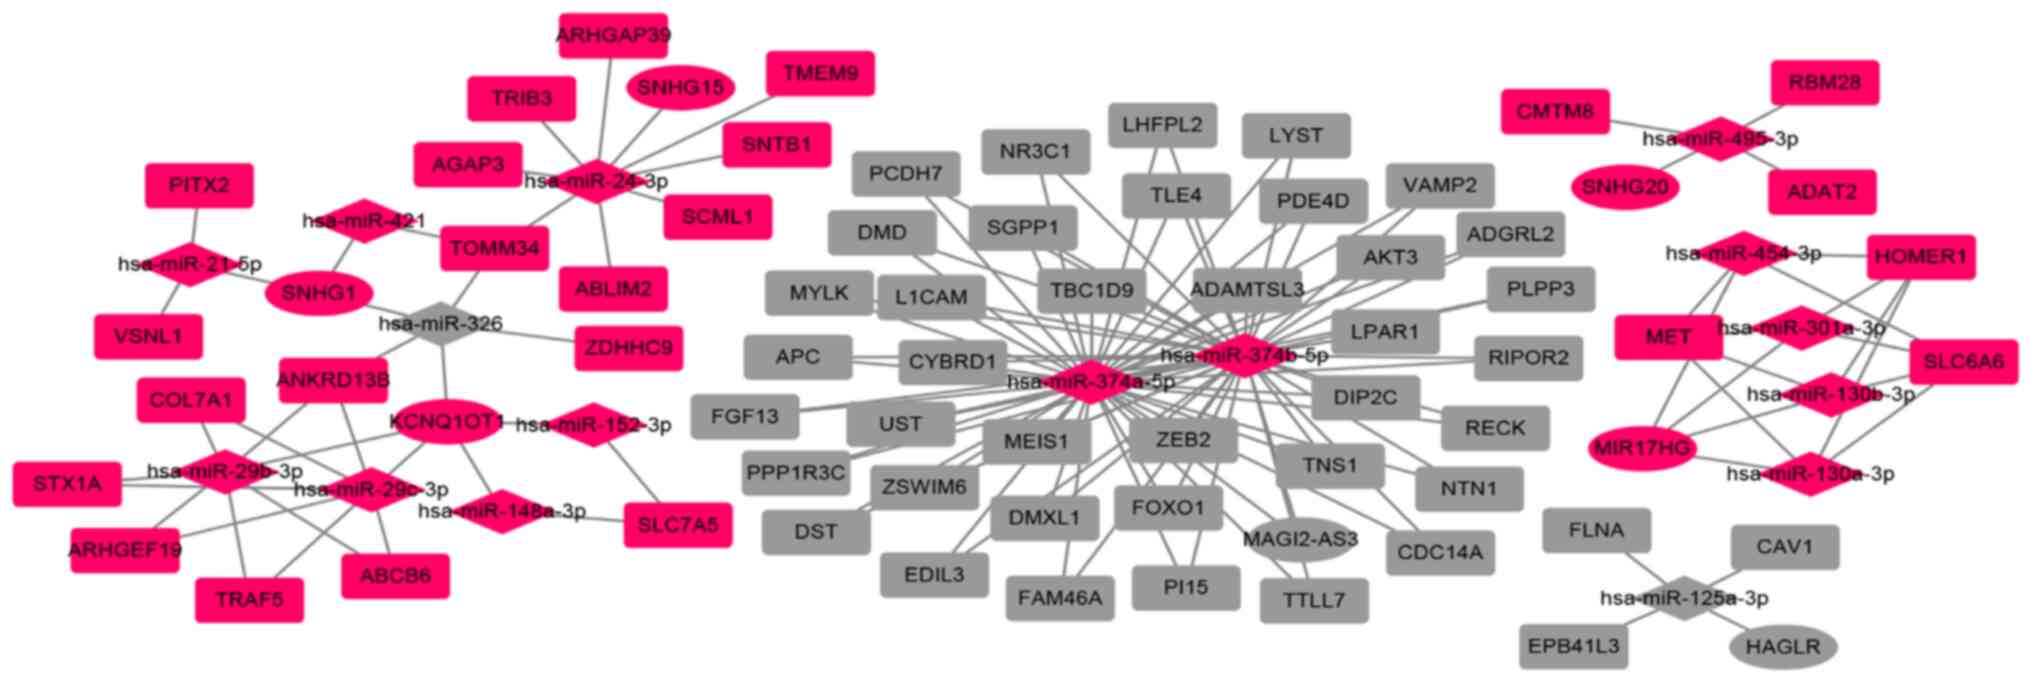
Construction of the ceRNA network in
rectosigmoid junction cancer
To further understand the role of DElncRNAs in
rectosigmoid junction cancer, the interaction of DEmiRNAs with
DElncRNAs and DEmRNAs was predicted. A total of 98 DElncRNAs were
predicted to interact with 16 DEmiRNAs using SpongeScan, miRcode
and ENCORI databases. Furthermore, targeted mRNAs that were
searched on the basis of the aforementioned 16 miRNAs were
retrieved from mirTarBase, miRcode and ENCORI. A total of 1,411
targeted DEmRNAs that were selected were included in all three
databases. The detailed information is shown in Table SIII.
Finally, 7 DElncRNAs, 16 DEmiRNAs and 71 DEmRNAs
were screened to construct the ceRNA network. The association
between DElncRNAs and DEmiRNAs is shown in Table V. All three types of RNAs that
participated in constructing the lncRNA-miRNA-mRNA ceRNA network
are listed in Table VI. The ceRNA
regulatory network was visualized using Cytoscape software
(Fig. 4).
| Table V.DE long non-coding RNAs interacting
with the 16 DEmiRNAs retrieved from the ENCORI database. |
Table V.
DE long non-coding RNAs interacting
with the 16 DEmiRNAs retrieved from the ENCORI database.
| lncRNA | miRNAs |
|---|
| KCNQ1OT1 | hsa-miR-152-3p,
hsa-miR-148a-3p, hsa-miR-29c-3p, hsa-miR-29b-3p, hsa-miR-326 |
| MIR17HG | hsa-miR-130a-3p,
hsa-miR-454-3p, hsa-miR-301a-3p, hsa-miR-130b-3p |
| SNHG1 | hsa-miR-326,
hsa-miR-421, hsa-miR-21-5p |
| MAGI2-AS3 | hsa-miR-374b-5p,
hsa-miR-374a-5p |
| HAGLR |
hsa-miR-125a-3p |
| SNHG20 | hsa-miR-495-3p |
| SNHG15 | hsa-miR-24-3p |
| Table VI.List of three types of RNAs involved
in the lncRNA-miRNA-mRNA competitive endogenous RNA network. |
Table VI.
List of three types of RNAs involved
in the lncRNA-miRNA-mRNA competitive endogenous RNA network.
| RNA | Upregulated | Downregulated |
|---|
| lncRNA | MIR17HG, SNHG15,
SNHG20, SNHG1, KCNQ1OT1 | HAGLR,
MAGI2-AS3 |
| miRNA | hsa-miR-130a-3p,
hsa-miR-130b-3p, hsa-miR-148a-3p, hsa-miR-152-3p, hsa-miR-21-5p,
hsa-miR-24-3p, hsa-miR-29b-3p, hsa-miR-29c-3p, hsa-miR-301a-3p,
hsa-miR-374a-5p, hsa-miR-374b-5p, hsa-miR-421, hsa-miR-454-3p,
hsa-miR-495-3p | hsa-miR-125a-3p,
hsa-miR-326 |
| mRNA | TOMM34, SCML1,
TRAF5, TRIB3, SLC7A5, MET, STX1A, RBM28, RPL28, COL7A1, ABCB6,
AMPD2, TMEM9, SLC6A6, AGAP3, ARHGEF19, ARHGAP39, HOMER1, C16orf59,
VSNL1, ABLIM2, PITX2, CMTM8, BCL2L1, SNTB1, SHMT2, KLHL17, ZDHHC9,
ADAT2, ANKRD13B | NTN1, MYLK, CYBRD1,
TNS1, CDC14A, EPB41L3, CAV1, TLE4, TBC1D9, RIPOR2, UST, FAM46A,
PDE4D, NR3C1, AKT3, ADGRL2, PPP1R3C, RECK, SGPP1, FGF13, ZSWIM6,
APC, PI15, TTLL7, LYST, MEIS1, LHFPL2, FOXO1, DIP2C, DST, ADAMTSL3,
PLPP3, EDIL3, ZEB2, PCDH7, DMXL1, FLNA, LPAR1, L1CAM, DMD,
VAMP2 |
Functional lncRNA-miRNA-mRNA
regulatory modules
To specify the key lncRNA-miRNA-mRNA regulatory
modules in the process of rectosigmoid junction cancer, the degree,
betweenness centrality, MCC and closeness centrality were
calculated using cytoHubba plugin on Cytoscape. The results of the
top 10 RNAs calculated by the four aforementioned methods are
listed in Table VII. The
upregulated lncRNAs KCNQ1OT1 and MIR17HG were closely associated
with most of the DEmiRNAs in the ceRNA network. In addition, the
upregulated KCNQ1OT1 competed with five key DEmiRNAs (miR-152-3p,
miR-148a-3p, miR-29c-3p, miR-29b-3p and miR-326) to regulate the
expression of target genes. Two miRNAs, hsa-miR-374a-5p and
hsa-miR-374b-5p, ranked top among all four calculation methods. The
genes caveolin-1 (CAV-1), MET, filamin-A (FLNA) and AKT3 were
enriched in the KEGG ‘Proteoglycans in cancer’ pathway, as well as
being involved in the ceRNA network. This suggested that these two
miRNAs and four mRNAs may serve essential roles in the
carcinogenesis and development of rectosigmoid junction cancer.
| Table VII.Node scores of top 10 competitive
endogenous RNAs calculated with the cytoHubba plugin on
Cytoscape. |
Table VII.
Node scores of top 10 competitive
endogenous RNAs calculated with the cytoHubba plugin on
Cytoscape.
| A, Closeness
centrality |
|---|
|
|---|
| RNA | Score |
|---|
|
hsa-miR-374b-5p | 39.5 |
|
hsa-miR-374a-5p | 39.5 |
| MEIS1 | 21 |
| TTLL7 | 21 |
| RECK | 21 |
| PLPP3 | 21 |
| ZSWIM6 | 21 |
| DMD | 21 |
| APC | 21 |
| PCDH7 | 21 |
|
| B,
Degree |
|
| RNA | Score |
|
|
hsa-miR-374b-5p | 39 |
|
hsa-miR-374a-5p | 39 |
| hsa-miR-24-3p | 9 |
| hsa-miR-29c-3p | 7 |
| hsa-miR-29b-3p | 7 |
| hsa-miR-326 | 5 |
| KCNQ1OT1 | 5 |
| MIR17HG | 4 |
|
hsa-miR-130a-3p | 4 |
| hsa-miR-454-3p | 4 |
|
| C, Maximal
Clique Centrality |
|
| RNA | Score |
|
|
hsa-miR-374b-5p | 39 |
|
hsa-miR-374a-5p | 39 |
| hsa-miR-24-3p | 9 |
| hsa-miR-29c-3p | 7 |
| hsa-miR-29b-3p | 7 |
| hsa-miR-326 | 5 |
| KCNQ1OT1 | 5 |
| MIR17HG | 4 |
|
hsa-miR-130a-3p | 4 |
| hsa-miR-454-3p | 4 |
|
| D, Betweenness
centrality |
|
| RNA | Score |
|
|
hsa-miR-374b-5p | 741.0 |
|
hsa-miR-374a-5p | 741.0 |
| hsa-miR-326 | 456.7 |
| hsa-miR-24-3p | 376.0 |
| TOMM34 | 356.0 |
| KCNQ1OT1 | 270.3 |
| SNHG1 | 164.0 |
| hsa-miR-29c-3p | 122.7 |
| hsa-miR-29b-3p | 122.7 |
| ANKRD13B | 119.3 |
Survival analysis for RNAs in the
ceRNA network
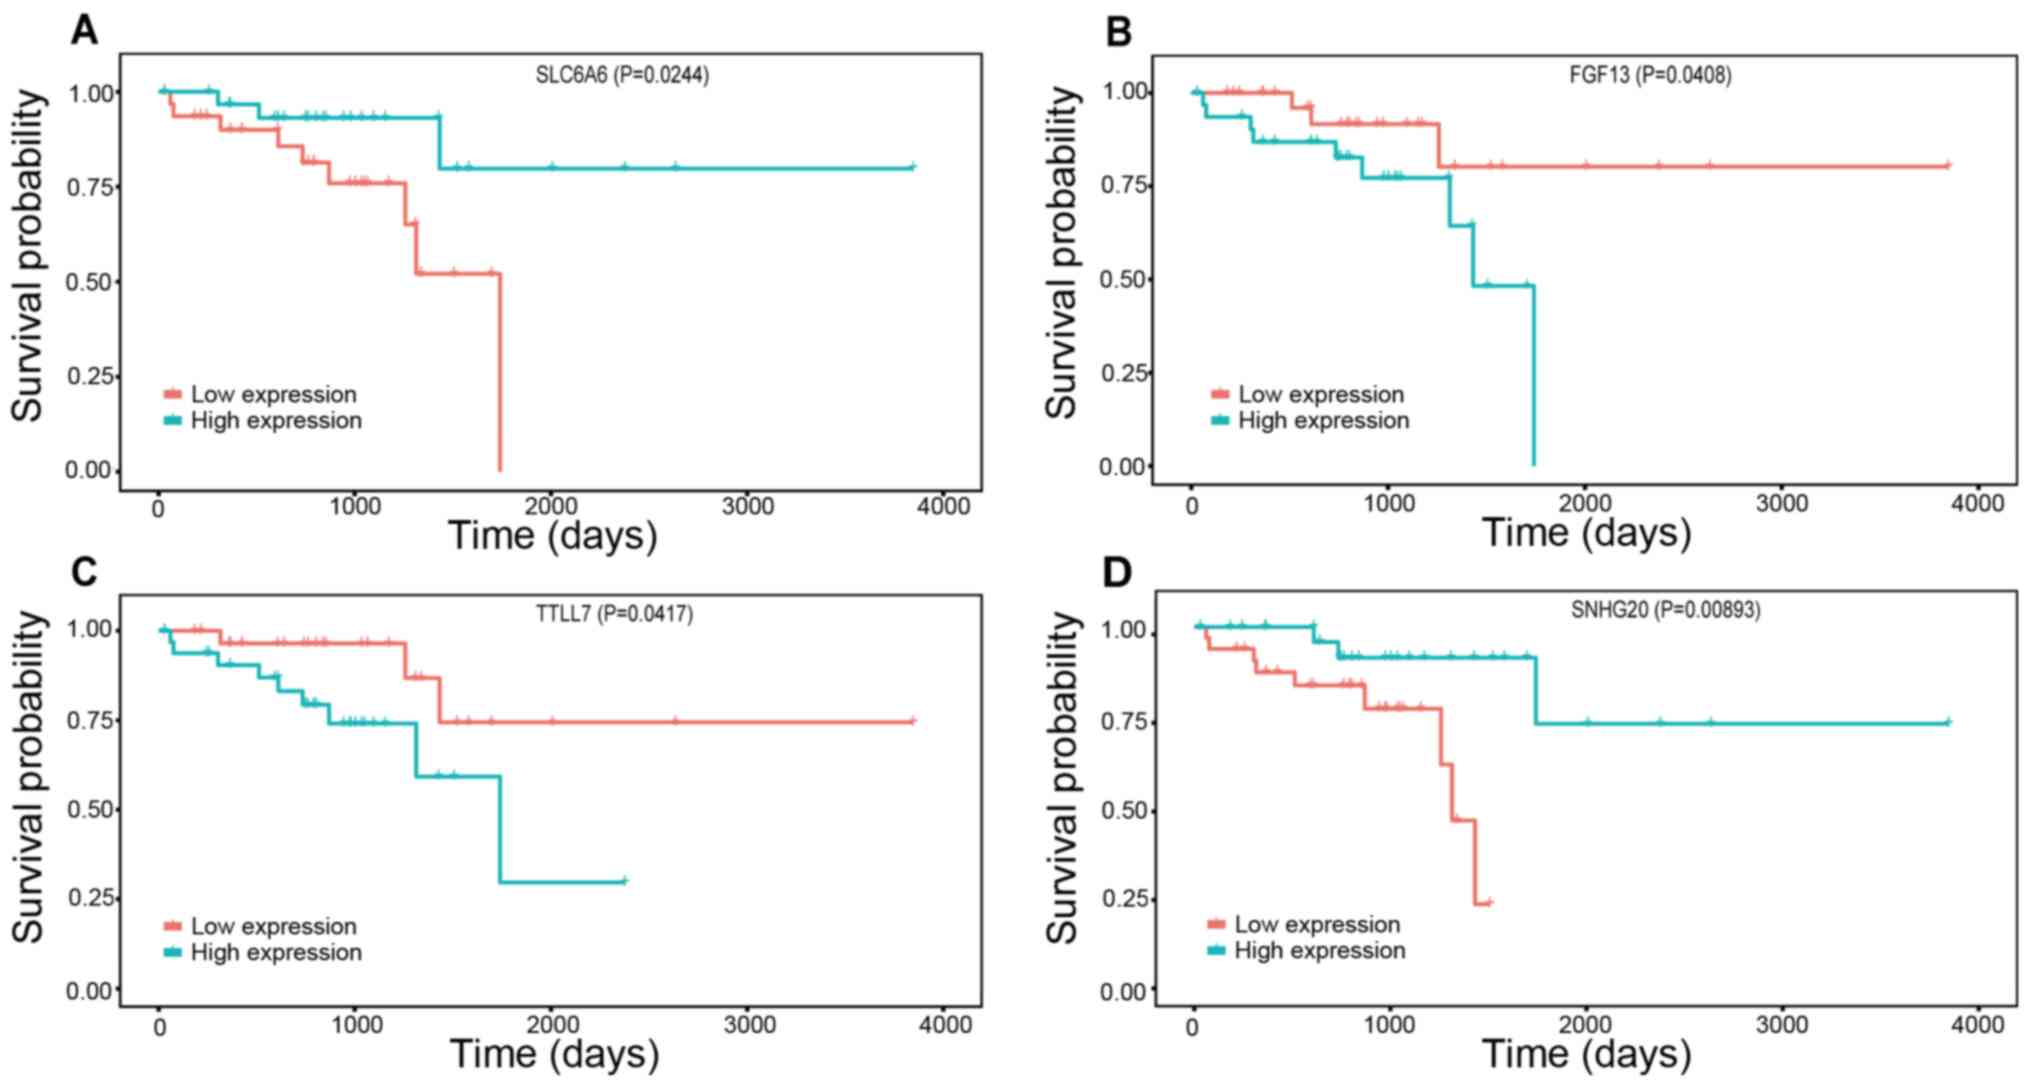
To identify the potential RNAs with prognostic
characteristics, Kaplan-Meier univariate analysis was applied to
calculate the OS for all DElncRNAs, DEmiRNAs and DEmRNAs in
rectosigmoid junction cancer. The results revealed that one
DElncRNA and three mRNAs were significantly associated with OS
(P<0.05). Furthermore, high expression levels of the only
DElncRNA, small nucleolar RNA host gene 20 (SNHG20), and of one
DEmRNA, sodium- and chloride-dependent taurine transporter
(SLC6A6), were associated with a favourable prognosis, while low
expression levels of the other two DEmRNAs [fibroblast growth
factor 13 (FGF13) and tubulin polyglutamylase TTLL7 (TTLL7)] were
associated with a favourable prognosis (Fig. 5). The OS data for DElncRNAs, DEmiRNAs
and DEmRNAs are presented in Table
SIV.
Discussion
CRC is the result of multiple etiological effects,
one of which is the assemblage of diverse genetic or epigenetic
alterations and their complex connections (21–23).
Accumulating evidence has demonstrated that lncRNAs have
considerable biological roles by modulating gene expression at
multiple levels in tumorigenesis and tumor progression (24), and lncRNAs also form the main part of
the ceRNA network of CRC.
Although a number of studies have revealed that the
lncRNA-mediated ceRNA network of CRC provides new clues and
directions for tumor diagnosis and treatment (15,25,26), to
the best of our knowledge, no studies have focused on rectosigmoid
junction cancer. The present study first systematically screened
DElncRNAs, DEmiRNAs and DEmRNAs, and then successfully constructed
a lncRNA-mediated ceRNA network to explore the regulatory
mechanism. Functional KEGG enrichment analysis revealed the
potential role of DEmRNAs in the carcinogenesis and development of
rectosigmoid junction cancer. Furthermore, a few significant RNAs
from the ceRNA network were identified, which may represent novel
crucial prognostic elements and possible therapeutic targets for
rectosigmoid junction cancer.
To the best of our knowledge, no studies have been
performed to predict the prognostic value of lncRNAs and their
corresponding ceRNA network in rectosigmoid junction cancer. In the
present study, 98 DElncRNAs were screened in rectosigmoid junction
cancer samples and compared with normal samples, 7 of which were
associated with the construction of the ceRNA network. Moreover, it
was noted that the upregulated lncRNAs KCNQ1OT1 and MIR17HG were
closely associated with most of the DEmiRNAs in the ceRNA network.
Upregulation of both MIR17HG and KCNQ1OT1 has been previously
associated with CRC (27–29), which is consistent with the present
results. Upregulated MIR17HG expression promotes tumorigenesis and
metastasis in CRC via miR-17-5p to negatively regulate B-cell
linker protein, which also participates in positive feedback
regulation through a ceRNA mechanism involving miR-375 in CRC
(27).
The dysregulation of KCNQ1OT1 in the lncRNA-coated
territory is due to the excessive expression of nuclear β-catenin,
which prompts variation in its lncRNA-coated territory profile;
this may trigger a chain reaction that results in the formation of
malignant colorectal tumors (28).
The present study noted that upregulated KCNQ1OT1 may compete with
five key DEmRNAs (miR-152-3p, miR-148a-3p, miR-29c-3p, miR-29b-3p
and miR-326) to regulate the expression of target genes. Moreover,
high SNHG20 expression resulted in an improved OS in patients with
rectosigmoid junction cancer compared with low expression, which
was also one of the key genes in the present ceRNA network. As a
member of lncRNAs, SNHG20 is frequently expressed in multiple types
of tumor, such as hepatocellular carcinoma, ovarian carcinoma,
bladder carcinoma and CRC, accounting for tumor development and
progression through modifying transcription or post-transcription
(30). A previous study revealed
that SNHG20 may regulate CRC cell proliferation, invasion and
migration through modulation of cyclin A1 and p21 expression
(31).
Although lncRNAs have become the focus of research
in recent years, miRNAs have also attracted attention. In order to
screen the key miRNAs participating in the regulatory network,
closeness centrality, degree, MCC and betweenness centrality of all
DERNAs were calculated using the cytoHubba plugin on Cytoscape. The
results indicated that hsa-miR-374a-5p and hsa-miR-374b-5p were the
top two miRNAs ranked among all four calculation methods,
suggesting that these two miRNAs with the highest node score may
serve a key role in the carcinogenesis and development of
rectosigmoid junction cancer.
Aberrantly expressed miRNAs have been reported to
serve a variety of roles in carcinomas. A previous study replicated
CRC-specific miRNAs to evaluate prognostic indications, revealing
that hsa-miR-374a-5p significantly decreased the risk of death for
all cases, regardless of tumor site (32). Additionally, another comprehensive
analysis for miRNA expression in breast cancer demonstrated that
increased expression levels of hsa-miR-374b-5p and another 11
miRNAs predicted improved breast cancer survival independently
(33). However, the present results
revealed that these two highly expressed miRNAs resulted in neither
improved nor worse survival compared with those without expression.
To the best of our knowledge, no studies have identified whether
these miRNAs exert functions in tumorigenesis and interact with the
prognosis of patients with rectosigmoid junction cancer.
To further understand the biological roles and
potential mechanisms of DEmRNAs in the pathogenesis of rectosigmoid
junction cancer, KEGG pathway analysis was performed. Among the
significant KEGG pathways, ‘Proteoglycans in cancer’ was the only
cancer-associated pathway. The genes caveolin-1 (CAV-1), MET,
filamin-A (FLNA) and AKT3 were enriched in the KEGG pathway
analysis, as well as being involved in the ceRNA network.
Observations from several studies have demonstrated that CAV-1 can
exert dual bioactivity, where it acts as a negative regulator in
the early stages of CRC but as an oncogene in advanced disease
(34,35). Additionally, miR-384 inhibits the
proliferation of CRC by directly targeting AKT3 (36). A previous study revealed that FLNA
may serve protective roles as a suppressor in CRC SW480 cells by
stimulating proliferation via the activation of several signaling
pathways (37). Furthermore, another
study demonstrated that proteoglycans and glycoproteins act as
signal co-receptors or bridging molecules and activate c-MET, which
contributes to cancer progression (38). In the present study, MET was enriched
in the ‘Proteoglycans in cancer’ pathway. Notably, it was found
that three DEmRNAs (SLC6A6, FFGF13 and TTLL7) involved in the ceRNA
network were significantly associated with the OS of patients with
rectosigmoid junction cancer (P<0.05). TTLL7 is a mammalian
β-tubulin polyglutamylase (39), and
the phosphinic acid-based inhibitors of TTLL7 are
well-characterized inhibitors of polyglutamylases (40), while the modified polyglutamylation
is associated with tumorigenesis and resistance to chemotherapeutic
drugs targeting microtubules (41).
In conclusion, the present study identified
differentially expressed lncRNAs, miRNAs, and mRNAs that may be
used as novel important prognostic biomarkers and potential
treatment targets for rectosigmoid junction cancer. A
lncRNA-associated ceRNA network was constructed to provide novel
and available options for subsequent functional studies of lncRNAs
in rectosigmoid junction cancer.
Supplementary Material
Supporting Data
Supporting Data
Supporting Data
Supporting Data
Acknowledgements
Not applicable.
Funding
The present study was supported by grants from the
Liaoning Province Nature Science Foundation of China (grant no.
2019-ZD-0917) and the Basic Research Program of Higher Education of
Liaoning Province of China (grant no. LQ2017035).
Availability of data and materials
The datasets used and/or analyzed during the current
study are available from the corresponding author on reasonable
request.
Authors' contributions
QZ and SR designed the study. YZ, ZF and SS also
participated in the design of this study and made suggestions in
the research process. SS and ZF acquired and downloaded the data
from databases. QZ and YZ performed the bioinformatics analyses. QZ
and ZF wrote the manuscript. QZ, SS and ZF reviewed and edited
manuscripts. SR and YZ supervised the whole project. All authors
read and approved the final manuscript.
Ethics approval and consent to
participate
Not applicable.
Patient consent for publication
Not applicable.
Competing interests
The authors declare that they have no competing
interests.
Glossary
Abbreviations
Abbreviations:
|
lncRNA
|
long non-coding RNA
|
|
ceRNA
|
competitive endogenous RNA
|
|
TCGA
|
The Cancer Genome Atlas
|
|
miRNA
|
microRNA
|
|
OS
|
overall survival
|
|
DE
|
differentially expressed
|
|
CRC
|
colorectal cancer
|
|
MREs
|
miRNA response elements
|
|
KEGG
|
Kyoto Encyclopedia of Genes and
Genomes
|
|
FC
|
fold-change
|
References
|
1
|
Lee YC, Lee YL, Chuang JP and Lee JC:
Differences in survival between colon and rectal cancer from SEER
data. PLoS One. 8:e787092013. View Article : Google Scholar : PubMed/NCBI
|
|
2
|
Bray F, Ferlay J, Soerjomataram I, Siegel
RL, Torre LA and Jemal A: Global cancer statistics 2018: GLOBOCAN
estimates of incidence and mortality worldwide for 36 cancers in
185 countries. CA Cancer J Clin. 68:394–424. 2018. View Article : Google Scholar : PubMed/NCBI
|
|
3
|
World Health Organization, . International
classification of diseases for oncology (ICD-O)-3rd edition, 1st
revision. 2013.simplehttps://apps.who.int/iris/handle/10665/96612
|
|
4
|
D'Souza N, de Neree Tot Babberich MPM,
Lord A, Shaw A, Abulafi M, Tekkis P, Wiggers T and Brown G: The
rectosigmoid problem. Surg Oncol. 27:521–525. 2018. View Article : Google Scholar : PubMed/NCBI
|
|
5
|
Falch C, Mueller S, Braun M, Gani C, Fend
F, Koenigsrainer A and Kirschniak A: Oncological outcome of
carcinomas in the rectosigmoid junction compared to the upper
rectum or sigmoid colon-A retrospective cohort study. Eur J Surg
Oncol. 45:2037–2044. 2019. View Article : Google Scholar : PubMed/NCBI
|
|
6
|
Käser SA, Froelicher J, Li Q, Müller S,
Metzger U, Castiglione M, Laffer UT and Maurer CA: Adenocarcinomas
of the upper third of the rectum and the rectosigmoid junction seem
to have similar prognosis as colon cancers even without
radiotherapy, SAKK 40/87. Langenbecks Arch Surg. 400:675–682. 2015.
View Article : Google Scholar : PubMed/NCBI
|
|
7
|
Ponz de Leon M, Marino M, Benatti P, Rossi
G, Menigatti M, Pedroni M, Di Gregorio C, Losi L, Borghi F,
Scarselli A, et al: Trend of incidence, subsite distribution and
staging of colorectal neoplasms in the 15-year experience of a
specialised cancer registry. Ann Oncol. 15:940–946. 2004.
View Article : Google Scholar : PubMed/NCBI
|
|
8
|
Bhan A, Soleimani M and Mandal SS: Long
noncoding RNA and cancer: A new paradigm. Cancer Res. 77(15):
3965–3981. 2017. View Article : Google Scholar : PubMed/NCBI
|
|
9
|
Rupaimoole R and Slack FJ: MicroRNA
therapeutics: Towards a new era for the management of cancer and
other diseases. Nat Rev Drug Discov. 16:203–222. 2017. View Article : Google Scholar : PubMed/NCBI
|
|
10
|
Sergeeva OV, Koteliansky VE and Zatsepin
TS: mRNA-based therapeutics-advances and perspectives. Biochemistry
(Mosc). 81:709–722. 2016. View Article : Google Scholar : PubMed/NCBI
|
|
11
|
Salmena L, Poliseno L, Tay Y, Kats L and
Pandolfi PP: A ceRNA hypothesis: The Rosetta Stone of a hidden RNA
language? Cell. 146:353–358. 2011. View Article : Google Scholar : PubMed/NCBI
|
|
12
|
Cheng Y, Geng L, Wang K, Sun J, Xu W, Gong
S and Zhu Y: Long noncoding RNA expression signatures of colon
cancer based on the ceRNA network and their prognostic value. Dis
Markers. 2019:76367572019. View Article : Google Scholar : PubMed/NCBI
|
|
13
|
Luo R, Song J, Zhang W and Ran L:
Identification of MFI2-AS1, a novel pivotal lncRNA for prognosis of
stage III/IV colorectal cancer. Dig Dis Sci. 65:538–3550. 2020.
View Article : Google Scholar
|
|
14
|
Wang L, Cho KB, Li Y, Tao G, Xie Z and Guo
B: Long noncoding RNA (lncRNA)-mediated competing endogenous RNA
networks provide novel potential biomarkers and therapeutic targets
for colorectal cancer. Int J Mol Sci. 20:57582019. View Article : Google Scholar
|
|
15
|
Zhang Z, Wang S, Ji D, Qian W, Wang Q, Li
J, Gu J, Peng W, Hu T, Ji B, et al: Construction of a ceRNA network
reveals potential lncRNA biomarkers in rectal adenocarcinoma. Oncol
Rep. 39:2101–2113. 2018.PubMed/NCBI
|
|
16
|
Dong X, Yang Z, Yang H, Li D and Qiu X:
Long Non-coding RNA MIR4435-2HG promotes colorectal cancer
proliferation and metastasis through miR-206/YAP1 Axis. Front
Oncol. 10:1602020. View Article : Google Scholar : PubMed/NCBI
|
|
17
|
Zhang X, Wen L, Chen S, Zhang J, Ma Y, Hu
J, Yue T, Wang J, Zhu J, Bu D and Wang X: The novel long noncoding
RNA CRART16 confers cetuximab resistance in colorectal cancer cells
by enhancing ERBB3 expression via miR-371a-5p. Cancer Cell Int.
20:682020. View Article : Google Scholar : PubMed/NCBI
|
|
18
|
Amin MB, Edge S, Greene F, Byrd DR,
Brookland RK, Washington MK, Gershenwald JE, Compton CC, Hess KR,
Sullivan DC, Jessup JM, Brierley JD, Gaspar LE, Schilsky RL, Balch
CM, Winchester DP, Asare EA, Madera M, Gress DM and Meyer LR: AJCC
Cancer Staging Manual. 8th edition. Springer; 2017, View Article : Google Scholar
|
|
19
|
Chou CH, Shrestha S, Yang CD, Chang NW,
Lin YL, Liao KW, Huang WC, Sun TH, Tu SJ, Lee WH, et al: miRTarBase
update 2018: A resource for experimentally validated
microRNA-target interactions. Nucleic Acids Res. 46:D296–D302.
2018. View Article : Google Scholar : PubMed/NCBI
|
|
20
|
Li JH, Liu S, Zhou H, Qu LH and Yang JH:
starBase v2.0: Decoding miRNA-ceRNA, miRNA-ncRNA and protein-RNA
interaction networks from large-scale CLIP-Seq data. Nucleic Acids
Res. 42:D92–D97. 2014. View Article : Google Scholar : PubMed/NCBI
|
|
21
|
Lindner P, Paul S, Eckstein M, Hampel C,
Muenzner JK, Erlenbach-Wuensch K, Ahmed HP, Mahadevan V, Brabletz
T, Hartmann A, et al: EMT transcription factor ZEB1 alters the
epigenetic landscape of colorectal cancer cells. Cell Death Dis.
11:1472020. View Article : Google Scholar : PubMed/NCBI
|
|
22
|
Mo S, Zhang L, Dai W, Han L, Wang R, Xiang
W, Wang Z, Li Q, Yu J, Yuan J, et al: Antisense lncRNA LDLRAD4-AS1
promotes metastasis by decreasing the expression of LDLRAD4 and
predicts a poor prognosis in colorectal cancer. Cell Death Dis.
11:1552020. View Article : Google Scholar : PubMed/NCBI
|
|
23
|
Stuckel AJ, Zhang W, Zhang X, Zeng S,
Dougherty U, Mustafi R, Zhang Q, Perreand E, Khare T, Joshi T, et
al: Enhanced CXCR4 expression associates with increased gene body
5-Hydroxymethylcytosine modification but not decreased promoter
methylation in colorectal cancer. Cancers (Basel). 12:5392020.
View Article : Google Scholar
|
|
24
|
Kopp F and Mendell JT: Functional
classification and experimental dissection of long noncoding RNAs.
Cell. 172:393–407. 2018. View Article : Google Scholar : PubMed/NCBI
|
|
25
|
Liu J, Li H, Zheng B, Sun L, Yuan Y and
Xing C: Competitive endogenous RNA (ceRNA) regulation network of
lncRNA-miRNA-mRNA in colorectal carcinogenesis. Dig Dis Sci.
64:1868–1877. 2019. View Article : Google Scholar : PubMed/NCBI
|
|
26
|
Wei S, Chen J, Huang Y, Sun Q, Wang H,
Liang X, Hu Z and Li X: Identification of hub genes and
construction of transcriptional regulatory network for the
progression of colon adenocarcinoma hub genes and TF regulatory
network of colon adenocarcinoma. J Cell Physiol. 235:2037–2048.
2020. View Article : Google Scholar : PubMed/NCBI
|
|
27
|
Xu J, Meng Q, Li X, Yang H, Xu J, Gao N,
Sun H, Wu S, Familiari G, Relucenti M, et al: Long noncoding RNA
MIR17HG promotes colorectal cancer progression via miR-17-5p.
Cancer Res. 79:4882–4895. 2019. View Article : Google Scholar : PubMed/NCBI
|
|
28
|
Sunamura N, Ohira T, Kataoka M, Inaoka D,
Tanabe H, Nakayama Y, Oshimura M and Kugoh H: Regulation of
functional KCNQ1OT1 lncRNA by beta-catenin. Sci Rep. 6:206902016.
View Article : Google Scholar : PubMed/NCBI
|
|
29
|
Li F, Li Q and Wu X: Construction and
analysis for differentially expressed long non-coding RNAs and
MicroRNAs mediated competing endogenous RNA network in colon
cancer. PLoS One. 13:e01924942018. View Article : Google Scholar : PubMed/NCBI
|
|
30
|
Zhao W, Ma X, Liu L, Chen Q, Liu Z, Zhang
Z, Ma S, Wang Z, Li H, Wang Z and Wu J: SNHG20: A vital lncRNA in
multiple human cancers. J Cell Physiol. Jan 15–2019.(Epub ahead of
print). doi: 10.1002/jcp.28143.
|
|
31
|
Li C, Zhou L, He J, Fang XQ, Zhu SW and
Xiong MM: Increased long noncoding RNA SNHG20 predicts poor
prognosis in colorectal cancer. BMC Cancer. 16:6552016. View Article : Google Scholar : PubMed/NCBI
|
|
32
|
Slattery ML, Herrick JS, Mullany LE,
Valeri N, Stevens J, Caan BJ, Samowitz W and Wolff RK: An
evaluation and replication of miRNAs with disease stage and
colorectal cancer-specific mortality. Int J Cancer. 137:428–438.
2015. View Article : Google Scholar : PubMed/NCBI
|
|
33
|
Chang JT, Wang F, Chapin W and Huang RS:
Identification of MicroRNAs as breast cancer prognosis markers
through the cancer genome atlas. PLoS One. 11:e01682842016.
View Article : Google Scholar : PubMed/NCBI
|
|
34
|
Torrejon B, Cristobal I, Rojo F and
Garcia-Foncillas J: Caveolin-1 is markedly downregulated in
patients with early-stage colorectal cancer. World J Surg.
41:2625–2630. 2017. View Article : Google Scholar : PubMed/NCBI
|
|
35
|
Yang J, Zhu T, Zhao R, Gao D, Cui Y, Wang
K and Guo Y: Caveolin-1 inhibits proliferation, migration, and
invasion of human colorectal cancer cells by suppressing
phosphorylation of epidermal growth factor receptor. Med Sci Monit.
24:332–341. 2018. View Article : Google Scholar : PubMed/NCBI
|
|
36
|
Wang YX, Zhu HF, Zhang ZY, Ren F and Hu
YH: MiR-384 inhibits the proliferation of colorectal cancer by
targeting AKT3. Cancer Cell Int. 18:1242018. View Article : Google Scholar : PubMed/NCBI
|
|
37
|
Wang K, Zhu TN and Zhao RJ: Filamin A
regulates EGFR/ERK/Akt signaling and affects colorectal cancer cell
growth and migration. Mol Med Rep. 20:3671–3678. 2019.PubMed/NCBI
|
|
38
|
Noriega-Guerra H and Freitas VM:
Extracellular matrix influencing HGF/c-MET signaling pathway:
Impact on cancer progression. Int J Mol Sci. 19:33002018.
View Article : Google Scholar
|
|
39
|
Ikegami K, Mukai M, Tsuchida J, Heier RL,
Macgregor GR and Setou M: TTLL7 is a mammalian beta-tubulin
polyglutamylase required for growth of MAP2-positive neurites. J
Biol Chem. 281:30707–30716. 2006. View Article : Google Scholar : PubMed/NCBI
|
|
40
|
Liu Y, Garnham CP, Roll-Mecak A and Tanner
ME: Phosphinic acid-based inhibitors of tubulin polyglutamylases.
Bioorg Med Chem Lett. 23:4408–4412. 2013. View Article : Google Scholar : PubMed/NCBI
|
|
41
|
Das V, Kanakkanthara A, Chan A and Miller
JH: Potential role of tubulin tyrosine ligase-like enzymes in
tumorigenesis and cancer cell resistance. Cancer Lett. 350:1–4.
2014. View Article : Google Scholar : PubMed/NCBI
|