Introduction
Bladder cancer (BC) is the ninth most common
malignancy worldwide with substantial morbidity and mortality. In
the United States in 2019, there were an estimated 80,470 new cases
and 17,670 deaths due to bladder cancer (1). The incidence rate of BC is increasing
rapidly (2). Therefore, developing
precise diagnostic strategies and treatments are necessary. Though
numerous previous studies have revealed several insights into the
pathogenesis of BC, the underlying molecular mechanisms are largely
unknown (3–5). To increase the diagnostic and
therapeutic accuracy of BC, it is necessary to explore the
underlying molecular mechanisms.
In the present study, three original microarray
datasets [GSE37817 (6), GSE42089
(7) and GSE52519 (8)] were obtained from the Gene Expression
Omnibus (GEO) database to identify differentially expressed genes
(DEGs) in bladder tumors and non-cancerous samples. Afterwards,
Gene Ontology (GO) and Kyoto Encyclopedia of Genes and Genomes
(KEGG) analyses and PPI were conducted to explore the molecular
mechanisms of tumorigenesis and progression. These hub genes were
identified and analyzed using the cBioPortal online platform. In
addition, upregulation of KIF11 was verified in BC samples and
bladder cells. The expression levels of KIF11 were measured using
reverse transcription-quantitative PCR, immunohistochemistry
analysis and western blotting.
Materials and methods
Microarray data
The GEO database (9)
is a publicly available functional genomics database, including
microarrays, chips and high-throughput gene expression data. Three
datasets downloaded from GEO were used in the present study,
including GSE37817, GSE42089 and GSE52519. The GSE37817 dataset
contained 18 BC tissue samples and five non-cancerous samples.
GSE42089 contained 10 tissues from BC and eight tissue samples from
normal bladder. GSE52519 contained nine BC cancerous tissue samples
and three normal bladder tissue samples. Detailed information of
the three gene expression datasets are presented in Table I.
 | Table I.Detailed information for datasets
downloaded from the GEO database. |
Table I.
Detailed information for datasets
downloaded from the GEO database.
| Series
accession | Country | Year | Sample size
case/control | Platform |
|---|
| GSE37817 | South Korea | 2012 | 18/5 | GPL6102 Illumina
human-6 v2.0 expression beadchip |
| GSE42089 | United States of
America | 2012 | 10/8 | GPL9828 Affymetrix
Human Genome U133 Plus 2.0 Array |
| GSE52519 | Russia | 2013 | 9/3 | GPL6884 Illumina
HumanWG-6 v3.0 expression beadchip |
DEGs analysis
GEO2R tool (http://www.ncbi.nlm.nih.gov/geo/geo2r) was applied to
screen the DEGs in BC and non-cancerous samples, which compared
different datasets to identify DEGs in a GEO series. The adjusted
P-value (adj. P) and Benjamini and HBChberg false discovery rate
were used to identify statistically significant DEGs and rule out
false-positives. An adj. P<0.01 and a |log FC (fold-change)|≥1
were considered statistically significant. Genes with >1 probe
sets or probe sets without corresponding gene symbols were averaged
or removed, respectively. The overlapping DEGs among the three
datasets were compared using Venn analysis.
Protein-protein interaction (PPI)
network construction and module analyses
The Search Tool for the Retrieval of Interacting
Genes (STRING) (version 11.0) database was used to predict and
analyze the function of the PPIs using networks (10). The cut-off value of the combined
score was set at >0.4. Subsequently, the PPI networks were drawn
using Cytoscape software, which was used to visualize
intermolecular interaction networks (11). The Molecular Complex Detection
(MCODE) plug-in of Cytoscape, designed for clustering networks to
find connected regions, was used to screen significant modules from
PPI networks (12). The selection
criteria for significant modules were as follows: MCODE Scores
>5, degree cut-off=2, node score cut-off=0.2, k-score=2 and max
depth=100. Afterwards, the functional analysis of the most
significant module was analyzed using Database for Annotation,
Visualization and Integrated Discovery (DAVID) database version 6.8
(13).
GO functional annotation and KEGG
pathway enrichment analyses
DAVID, an online bioinformatics database, was used
to integrate biological data and functional annotation information
of genes and proteins. The functions of DEGs were analyzed using
the DAVID database. P<0.05 was considered statistically
significant. The GO database was used to annotate genes and
identify the associated biological characteristics of the genes
(14). KEGG, a database resource for
functions of biological systems generated using high-throughput
techniques, was conducted using Cytoscape software version 3.7.1
(15).
Identification and analysis of hub
genes
Hub genes were identified using cytoHubba tool kits
of Cytoscape (16). Top hub genes
with ≥10 degrees in BC samples were selected. Hub genes were
identified and analyzed using the cBioPortal platform (17). The Biological Networks Gene Oncology
(BiNGO) plug-in of Cytoscape was used to analyze the biological
process of the hub genes (18). The
University of California, Santa Cruz (UCSC) Cancer Genomics Browser
was used to construct the clustering of hub genes in the TCGA
database (19). Moreover, the
Kaplan-Meier method was used to compare overall survival curves
between different expression gene groups in the survival
probability study. P<0.05 was considered to indicate a
statistically significant difference. Oncomine online database
analyzed the expression of KIF11 between cancer and normal tissue
in four different datasets (20–23).
Meanwhile, the relationships between gene expressions and tumor
grades were analyzed using the Oncomine online database.
Patients and BC samples
The present study was approved by The Research
Ethics Committee of the Sun Yat-sen University Cancer Center
(Guangzhou, China; approval no. B2020-198). The inclusion criteria
were as follows: i) No history of any other malignant tumors; and
ii) no anticancer therapy before surgery. The exclusion criteria
were as follows: i) Other malignant tumors; and ii) preoperative
treatments, such as adjuvant chemotherapy or radiation therapy. In
total, 31 paired BC and adjacent tissues from 31 patients were
obtained from the Sun Yat-sen University Cancer Center. The tissue
samples were acquired by resection. The tissue samples were stored
at −80°C before fixation. Tissue were embedded in paraffin for
long-term preservation. Written informed consent was obtained from
enrolled patients. The BC tissues were confirmed by pathological
diagnosis by independent pathologists. Clinicopathological data of
patients with BC were also obtained, including age, sex, tumor
stage, tumor grade, lymph node metastasis status, distant
metastasis status and invasiveness.
Cell culture
Overall, four human bladder cell lines (Tcc-Sup,
UM-UC-3, RT4 and J82) and a normal urinary tract cell line (HCV29)
were cultured in RPMI-1640 (Invitrogen; Thermo Fisher Scientific,
Inc.). Cells were supplemented with 10% fetal bovine serum
(HyClone; Cyvita) and incubated at 37°C in a humidified atmosphere
of 5% CO2.
Reverse transcription-quantitative PCR
(RT-q)PCR analysis
Total RNA was isolated from tissues using
TRIzol® reagent (Invitrogen; Thermo Fisher Scientific,
Inc.) following the manufacturer's protocol. cDNA was generated by
reverse transcription using a SuperScript III First-Strand cDNA
system (Invitrogen; Thermo Fisher Scientific, Inc.) under the
following conditions: 42°C for 50 min followed by heat inactivation
for 5 min at 80°C. The KIF11 sense primer was
5′-TATTGAATGGGCGCTAGCTT-3′, and the antisense primer was
5′-TCGTCTGCGAAGAAGAAAGA-3′. For the housekeeping gene GAPDH, the
sense primer was 5′-ACCACAGTCCATGCCATCAC-3′ and the antisense
primer was 5′-TCCACCACCCTGTTGCTGTA-3′. RT-qPCR was performed using
a 7900HT Fast Real-time PCR system (Thermo Fisher Scientific, Inc.)
as follows: 50°C for 2 min, 95°C for 10 min, 40 cycles of 95°C for
15 sec and 60°C for 1 min. The crossing threshold (Cq) value was
calculated and recorded using the instrument's software (SDS
version 2.3). The mRNA expression data was normalized to GAPDH and
calculated using the comparative threshold cycle
(2−ΔΔCq) method (24).
Immunohistochemistry (IHC)
The tissue sample were immersed in 10% neutral
buffered formalin for 3 days at room temperature (27°C) for
fixation. Samples were cut into 4-µm thick paraffin sections.
Paraffin sections were incubated in an oven at 60°C for 2 h. Slides
were boiled in citrate buffer (pH 6.0) and immersed in 3% hydrogen
peroxide. Slides were blocked in 5% goat blocking serum (Thermo
Fisher Scientific, Inc.) at room temperature for 1 h. Next, the
slides were incubated with anti-KIF11 antibody (1:500; cat. no.
ab61199; Abcam) overnight at 4°C. After rinsing thrice with
phosphate-buffered saline (0.01 mol/l, pH 7.4), the stained
sections were incubated with goat anti-rabbit poly-horseradish
peroxidase-conjugated secondary antibody (1:200; cat. no. 32260;
Thermo Fisher Scientific, Inc.) for 30 min at room temperature and
stained with 3,3-diaminobenzidine for 3 min at room temperature.
Then, the tissue sections were counterstained with hematoxylin for
1 min at room temperature and dehydrated with graded ethanol (75,
85, 95 and 100%). These slides were observed using a light
microscope (magnification, ×100 and ×200). Two experienced
pathologists, who are independent from the present study group,
calculated the H-Score of IHC staining based on the percentage
score and intensity score of positively stained cells. The
percentage of positively stained cells was scored as follows:
0=staining 0–5%; 1=staining 6–25%; 2=staining 26–50%; 3=staining
51–75%; 4=staining >76%. The intensity of positively stained
cells was scored as follows: 0=absent staining; 1=weak; 2=moderate;
3=strong). The IHC score was calculated by multiplying the
percentage and intensity score and ranged from 0 to 12.
Western blotting
Total protein samples were extracted in lysis buffer
(Vazyme Biotech, Co., Ltd.). Protein concentration was determined
using a bicinchoninic acid assay kit. Protein samples (20 µg per
lane) were separated using 12% SDS-PAGE. Electrophoresis was
carried out at a constant voltage. Proteins were transferred onto
polyvinylidene fluoride (PVDF) membranes (EMD Millipore). After
electrophoresis, the PVDF membrane was sealed with 5% skimmed milk
at room temperature for 60 min. The membrane was incubated with
rabbit anti-KIF11 antibody (1:500; cat. no. ab61199; Abcam) or
rabbit anti-GAPDH antibody (1:2,000; cat. no. ab9485; Abcam) at 4°C
overnight. After three 10-min washes with phosphate-buffered
saline-Tween (PBST, 0.05% Tween-20), anti-rabbit horseradish
peroxidase (HRP)-conjugated secondary antibody (1:5,000; cat. no.
7074; Cell Signaling Technology, Inc.) was added and incubated with
the membrane for 1 h at room temperature. Secondary antibody was
washed away with PBST and the membranes were prepared for exposure.
The PVDF membrane were detected using the hypersensitive ECL
chemiluminescence kit (Beyotime Institute of Biotechnology). Two
exposure reagents were mixed in equal proportion and applied to the
PVDF membrane. The intensity was measured using Quantity One
software (version 4.6.6; Bio-Rad Laboratories).
Statistical analysis
All the experiments were repeated three times. All
of the statistical analyses were performed using SPSS 25.0 (IBM
Corp) and GraphPad Prism 8.0.1 (GraphPad Software). The data was
analyzed using ANOVA followed by Dunnett's test, paired Student's
t-tests (two-sided) or Fisher's exact tests (two-sided). Data was
expressed as the means ± standard deviation. P<0.05 was
considered to indicate a statistically significant difference.
Results
Identification of DEGs in BC
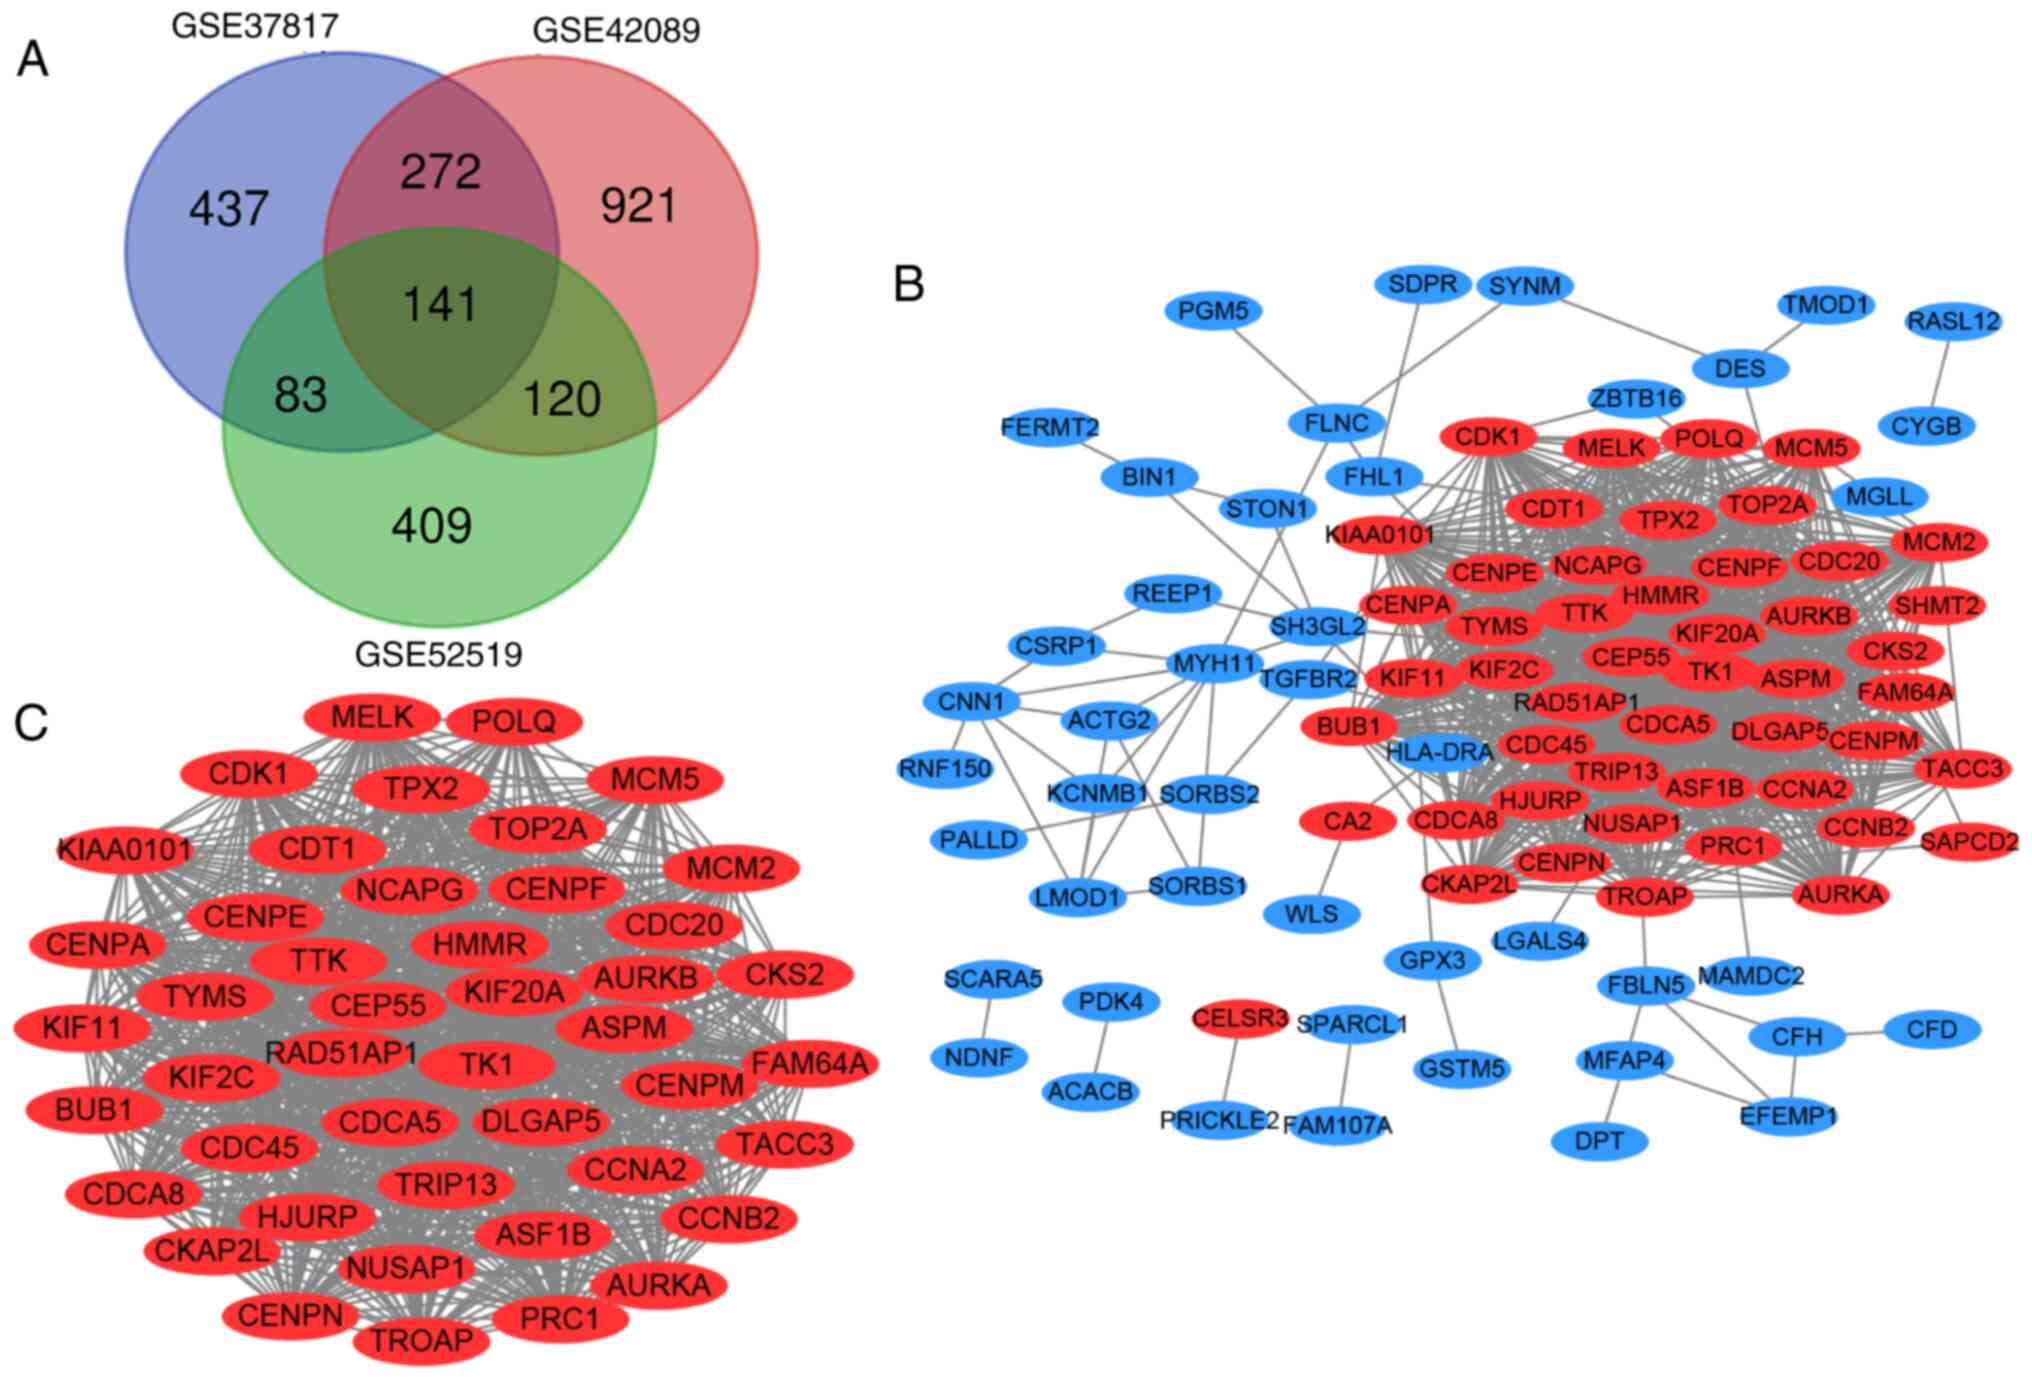
The GEO2R tool was used to identify the DEGs (933 in
GSE37817, 1,454 in GSE42089 and 753 in GSE52519) in BC. A total of
141 overlapping DEGs were identified among the three datasets
(Fig. 1A), consisting of 55
upregulated genes and 86 downregulated genes between BC and
non-cancerous tissues. These DEGs were visualized using Venn
diagrams and are listed in Table
II.
| Table II.A total of 141 DEGs were identified
from three profile datasets, including 55 upregulated and 86
downregulated genes in bladder cancer compared with normal
tissues. |
Table II.
A total of 141 DEGs were identified
from three profile datasets, including 55 upregulated and 86
downregulated genes in bladder cancer compared with normal
tissues.
| DEGs | Genes name |
|---|
| Upregulated | TPX2, CDK1, SAPCD2,
AURKA, AURKB, PAFAH1B3, CELSR3, TYMS, MCM5, MELK, CCNA2, CDCA5,
CKS2, CENPE, TACC3, CCNB2, PRC1, CDT1, CEP55, CDC45, NT5DC2, MCM2,
TMEM74B, DLGAP5, RAD51AP1, CKAP2L, KIAA0101, SHMT2, KIF11, ASF1B,
KIF2C, CENPA, CDC20, CENPN, BUB1, POLQ, TRIP13, TROAP, TK1, ASPM,
SLC7A5, TOP2A, SLC16A3, CA2, HJURP, HMMR, KIF20A, TTK, NCAPG,
SLC52A2, CENPM, FAM64A, CENPF, NUSAP1, CDCA8 |
| Downregulated | CPXM2, MSRB3,
LIMS2, CNN1, PALLD, HLA-DRA, CLEC3B, STON1, NDNF, FHL1, SORBS2,
PLSCR4, CSRP1, ANKDD1A, PLAC9, LGALS4, RNF150, LAMC3, PDK4, REEP1,
EFEMP1, BIN1, AXL, TCEAL2, RASL12, IGFBP6, P3H2, PID1, P2RX1, SRPX,
ACACB, PGM5, PRAC1, GSTM5, SOBP, SH3GL2, PLPPR4, CYBRD1, SYNM,
C2orf40, CFD, RNASE4, WLS, HSPB6, FAM129A, DACT3, CFH, FLNC,
ANTXR2, ABCA8, LMOD1, ZBTB16, KCNMB1, DES, MYH11, KBTBD11, CPED1,
PRICKLE2, FERMT2, DPT, MFAP4, MGLL, SCARA5, SDPR, SORBS1, CYGB,
KLHL13, FGF9, TSHZ3, SPARCL1, ITM2A, COX7A1, ACTG2, TMOD1, TGFBR2,
PCP4, FAM107A, GPX3, PTGS1, CASQ2, LPAR1, MAMDC2, ACOX2, EVA1C,
NDN, FBLN5 |
PPI network construction and module
analyses
A PPI network of the 141 DEGs was constructed to
elucidate and investigate the PPIs (Fig.
1B). The MCODE plug-in of Cytoscape was used to identify the
clusters in the PPI networks. (Fig.
1C). The cluster network consisted of 45 nodes and 954 edges.
Sequentially it was showed as follows: CKS2, ASPM, MELK, BUB1,
DLGAP5, AURKB, CKAP2L, CCNB2, TK1, MCM2, CDC45, CEP55, HJURP,
KIF20A, CDK1, KIAA0101, ASF1B, KIF11, HMMR, TPX2, CCNA2, CDCA5,
AURKA, CENPM, NCAPG, CENPE, KIF2C, TACC3, CENPF, FAM64A, CENPN,
RAD51AP1, TYMS, POLQ, CDT1, NUSAP1, MCM5, CDCA8, TROAP, PRC1,
CDC20, TRIP13, TOP2A, TTK and CENPA. These node genes with high hub
degrees may play critical roles in BC. Subsequently, the results
indicated that the genes in the most significant module were mainly
enriched in ‘mitotic cell cycle process’, ‘cell cycle’, ‘mitotic
nuclear division’, ‘cell division’, ‘adenyl nucleotide binding’,
‘ATP binding’ and ‘oocyte meiosis’ (Table III).
| Table III.GO and Kyoto Encyclopedia of Genes
and Genomes pathway enrichment analyses of DEGs in the most
significant module. |
Table III.
GO and Kyoto Encyclopedia of Genes
and Genomes pathway enrichment analyses of DEGs in the most
significant module.
| Pathway ID | Pathway
description | Count in gene
set | FDR |
|---|
| GO:1903047 | Mitotic cell cycle
process | 35 |
1.73×10⁻³² |
| GO:0007049 | Cell cycle | 38 |
4.27×10⁻²⁸ |
| GO:0007067 | Mitotic nuclear
division | 25 |
3.48×10⁻²⁴ |
| GO:0051301 | Cell division | 26 |
9.13×10⁻²³ |
| GO:0005819 | Spindle | 17 |
1.33×10⁻¹³ |
| GO:0015630 | Microtubule
cytoskeleton | 24 |
3.51×10⁻¹² |
| GO:0000793 | Condensed
chromosome | 13 |
7.37×10⁻¹⁰ |
| GO:0005524 | ATP binding | 17 |
4.35×10⁻⁵ |
| GO:0032559 | Adenyl
ribonucleotide binding | 17 |
6.09×10⁻⁵ |
| GO:0030554 | Adenyl nucleotide
binding | 17 |
6.74×10⁻⁵ |
| hsa04110 | Cell cycle | 9 |
4.08×10⁻⁸ |
| hsa04114 | Oocyte meiosis | 5 | 0.061 |
GO functional annotation and KEGG
pathway enrichment analysis
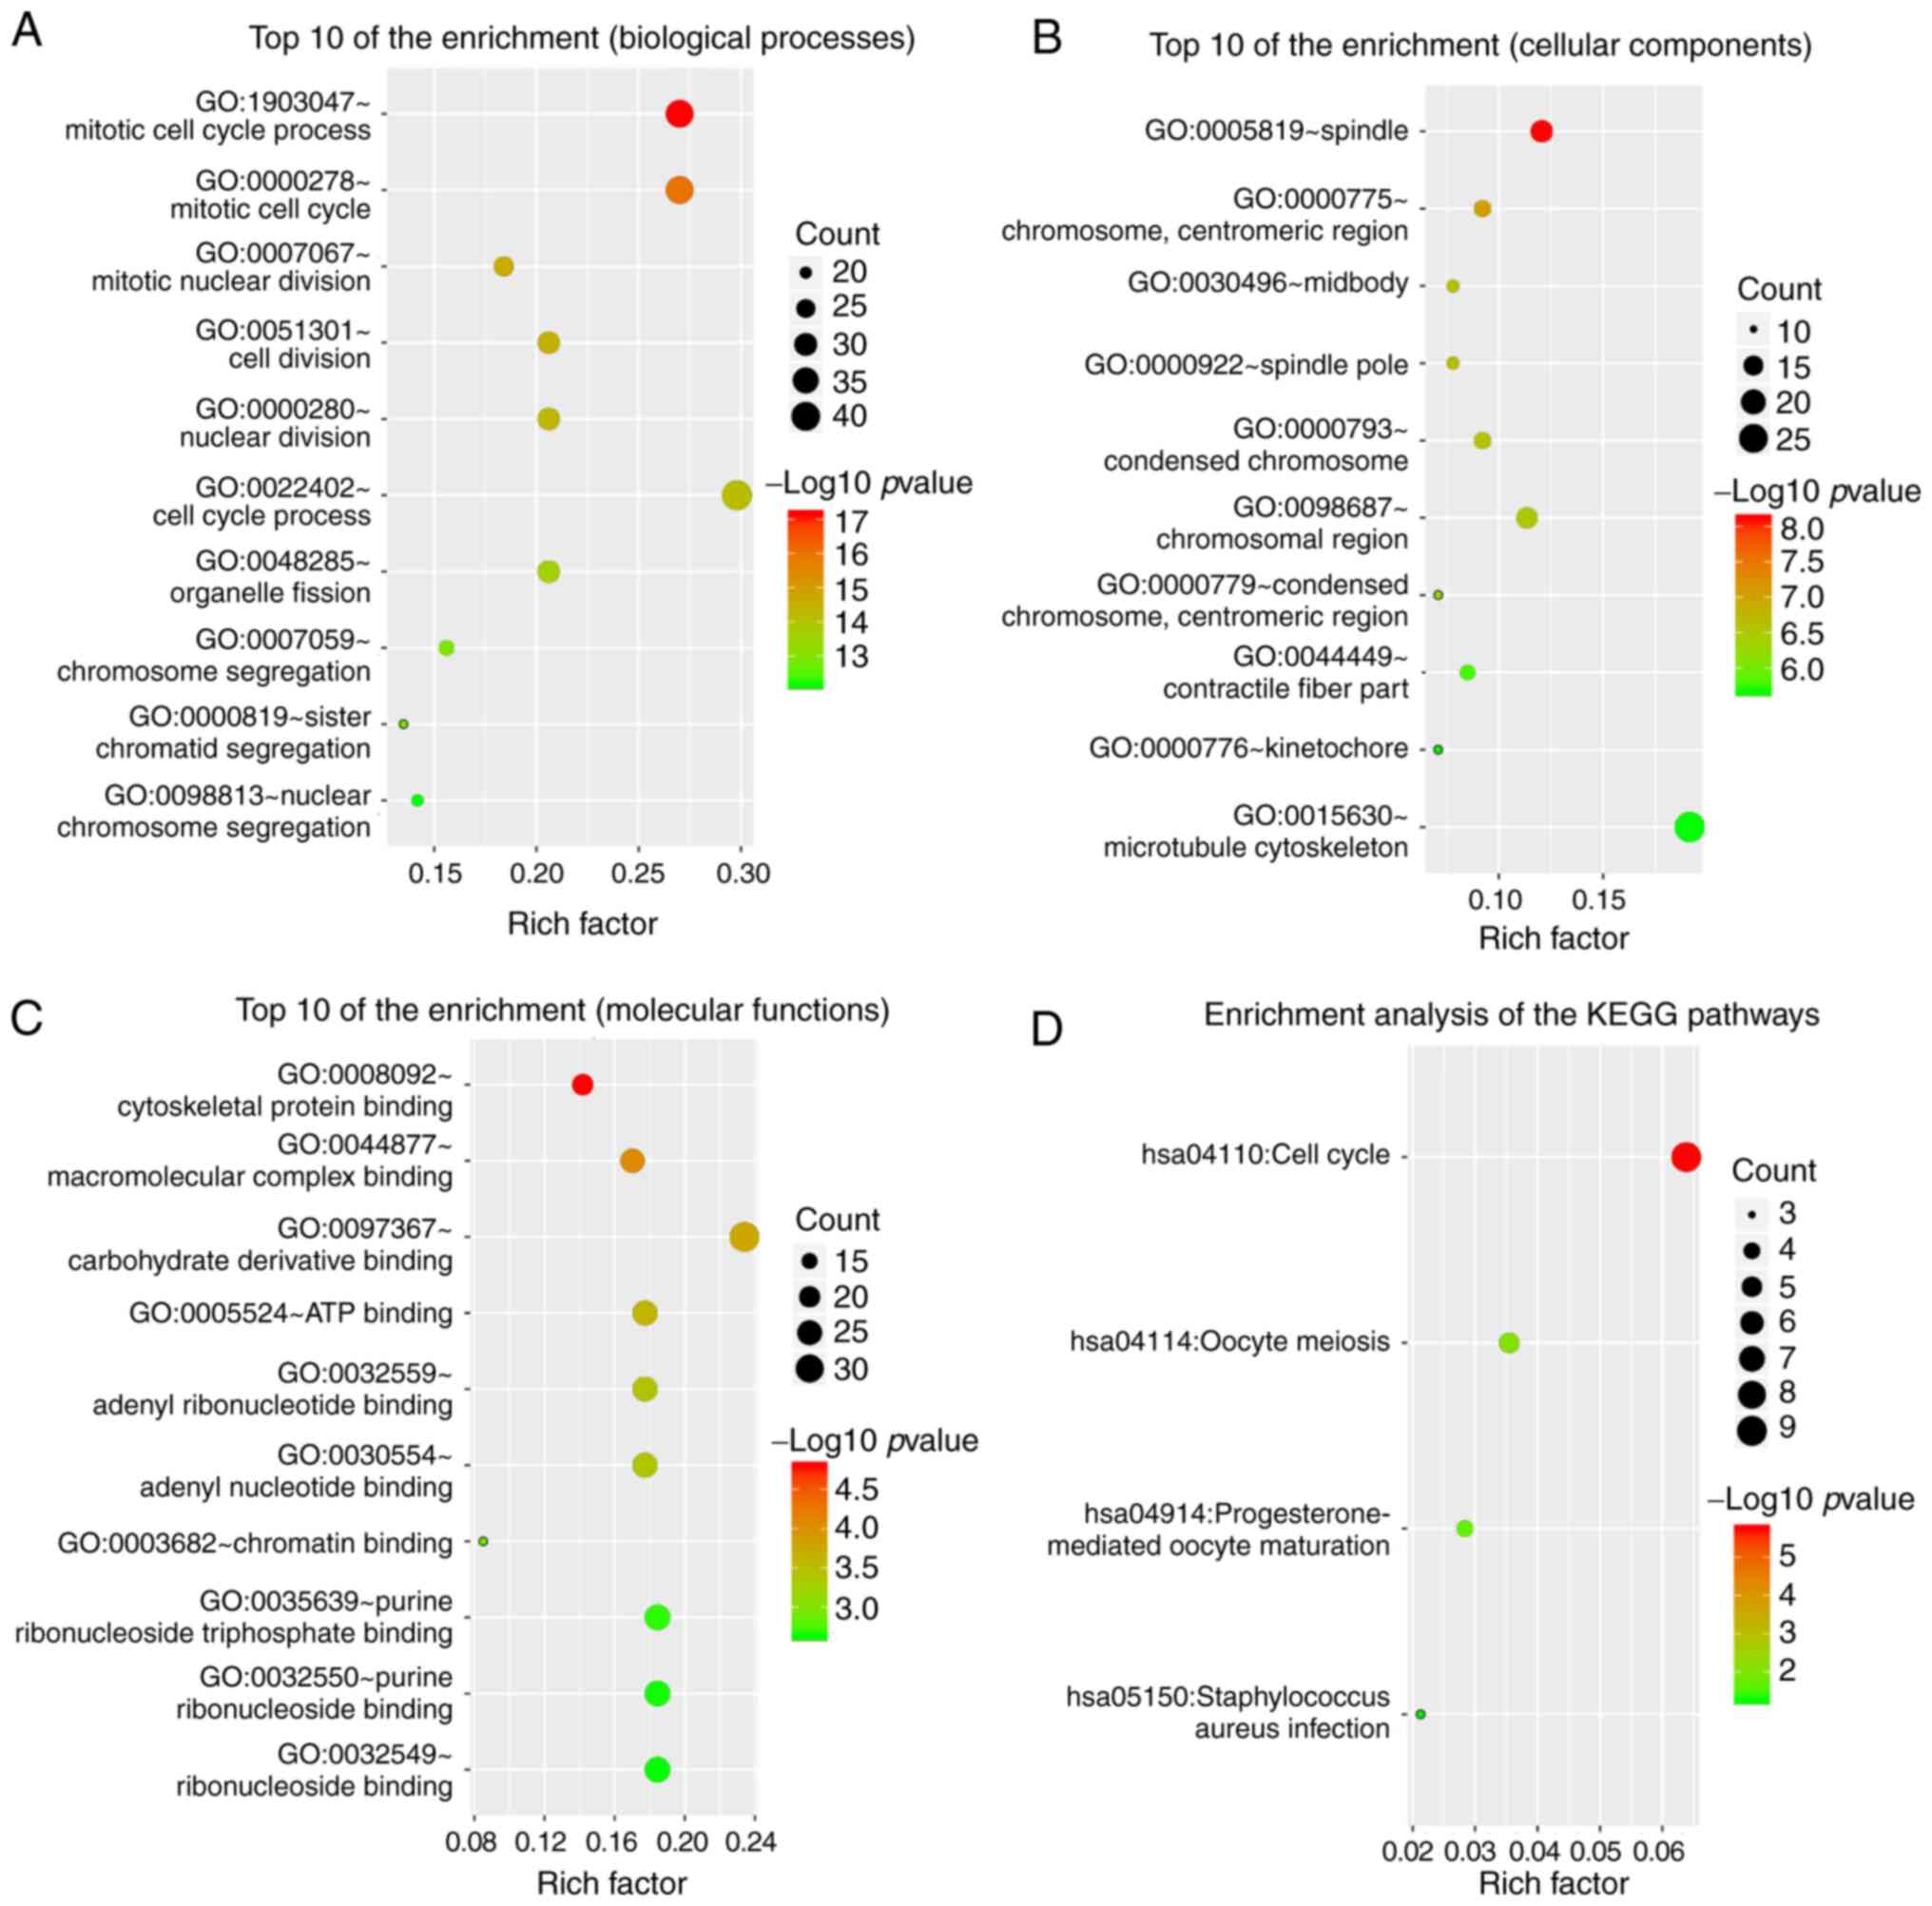
GO functional annotation and KEGG pathway enrichment
analysis were used to investigate the biological functions of DEGs
using DAVID. GO enrichment analysis results indicated that the DEGs
in biological processes (BP) were mainly enriched in ‘mitotic cell
cycle process’, ‘organelle fission’, ‘nuclear/cell division’ and
‘chromosome segregation’ (Fig. 2A).
Moreover, the DEGs in cell component were enriched in ‘spindle’,
‘condensed chromosome’, ‘midbody’ and ‘microtubule cytoskeleton’
(Fig. 2B). Alterations in molecular
function (MF) were abundant in ‘carbohydrate derivative binding’,
‘cytoskeletal protein binding’, ‘ATP binding’, ‘ribonucleoside
binding’ and ‘chromatin binding’ (Fig.
2C). The KEGG pathway enrichment analysis revealed that the
DEGs were mainly abundant in ‘cell cycle’, ‘oocyte meiosis’ and
‘progesterone-mediated oocyte maturation’ (Fig. 2D).
Identification and analysis of hub
genes
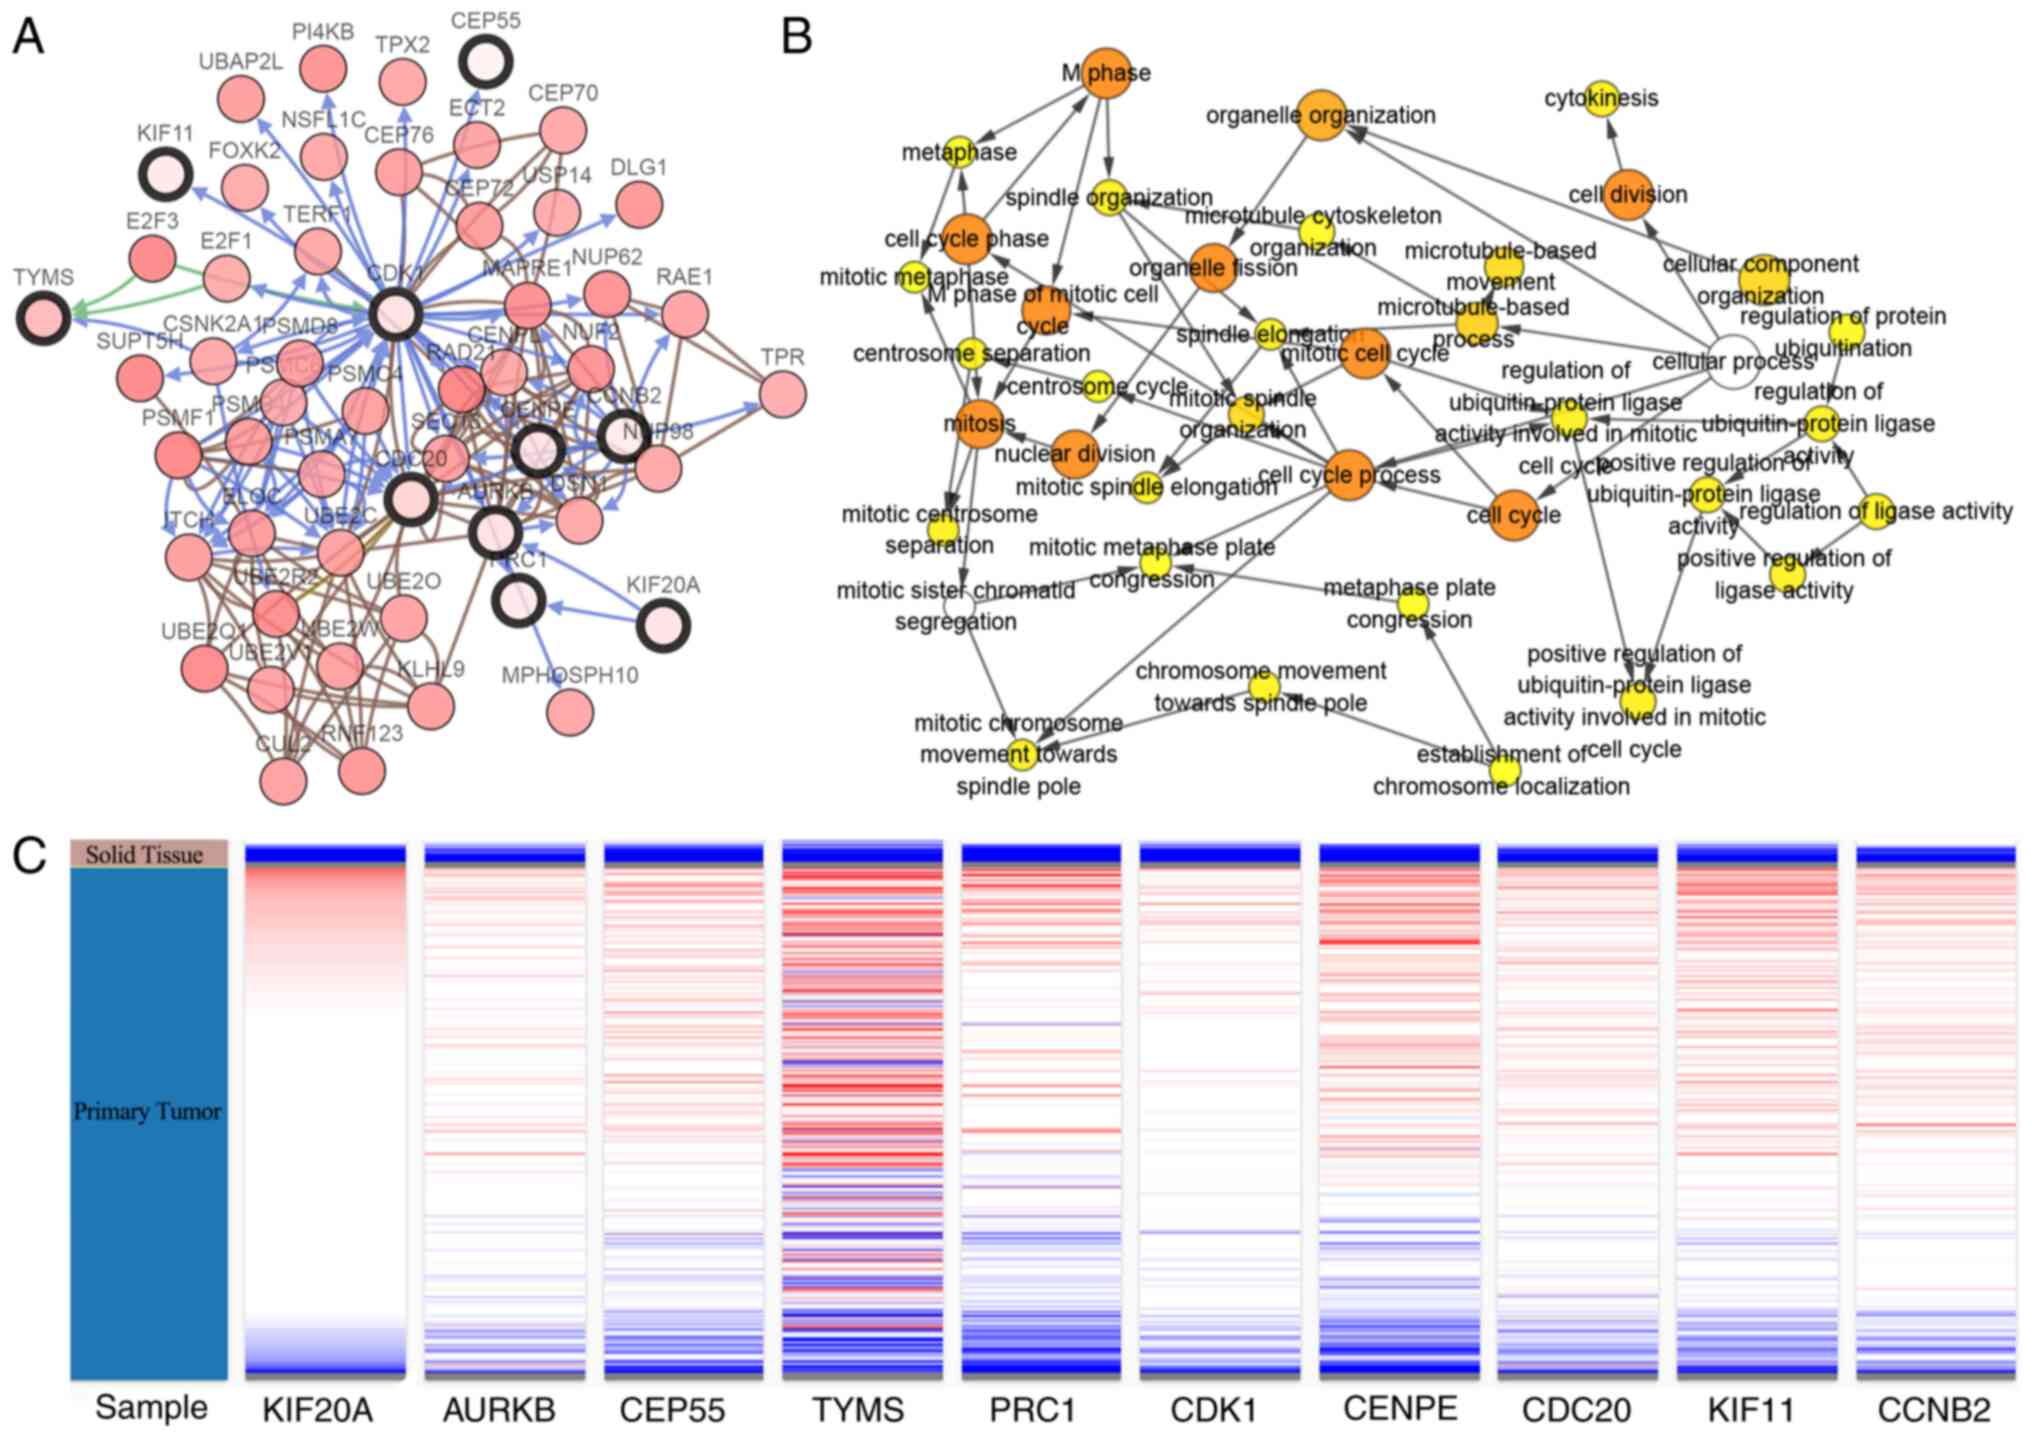
According to the degree score generated by the
cytohubba plug-in, the top ten genes, including TYMS, AURKB, CDK1,
CCNB2, CEP55, KIF20A, KIF11, CENPE, PRC1 and CDC20, were identified
as potential hub genes. A co-expression network of these genes was
generated for analysis using the cBioPortal platform (Fig. 3A). Moreover, the BiNGO plug-in
analyzed the biological process analyses of the hub genes. The
alterations were enriched in cell cycle process, mitosis, mitotic
spindle organization, organelle organization, regulation of
ubiquitin-protein ligase activity and establishment of chromosome
localization (Fig. 3B).
Subsequently, the UCSC Cancer Genomics Browser was used to analyze
hierarchical clustering. Hierarchical clustering showed that the
hub genes could differentiate bladder tumor tissues from
non-cancerous tissues (Fig. 3C).
These results may provide insight into how cancerous tissues
differentiate from normal bladder tissues.
KIF11 is a promising gene target in
bladder cancer
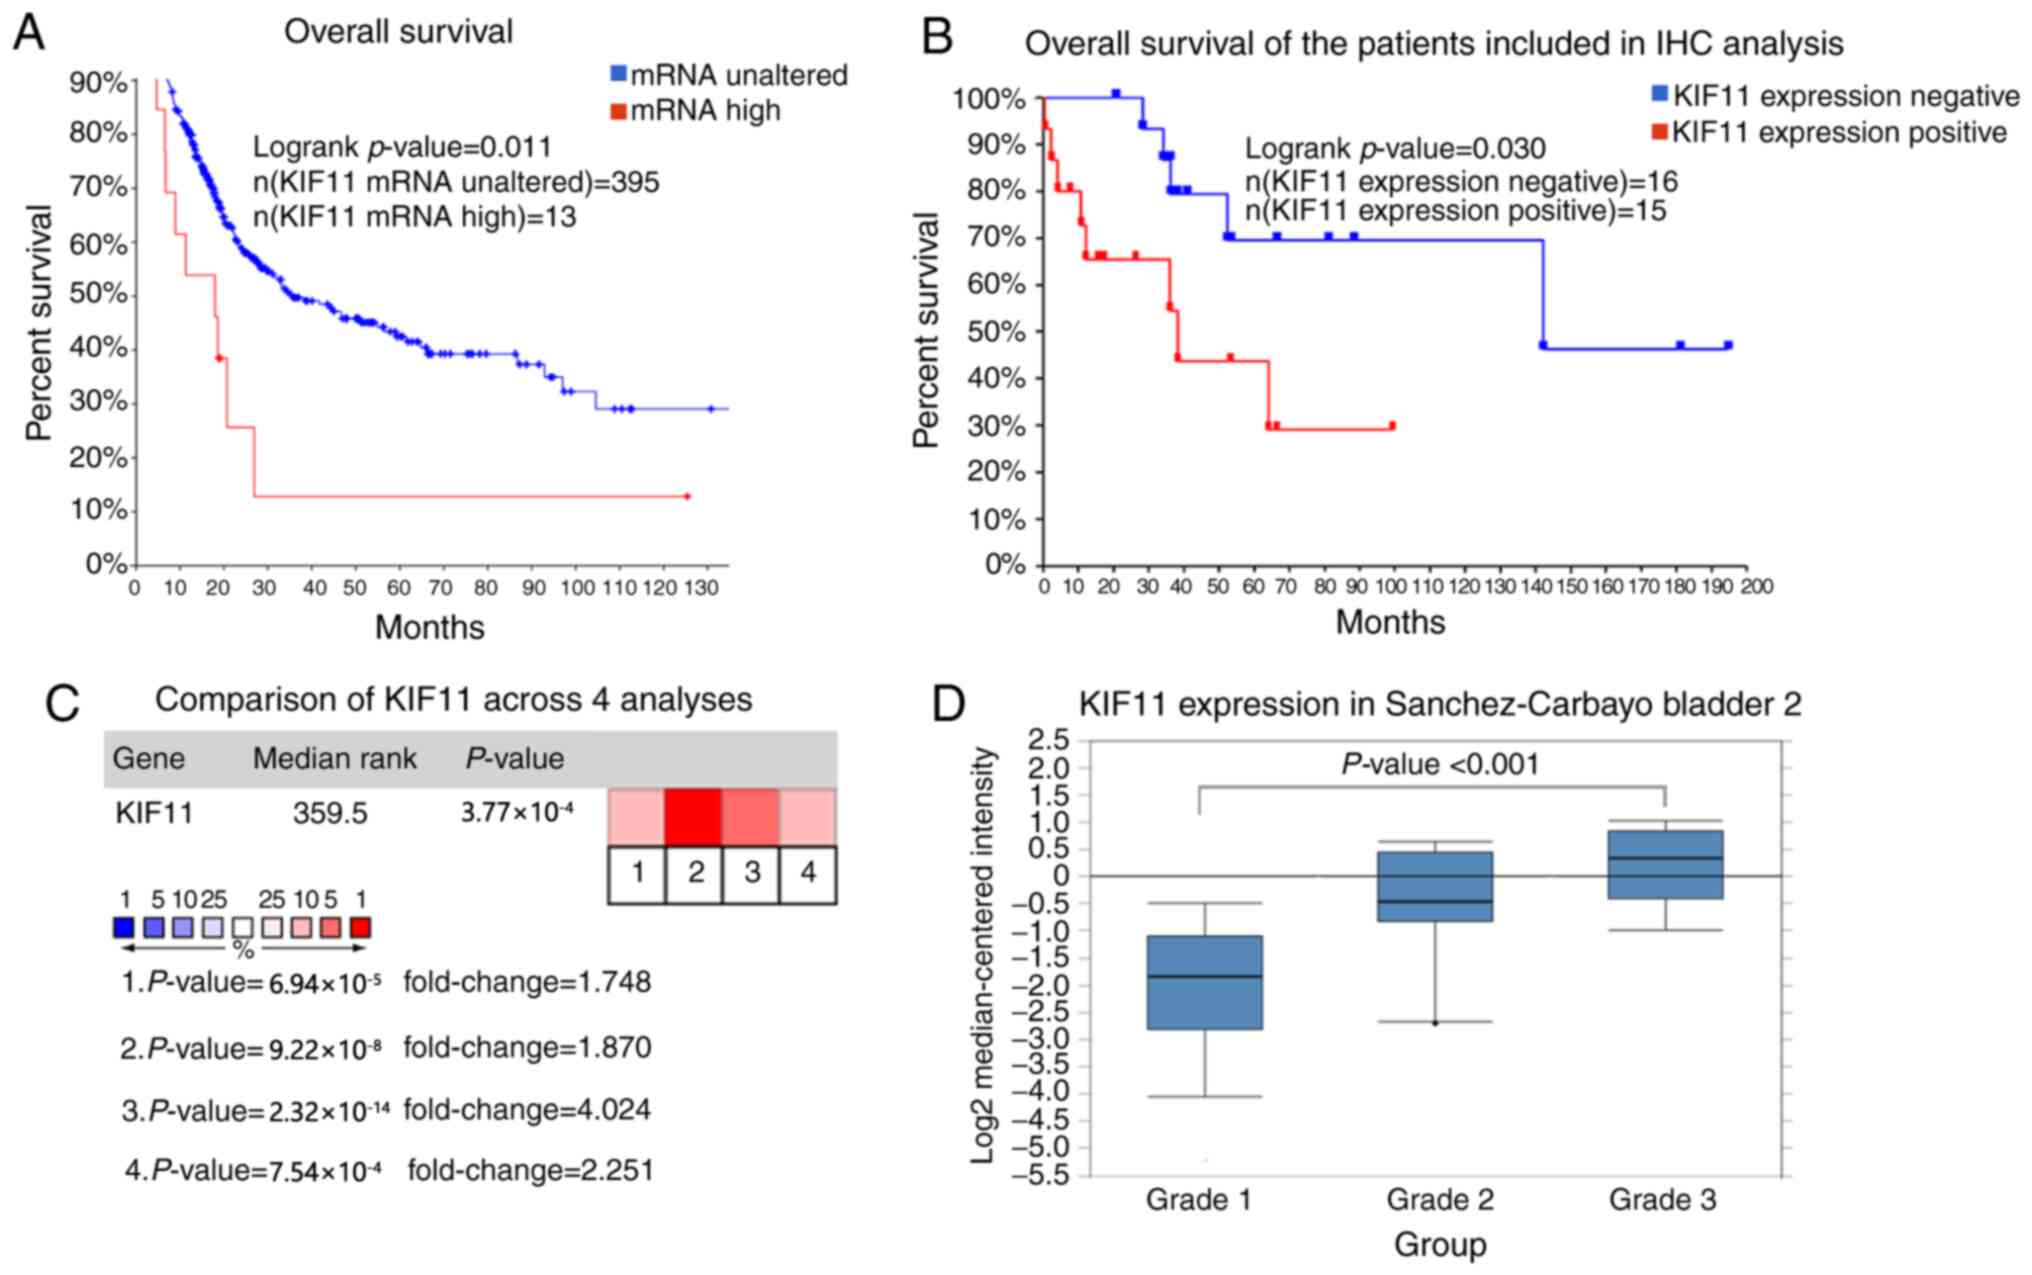
Among the identified hub genes, KIF11 was connected
to 36 nodes in the cluster network constructed using Cytoscape,
indicating it may play significant roles in the progression or
carcinogenesis of BC. The overall survival of KIF11 was performed
using Kaplan-Meier curve according to the data from cBioPortal.
Patients with BC with KIF11 mRNA alterations exhibited a poorer
overall survival rate (P=0.011; Fig.
4A). As for the patient samples included in IHC analysis, the
overall survival rate of patients with high KIF11 expression was
lower compared with that in patients with low KIF11 expression
(P=0.030; Fig. 4B). Moreover,
Oncomine analysis of cancer vs. normal tissue indicated that KIF11
was overexpressed in BC in four different datasets, including
Dyrskjot Bladder 3 (20), Lee
Bladder (21), Sanchez-Carbayo
Bladder 2 (22) and Sanchez-Carbayo
Bladder 2 (23) (P<0.001;
Fig. 4C). In the Sanchez-Carbayo
Bladder 2 dataset, three groups in different tumor grade were
compared, and higher expression levels of KIF11 mRNA were
associated with tumor grade (22)
(P<0.001; Fig. 4D).
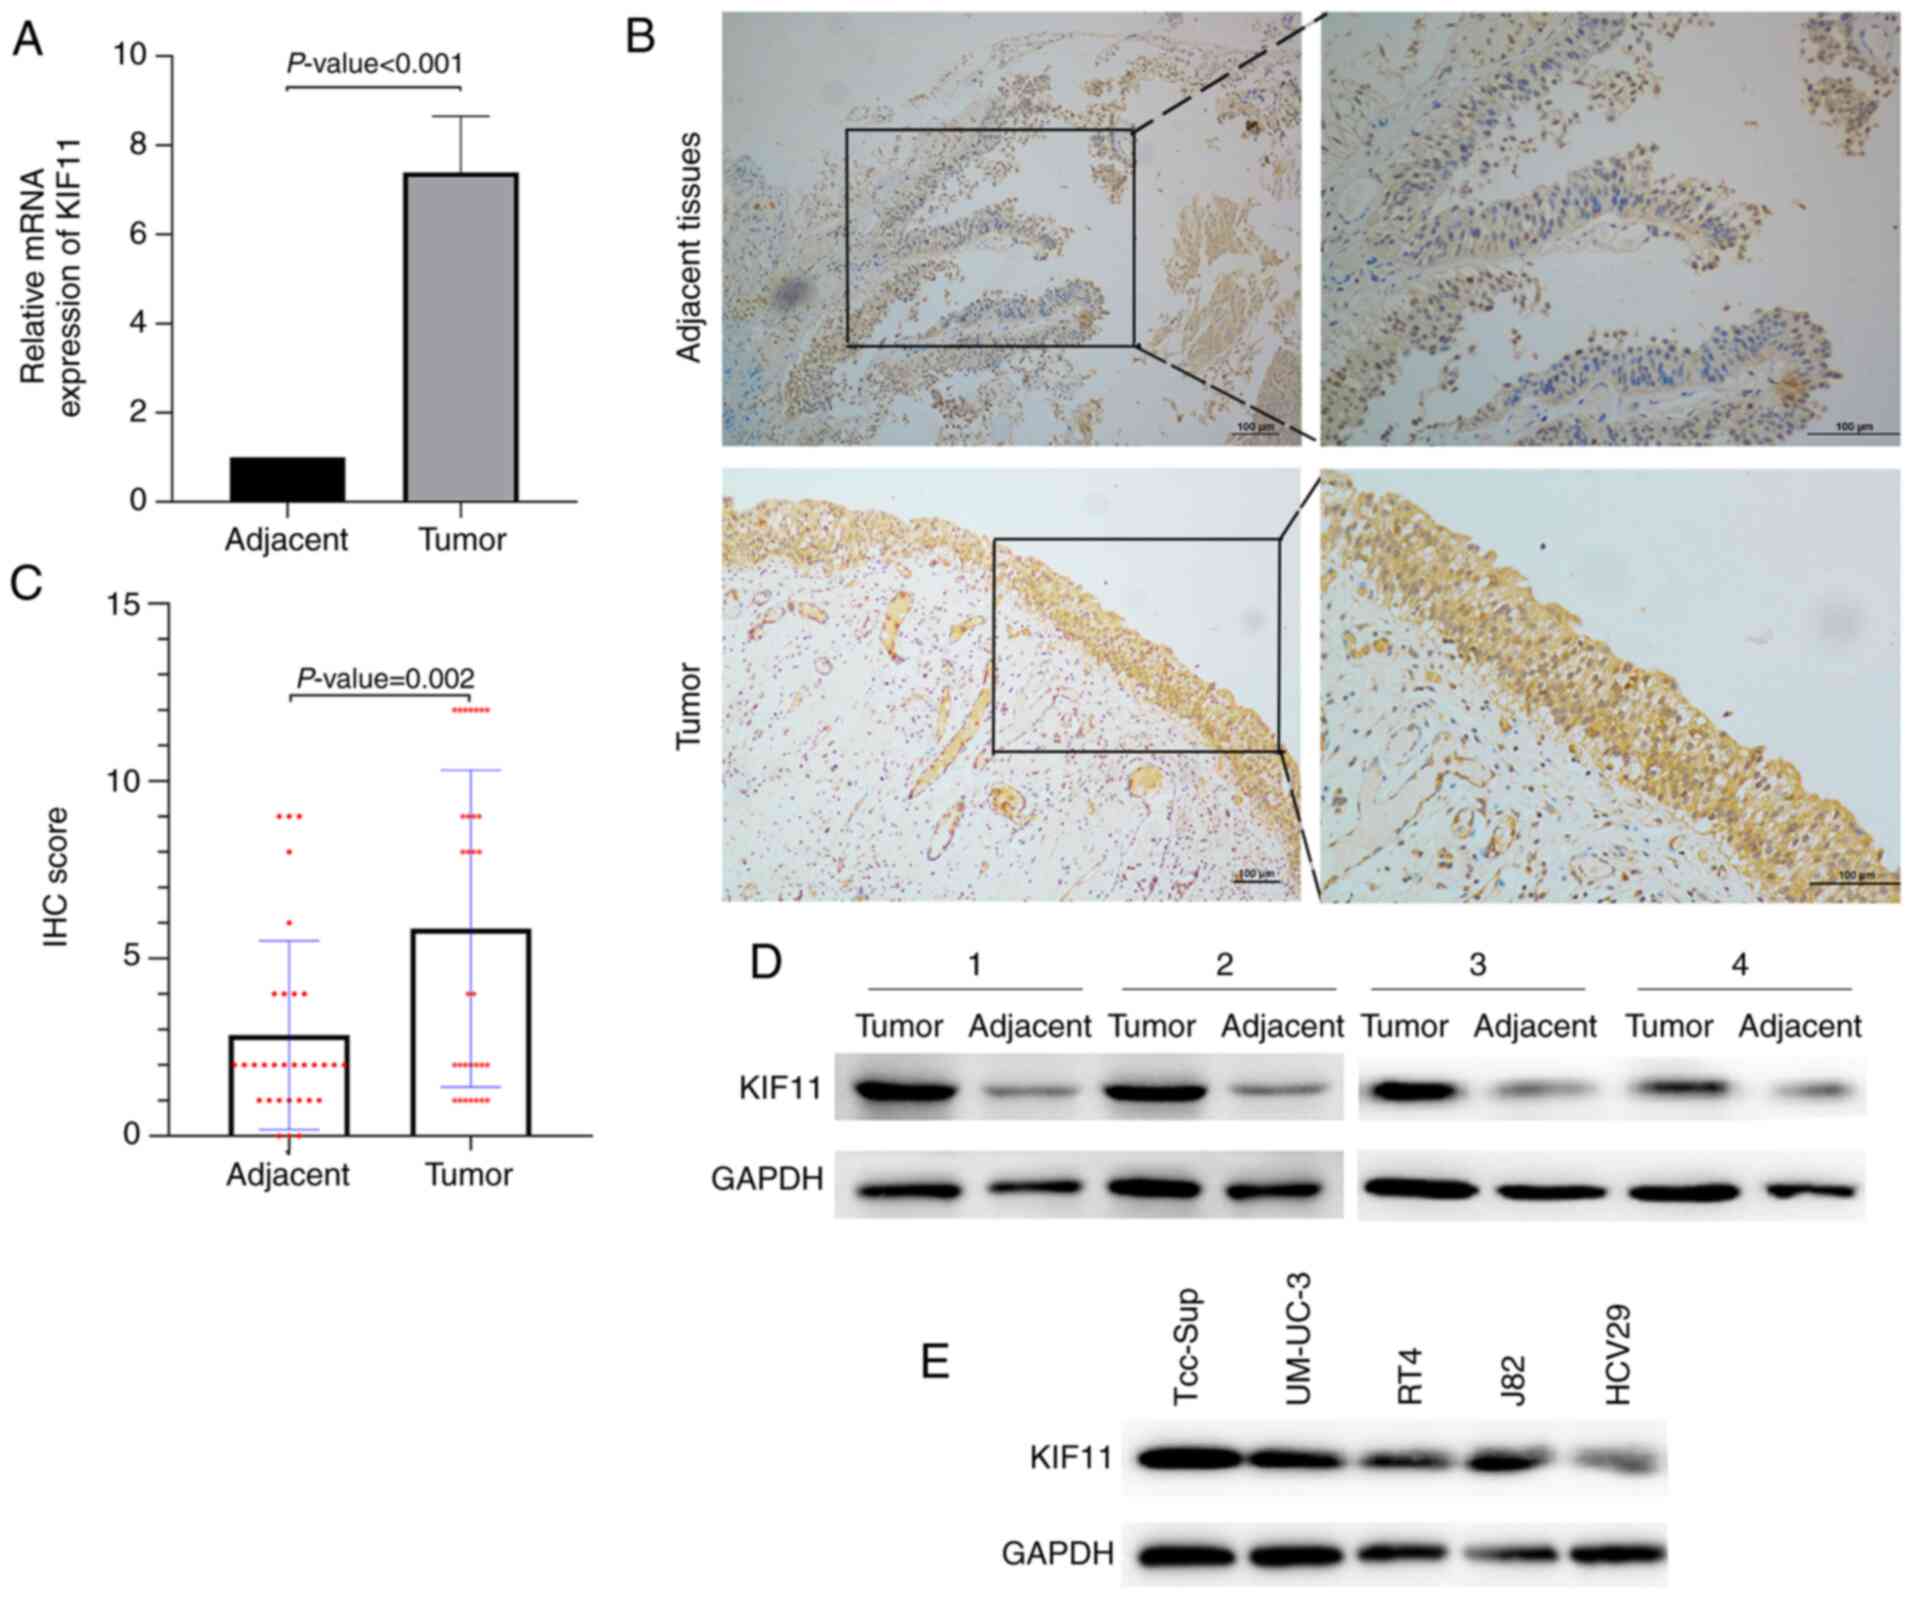
KIF11 expression is upregulated in BC
samples and bladder cells
The mRNA expression level of KIF11 was examined in
31 BC and adjacent tissues. RT-qPCR analysis revealed that KIF11
was highly expressed in BC tissues compared with the adjacent
tissues (P<0.001; Fig. 5A).
Subsequently, protein expression levels of KIF11 were analyzed
using IHC (Fig. 5B). Increased IHC
score of KIF11 was observed in BC samples compared with the
adjacent tissues (P=0.002; Fig. 5C).
The clinicopathological characteristics of patients with BC were
included in the IHC analysis and their associations with KIF11
expression are presented in Table
IV. The age at diagnosis ranged from 26 to 85 years and there
were 22 males and 9 females. The results suggested that KIF11
expression was significantly associated with tumor stage (P=0.035),
tumor grade (P=0.046) and invasiveness (P=0.023). However, KIF11
expression was not associated with age, sex, lymph node metastasis
and distant metastasis. Furthermore, western blot analysis showed
that the expression of the KIF11 protein was higher in these four
samples compared with in the adjacent normal tissues (Fig. 5D). Also, the expression of the KIF11
protein was upregulated in four human bladder cell lines (Tcc-Sup,
UM-UC-3, RT4 and J82) compared with a normal urinary tract cell
line (HCV29) (Fig. 5E). Together,
these results indicated increased expression of KIF11 mRNA and
protein in bladder cancer at both the transcriptional and
translational levels.
| Table IV.Association between KIF11 expression
and clinicopathological characteristics of bladder cancer patients
included in IHC analysis. |
Table IV.
Association between KIF11 expression
and clinicopathological characteristics of bladder cancer patients
included in IHC analysis.
|
|
| KIF11
expression |
|
|---|
|
|
|
|
|
|---|
| Variables | Patients | Positive, n=15 | Negative, n=16 |
P-valuea |
|---|
| Age, years |
|
|
| 0.473 |
|
<65 | 18 | 10 | 8 |
|
|
≥65 | 13 | 5 | 8 |
|
| Sex |
|
|
| 0.433 |
|
Male | 22 | 12 | 10 |
|
|
Female | 9 | 3 | 6 |
|
| Tumor stage |
|
|
| 0.035 |
|
Ta/Tis/T1 | 11 | 2 | 9 |
|
| T2 | 13 | 9 | 4 |
|
|
T3/T4 | 7 | 4 | 3 |
|
| Tumor grade |
|
|
| 0.046 |
| G1 | 8 | 1 | 7 |
|
| G2 | 5 | 2 | 3 |
|
| G3 | 18 | 12 | 6 |
|
| Lymph node
metastasis |
|
|
| 1.000 |
|
Negative | 25 | 12 | 13 |
|
|
Positive | 6 | 3 | 3 |
|
| Distant
metastasis |
|
|
| 0.654 |
| No | 26 | 12 | 14 |
|
|
Yes | 5 | 3 | 2 |
|
| Invasiveness |
|
|
| 0.023 |
|
Non-invasive | 11 | 2 | 9 |
|
|
Invasive | 20 | 13 | 7 |
|
Discussion
Bioinformatics plays a significant role in current
tumor research, contributing to a better understanding of
carcinogenesis using systematic bioinformatic methods (25). Novel biomarkers with high prognostic
efficiency are needed. Microarray technology has become a method
for exploring genetic alterations in BC and identifying potentially
useful biomarkers (26).
KIF11 belongs to the kinesin-5 family of proteins
and has functions in numerous physiological functions, including
cell cycle, cell mitosis and intracellular vesicle transport
(27). Several studies have shown
that KIF11 is upregulated in a wide variety of tumors, such as
gastric, oral and breast cancer, meningioma, clear cell renal cell
carcinoma and prostate cancer (28–33).
However, the interaction among BC and KIF11 has not been widely
reported and the levels of expression and biological functions of
KIF11 in BC remain unclear. In the present study, three microarray
datasets were used to identify potential candidate genes in BC. A
total of 141 DEGs was identified, including 55 upregulated genes
and 86 downregulated genes. The top ten DEGs caused significant
alterations in GO enrichment and KEGG pathway analysis. GO
enrichment suggested that the DEGs were associated with the cell
cycle, cell division, mitotic nuclear division, chromosome
segregation, sister chromatid cohesion and mitotic cytokinesis.
Moreover, the KEGG pathway enrichment analysis showed associations
with cell cycle, oocyte meiosis and progesterone-mediated oocyte
maturation. Cell division and cell cycle are the basic processes in
cell proliferation, and their abnormalities contribute to
carcinogenesis and tumor progression (34). Ten hub genes, including TYMS, AURKB,
CDK1, CCNB2, CEP55, KIF20A, KIF11, CENPE, PRC1 and CDC20 were
identified according to PPI network of DEGs analyses. In previous
studies, worse survival outcomes in bladder cancer patients were
observed for high AURKB levels (35). High co-expression of TFCP2L1 and CDK1
in tumor tissues of patients with bladder cancer is associated with
unfavorable clinical features, including high tumor grade and
distant metastasis (36). CCNB2 is
overexpressed in bladder cancer, and the downregulation of CCNB2
expression in bladder cancer inhibits cell invasion and migration
(37). These previous studies
clarified the importance of hub genes in BC. In the present study,
KIF11 was connected to 36 nodes in the cluster network and was the
most significant gene, indicating it may play significant roles in
the progression or carcinogenesis of BC.
The overall survival analysis indicated that
patients with BC with alterations in KIF11 mRNA or with elevated
KIF11 expression exhibited poorer overall survival rate. To verify
this finding, the ONCOMINE database was used to evaluate the mRNA
level of KIF11 in other datasets and it revealed that KIF11
overexpression was common in BC in four different datasets.
Furthermore, the upregulation of KIF11 was associated with tumor
grade. Also, Daigo et al (29) observed that the overexpression of
KIF11 in oral cancer is associated with advanced pathological (p)
Tumor stage and advanced pNode stage, which is consistent with the
present results that KIF11-overexpression was significantly
associated with tumor stage (29).
Moreover, 31 paired BC and adjacent tissues were analyzed and
upregulation of KIF11 in BC samples and bladder cells was further
validated using RT-qPCR, IHC analysis and western blotting. The
current findings suggested that KIF11 could be used as a potential
prognostic biomarker in BC.
In summary, the present study aimed to identify DEGs
that may be involved in progression or carcinogenesis of BC and
KIF11 was identified as a potential useful candidate gene. However,
further studies with larger sample sizes should be performed to
validate the present findings. Also, further investigation is
required to elucidate the molecular mechanisms of KIF11. Soft agar
colony formation and Transwell assays should be used to investigate
the effect of the KIF11 proteins on the clonability and
invasiveness of the BC cells. As KIF11 is overexpressed in tumor
cells and tissues, it is speculated that the change may also exist
in circulating tumor cells.
Acknowledgements
Not applicable.
Funding
The study was funded by The National Key Research
and Development Program of China (grant no. Q2018YFC1313400) and
The Natural Science Foundation of Guangdong Province (grant no.
2018A0303130344).
Availability of data and materials
The data used to support the findings of this study
are available from the corresponding author upon request. The
datasets analyzed during the current study are available in the GEO
(https://www.ncbi.nlm.nih.gov/geo/),
DAVID (http://david.ncifcrf.gov), STRING
(http://string-db.org), GO (https://www.geneontology.org), KEGG (https://www.genome.jp/kegg/), Oncomine (http://www.oncomine.com) and TCGA (https://cancergenome.nih.gov/) databases.
Authors' contributions
XCM, ZTZ, DSW and JCX conceived of the study and
performed the experiments. XCM, ZTZ, DSW, JCX, MJS, ZQZ, JXZ, YFD,
FZS, JYY, JYH and YH collected data. XCM, DSW, JCX ZTZ and MJS
contributed to the writing of the manuscript. MJS, ZQZ, JXZ, YFD,
FZS, JYY, JYH and YH contributed to the data analysis. DSW and JCX
supervised the study. DSW, JCX and MJS confirm the authenticity of
all raw data. DSW and JCX revised the manuscript for important
intellectual content. All the authors read and approved the final
manuscript.
Ethics approval and consent to
participate
The study was performed according to the principles
of the Declaration of Helsinki and was approved by The Research
Ethics Committee of Sun Yat-sen University (Guangzhou, China).
Written informed consent was obtained from each patient.
Patient consent for publication
Not applicable.
Competing interests
The authors declare that they have no competing
interests.
References
|
1
|
Siegel RL, Miller KD and Jemal A: Cancer
statistics, 2019. CA Cancer J Clin. 69:7–34. 2019. View Article : Google Scholar : PubMed/NCBI
|
|
2
|
Cai Q, Chen Y, Xin S, Zhang D, Pan J, Xie
Z, Xu C, Li S, Zhang X, Gao Y, et al: Temporal trends of bladder
cancer incidence and mortality from 1990 to 2016 and projections to
2030. Transl Androl Urol. 9:153–165. 2020. View Article : Google Scholar : PubMed/NCBI
|
|
3
|
Zhou B, Zhang P, Wang Y, Shi S, Zhang K,
Liao H and Zhang L: Interleukin-17 gene polymorphisms are
associated with bladder cancer in a Chinese Han population. Mol
Carcinog. 52:871–878. 2013. View
Article : Google Scholar : PubMed/NCBI
|
|
4
|
Pençe S, Özbek E, Ozan Tiryakioğlu N and
Ersoy Tunali N: Deregulation of seven CpG island-harboring miRNAs
in bladder cancer: miR-155 and miR-23b as the most promising
oncomiRs. Cell Mol Biol (Noisy-le-grand). 62:25–30. 2016.
|
|
5
|
Wang L, Smith BA, Balanis NG, Tsai BL,
Nguyen K, Cheng MW, Obusan MB, Esedebe FN, Patel SJ, Zhang H, et
al: A genetically defined disease model reveals that urothelial
cells can initiate divergent bladder cancer phenotypes. Proc Natl
Acad Sci USA. 117:563–572. 2020. View Article : Google Scholar : PubMed/NCBI
|
|
6
|
Deng YB, Nagae G, Midorikawa Y, Yagi K,
Tsutsumi S, Yamamoto S, Hasegawa K, Kokudo N, Aburatani H and
Kaneda A: Identification of genes preferentially methylated in
hepatitis C virus-related hepatocellular carcinoma. Cancer Sci.
101:1501–1510. 2010. View Article : Google Scholar : PubMed/NCBI
|
|
7
|
Zhou N, Singh K, Mir MC, Parker Y, Lindner
D, Dreicer R, Ecsedy JA, Zhang Z, Teh BT, Almasan A and Hansel DE:
The investigational aurora kinase A inhibitor MLN8237 induces
defects in cell viability and cell-cycle progression in malignant
bladder cancer cells in vitro and in vivo. Clin Cancer Res.
19:1717–1728. 2013. View Article : Google Scholar : PubMed/NCBI
|
|
8
|
Borisov N, Tkachev V, Suntsova M,
Kovalchuk O, Zhavoronkov A, Muchnik I and Buzdin A: A method of
gene expression data transfer from cell lines to cancer patients
for machine-learning prediction of drug efficiency. Cell Cycle.
17:486–491. 2018. View Article : Google Scholar : PubMed/NCBI
|
|
9
|
Edgar R, Domrachev M and Lash AE: Gene
expression omnibus: NCBI gene expression and hybridization array
data repository. Nucleic Acids Res. 30:207–210. 2002. View Article : Google Scholar : PubMed/NCBI
|
|
10
|
Franceschini A, Szklarczyk D, Frankild S,
Kuhn M, Simonovic M, Roth A, Lin J, Minguez P, Bork P, von Mering C
and Jensen LJ: STRING v9.1: Protein-protein interaction networks,
with increased coverage and integration. Nucleic Acids Res.
41((Database Issue)): D808–D815. 2013.PubMed/NCBI
|
|
11
|
Smoot ME, Ono K, Ruscheinski J, Wang PL
and Ideker T: Cytoscape 2.8: New features for data integration and
network visualization. Bioinformatics. 27:431–432. 2011. View Article : Google Scholar : PubMed/NCBI
|
|
12
|
Bandettini WP, Kellman P, Mancini C,
Booker OJ, Vasu S, Leung SW, Wilson JR, Shanbhag SM, Chen MY and
Arai AE: MultiContrast delayed enhancement (MCODE) improves
detection of subendocardial myocardial infarction by late
gadolinium enhancement cardiovascular magnetic resonance: A
clinical validation study. J Cardiovasc Magn Reson. 14:832012.
View Article : Google Scholar : PubMed/NCBI
|
|
13
|
Huang DW, Sherman BT, Tan Q, Collins JR,
Alvord WG, Roayaei J, Stephens R, Baseler MW, Lane HC and Lempicki
RA: The DAVID gene functional classification tool: A novel
biological module-centric algorithm to functionally analyze large
gene lists. Genome Biol. 8:R1832007. View Article : Google Scholar : PubMed/NCBI
|
|
14
|
Ashburner M, Ball CA, Blake JA, Botstein
D, Butler H, Cherry JM, Davis AP, Dolinski K, Dwight SS, Eppig JT,
et al: Gene ontology: Tool for the unification of biology. The gene
ontology consortium. Nat Genet. 25:25–29. 2000. View Article : Google Scholar : PubMed/NCBI
|
|
15
|
Kanehisa M: The KEGG database. Novartis
Found Symp. 247:91–103, 119-128, 244–152. 2002. View Article : Google Scholar : PubMed/NCBI
|
|
16
|
Chin CH, Chen SH, Wu HH, Ho CW, Ko MT and
Lin CY: cytoHubba: Identifying hub objects and sub-networks from
complex interactome. BMC Syst Biol. 8 (Suppl 4):S112014. View Article : Google Scholar : PubMed/NCBI
|
|
17
|
Gao J, Aksoy BA, Dogrusoz U, Dresdner G,
Gross B, Sumer SO, Sun Y, Jacobsen A, Sinha R, Larsson E, et al:
Integrative analysis of complex cancer genomics and clinical
profiles using the cBioPortal. Sci Signal. 6:pl12013. View Article : Google Scholar : PubMed/NCBI
|
|
18
|
Maere S, Heymans K and Kuiper M: BiNGO: A
cytoscape plugin to assess overrepresentation of gene ontology
categories in biological networks. Bioinformatics. 21:3448–3449.
2005. View Article : Google Scholar : PubMed/NCBI
|
|
19
|
Kent WJ, Sugnet CW, Furey TS, Roskin KM,
Pringle TH, Zahler AM and Haussler D: The human genome browser at
UCSC. Genome Res. 12:996–1006. 2002. View Article : Google Scholar : PubMed/NCBI
|
|
20
|
Dyrskjøt L, Kruhøffer M, Thykjaer T,
Marcussen N, Jensen JL, Møller K and Ørntoft TF: Gene expression in
the urinary bladder: A common carcinoma in situ gene expression
signature exists disregarding histopathological classification.
Cancer Res. 64:4040–4048. 2004. View Article : Google Scholar : PubMed/NCBI
|
|
21
|
Lee JS, Leem SH, Lee SY, Kim SC, Park ES,
Kim SB, Kim SK, Kim YJ, Kim WJ and Chu IS: Expression signature of
E2F1 and its associated genes predict superficial to invasive
progression of bladder tumors. J Clin Oncol. 28:2660–2667. 2010.
View Article : Google Scholar : PubMed/NCBI
|
|
22
|
Sanchez-Carbayo M, Socci ND, Lozano J,
Saint F and Cordon-Cardo C: Defining molecular profiles of poor
outcome in patients with invasive bladder cancer using
oligonucleotide microarrays. J Clin Oncol. 24:778–789. 2006.
View Article : Google Scholar : PubMed/NCBI
|
|
23
|
Stransky N, Vallot C, Reyal F,
Bernard-Pierrot I, de Medina SG, Segraves R, de Rycke Y, Elvin P,
Cassidy A, Spraggon C, et al: Regional copy number-independent
deregulation of transcription in cancer. Nat Genet. 38:1386–1396.
2006. View
Article : Google Scholar : PubMed/NCBI
|
|
24
|
Livak KJ and Schmittgen TD: Analysis of
relative gene expression data using real-time quantitative PCR and
the 2(-Delta Delta C(T)) method. Methods. 25:402–408. 2001.
View Article : Google Scholar : PubMed/NCBI
|
|
25
|
Singer J, Irmisch A, Ruscheweyh HJ, Singer
F, Toussaint NC, Levesque MP, Stekhoven DJ and Beerenwinkel N:
Bioinformatics for precision oncology. Brief Bioinform. 20:778–788.
2019. View Article : Google Scholar : PubMed/NCBI
|
|
26
|
Li PC: Overview of microarray technology.
Methods Mol Biol. 1368:3–4. 2016. View Article : Google Scholar : PubMed/NCBI
|
|
27
|
Whitehead CM and Rattner JB: Expanding the
role of HsEg5 within the mitotic and post-mitotic phases of the
cell cycle. J Cell Sci. 111:2551–2561. 1998.PubMed/NCBI
|
|
28
|
Imai T, Oue N, Nishioka M, Mukai S, Oshima
T, Sakamoto N, Sentani K, Matsusaki K, Yoshida K and Yasui W:
Overexpression of KIF11 in gastric cancer with intestinal mucin
phenotype. Pathobiology. 84:16–24. 2017. View Article : Google Scholar : PubMed/NCBI
|
|
29
|
Daigo K, Takano A, Thang PM, Yoshitake Y,
Shinohara M, Tohnai I, Murakami Y, Maegawa J and Daigo Y:
Characterization of KIF11 as a novel prognostic biomarker and
therapeutic target for oral cancer. Int J Oncol. 52:155–165.
2018.PubMed/NCBI
|
|
30
|
Zhou J, Chen WR, Yang LC, Wang J, Sun JY,
Zhang WW, He ZY and Wu SG: KIF11 functions as an oncogene and is
associated with poor outcomes from breast cancer. Cancer Res Treat.
51:1207–1221. 2019. View Article : Google Scholar : PubMed/NCBI
|
|
31
|
Jungwirth G, Yu T, Moustafa M, Rapp C,
Warta R, Jungk C, Sahm F, Dettling S, Zweckberger K, Lamszus K, et
al: Identification of KIF11 as a novel target in meningioma.
Cancers (Basel). 11:5452019. View Article : Google Scholar
|
|
32
|
Jin Q, Dai Y, Wang Y, Zhang S and Liu G:
High kinesin family member 11 expression predicts poor prognosis in
patients with clear cell renal cell carcinoma. J Clin Pathol.
72:354–362. 2019. View Article : Google Scholar : PubMed/NCBI
|
|
33
|
Piao XM, Byun YJ, Jeong P, Ha YS, Yoo ES,
Yun SJ and Kim WJ: Kinesin family member 11 mRNA expression
predicts prostate cancer aggressiveness. Clin Genitourin Cancer.
15:450–454. 2017. View Article : Google Scholar : PubMed/NCBI
|
|
34
|
Chen L, Yuan L, Qian K, Qian G, Zhu Y, Wu
CL, Dan HC, Xiao Y and Wang X: Identification of biomarkers
associated with pathological stage and prognosis of clear cell
renal cell carcinoma by co-expression network analysis. Front
Physiol. 9:3992018. View Article : Google Scholar : PubMed/NCBI
|
|
35
|
Burgess EF, Livasy C, Trufan S, Hartman A,
Guerreri R, Naso C, Clark PE, Grigg C, Symanowski J and Raghavan D:
High aurora kinase expression identifies patients with
muscle-invasive bladder cancer who have poor survival after
neoadjuvant chemotherapy. Urol Oncol. 37:900–906. 2019. View Article : Google Scholar : PubMed/NCBI
|
|
36
|
Heo J, Noh BJ, Lee S, Lee HY, Kim Y, Lim
J, Ju H, Yu HY, Ryu CM, Lee PC, et al: Phosphorylation of TFCP2L1
by CDK1 is required for stem cell pluripotency and bladder
carcinogenesis. EMBO Mol Med. 12:e108802020. View Article : Google Scholar : PubMed/NCBI
|
|
37
|
Lei CY, Wang W, Zhu YT, Fang WY and Tan
WL: The decrease of cyclin B2 expression inhibits invasion and
metastasis of bladder cancer. Urol Oncol. 34:237.e1–e10. 2016.
View Article : Google Scholar
|