Introduction
Pancreatic cancer is one of the most malignant
tumors of the digestive system globally (1). The Global Cancer Observatory (GLOBOCAN)
estimated pancreatic cancer caused >432,242 deaths per year,
accounting for 4.5% of all deaths worldwide in 2018 (2). Inspite of the achievements in diagnosis
and management of pancreatic cancer, the disease-free overall
5-year survival rate is ~6% (2–9%) (3). Histologically, pancreatic ductal
adenocarcinoma (PDAC) is the most common histological type. The
most typical histological feature of PDAC is an infiltrative growth
pattern with intensive desmoplastic stroma that is comprised of
cancer-associated fibroblasts (CAFs) characterized by α-smooth
muscle actin (αSMA) expression (4).
Several studies have suggested that CAFs promote cancer progression
through various intercellular communications, such as transforming
growth factor b (TGF-b) signaling, stimulating angiogenesis etc.
(5–11).
In fact, the growth pattern of PDAC and degree of
stromal desmoplasia varies in individual cases. The infiltrative
growth pattern with abundant fibrous stroma is indeed the most
common type; however, some patients show solid growth. We
hypothesized that these histological differences in PDAC would be
associated with the preoperative image, such as that obtained via
dynamic contrast-enhanced computed tomography (CECT). This
hypothesis was inspired by the following studies of
contrast-enhanced magnetic resonance imaging (CEMRI). In studies on
breast cancer, the time intensity curve (TIC) of CEMRI is
considered to reflect tumor grade (12–14). The
TIC forms a line chart that represents contrast enhancement changes
dependent on time. The TIC consists of early and delayed phases;
the early phase is described as slow, medium or rapid depending on
the curve steepness, whereas the delayed phase occurs after the
peak enhancement and is characterized as persistent if it continues
to increase, as a plateau if it levels off and as washout if it
decreases. Persistent kinetics are generally aligned more with
benign lesions, whereas washout kinetics are generally suspected to
be malignant and plateau kinetics are considered indeterminate
(14). In Hirosaki University
Hospital (Aomori, Japan), patients with PDAC are routinely examined
with dynamic CECT as part of a fixed protocol. The usefulness of
dynamic CECT in the diagnostic imaging and staging of pancreatic
cancer has been established. Typical PDAC appears as hypodense
masses compared with adjacent normal pancreatic tissue and draws
the time density curve (TDC) for CECT as TIC is drawn for CEMRI.
Comparative analysis between histology and TIC has been established
in breast cancer; however, to the best of our knowledge only 1
study focused on the association between imaging diagnosis and PDAC
histology (15). Therefore, the
present study investigated the association between the histological
characteristics and TDC of PDAC.
Materials and methods
Patients
A total of 59 patients with PDAC without
preoperative chemotherapy, who were surgically treated between
January 2012 and June 2018, were investigated after obtaining each
patient's informed consent for using their clinical records and
pathological specimens at the Hirosaki University Hospital
(Hirosaki, Japan). The patient cohort was comprised of 34 women and
25 men, with a median age of 68 years (range, 53–84 years), and
with tumors located in the pancreatic head (23 cases), pancreatic
body (27 cases) and pancreatic tail (9 cases). All patients
underwent dynamic CECT, and none of them had a contrast media
allergy or renal function problems that would prevent them from
undergoing CECT. Operative procedures were determined according to
the location of the primary tumors and tumor spread.
Pancreatoduodenectomy was conducted in the 21 patients with
pancreatic head cancer, and distal pancreatosplenectomy was
conducted in the 36 patients with pancreatic body and tail cancer.
A total of 2 patients with pancreatic head cancer underwent a total
pancreatectomy due to tumor spread in the main duct of the
pancreatic body. At the Hirosaki University Hospital, patients are
administered S-1 (tegafur/gimeracil/oteracil) as standard
postoperative chemotherapy for pancreatic cancer and the course is
followed up. S-1 was administered orally twice daily at a dose of
80 mg/m2/day for 4 weeks and 2 weeks rest. This cycle
was repeated for half a year. In the present study, S-1 was
administered to 55 patients. S-1 administration was discontinued in
4 cases due to adverse effects. Survival data were obtained from
hospital medical charts. A total of 49 patients were surveyed, but
10 patients did not complete the follow-up survey. The median
observation period was 27.8 months.
Histological analysis
All surgical specimens were fixed with 10% formalin
at room temperature for 24 h. In cases of pancreatic head tumors,
surgical specimens were sliced at right angles to the common bile
duct, whereas those in the pancreatic body or tail tumor were
sliced at right angles to the main pancreatic duct. Tumors were
embedded in paraffin, and 4-µM sections were stained with
hematoxylin and eosin (H&E) for pathological evaluation. The
sections were stained at room temperature with Mayer's hematoxylin
for 20 min and with eosin for 5 min. Pathological evaluations,
including pathological T, N and M categories, and staging were
conducted for all patients according to an up-to-date TNM
classification from the Union for International Cancer Control (8th
edition) (16). The PDAC
differentiation was classified as well differentiated (G1),
moderately differentiated (G2) and poorly differentiated (G3)
according to the World Health Organization classification of tumors
of the digestive system (5th edition) (17). If intratumoral heterogeneity (i.e.,
variation in the degree of differentiation) was present, a higher
grade was assigned.
Immunostaining and histological image
analyses
To measure the cancer cell, CAF and microvessel
densities, the largest cross section of tumor was measured.
Immunostaining of cytokeratin AE1/AE3, αSMA and cluster of
differentiation 31 (CD31) was conducted. Cytokeratin AE1/AE3 is a
pan-epithelial marker. Although there is no specific marker for
CAFs, αSMA is widely used as a CAF marker in various human cancer
types, such as lung cancer (18),
cholangiocarcinoma (19), gastric
cancer (20) and breast cancer
(21). CD31 is a pan-vascular
endothelial marker that is positive for both normal endothelial and
tumor endothelial cells (22). For
the immunostaining examination, sections on microslides were
deparaffinized using the standard avidin-biotin-peroxidase complex
method with automated immunostainer (Benchmark XT; Ventana Medical
Systems, Inc.). In brief, deparaffinized slides were treated with
tris-EDTA buffer (pH 7.8) at 95°C for 44 min. For blocking
endogenous peroxides and protein, the slides were treated with 5%
non-fat dry milk at 37°C for 15 min. The slides were incubated with
primary antibody for 60 min at room temperature. The clones and
dilution ratios of primary antibodies were as follows: Cytokeratin
AE1/AE3 (monoclonal mouse; clone AE1, AE3; 1:100; cat. no. 412811;
Nichirei Bioscience, Inc.), αSMA (monoclonal mouse; clone 1A4; cat.
no. M0851; 1:100; Dako; Agilent Technologies Inc.) and CD31
(monoclonal mouse; clone JC70A; cat. no. M0823; 1:40; Dako; Agilent
Technologies Inc.). Reaction products were visualized by iVIEW DAB
Detection kit including secondary antibody of biotin-binding goat
anti mouse immunoglobulin G (IgG) (1:1,000; cat. no. 760-091;
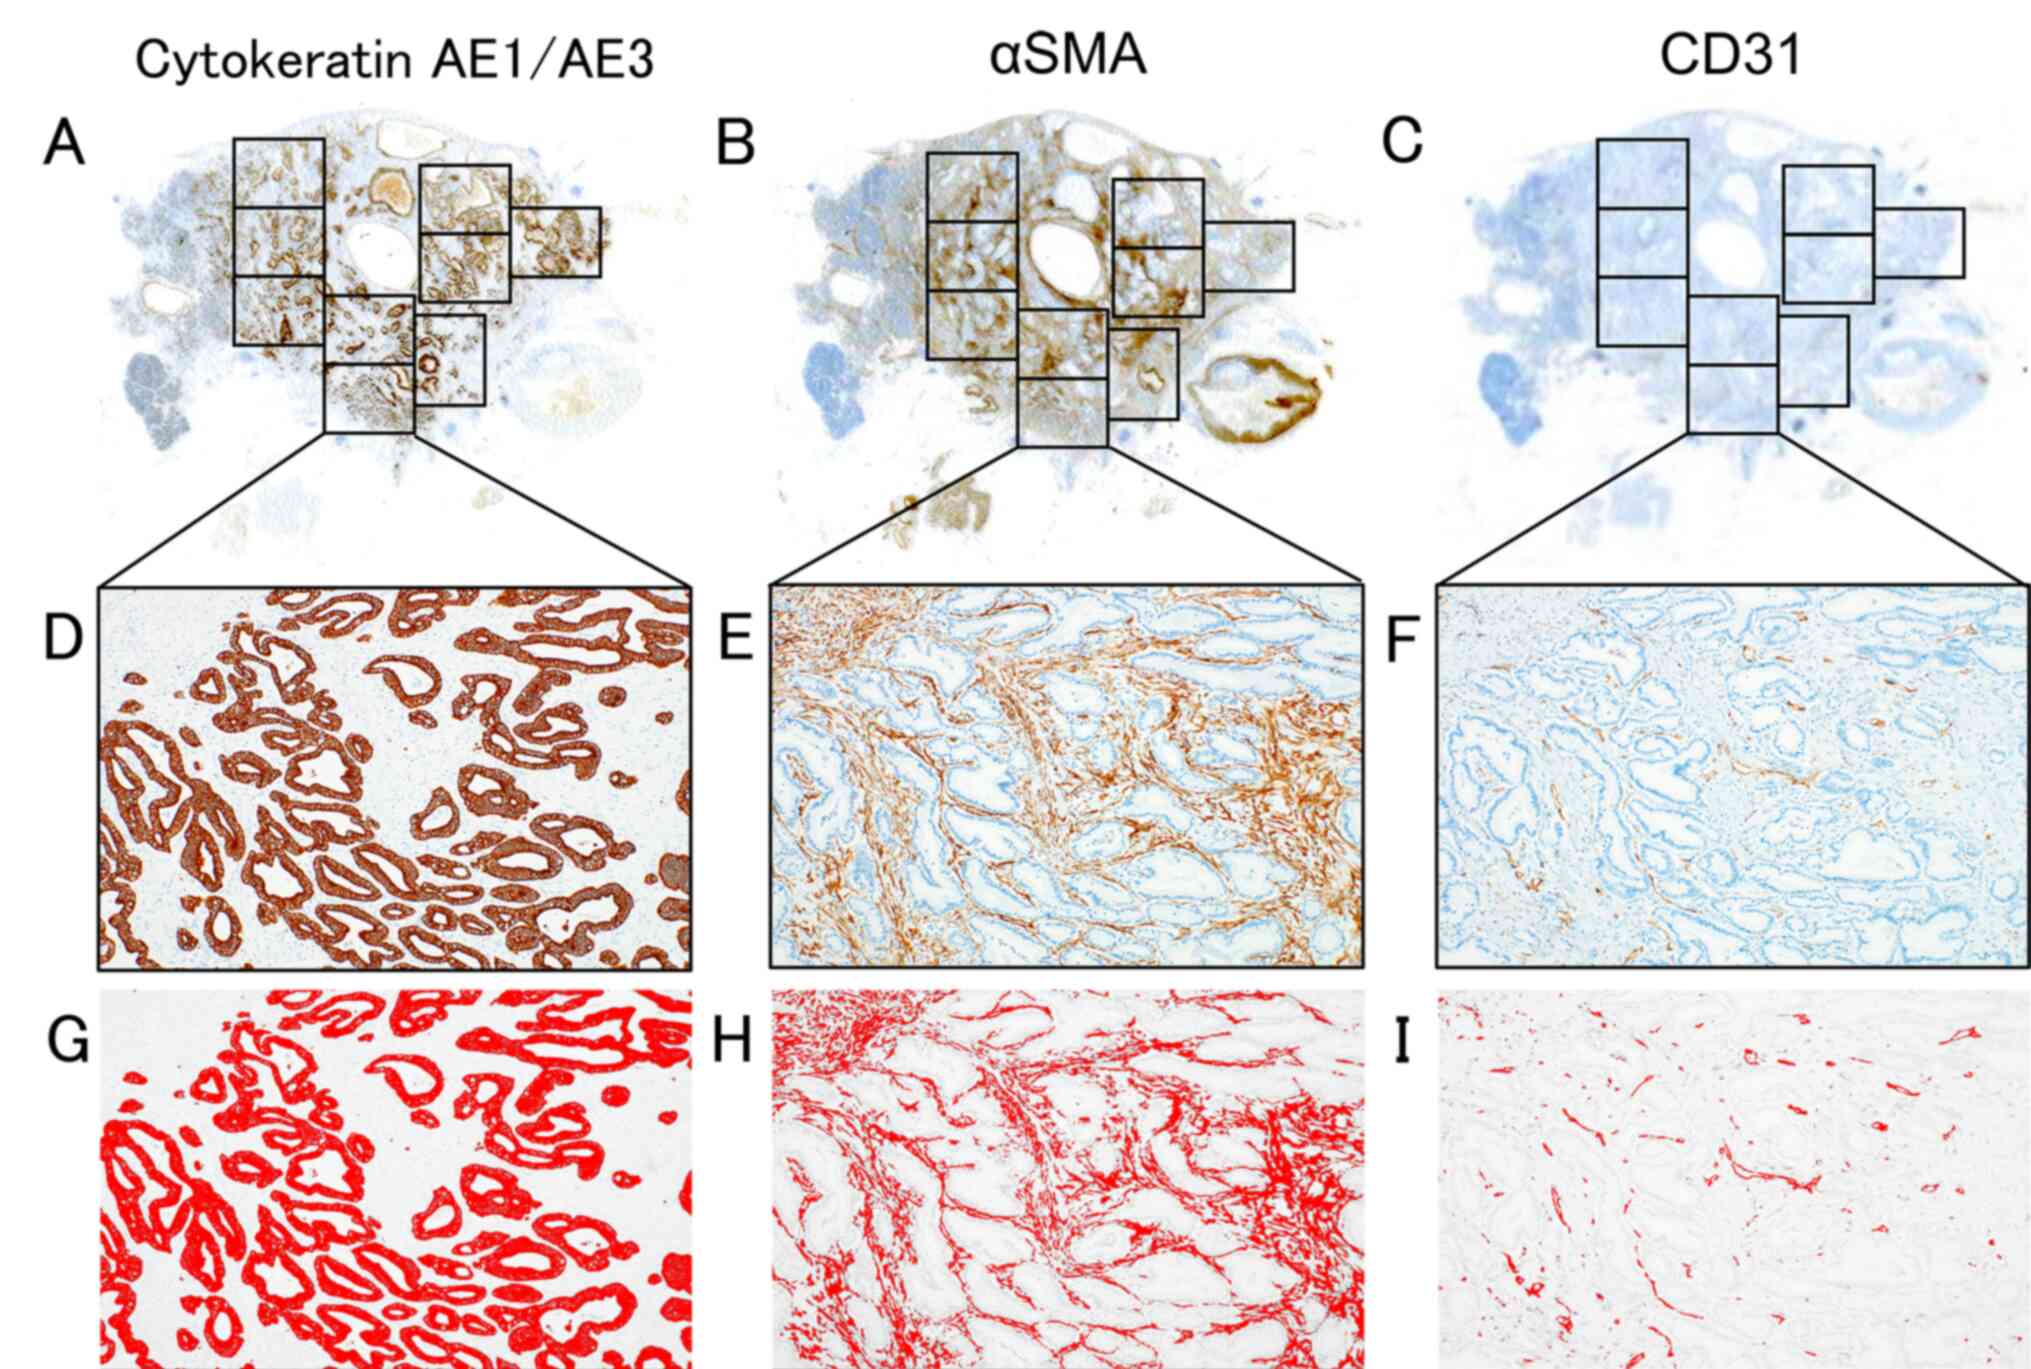
Ventana Medical Systems, Inc.; Roche Diagnostics). The largest
slice was equally divided by field of view (field number was 22)
using a microscope with a 4X objective lens and a 10X eyepiece
(Fig. 1A-C). BX53 light microscope
(Olympus Corporation), CellSens software v.2.3 64 bit and DP74
digital camera (both Olympus Corporation) were used for capturing
images. An attempt was made to exclude regions where the tumor and
non-tumor tissue were mixed in the margins and to exclude the
lumens of enlarged ducts from the measuring area, combining these
images with observations from H&E stained tissues. Whole images
of the largest slice of tumor with immunostaining were captured
(Fig. 1D-F), and immunostaining
images were binarized using Image J software [Java 1.6.0_24
(64-bit); National Institutes of Health]. Binarized images showed
immunostaining-positive and immunostaining-negative components as
red and white (Fig. 1G-I). The area
of immunostaining-positive components was measured as the pixel
number, using thresholds with minimum and maximum values of 0 and
120, respectively. Cancer cell density was measured as cytokeratin
AE1/AE3-positive pixel number divided by the total area pixel
number, and CAF density was measured as the αSMA-positive pixel
number minus the CD31-positive pixel number divided by the total
stromal area pixel number, i.e., total area pixel number minus
cancer cell pixel number. Microvessel density was measured as the
CD31-positive pixel number divided by the total stromal area pixel
number.
Radiological imaging analysis
Dynamic contrast-enhanced computed tomography (CECT)
images were investigated using the fixed protocol applied to all
patients with pancreatic cancer in the Hirosaki University
Hospital. CT was conducted using a 64-detector row CT scanner
(Discovery CT750 HD; GE Healthcare), using the following
parameters: Detector configuration, 64×0.625; tube voltage, 120 kV;
automatic tube current modulation; collimation, 40 mm; tube
rotation time, 0.5 sec; pitch, 0.8; field of view, 35×35 cm; image
matrix, 512×512; and slice thickness, 5 mm. After obtaining
unenhanced images, a non-ionic contrast medium dose of 600 mgI/kg
body weight with an iodine content of 300 mgI/ml (Iopamiron
300/370, Bayer Yakuhin Ltd.; Omnipaque 300, Daiichi-Sankyo Co.,
Ltd.; Iopromide 300/370, Fujifilm Toyama Chemical Co., Ltd.;
Iomelon 350, Eisai Co., Ltd.; Optiray 320, Fuji Pharma Co., Ltd.)
was intravenously injected within 30 sec, and scanning of the
arterial, portal venous and equilibrium phases began at 35–40 sec,
60–70 sec and 180 sec after initiating the contrast medium
injection (Fig. 2A-D). To draw a
TDC, Digital Imaging and Communications in Medicine data (EV insite
R version 3.4.0.0 from PSP corporation or ShadeQuest/ViewR V1.24
from Yokogawa Medical Solutions) were used. The primary tumor was
indicated as the hypovascular area surrounded by a yellow dotted
line. The region of interest (ROI) was indicated as the area
surrounded by a solid yellow line (Fig.
2A-D). The ROI was drawn on the central area of the tumor and
avoided tumor margins, the vascular structure and artificial
materials such as stents. The ROI was drawn on the central area of
the tumor, as the marginal area includes both tumor and non-tumor
tissue on the H&E slides. After measuring the CT number of ROIs
in each phase, the TDC was created (Fig.
2E). T1 indicates the non-enhanced phase, T2 the arterial
phase, T3 the portal phase and T4 the equilibrium phase. H1 is the
CT number of the non-enhanced phase (T1), H2 is that of the
arterial phase (T2), H3 is that of the portal phase (T3) and H4 is
that of the equilibrium phase (T4). δ1 is the initial slope between
non-enhanced and arterial phases, δ2 the second slope between
arterial and portal phases and δ3 the third slope between portal
and equilibrium phases.
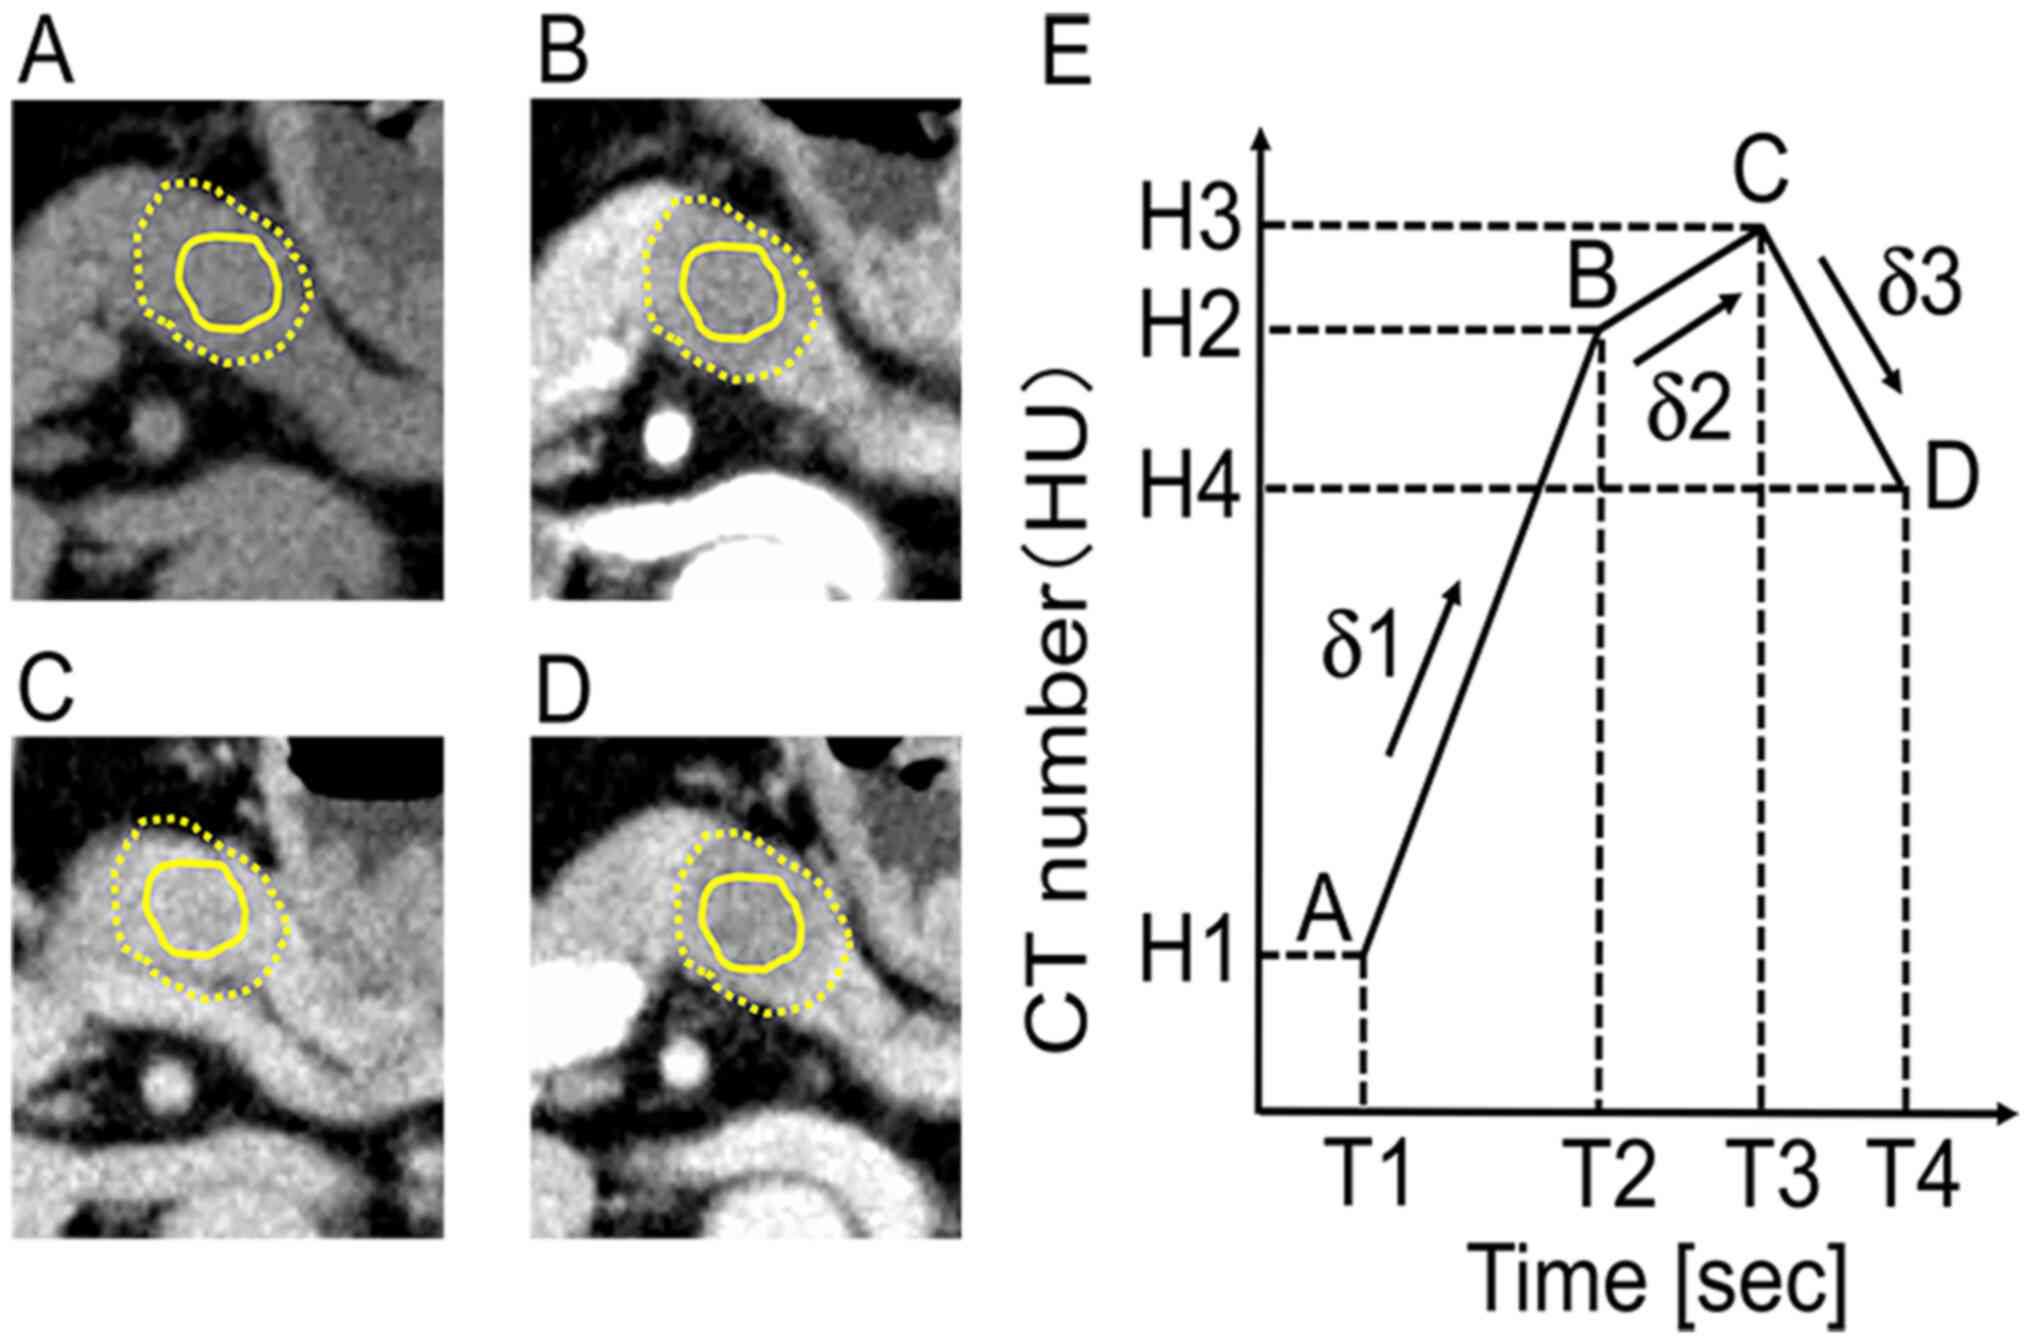 | Figure 2.Measuring the CT number of ROI and
drawing the TDC of PDAC. Dynamic CECT images of the pancreatic body
cancer at the (A) non-enhanced, (B) arterial, (C) portal and (D)
equilibrium phases. The margins of the tumor were represented by a
yellow dotted line. The solid yellow line is the ROI. (E) Measuring
the CT number of the ROI, the time intensity curve was drawn. T1,
T2, T3 and T4 represent the times for (A-D), respectively. H1, H2,
H3, and H4 represent the CT number of T1, T2, T3 and T4,
respectively. δ1 was the initial slope between A and B. δ2 was the
second slope between B and C. δ3 was the third slope between (C and
D). CT, computed tomography; CECT, contrast-enhanced CT; PDAC,
pancreatic ductal adenocarcinoma; ROI, region of interest; TDC,
time density curve. |
Statistical analysis
The correlations between δ1–3 and the densities of
cancer cells, CAFs and microvessels were statistically analyzed
using Spearman's rank correlation coefficient. Correlation was
defined as statistically significant if the ρ value (r) was
calculated as |r| > 0.2. Survival analyses were conducted
using the Kaplan-Meier method to estimate event rates and the
log-rank test for survival comparisons between patient groups.
Cancer cell density, CAF density and microvessel density were
divided into high and low groups based on respective median values.
The median value of cancer cell density was 18.3%, CAF density was
20.4%, and microvessel density was 1.05%. All statistical
evaluations were conducted using R v.3.6.3 (http://www.r-project.org) and EZR v.1.41 (Saitama
Medical Center, Jichi Medical University) software.
Results
Clinicopathological findings of
PDAC
The pathological T category was represented as pT1c
with 7 cases (12%), pT2 with 38 cases (64%) and pT3 with 14 cases
(24%). Pathological N category was represented as pN0 with 20 cases
(34%), pN1 with 23 cases (39%) and pN2 with 16 cases (27%).
Patients with distant metastasis were not included. Staging was
recorded as stage IA in 4 cases (7%), stage IB in 14 cases (24%),
stage IIA in 2 cases (3%), stage IIB in 22 cases (37%) and stage
III in 17 cases (29%) (Table I).
Tumor differentiation was well differentiated (G1) in 4 cases (7%),
moderately differentiated (G2) in 42 cases (71%) and poorly
differentiated (G3) in 13 cases (22%). The median cancer cell
density was 18.3% (range, 5.0–41.7%), the CAF density was 20.4%
(range, 0.5–55.1%) and the microvessel density was 1.05% (range,
0.09–0.40%) (Table II).
 | Table I.Clinical features of 59 patients with
pancreatic ductal adenocarcinoma. |
Table I.
Clinical features of 59 patients with
pancreatic ductal adenocarcinoma.
| Clinical
features | Value |
|---|
| Mean age (range),
years | 69.2 (53–84) |
| Sex, n (%) |
|
|
Female | 34 (58) |
|
Male | 25 (42) |
| Location, n
(%) |
|
|
Pancreatic head | 23 (39) |
|
Pancreatic body | 27 (46) |
|
Pancreatic tail | 9
(15) |
| Pathological T
category, n (%) |
|
| pT0,
pTis, pT1a, pT1b, n (%) | 0 (0) |
|
pT1c | 7
(12) |
|
pT2 | 38 (64) |
|
pT3 | 14 (24) |
|
pT4 | 0 (0) |
| Pathological N
category, n (%) |
|
|
pN0 | 20 (34) |
|
pN1 | 23 (39) |
|
pN2 | 16 (27) |
| M category, n
(%) |
|
| M0 | 59
(100) |
| M1 | 0 (0) |
| Staging, n (%) |
|
| Stage
0 | 0 (0) |
| Stage
IA | 4 (7) |
| Stage
IB | 14 (24) |
| Stage
IIA | 2 (3) |
| Stage
IIB | 22 (37) |
| Stage
III | 17 (29) |
| Stage
IV | 0 |
| Table II.Histological findings of pancreatic
ductal adenocarcinoma. |
Table II.
Histological findings of pancreatic
ductal adenocarcinoma.
| Histological
findings | Patients, n
(%) | Median, %
(range) |
|---|
|
Differentiation |
|
|
| G1 | 4 (7) |
|
| G2 | 42 (71) |
|
| G3 | 13 (22) |
|
| Cancer cell
density, n% |
| 18.3
(5.0–41.7) |
|
n<10 | 6 (10) |
|
|
10≤n<20 | 31 (53) |
|
|
20≤n<30 | 17 (29) |
|
|
30≤n<40 | 3 (5) |
|
|
n≥40 | 2 (3) |
|
| CAF density,
n% |
| 20.4
(0.5–55.1) |
|
n<10 | 15 (25) |
|
|
10≤n<20 | 11 (19) |
|
|
20≤n<30 | 20 (34) |
|
|
30≤n<40 | 8 (14) |
|
|
n≥40 | 5 (8) |
|
| Microvessel
density, n% |
| 1.05
(0.09–0.4) |
|
n<1 | 29 (49) |
|
|
1≤n<2 | 26 (44) |
|
|
2≤n<3 | 3 (5) |
|
|
n≥3 | 1 (2) |
|
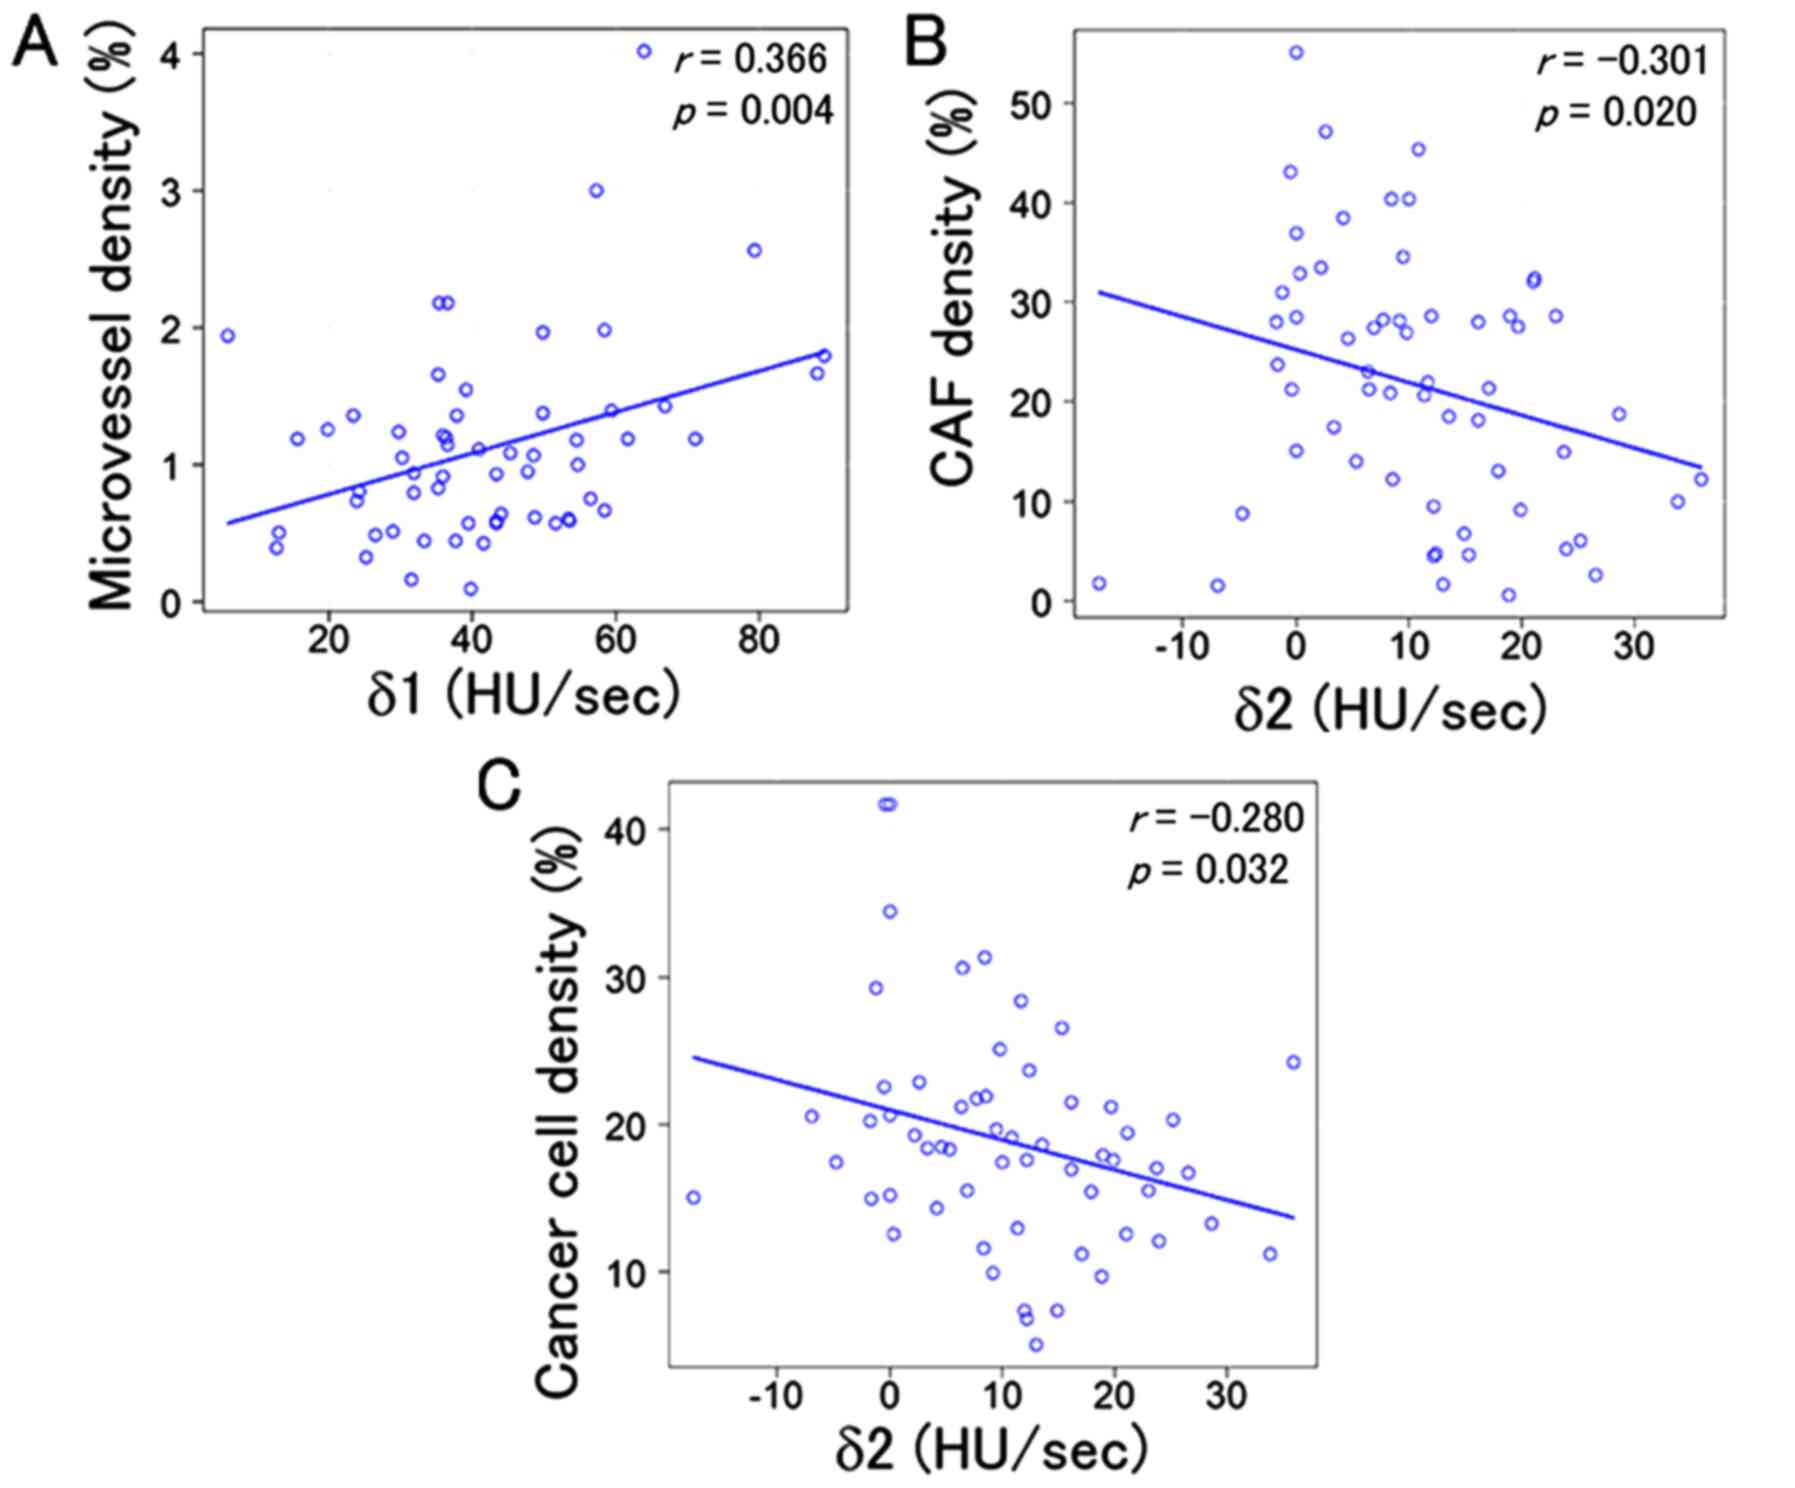
TDC and histopathology of PDAC
Three combinations showed statistically significant
correlations: δ1 was correlated with microvessel density (r=0.366,
P=0.004) and δ2 was correlated with both cancer cell density
(r=−0.280, P=0.032) and CAF density (r=−0.301, P=0.020).
Additionally, δ3 was not associated with either cancer cell density
(r=−0.003, P=0.979) or CAF density (r=0.234, P=0.074) (Fig. 3); δ2 was not associated with
microvessel density (r=−0.080, P=0.547) and δ3 was not associated
with cancer cell density (r=−0.087, P=0.510), CAF density (r=0.037,
P=0.782) or microvessel density (r=−0.005, P=0.969) (Table III). Representative cases were
shown in Fig. 4. The TDC of Case 1
showed a gentle upslope in δ1 and δ2 (Fig. 4). Histologically, Case 1 showed a
solid growth pattern with high cancer cell density, high CAF
density and low microvessel density (Fig. 4). On the other hand, the TDC of Case
2 showed a rapid upslope in δ1 and δ2 (Fig. 4). Histologically, Case 2 showed an
infiltrative growth pattern with low cancer cell density, low CAF
density and high microvessel density (Fig. 4).
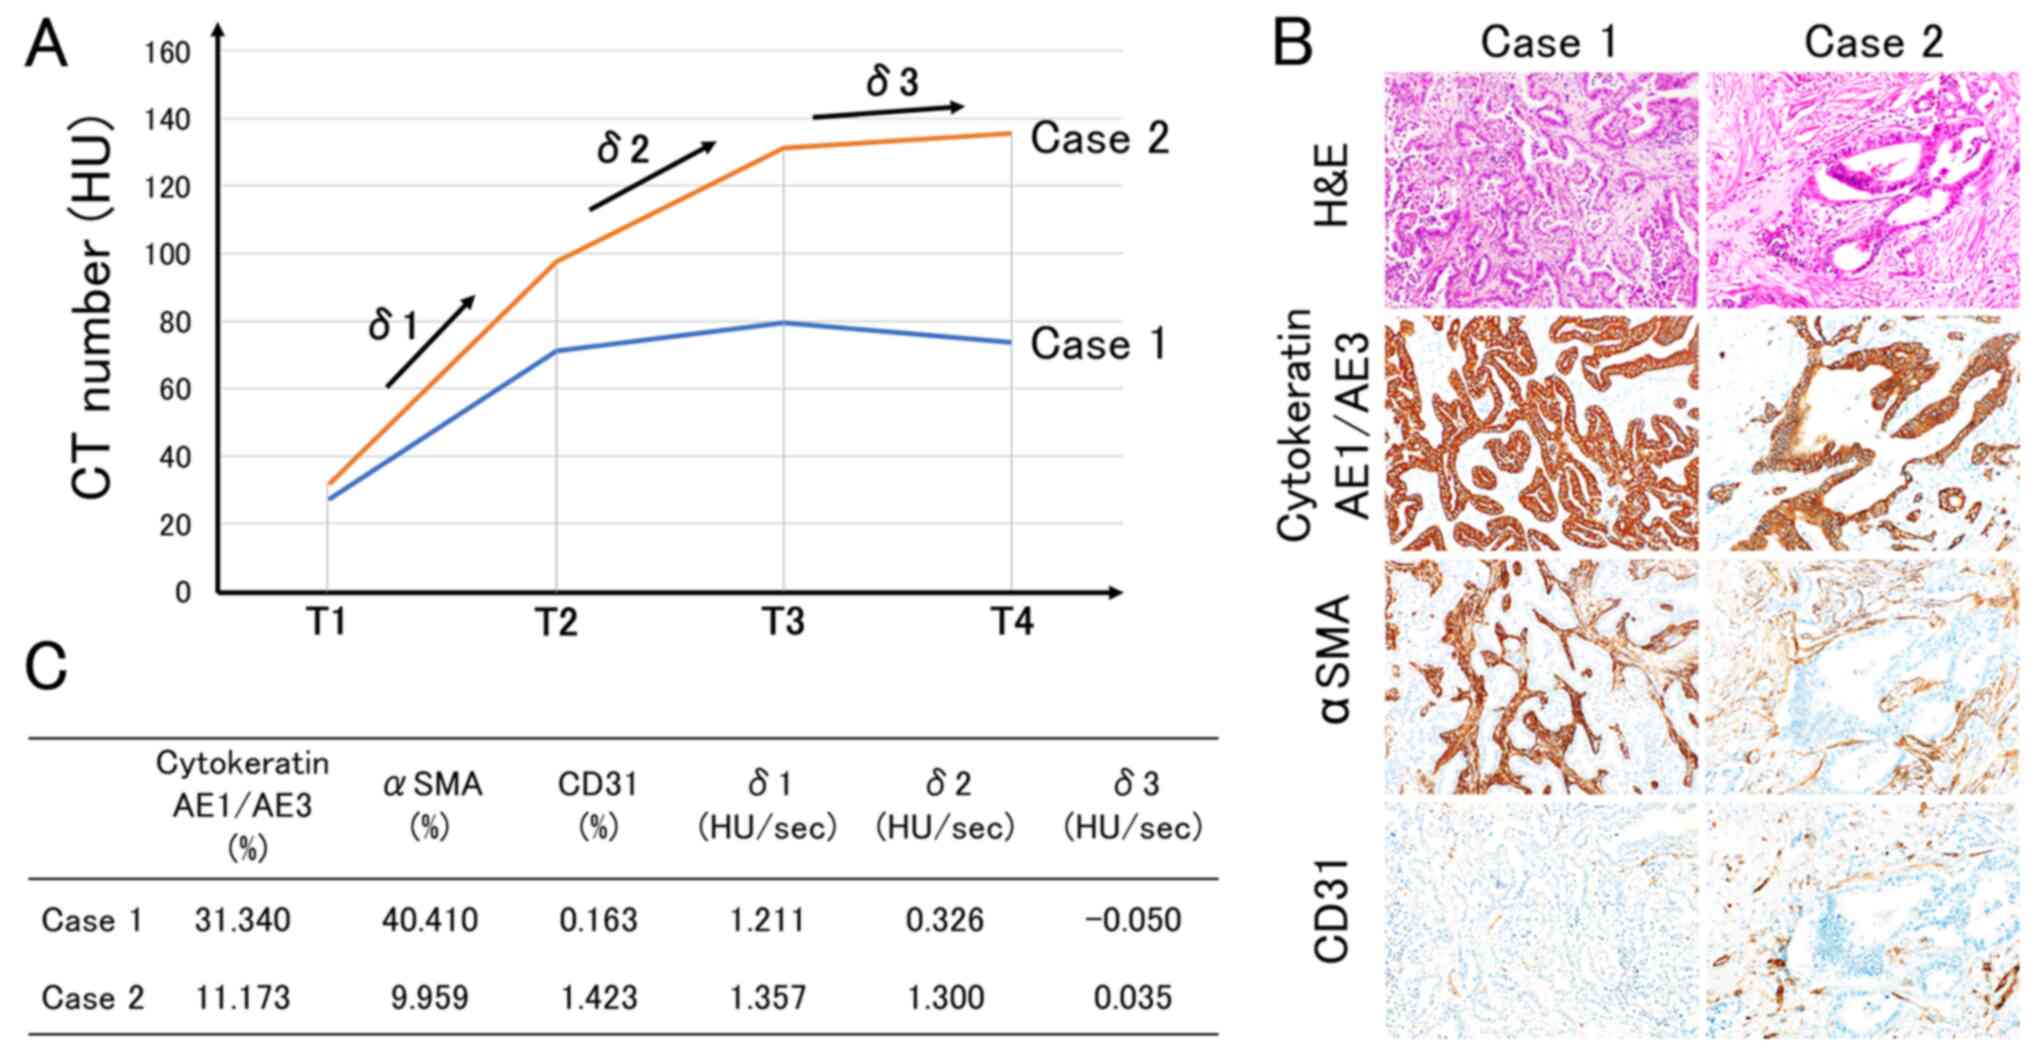 | Figure 4.Representative cases. (A) TDCs of
cases 1 and 2. Case 1 showed a gentle upslope in δ1 and δ2. Case 2
showed a rapid upslope in δ1 and δ2. (B) The histological
characteristics of cases 1 and 2. Case 1 showed a solid growth
pattern with high cancer cell density, high CAF density and low
microvessel density. Case 2 showed an infiltrative growth pattern
with low cancer cell density, low CAF density and high microvessel
density. (C) The specifications of cases 1 and 2. Cytokeratin
AE1/AE3 (%) represents cancer cell density, αSMA (%) represents CAF
density and CD31 (%) represents microvessel density. TDC, time
density curve; T1, non-enhanced phase; T2, arterial phase; T3,
portal phase; T4, equilibrium phase; δ1, the initial slope between
T1 and T2; δ2, the second slope between T2 and T3; δ3, the third
slope between T3 and T4; αSMA, α-smooth muscle actin; CAF,
cancer-associated fibroblast; CD31, cluster of differentiation
31. |
| Table III.Correlations between TDC and
histological findings of pancreatic ductal adenocarcinoma. |
Table III.
Correlations between TDC and
histological findings of pancreatic ductal adenocarcinoma.
|
| Cancer cell
density | CAF density | Microvessel
density |
|---|
|
|
|
|
|
|---|
| Slope | r | P-value | r | P-value | r | P-value |
|---|
| δ1 | −0.003 | 0.979 | 0.234 | 0.074 | 0.366 | 0.004 |
| δ2 | −0.280 | 0.032 | −0.301 | 0.020 | −0.080 | 0.547 |
| δ3 | −0.087 | 0.510 | 0.037 | 0.782 | −0.005 | 0.969 |
Association between cancer cell
density, CAF density and microvessel density
There were no significant correlations between
cancer cell density and CAF density (r=0.062, P=0.645), CAF density
and microvessel density (r=0.240, P=0.069), or cancer cell density
and microvessel density (r=0.076, P=0.572) (Table IV).
| Table IV.Correlations among histological
findings of pancreatic ductal adenocarcinoma. |
Table IV.
Correlations among histological
findings of pancreatic ductal adenocarcinoma.
|
| Cancer cell
density | CAF density | Microvessel
density |
|---|
|
|
|
|
|
|---|
| Histological
findings | r | P-value | r | P-value | r | P-value |
|---|
| Cancer cell
density | – | – | 0.0618 | 0.645 | 0.0758 | 0.572 |
| CAF density | – | – | – | – | 0.24 | 0.0691 |
| Microvessel
density | – | – | – | – | – | – |
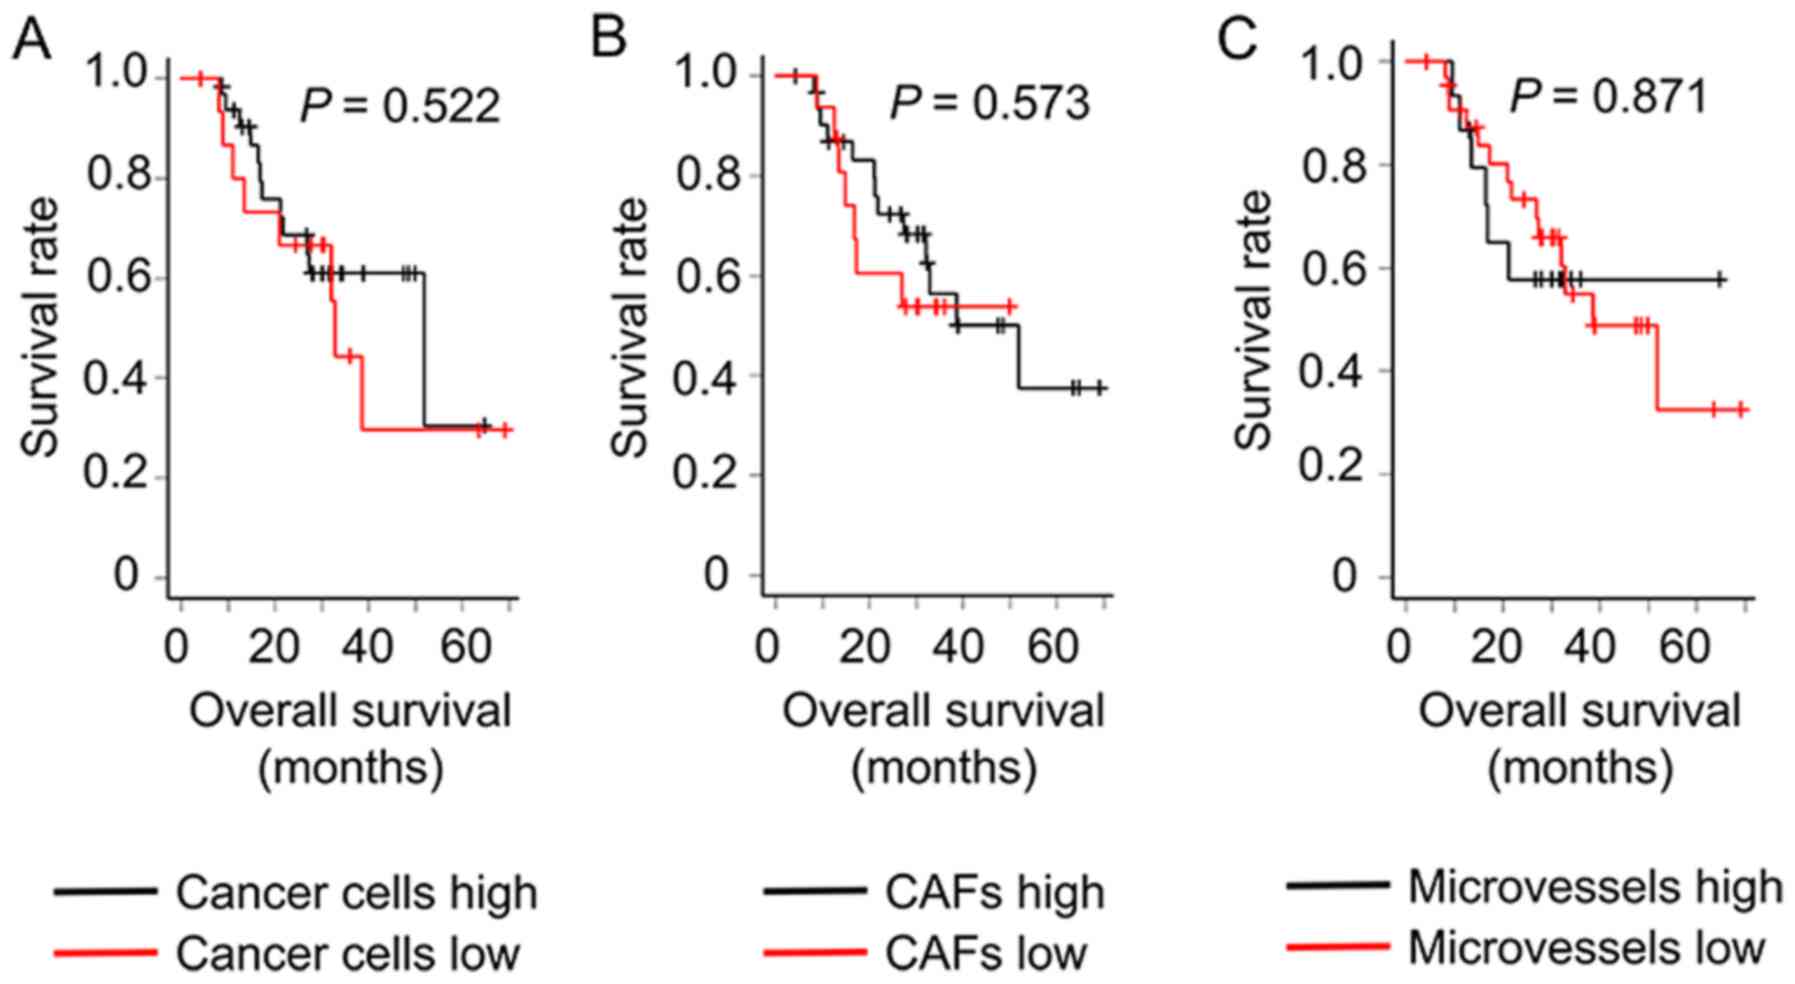
Prognostic analysis of PDAC
Differences in overall survival time between high
and low cancer cell density groups (P=0.522), between high and low
CAF density groups (P=0.573), and between high and low microvessel
density groups (P=0.871) were not significant (Fig. 5).
Discussion
The present study demonstrated the possibility that
TDC allows us to predict the histological characteristics of PDAC.
The initial slope between the non-enhanced phase and the arterial
phase (δ1) was positively correlated with microvessel density, and
the second slope between the arterial phase and the portal phase
(δ2) was negatively correlated with cancer cell density and CAF
density. For example, the TDC with a high δ1 indicated high
vascularization, and the TDC with a low δ2 indicated high cancer
cell density and high CAF density. Tumors with a high δ1 and a low
δ2 tended to display histological characteristics such as a solid
growth pattern with a stroma containing many CD31-positive
microvessels and dense αSMA-positive fibrosis. Thus, the shape of
the TDC reflects the tumor growth pattern and characteristics of
the tumor stroma.
First, the initial slope between the non-enhanced
and arterial phases (δ1) was found to be positively correlated with
microvessel density. The steepness of δ1 represents microvessel
proliferation in the cancer stroma. It has been shown that the
attenuation value of the peak enhancement of the tumor and the peak
enhancement value divided by time are positively correlated with
the extent of tumor vascularity in lung cancer and renal cell
carcinoma (23,24). In a study of 36 patients with PDAC,
Hattori et al (15) reported
that when using conventional dynamic multidetector CT (MDCT), the
ratios of enhanced values in the arterial phase to the tumor-aorta
enhanced values were correlated with CD34-positive microvessel
density, as counted in five hot spots at high magnification. The
present results regarding δ1 and microvessel density were
consistent with those of this previous study. Since δ1 represents
data on changes in contrast agents entering the tumor tissue over
time, it is more likely to be correlated with tumor vascularity.
Although the difference in overall survival between the high and
low microvessel density groups was not significant in the present
study, angiogenesis has been considered a poor prognostic factor in
many cancer types, such as breast (25–27),
lung (28,29), and colorectal (30) cancer. However, Katsuta et al
(31) reported that the high
expression of CD31 is associated with better overall survival time
in patients with PDAC based on mRNA expression from RNA sequencing
data (31). The study further
elaborated that PDAC expressing high levels of CD31 has mature and
stable vessels that supply anti-cancer immune cells. Thus, the
association between tumor vascularity and prognosis in PDAC appears
to be controversial.
Second, the second slope between the arterial and
portal phases (δ2) was found to be negatively correlated with both
cancer cell and CAF density. The gentleness or descent of δ2 is
considered to represent high-density cancer cells and CAFs. The
study by Hattori et al (15)
also reported that the extent of fibrosis was negatively correlated
with the absolute value in the pancreatic phase of conventional
dynamic MDCT, which is equivalent to the portal phase in the
present study. The extent of fibrosis was scored according to the
ratio of fibrosis in the tumor using Elastica van Gieson staining,
with a score of 1–3 (15). The
present study reinforced these results with quantitative data
focusing on αSMA-positive fibroblasts. Generally, contrast agents
have two-compartment pharmacokinetics with intravascular and
extravascular-extracellular components. After an intravenous
injection, contrast agents circulate and reach organs via the
arterial system in the arterial phase. Thereafter, contrast agents
leak from the microvessels to the pancreatic tissue in the portal
phase. Lastly, contrast agents that accumulate in the pancreatic
tissue return to the microvessels during the equilibrium phase. In
the present study, a non-ionic iodine contrast agent was used,
i.e., one not distributed into the cytoplasm of cancer cells and
CAFs, but into the extracellular matrix (32). Therefore, cancer cells and CAFs work
as obstacles to the spread of contrast agents, causing the negative
correlations between δ2 and cancer cell and CAF densities. CAF
proliferation has been considered a poor prognostic factor in
numerous studies (5–11,33,34).
However, the difference in overall survival time between the high
and low CAF density groups was not significant in the present
study. A possible reason for the differences between the present
study and previous studies is the non-specific immunostaining of
αSMA. In the present study, the entire tumor area was measured, not
just the tumor infiltrated areas, in order to compare tissue
sections and radiological images. Furthermore, immunostaining was
performed using an automated method with Image J. Therefore, it is
possible that non-specific αSMA immunostaining was detected. By
contrast, a recent study revealed that there are two types of CAFs:
Cancer-promoting CAFs and cancer-restraining CAFs (35). Cancer-promoting CAFs express αSMA
(36) and cancer-restraining CAFs
express Meflin, a glycosylphosphatidylinositol-anchored protein
(37). Currently, in situ
hybridization is recommended for detecting Meflin on tissue slides,
as Meflin immunostaining often results in non-specific staining
(37). Meflin is an attractive
marker for future research to distinguish cancer-restraining CAFs
from cancer-promoting CAFs.
Although the present study demonstrated a
significant correlation between the TDC and histological
characteristics, the correlation coefficients were small
(|r|=0.2–0.3). The following technical limitations are possible
reasons for these small values. First, it was challenging to
achieve complete exclusion of the marginal area, including both
tumor and non-tumor tissues from the tissue assessment area, as
cytokeratin AE1/AE3, αSMA and CD31 were stained on both the tumor
and non-tumor tissues. On the other hand, it is important that the
microenvironment of the tumor center is different from the tumor
margin. The present study did not investigate the issue, and it is
a challenge for the future. Second, it was difficult to achieve a
complete match between the ROI of dynamic CECT and the actual
tissue assessment area. This problem would be solved by a new
radiological technique, dual-energy CT (DECT). DECT can draw higher
resolution images than conventional CT. The present study did not
use DECT, as it is a newer method at Hirosaki University Hospital.
This is a topic for future research.
In conclusion, the present study demonstrated that
the TDC of dynamic CECT was associated with histological components
of PDAC such as cancer cell density, CAF density, and microvessel
density with quantitative methods and results for the first time.
The initial slope of TDC was positively correlated with microvessel
density, and the second slope of TDC was negatively correlated with
cancer cell density and CAF density. The present study suggested
that the TDC of dynamic CECT was useful to predict histological
characteristics of PDAC.
Acknowledgements
The authors would like to thank Ms. Kana Saito, Ms.
Shizuka Fujio, Mr. Yuta Yastuo and Mr. Takuya Shimanaka (Hirosaki
University, Hirosaki, Japan) for providing technical
assistance.
Funding
The present study was supported by JSPS Kakenhi
(grant number JP19K16763).
Availability of data and materials
The datasets used and/or analyzed during the current
study are available from the corresponding author on reasonable
request.
Authors' contributions
SG and TY designed the experiments. SG performed the
experiments and data analysis, wrote the main manuscript text and
prepared the figures. HS evaluated the radiological images. SM and
HK contributed in histological evaluation. KI and KH provided
clinical information including adjuvant chemotherapy. TY and HK
confirm the authenticity of all the raw data. All authors read and
approved the manuscript, and agree to be accountable for all
aspects of the research in ensuring that the accuracy or integrity
of any part of the work are appropriately investigated and
resolved.
Ethics approval and consent to
participate
Human pancreatic ductal adenocarcinoma tissues were
obtained with informed patient consent at the time of surgery at
Hirosaki University Hospital (Hirosaki, Japan). This study was
performed in accordance with the Declaration of Helsinki for Human
Research and was approved by the Ethics Committee of Hirosaki
University Graduate School of Medicine (protocol no. 2020-103).
Patient consent for publication
Not applicable.
Competing interests
The authors declare that they have no competing
interests.
Glossary
Abbreviations
Abbreviations:
|
αSMA
|
α-smooth muscle actin
|
|
CAF
|
cancer-associated fibroblasts
|
|
CD31
|
cluster of differentiation 31
|
|
CECT
|
contrast-enhanced computed
tomography
|
|
CEMRI
|
contrast-enhanced magnetic resonance
imaging
|
|
NAC
|
neoadjuvant chemotherapy
|
|
PDAC
|
pancreatic ductal adenocarcinoma
|
|
ROI
|
region of interest
|
|
TDC
|
time density curve
|
|
TIC
|
time intensity curve
|
References
|
1
|
Stathis A and Moore MJ: Advanced
pancreatic carcinoma: Current treatment and future challenges. Nat
Rev Clin Oncol. 7:163–172. 2010. View Article : Google Scholar : PubMed/NCBI
|
|
2
|
Bray F, Ferlay J, Soerjomataram I, Siegel
RL, Torre LA and Jemal A: Global cancer statistics 2018: GLOBOCAN
estimates of incidence and mortality worldwide for 36 cancers in
185 countries. CA Cancer J Clin. 68:394–424. 2018. View Article : Google Scholar : PubMed/NCBI
|
|
3
|
Ilic M and Ilic I: Epidemiology of
pancreatic cancer. World J Gastroenterol. 22:9694–9705. 2016.
View Article : Google Scholar : PubMed/NCBI
|
|
4
|
Feig C, Gopinathan A, Neesse A, Chan DS,
Cook N and Tuveson DA: The pancreas histological characteristics.
Clin Cancer Res. 18:4266–4276. 2012. View Article : Google Scholar : PubMed/NCBI
|
|
5
|
Kobayashi H, Enomoto A, Woods SL, Burt AD,
Takahashi M and Worthley DL: Cancer-associated fibroblasts in
gastrointestinal cancer. Nat Rev Gastroenterol Hepatol. 16:282–295.
2019. View Article : Google Scholar : PubMed/NCBI
|
|
6
|
Kalluri R: The biology and function of
fibroblasts in cancer. Nat Rev Cancer. 16:582–598. 2016. View Article : Google Scholar : PubMed/NCBI
|
|
7
|
Neesse A, Bauer CA, Öhlund D, Lauth M,
Buchholz M, Michl P, Tuveson DA and Gress TM: Stromal biology and
therapy in pancreatic cancer: Ready for clinical translation? Gut.
68:159–171. 2019. View Article : Google Scholar : PubMed/NCBI
|
|
8
|
Öhlund D, Elyada E and Tuveson D:
Fibroblast heterogeneity in the cancer wound. J Exp Med.
211:1503–1523. 2014. View Article : Google Scholar : PubMed/NCBI
|
|
9
|
Gieniec KA, Butler LM, Worthley DL and
Woods SL: Cancer-associated fibroblasts-heroes or villains? Br J
Cancer. 121:293–302. 2019. View Article : Google Scholar : PubMed/NCBI
|
|
10
|
Ishii G, Ochiai A and Neri S: Phenotypic
and functional heterogeneity of cancer-associated fibroblast within
the tumor microenvironment. Adv Drug Deliv Rev. 99:186–196. 2016.
View Article : Google Scholar : PubMed/NCBI
|
|
11
|
Mezawa Y and Orimo A: The roles of tumor-
and metastasis-promoting carcinoma-associated fibroblasts in human
carcinomas. Cell Tissue Res. 365:675–689. 2016. View Article : Google Scholar : PubMed/NCBI
|
|
12
|
El Khouli RH, Macura KJ, Kamel IR, Jacobs
MA and Bluemke DA: 3-T dynamic contrast-enhanced MRI of the breast:
Pharmacokinetic parameters versus conventional kinetic curve
analysis. AJR Am J Roentgenol. 197:1498–1505. 2011. View Article : Google Scholar : PubMed/NCBI
|
|
13
|
Yang SN, Li FJ, Chen JM, Zhang G, Liao YH
and Huang TC: Kinetic curve type assessment for classification of
breast lesions using dynamic contrast-enhanced MR imaging. PLoS
One. 11:e01528272016. View Article : Google Scholar : PubMed/NCBI
|
|
14
|
Jabbar SB, Lynch B, Seiler S, Hwang H and
Sahoo S: Pathologic findings of breast lesions detected on magnetic
resonance imaging. Arch Pathol Lab Med. 141:1513–1522. 2017.
View Article : Google Scholar : PubMed/NCBI
|
|
15
|
Hattori Y, Gabata T, Matsui O, Mochizuki
K, Kitagawa H, Kayahara M, Ohta T and Nakanuma Y: Enhancement
patterns of pancreatic adenocarcinoma on conventional dynamic
multi-detector row CT: Correlation with angiogenesis and fibrosis.
World J Gastroenterol. 15:3114–3121. 2009. View Article : Google Scholar : PubMed/NCBI
|
|
16
|
Brierley JD, Gospodarowicz MK and
Wittekind C: The TNM classification of malignant tumours, 8th
edition. Wiley Blackwell; Oxford: pp. 93–95. 2017
|
|
17
|
WHO Classification of Tumours Editorial
Board. WHO classification of tumours of the digestive system. IARC
Press; Lyon: pp. 322–332. 2019
|
|
18
|
Inoue C, Miki Y, Saito R, Hata S, Abe J,
Sato I, Okada Y and Sasano H: PD-L1 induction by cancer-associated
fibroblast-derived factors in lung adenocarcinoma cells. Cancers
(Basel). 11:12572019. View Article : Google Scholar
|
|
19
|
Itou RA, Uyama N, Hirota S, Kawada N, Wu
S, Miyashita S, Nakamura I, Suzumura K, Sueoka H, Okada T, et al:
Immunohistochemical characterization of cancer-associated
fibroblasts at the primary sites and in the metastatic lymph nodes
of human intrahepatic cholangiocarcinoma. Hum Pathol. 83:77–89.
2019. View Article : Google Scholar : PubMed/NCBI
|
|
20
|
Zhang J, Li S, Zhao Y, Ma P, Cao Y, Liu C,
Zhang X, Wang W, Chen L and Li Y: Cancer-associated fibroblasts
promote the migration and invasion of gastric cancer cells via
activating IL-17a/JAK2/STAT3 signaling. Ann Transl Med. 8:8772020.
View Article : Google Scholar : PubMed/NCBI
|
|
21
|
Amornsupak K, Jamjuntra P, Warnnissorn M,
O-Charoenrat P, Sa-Nguanraksa D, Thuwajit P, Eccles SA and Thuwajit
C: High ASMA+ fibroblasts and low cytoplasmic
HMGB1+ breast cancer cells predict poor prognosis. Clin
Breast Cancer. 17:441–452.e2. 2017. View Article : Google Scholar : PubMed/NCBI
|
|
22
|
Matsuda K, Ohga N, Hida Y, Muraki C,
Tsuchiya K, Kurosu T, Akino T, Shih SC, Totsuka Y, Klagsbrun M, et
al: Isolated tumor endothelial cells maintain specific character
during long-term culture. Biochem Biophys Res Commun. 394:947–954.
2010. View Article : Google Scholar : PubMed/NCBI
|
|
23
|
Yi CA, Lee KS, Kim EA, Han J, Kim H, Kwon
OJ, Jeong YJ and Kim S: Solitary pulmonary nodules: Dynamic
enhanced multi-detector row CT study and comparison with vascular
endothelial growth factor and microvessel density. Radiology.
233:191–199. 2004. View Article : Google Scholar : PubMed/NCBI
|
|
24
|
Wang JH, Min PQ, Wang PJ, Cheng WX, Zhang
XH, Wang Y, Zhao XH and Mao XQ: Dynamic CT evaluation of tumor
vascularity in renal cell carcinoma. AJR Am J Roentgenol.
186:1423–1430. 2006. View Article : Google Scholar : PubMed/NCBI
|
|
25
|
El-Gohary YM, Metwally G, Saad RS,
Robinson MJ, Mesko T and Poppiti RJ: Prognostic significance of
intratumoral and peritumoral lymphatic density and blood vessel
density in invasive breast carcinomas. Am J Clin Pathol.
129:578–586. 2008. View Article : Google Scholar : PubMed/NCBI
|
|
26
|
Nieto Y, Woods J, Nawaz F, Baron A, Jones
RB, Shpall EJ and Nawaz S: Prognostic analysis of tumour
angiogenesis, determined by microvessel density and expression of
vascular endothelial growth factor, in high-risk primary breast
cancer patients treated with high-dose chemotherapy. Br J Cancer.
97:391–397. 2007. View Article : Google Scholar : PubMed/NCBI
|
|
27
|
Weidner N, Semple JP, Welch WR and Folkman
J: Tumor angiogenesis and metastasis-correlation in invasive breast
carcinoma. N Engl J Med. 324:1–8. 1991. View Article : Google Scholar : PubMed/NCBI
|
|
28
|
Macchiarini P, Fontanini G, Hardin MJ,
Squartini F and Angeletti CA: Relation of neovascularisation to
metastasis of nonsmall-cell lung cancer. Lancet. 340:145–146. 1992.
View Article : Google Scholar : PubMed/NCBI
|
|
29
|
Fontanini G, Lucchi M, Vignati S, Mussi A,
Ciardiello F, De Laurentiis M, De Placido S, Basolo F, Angeletti CA
and Bevilacqua G: Angiogenesis as a prognostic indicator of
survival in non-small-cell lung carcinoma: A prospective study. J
Natl Cancer Inst. 89:881–886. 1997. View Article : Google Scholar : PubMed/NCBI
|
|
30
|
Vermeulen PB, Van den Eynden GG, Huget P,
Goovaerts G, Weyler J, Lardon F, Van Marck E, Hubens G and Dirix
LY: Prospective study of intratumoral microvessel density, p53
expression and survival in colorectal cancer. Br J Cancer.
79:316–322. 1999. View Article : Google Scholar : PubMed/NCBI
|
|
31
|
Katsuta E, Qi Q, Peng X, Hochwald SN, Yan
L and Takabe K: Pancreatic adenocarcinomas with mature blood
vessels have better overall survival. Sci Rep. 9:13102019.
View Article : Google Scholar : PubMed/NCBI
|
|
32
|
Awai K and Date S: Basic knowledge to
achieve optimal enhancement of CT. Nichidoku Iho. 56:13–32.
2011.
|
|
33
|
Tsujino T, Seshimo I, Yamamoto H, Ngan CY,
Ezumi K, Takemasa I, Ikeda M, Sekimoto M, Matsuura N and Monden M:
Stromal myofibroblasts predict disease recurrence for colorectal
cancer. Clin Cancer Res. 13:2082–2090. 2007. View Article : Google Scholar : PubMed/NCBI
|
|
34
|
Wang LM, Silva MA, D'Costa Z, Bockelmann
R, Soonawalla Z, Liu S, O'Neill E, Mukherjee S, McKenna WG, Muschel
R and Fokas E: The prognostic role of desmoplastic stroma in
pancreatic ductal adenocarcinoma. Oncotarget. 7:4183–4194. 2016.
View Article : Google Scholar : PubMed/NCBI
|
|
35
|
Miyai Y, Esaki N, Takahashi M and Enomoto
A: Cancer-associated fibroblasts that restrain cancer progression:
Hypotheses and perspectives. Cancer Sci. 111:1047–1057. 2020.
View Article : Google Scholar : PubMed/NCBI
|
|
36
|
Alcaraz J, Carrasco JL, Millares L, Luis
IC, Fernández-Porras FJ, Martínez-Romero A, Diaz-Valdivia N, De Cos
JS, Rami-Porta R, Seijo L, et al: Stromal markers of activated
tumor associated fibroblasts predict poor survival and are
associated with necrosis in non-small cell lung cancer. Lung
Cancer. 135:151–160. 2019. View Article : Google Scholar : PubMed/NCBI
|
|
37
|
Mizutani Y, Kobayashi H, Iida T, Asai N,
Masamune A, Hara A, Esaki N, Ushida K, Mii S, Shiraki Y, et al:
Meflin-positive cancer-associated fibroblasts inhibit pancreatic
carcinogenesis. Cancer Res. 79:5367–5381. 2019. View Article : Google Scholar : PubMed/NCBI
|