Introduction
Lung cancer is the most commonly diagnosed type of
cancer and the leading cause of cancer-related mortality worldwide
(1). Non-small cell lung cancer
accounted for 85% of lung cancer cases and >85% of lung
cancer-related mortalities in 2006 (2). As the most common type of non-small
cell lung cancer, lung adenocarcinoma (LUAD) accounted for ~50% of
non-small cell lung cancer cases in 2006 (2). Understanding of the molecular
mechanisms of LUAD has improved during the last few decades, and
thus, the treatments for LUAD, such as targeted therapy and
immunotherapy, have been applied in clinical management and
improved patient progression-free or overall survival (3). However, due to drug resistance and the
need of personized medicine, it is crucial to discover novel
therapeutic target molecules involved in LUAD (3).
mTOR is a serine/threonine protein kinase that
coordinates cell proliferation and metabolism in response to
nutrients and growth factors, and serves a central role in
regulating numerous fundamental cell processes, such as protein
synthesis and autophagy (4). mTOR
forms the catalytic subunit of two distinct protein complexes,
known as mTOR complex (mTORC) 1 and 2. mTORC1 comprises three core
components, namely mTOR, regulatory protein associated with mTOR
and mammalian lethal with Sec13 protein 8, as well as two
inhibitory subunits, proline-rich Akt substrate of 40 kDa and DEP
domain-containing mTOR interacting protein (4). mTORC1 functions as a downstream
effector for multiple oncogenic pathways, including the PI3K/AKT
and the Ras/Raf/MEK/MAPK pathways, resulting in mTORC1
hyperactivation in numerous types of human cancer, such as LUAD and
colorectal carcinoma (4). Mammalian
AMP-activated protein kinase (AMPK), which is composed of catalytic
subunits α and β, and a regulatory γ subunit, is an energy sensor
that is sensitive to the cellular levels of ATP (5). AMPK is phosphorylated to an active
state following ATP depletion (5).
In addition, AMPK acts upstream of mTORC1 and links mTORC1 to
energy stresses (5).
The human melanocyte proliferating gene 1 (MYG1) is
a 376-amino acid protein that harbors a mitochondrial targeting
sequence among amino acids 1–20 and a nuclear localization signal
among amino acids 33–39; therefore, the protein is localized in the
nucleus and the mitochondria (6).
MYG1 is ubiquitously expressed in all human tissues, with the
highest levels in the testis (6). A
previous study has reported that the-119C/G polymorphism in the
promoter of MYG1 is associated with vitiligo susceptibility, and an
Arg4Gln polymorphism in the mitochondrial signal of MYG1 affects
mitochondrial localization (7).
Furthermore, MYG1 has been reported to act as a 3′-5′ RNA
exonuclease and to be involved in the maturation of ribosomal and
messenger RNA in the mitochondria; thus, it is required for
mitochondrial functions (8).
However, the roles of MYG1 in tumorigenesis and the potential
underlying mechanism remain unknown.
The present study aimed to examine the expression
levels of MYG1 in LUAD tissues and analyze the association between
MYG1 expression and the prognosis of patients with LUAD. In
addition, the present study aimed to investigate the function of
MYG1 and its underlying mechanism in A549 and H1993 LUAD cells.
Materials and methods
Antibodies, plasmids and small
interfering (si)RNA
The antibody against MYG1 (cat. no. sc-393331) was
purchased from Santa Cruz Biotechnology, Inc.. Antibodies against
p62 (cat. no. 39749S), AMPKα (cat. no. 2603), phosphorylated
(p)-AMPKα (Thr172) (cat. no. 2535S), p70 S6 kinase (S6K; cat. no.
9202), p-S6K (cat. no. 9204), and HRP-conjugated anti-mouse (cat.
no. 7076) and anti-rabbit (cat. 7074) IgG antibodies were purchased
from Cell Signaling Technology, Inc.. The antibody against
microtubule-associated proteins 1A/1B light chain 3B (LC3B; cat.
no. ab192890) was obtained from Abcam, and the antibody against
GAPDH (cat. no. TA505454) was purchased from OriGene Technologies,
Inc.. The dilutions of the antibodies used for western blotting
were 1:500 for MYG1, 1:1,000 for LC3B, p62, AMPKα, p-AMPKα, S6K,
p-S6K and GAPDH, and 1:3,000 for HRP-conjugated anti-mouse and
anti-rabbit IgG antibodies.
The cDNA of MYG1 tagged with FLAG at the C-terminus
was synthesized by ShineGene Bio-Technologies, Inc. and cloned into
the pFlag-CMV-4 vector, which was kindly provided by Dr Xianqiong
Zou (Guilin Medical University, Guilin, China). The empty
pFlag-CMV-4 vector was used as the negative control. MYG1 siRNA
(MYG1 siRNA-1, 5′-GGACGCACAAUGGCACCUUTT-3′; MYG1 siRNA-2,
5′-GGUCUUUCACAGAGACCAUTT-3′; MYG1 siRNA-3,
5′-GCCCAGUUGCUGGGCACUATT-3′) and the negative control siRNA
(control siRNA, 5′-UUCUCCGAACGUGUCACGUTT-3′) were synthesized by
Shanghai GenePharma Co., Ltd..
Cell culture and transfection
The A549 and H1993 LUAD cell lines were purchased
from the Kunming Cell Bank of the Chinese Academy of Sciences. The
cells were cultured in RPMI-1640 medium (Gibco; Thermo Fisher
Scientific, Inc.) supplemented with 10% FBS (Gibco; Thermo Fisher
Scientific, Inc.) at 37°C in a humidified incubator with 5%
CO2.
A549 and H1993 LUAD cells (1.5×10⁵) were
seeded into 6-well plates and cultured overnight, and transfection
was performed using Lipofectamine® 3000 (Invitrogen;
Thermo Fisher Scientific, Inc.) according to the manufacturer's
instructions. The transfection reagent was incubated with siRNA or
plasmids at room temperature for 15 min and added to the 6-well
plates. A total of 2 µg plasmids/well was used for overexpression
experiments. MYG1 siRNA (75 pmol) and control siRNA (75 pmol) were
used for RNA interference experiments. Cells were cultured at 37°C
and collected at 48 h post-transfection.
Colony formation assay
Transfected A549 and H1993 cells were seeded into
6-well plates in 2 ml growth medium at a density of
1×10³ cells/well and cultured in RPMI-1640 with 10% FBS
at 37°C in a humidified incubator with 5% CO2 for 10–15
days. The culture medium was replaced every 2 days. The cells were
washed three times with PBS and fixed with 4% neutral
paraformaldehyde solution at room temperature for 30 min, followed
by another three washes with PBS. Subsequently, 2 ml 0.5% crystal
violet solution was added to each well and incubated at room
temperature for 2 h. The cells were washed three times with PBS.
The plates were dried and scanned with Epson Perfection V370 Photo
scanner (Seiko Epson Corporation). Cell colonies visible by the
naked eye were manually counted.
Western blotting
Western blot analysis was performed as previously
described (9). The cells were washed
three times with cold PBS and lysed with RIPA buffer (cat. no.
R0020; Beijing Solarbio Science & Technology Co., Ltd.) on ice
for 40 min. The lysate was centrifuged at 13,500 × g for 15 min at
4°C to obtain the supernatant, in which the protein concentration
was measured with a BCA Kit (Beyotime Institute of Biotechnology)
according the manufacturer's instructions. Proteins (30 mg/lane)
were separated with 10 or 15% sodium dodecyl sulfate-polyacrylamide
gels and transferred on a PVDF membrane, which was blocked with 5%
non-fat milk at room temperature for 2 h. Subsequently, the
membrane was incubated with the primary antibodies at 4°C
overnight, washed with 1X TBST buffer, and incubated with the
secondary antibody (HRP-conjugated anti-mouse or anti-rabbit IgG
antibody) at room temperature for 1 h. Blots were developed using
the SuperSignal™ West Femto substrate (Bridgen Biotechnology Co.,
Ltd.). The optical density of the protein bands was semi-quantified
with ImageJ 1.53a software (National Institutes of Health) and
normalized to that of the loading control.
Invasion and migration assays
At 48 h post-transfection, A549 and H1993 cells
(3×10³ cells/well) were seeded into a 24-well Transwell
insert (8-µm pore size; BD Biosciences) with or without
Matrigel® according to the manufacturer's instructions
at room temperature for 30 min. FBS-free medium was added to the
upper chamber, whereas medium supplemented with 20% FBS was added
to the lower chamber. After incubation at 37°C with 5%
CO2 for 24 h, non-invading or non-migrating cells were
removed from the top wells with a cotton swab. The cells that had
transgressed to the bottom of the membrane were fixed with 4%
paraformaldehyde at room temperature for 15 min and stained with
0.2% crystal violet at 4°C overnight. Images of five randomly
selected independent fields from each well were captured under an
Olympus TH4-200 phase-contrast microscope (×200 magnification;
Olympus Corporation). The cells in each image were quantified with
ImageJ 1.53a software, and the results were presented as a
percentage of the control group.
A wound healing assay was conducted to determine
cell migration. The cells were cultured to confluent monolayers in
6-well plates. The monolayers were scratched with a 10-µl pipette
tip and washed twice with 1X PBS. A549 and H1993 cells were
cultured for 24 or 72 h, respectively, and images were captured
under an Olympus TH4-200 phase-contrast microscope (×200
magnification). The scratch area was measured with ImageJ 1.53a
software. The quantitative results were calculated as described
previously (10) and presented as
wound closure percentage relative to the control group.
ATP assay
The ATP assay kit (cat. no. S0026) was purchased
from Beyotime Institute of Biotechnology and performed according to
manufacturer's instructions as previously described (11). Briefly, the transfected A549 and
H1993 cells (5×10⁵) were washed three times with cold
PBS and lysed with ATP detection lysis buffer on ice for 40 min;
the lysate was centrifuged at 13,500 × g for 15 min at 4°C to
obtain the supernatant, and 20 µl of the supernatant was mixed with
100 µl substrate solution and incubated at room temperature for 10
sec. The luminescence was measured at 520 nm using a Synergy HTX
Multi-Mode microplate reader (BioTek Instruments, Inc.).
MYG1 expression in LUAD and prognostic
analysis
MYG1 expression in The Cancer Genome Atlas (TCGA)
LUAD and normal tissue samples, as well as at different tumor
stages were analyzed using the UALCAN online software (http://ualcan.path.uab.edu/) (12). The survival probability of patients
with LUAD was analyzed using the Kaplan-Meier plotter (http://kmplot.com) (13). A log-rank test was used to assess
statistical differences in survival probability, and the cutoff
values of MYG1 expression were automatically selected by the
software as follows: 527 transcripts per million (TPM) for overall
survival (OS), 551 TPM for first progression (FP) and 781 TPM for
post-progression survival (PPS).
Gene set enrichment analysis
(GSEA)
TCGA LUAD gene expression dataset was downloaded
from cBioportal (www.cbioportal.org). LUAD samples were classified into
high- and low-MYG1 expression groups using the median value of MYG1
expression as cutoff. GSEA was performed using GSEA 4.0.3
(http://www.broad.mit.edu/gsea/) with the
pre-defined hallmark gene sets, each containing >4,000 genes
(14,15). The default settings were used, and
the thresholds for significance were determined by permutation
analysis (1,000 permutations). A gene set was considered
significantly enriched when the false discovery rate was
<0.25.
Analysis of the associations between
MYG1 expression levels and the clinicopathological
characteristics
The clinicopathological data of the patients in TCGA
LUAD cohort was downloaded from http://www.cbioportal.org/datasets. The stages of LUAD
were determined according to American Joint Committee on Cancer
(AJCC) Staging (3rd-7th edition) (16). The patients from TCGA LUAD dataset
were separated into a MYG1 high- and low-expression group using the
median value of MYG1 expression as a cutoff, and the data were
analyzed using the χ2 test.
Statistical analysis
All experiments were conducted ≥3 times
independently, and the data are presented as the mean ± SD.
Statistical analyses were performed using GraphPad Prism 8
(GraphPad Software, Inc.) and SPSS version 11.0 (SPSS, Inc.).
Comparisons between two groups were conducted using unpaired
Student's t-test, and comparisons among multiple groups were
performed using one-way ANOVA followed by Tukey's post hoc test.
The data from TCGA LUAD dataset were analyzed using the
χ2 test. P<0.05 was considered to indicate a
statistically significant difference.
Results
MYG1 expression levels are upregulated
in LUAD
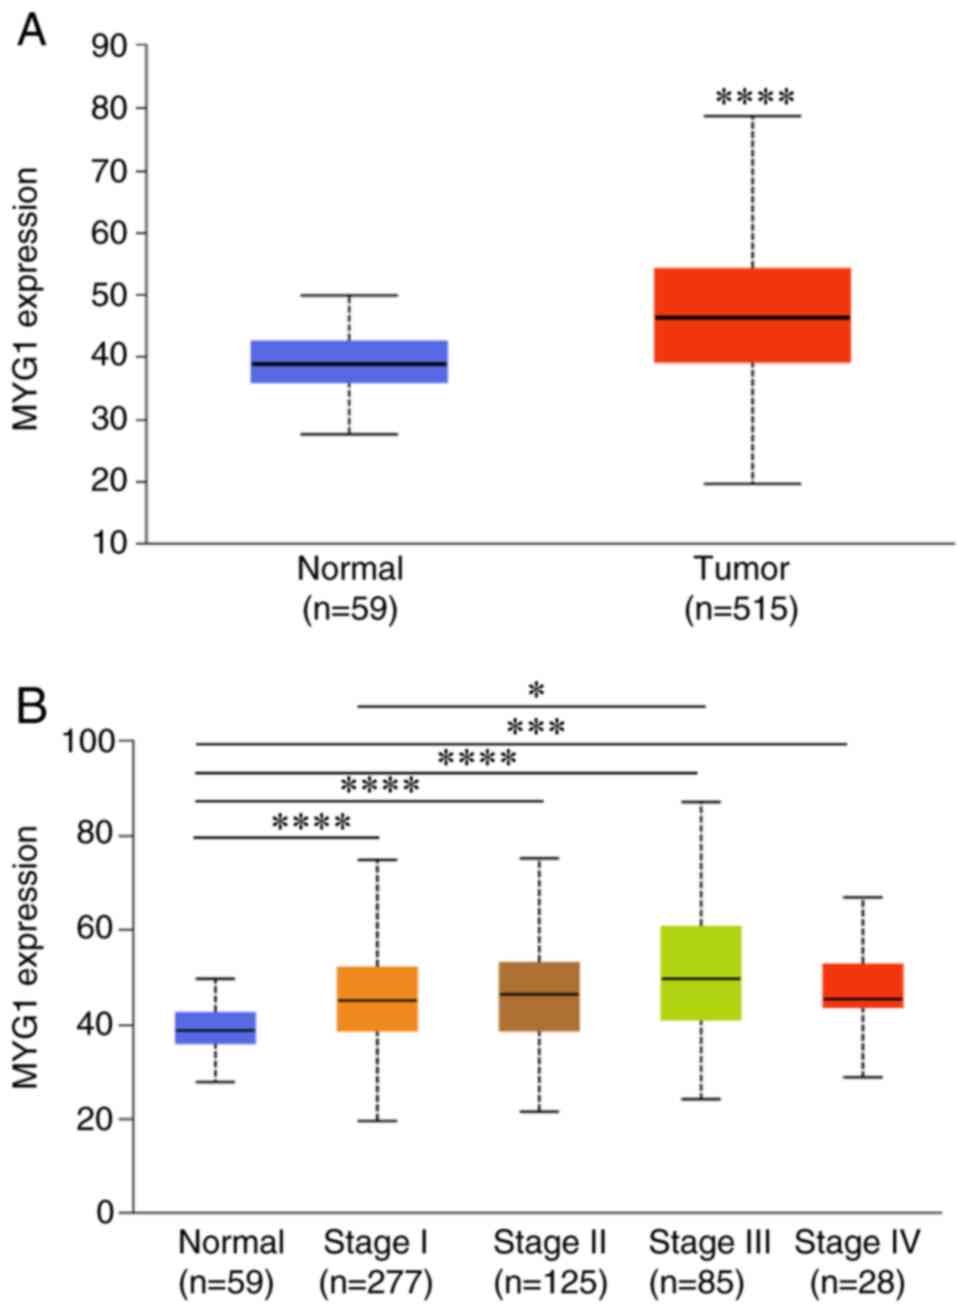
The expression levels of MYG1 in LUAD were
determined by analyzing TCGA LUAD data using UALCAN (12). Compared with those in normal lung
tissues, MYG1 expression levels were significantly higher in LUAD
tissues (Fig. 1A). The expression
levels of MYG1 at clinical stages 1–4 (stage 1, n=277; stage 2,
n=125; stage 3, n=85; and stage 4, n=28) were significantly
upregulated compared with those in normal lung tissues (n=59)
(Fig. 1B). Additionally, the
expression levels of MYG1 at stage 3 were significantly higher
compared with those at stage 1 (Fig.
1B), whereas no significant differences were identified between
any other stages of LUAD.
High expression levels of MYG1 are
associated with an unfavorable prognosis in patients with LUAD
To identify the associations between MYG1 expression
levels and the clinicopathological characteristics of patients with
LUAD, the patients from TCGA LUAD dataset were separated into a
MYG1 high- and low-expression group using the median value of MYG1
expression as a cutoff, and the data were analyzed using the
χ2 test. The results demonstrated that MYG1 expression
levels were significantly associated with the N stage (Table I).
 | Table I.Associations between MYG1 expression
levels and the clinicopathological characteristics of patients in
The Cancer Genome Atlas lung adenocarcinoma dataset. |
Table I.
Associations between MYG1 expression
levels and the clinicopathological characteristics of patients in
The Cancer Genome Atlas lung adenocarcinoma dataset.
|
|
| MYG1 expression,
n |
|
|
|---|
|
|
|
|
|
|
|---|
| Characteristics | Total, n | Low | High | χ2 | P-value |
|---|
| Age, years |
|
|
|
|
|
|
<60 | 138 | 63 | 75 | 0.9602 | 0.3271 |
| ≥60 | 364 | 184 | 180 |
|
|
| Sex |
|
|
|
|
|
|
Female | 277 | 132 | 145 | 1.2080 | 0.2717 |
| Male | 240 | 126 | 114 |
|
|
| T stage |
|
|
|
|
|
| T1 | 168 | 84 | 84 | 0.0237 | 0.8776 |
|
T2/3/4 | 345 | 170 | 175 |
|
|
| T1/2 | 449 | 227 | 222 | 1.2710 | 0.2596 |
|
T3/4 | 65 | 28 | 37 |
|
|
| N stage |
|
|
|
|
|
| N0 | 380 | 168 | 212 | 19.0900 |
<0.0001a |
|
N1/2/3 | 126 | 84 | 42 |
|
|
| M stage |
|
|
|
|
|
| M0 | 354 | 171 | 183 | 0.1276 | 0.7209 |
| M1 | 25 | 13 | 12 |
|
|
| Clinical stage |
|
|
|
|
|
| Stage
I | 278 | 141 | 137 | 0.0129 | 0.9095 |
| Stage
II/III/IV | 223 | 117 | 116 |
|
|
| Stage
I/ II | 399 | 204 | 195 | 0.5126 | 0.4740 |
| Stage
III/IV | 110 | 52 | 58 |
|
|
| Predicted DLCO,
% |
|
|
|
|
|
|
<80 | 124 | 64 | 60 | 1.4980 | 0.2210 |
|
≥80 | 75 | 32 | 43 |
|
|
| Bronchodilator
FEV1, % |
|
|
|
|
|
|
<80 | 50 | 20 | 30 | 0.0305 | 0.8615 |
|
≥80 | 77 | 32 | 45 |
|
|
| Location in lung
parenchyma |
|
|
|
|
|
|
Central | 64 | 31 | 33 | 0.2123 | 0.6450 |
|
Peripheral | 127 | 66 | 61 |
|
|
| Tumor status |
|
|
|
|
|
|
Absent | 311 | 160 | 151 | 0.1006 | 0.7511 |
|
Present | 109 | 58 | 51 |
|
|
| Smoking history
indicator |
|
|
|
|
|
|
1/2 | 196 | 94 | 102 | 0.5357 | 0.4642 |
|
3/4/5 | 306 | 157 | 149 |
|
|
| Packs of cigarettes
per year, n |
|
|
|
|
|
|
<40 | 175 | 83 | 92 | 0.4116 | 0.5212 |
|
≥40 | 177 | 90 | 87 |
|
|
To investigate the potential value of MYG1 in
patient prognosis, the association between MYG1 expression levels
and the survival of patients with LUAD was analyzed using the
Kaplan-Meier plotter. The results demonstrated that high expression
of MYG1 was associated with a poor survival rate of OS and PPS, but
not associated with FP (Fig. 2).
However, multivariate analysis indicated that MYG1 was not an
independent prognostic factor for OS, FP or PPS (Table II).
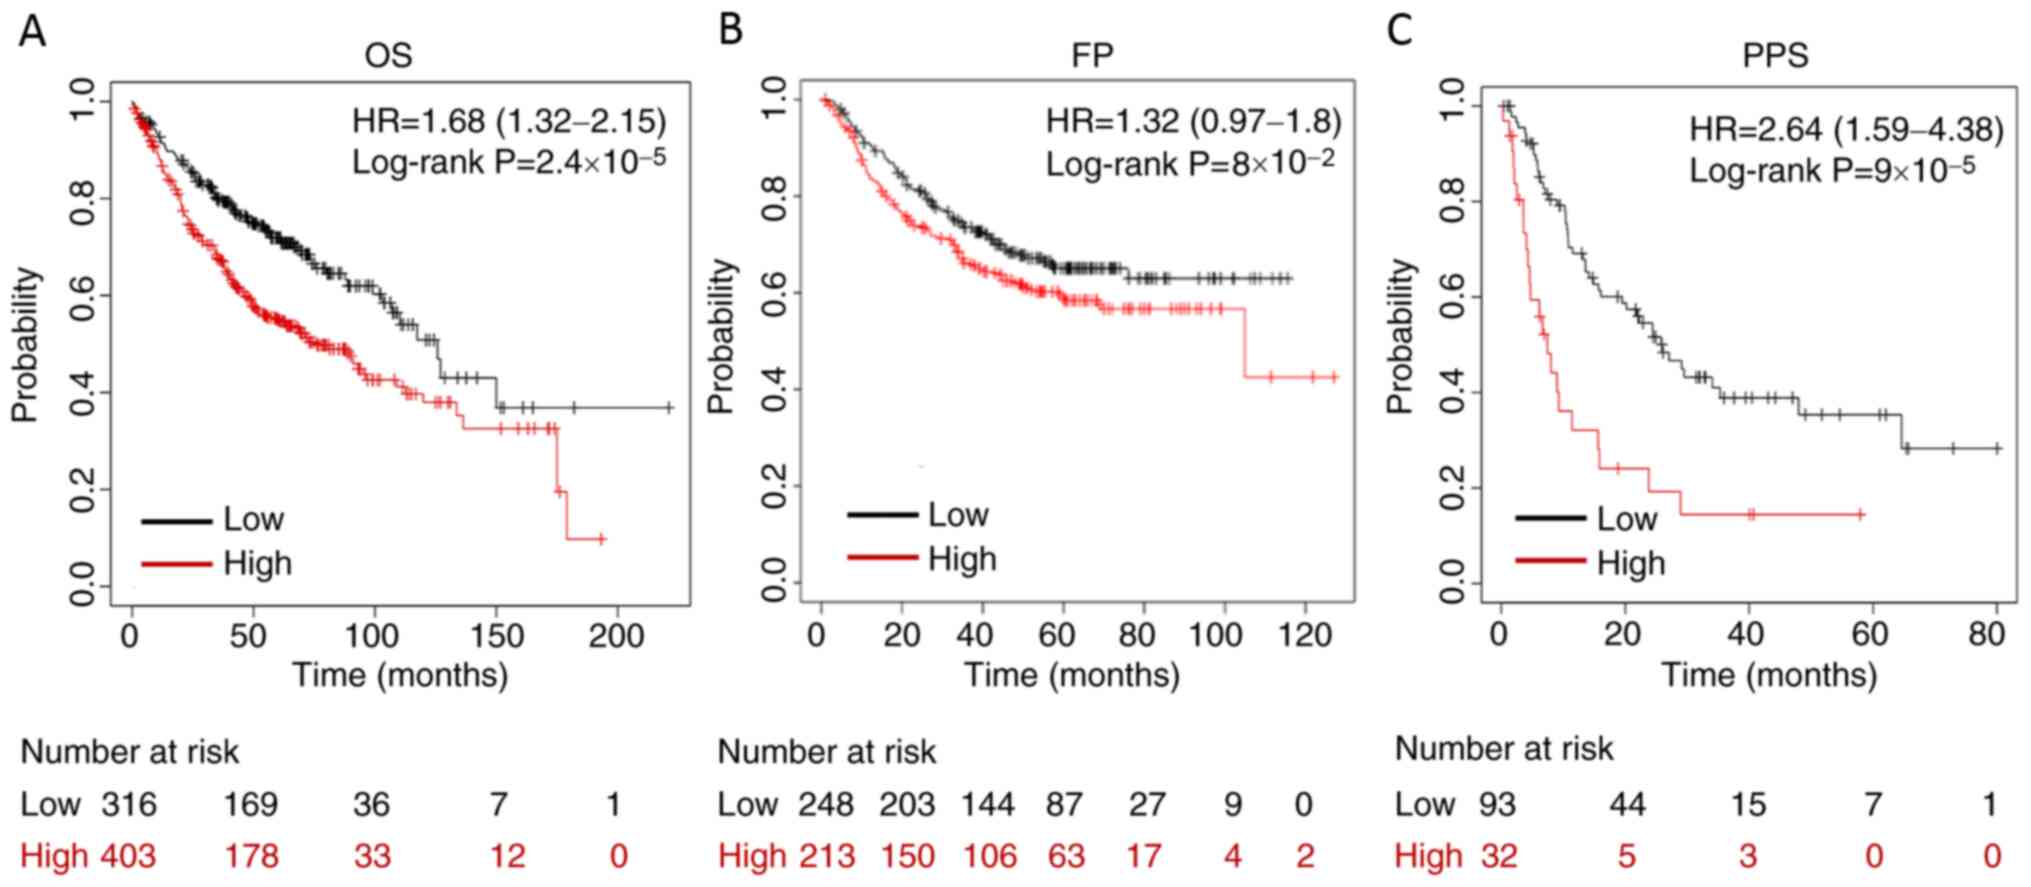 | Figure 2.High expression of MYG1 is associated
with unfavorable OS and PPS of patients with lung adenocarcinoma.
(A) High expression levels of MYG1 were associated with unfavorable
OS (cut-off value, 527; HR=1.68; 95% CI, 1.32–2.15; log-rank
P=2.4×10⁻⁵). (B) MYG1 was not associated with FP
(cut-off value, 551; HR=1.32; 95% CI, 0.97–1.8; log-rank
P=8.0×10⁻²). (C) High expression levels of MYG1 were
associated with unfavorable PPS (cut-off value, 781; HR=2.64; 95%
CI, 1.59–4.38; log-rank P=9.0×10⁻⁵). Patients were
separated using an auto-select best cutoff. OS, overall survival;
FP, first progression; MYG1, melanocyte proliferating gene 1; HR,
hazard ratio; PPS, post-progression survival. |
| Table II.Cox regression multivariate analysis
of MYG1 on overall survival, first progression and post-progression
survival of patients with lung adenocarcinoma. |
Table II.
Cox regression multivariate analysis
of MYG1 on overall survival, first progression and post-progression
survival of patients with lung adenocarcinoma.
| A, Overall
survival |
|---|
|
|---|
| Variable | Hazard ratio | 95% CI | P-value |
|---|
| Sex | 1.50 | 0.83–2.70 | 0.1824 |
| Stage | 2.52 | 0.47–13.56 | 0.2812 |
| AJCC stage T | 2.31 | 1.13–4.72 | 0.0217a |
| AJCC stage N | 1.44 | 0.26–8 | 0.6800 |
| Smoking
history | 0.91 | 0.42–2 | 0.8207 |
| MYG1 | 1.57 | 0.84–2.92 | 0.1536 |
|
| B, First
progression |
|
|
Variable | Hazard
ratio | 95% CI | P-value |
|
| Sex | 1.25 | 0.65–2.42 | 0.5035 |
| Stage | 1.02 | 0.1–9.95 | 0.9855 |
| AJCC stage T | 3.03 | 1.25–7.36 | 0.0142a |
| AJCC stage N | 2.98 | 0.31–28.31 | 0.3416 |
| Smoking
history | 1.39 | 0.66–2.96 | 0.3867 |
| MYG1 | 1.36 | 0.66–2.81 | 0.4053 |
|
| C,
Post-progression survival |
|
|
Variable | Hazard
ratio | 95% CI | P-value |
|
| Sex | 1.26 | 0.57–2.81 | 0.5715 |
| Stage | 0.73 | 0.06–8.27 | 0.7984 |
| AJCC stage T | 1.94 | 0.58–6.45 | 0.2796 |
| AJCC stage N | 2.55 | 0.21–30.97 | 0.4615 |
| Smoking
history | 1.37 | 0.44–4.24 | 0.5852 |
| MYG1 | 1.89 | 0.75–4.78 | 0.1795 |
MYG1 promotes the proliferation of
LUAD cells
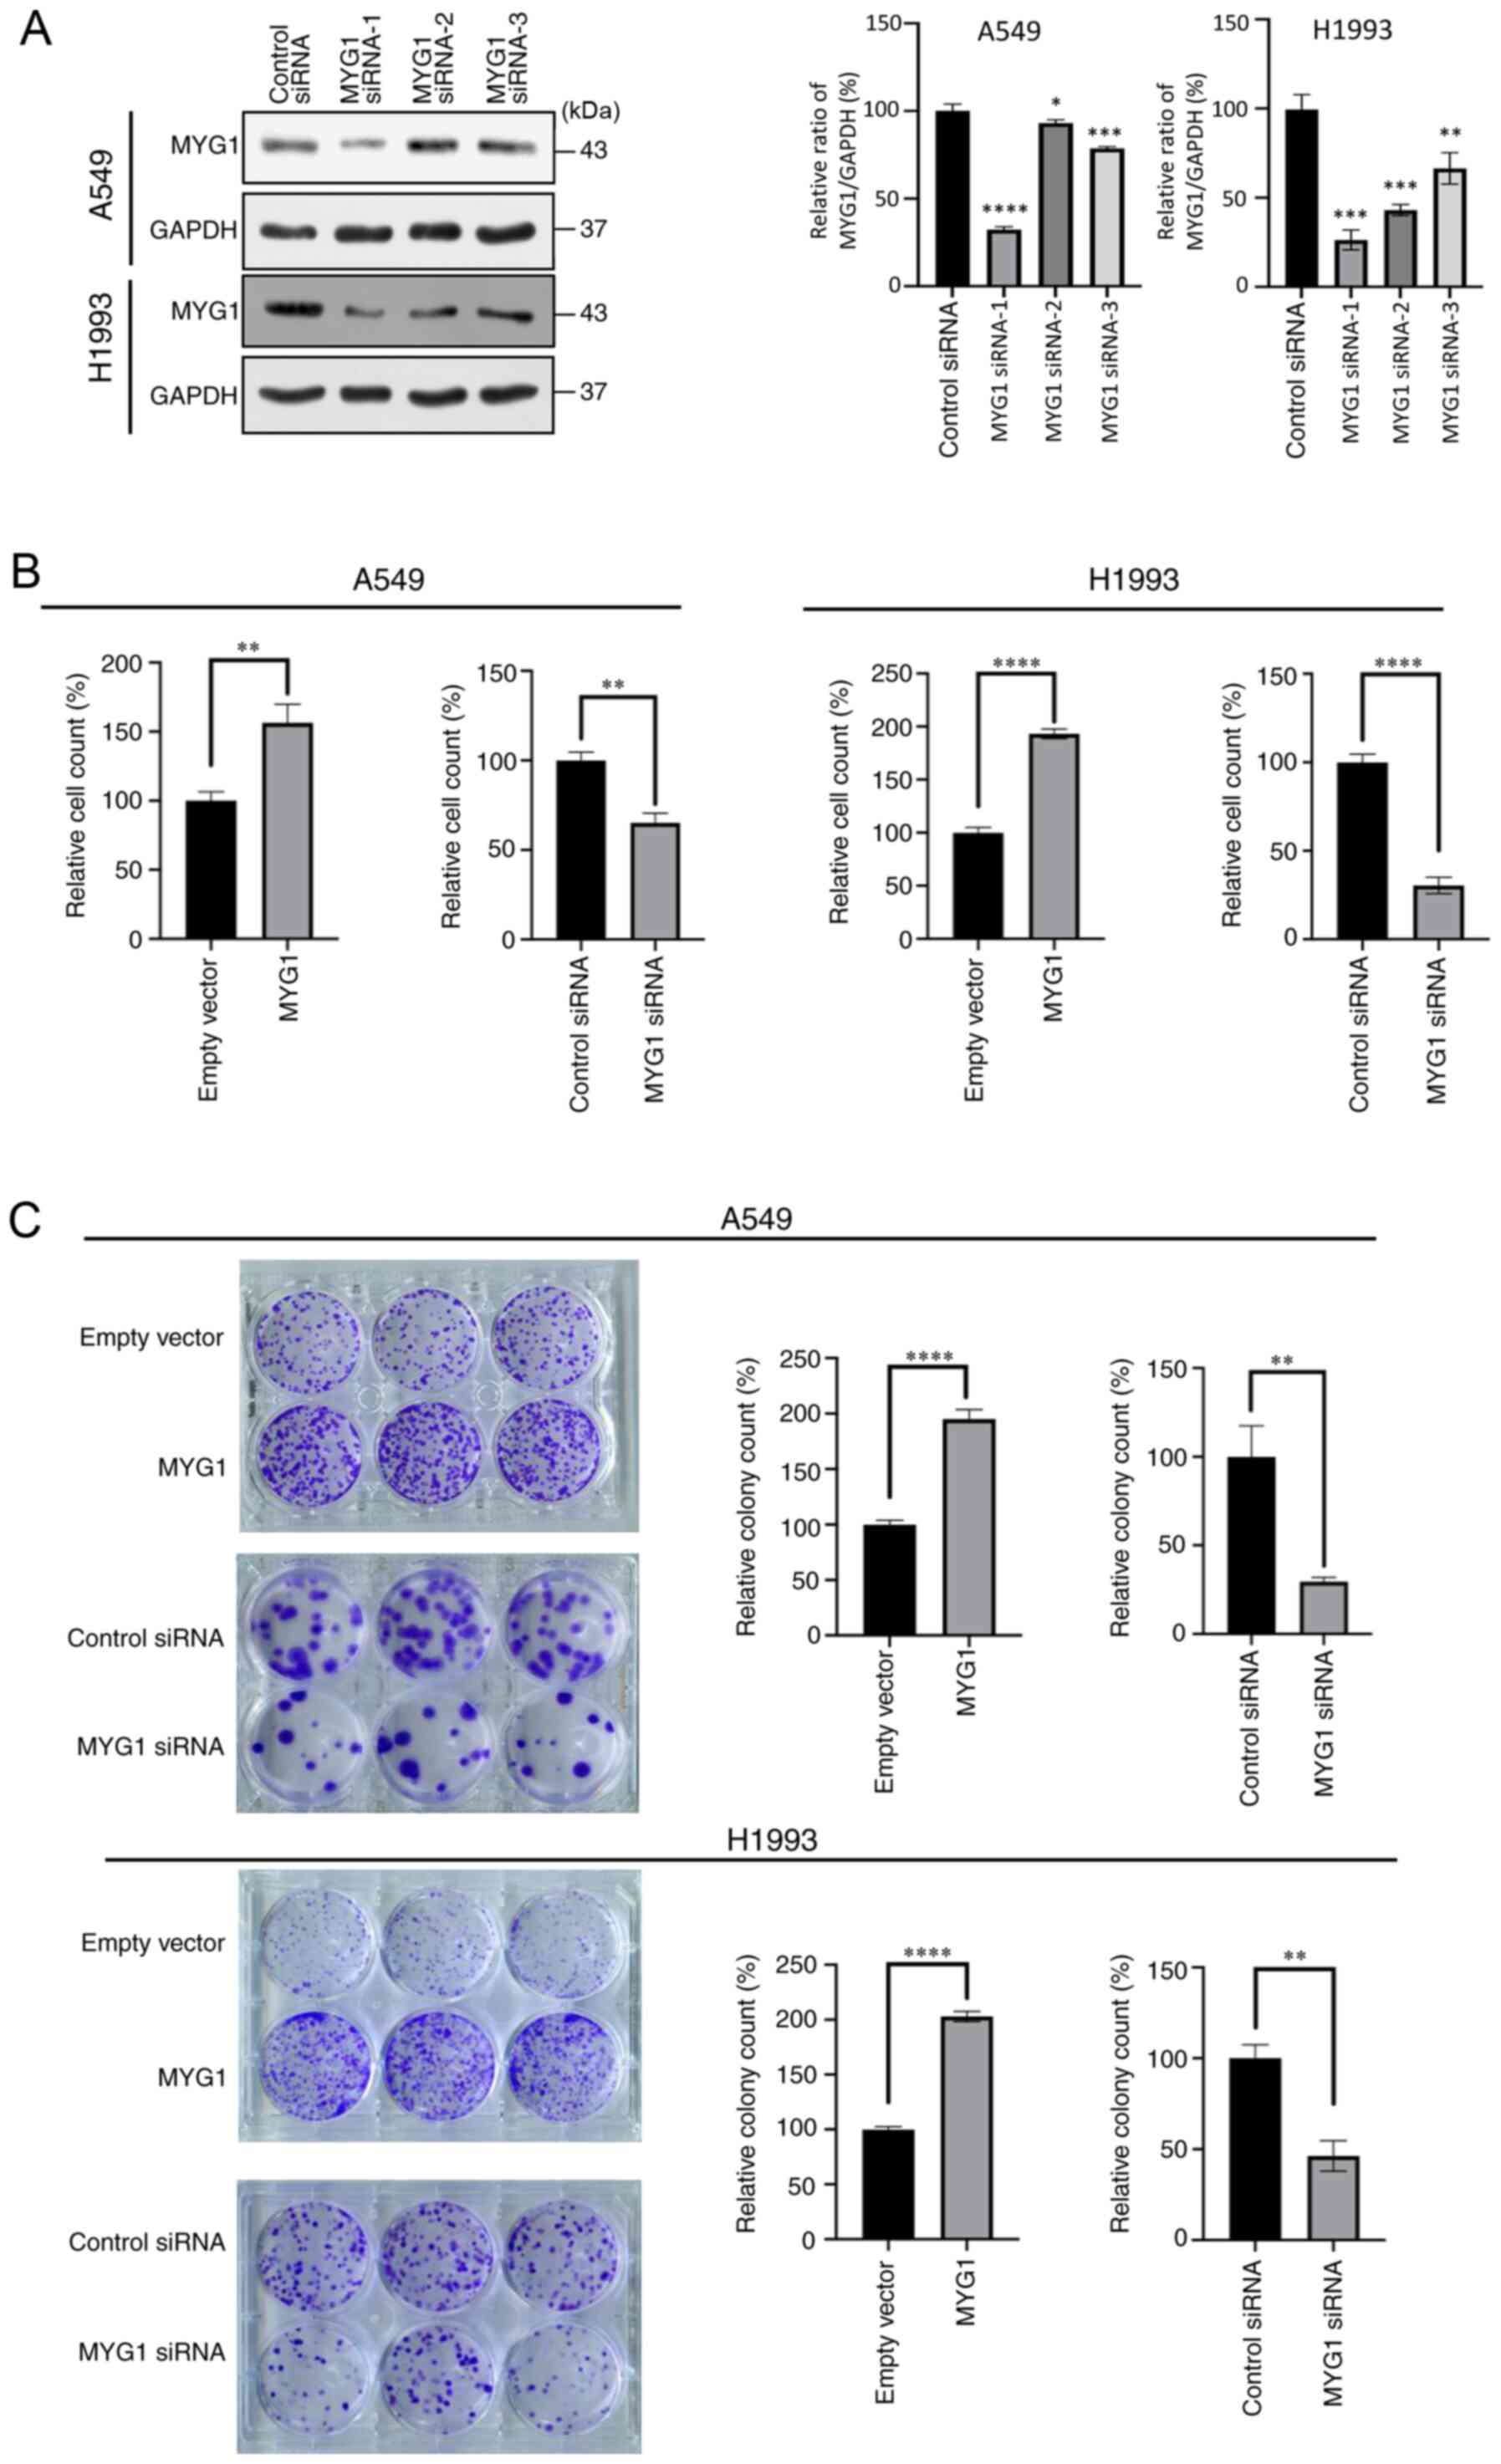
To study the function of MYG1 in LUAD, three
specific siRNA molecules targeting MYG1 were synthesized; MYG1
siRNA-1 was selected for subsequent experiments as it exerted the
strongest inhibitory effect on MYG1 protein expression (Fig. 3A).
Cell proliferation and colony formation were
determined following overexpression or knockdown of MYG1 in A549
and H1993 cells. The results demonstrated that MYG1 overexpression
promoted cell proliferation and colony formation compared with
those in the empty vector-transfected cells, whereas knockdown of
MYG1 exerted the opposite effects (Fig.
3B and C).
MYG1 promotes the migration and
invasion of LUAD cells
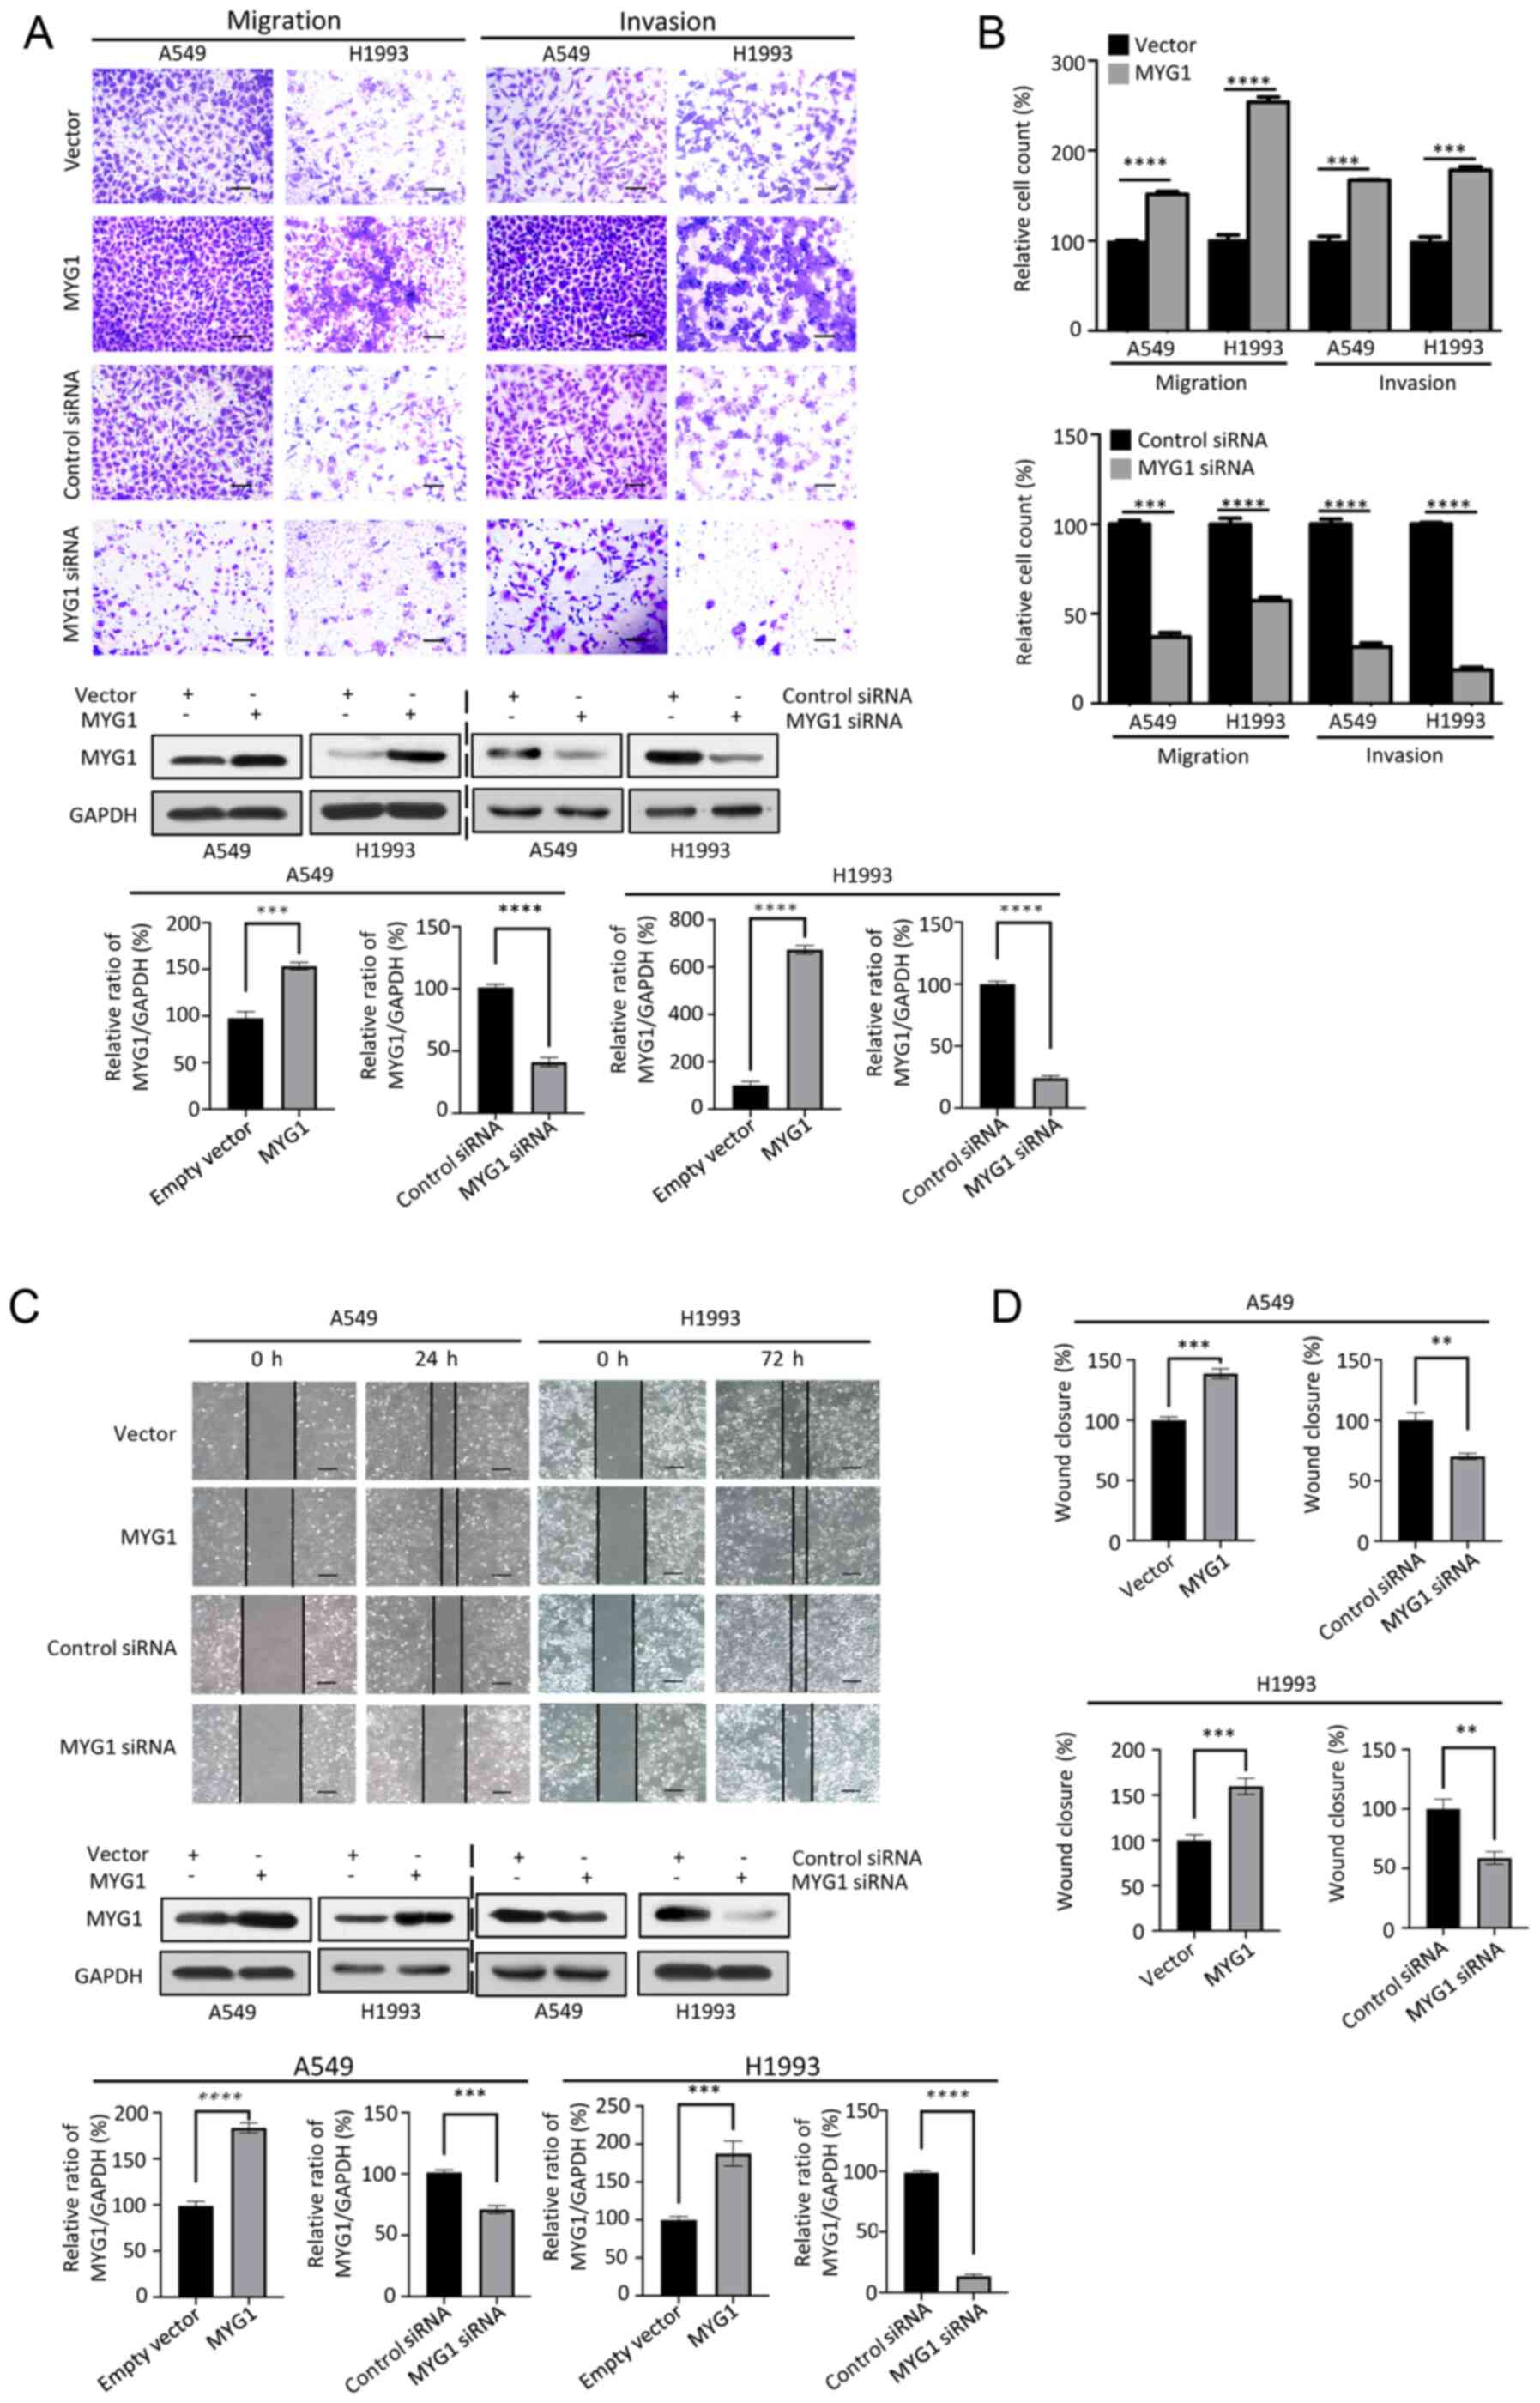
To investigate whether MYG1 was involved in the
migration and invasion of A549 and H1993 cells, the cells were
transfected with MYG1 overexpression plasmids and an empty vector,
or with MYG1 siRNA and control siRNA. Subsequently, Transwell and
wound healing assays were performed. The results of the Transwell
assays revealed that overexpression of MYG1 significantly increased
the number of the cells that crossed the membrane compared with
those in the control group, whereas the opposite results were
obtained in the MYG1 knockdown group (Fig. 4A and B). The wound healing assay
demonstrated that, compared with the corresponding control groups,
overexpression of MYG1 increased cell migration, and MYG1 knockdown
exerted the opposite effect (Fig. 4C and
D). Collectively, the Transwell and wound healing assay results
suggested that MYG1 promoted cell migration and invasion.
MYG1 inhibits autophagy in LUAD
cells
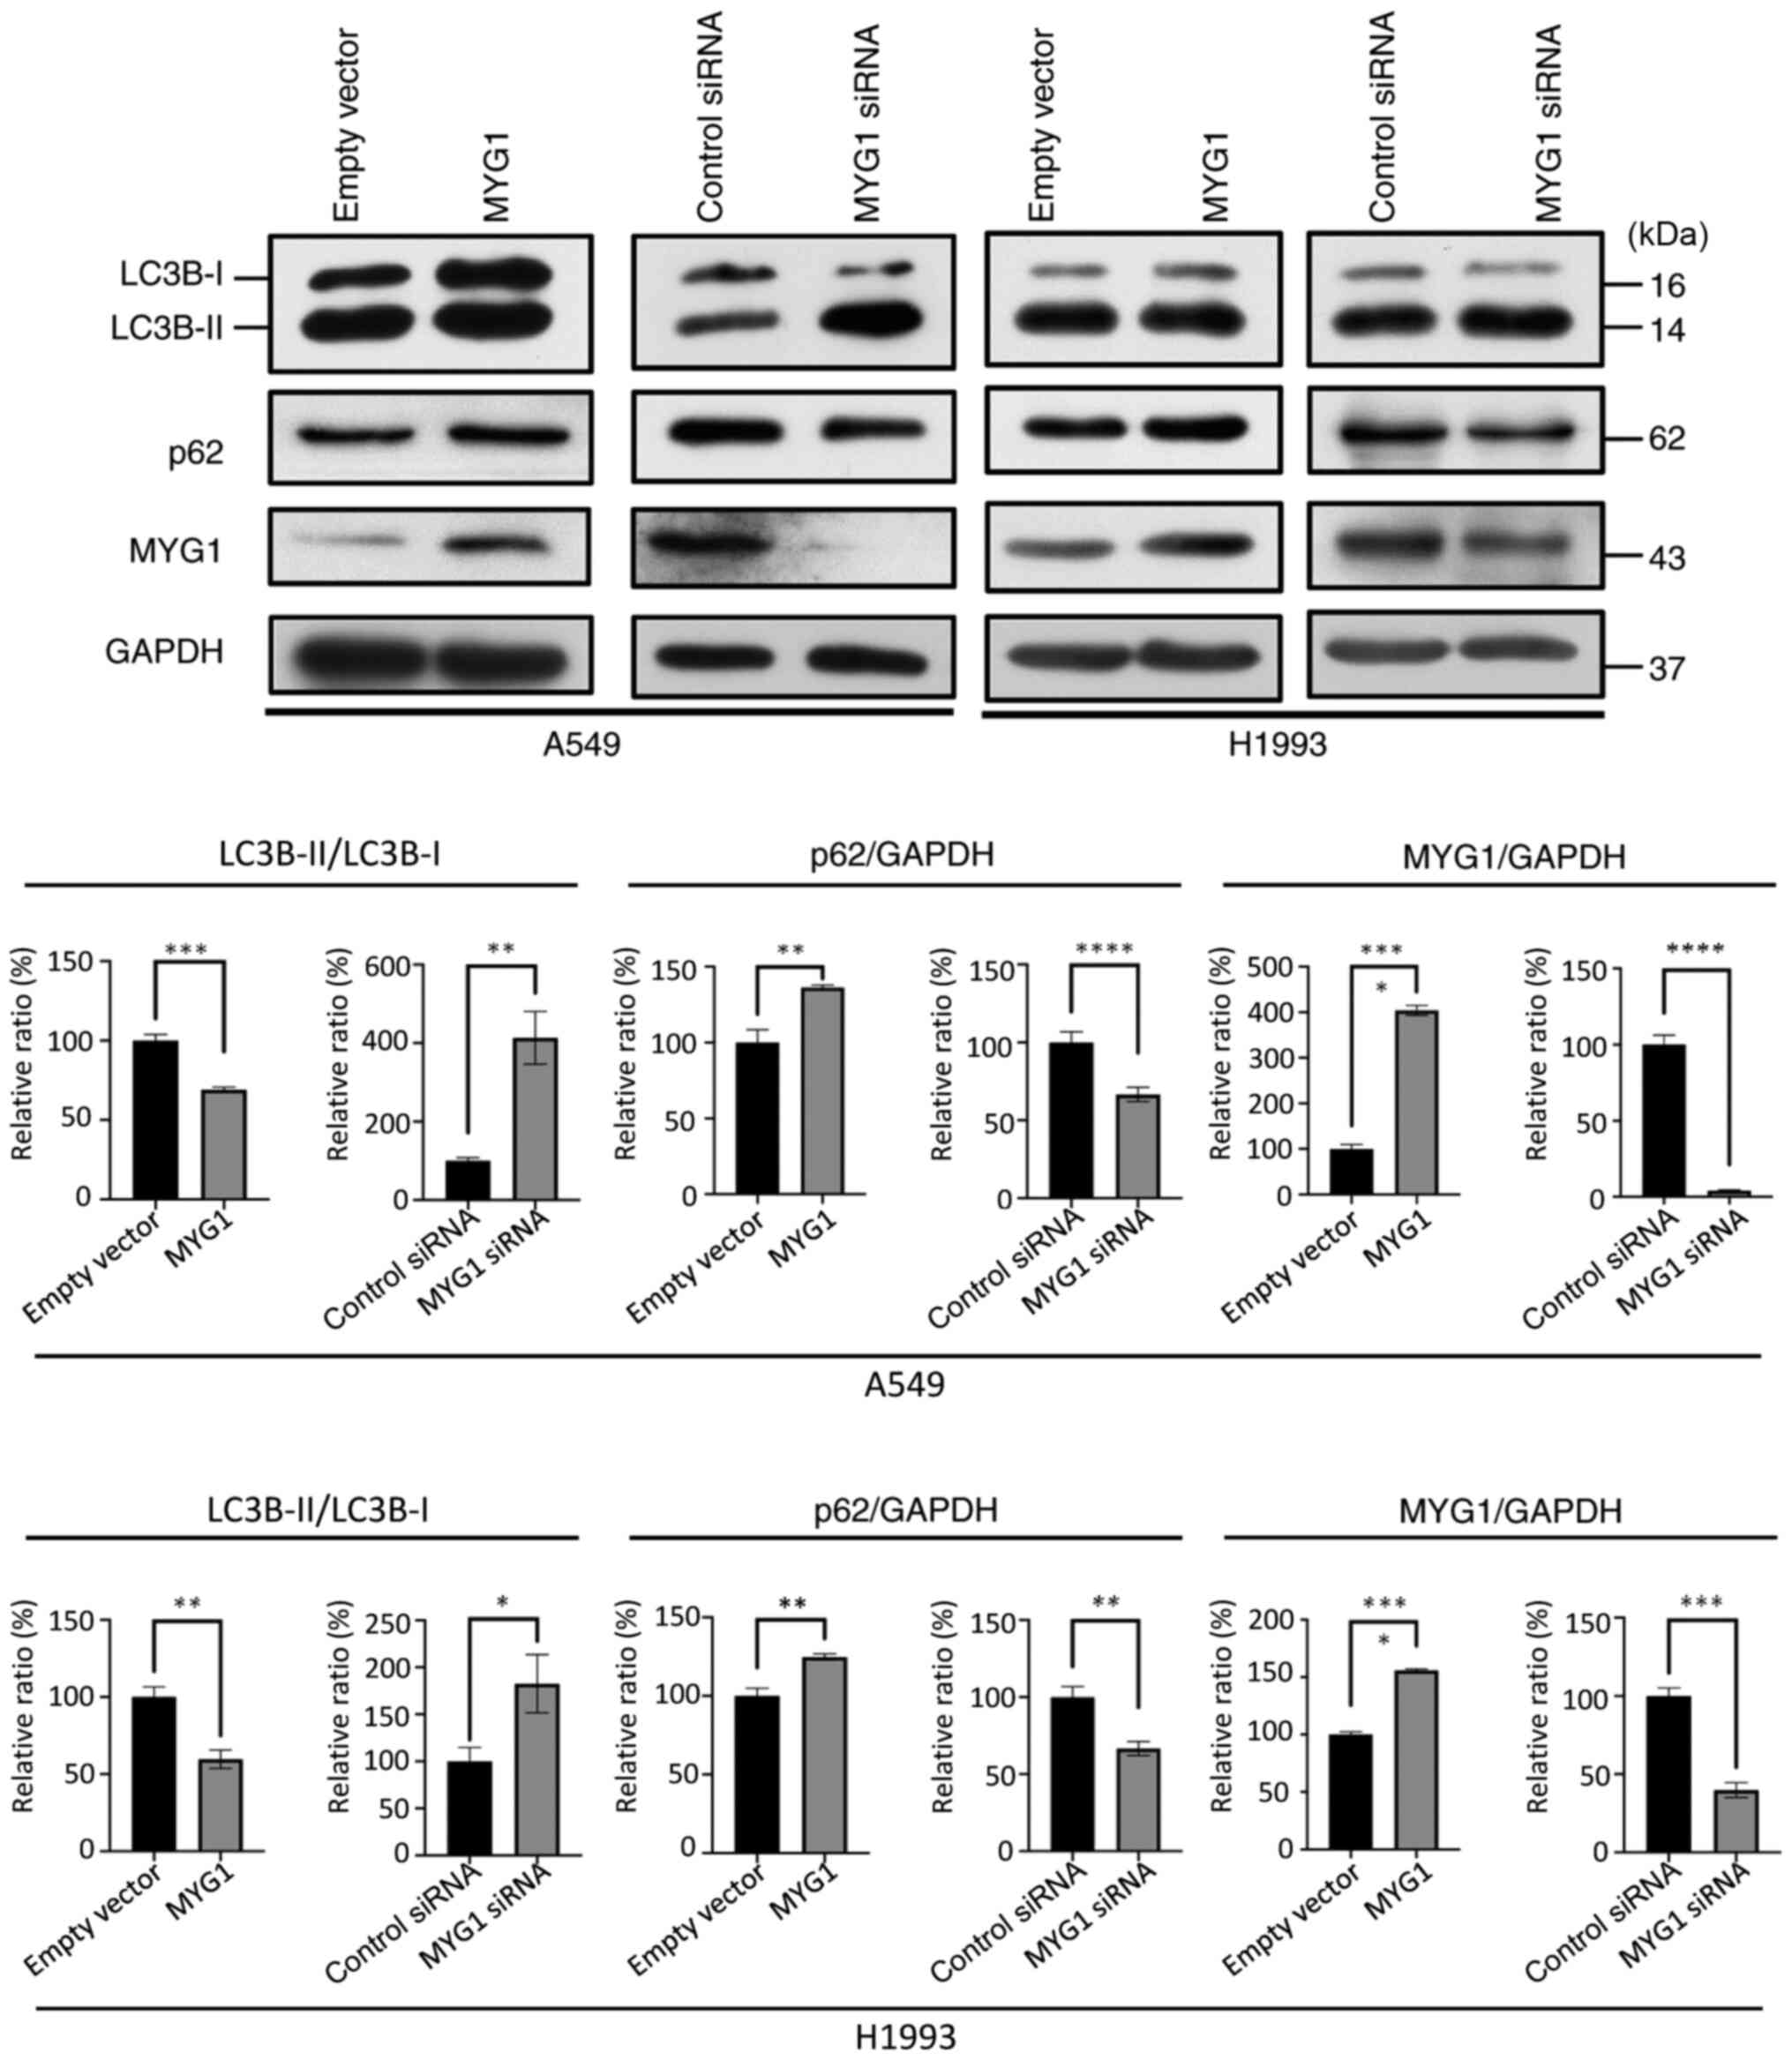
Autophagy is a lysosomal degradation process that
serves a dual role in cancer (17).
Since LC3B conversion (LC3-I to LC3-II) and lysosomal degradation
of LC3-II reflect the progression of autophagy, and the p62 protein
is degraded by autophagy (18), LC3B
and p62 are considered to be markers of autophagy. To identify the
potential effects of MYG1 on autophagy, MYG1 was overexpressed or
knocked down in A549 and H1993 cells. The expression levels of the
autophagic markers p62 and LC3-I/II were detected by western blot
analysis 48 h post-transfection. The results demonstrated that
overexpression of MYG1 led to an increase in p62 protein expression
levels, as well as a decrease in the ratio of LC3B-II/LC3B-I
(Fig. 5), indicating reduced
autophagy compared with the empty vector group. By contrast,
knockdown of MYG1 resulted in a decrease in p62 protein expression
levels and an increase in the ratio of LC3B-II/LC3B-I (Fig. 5), suggesting enhanced autophagy
compared with the control siRNA group. Taken together, these
results suggested that MYG1 inhibited autophagy.
Knockdown of MYG1 enhances the
phosphorylation of AMPKα and suppresses mTORC1 activity
To identify the underlying mechanisms via which MYG1
mediates the aforementioned cancerous features, TCGA LUAD gene
expression data were analyzed using GSEA. The results demonstrated
that the ‘HALLMARK_OXIDATIVE_PHOSPHORYLATION’ and
‘HALLMARK_MTORC1_SIGNALING’ gene sets were enriched with high
expression of MYG1 (Fig. 6A and B),
indicating that MYG1 may be associated with oxidative
phosphorylation and mTORC1. To confirm the association between MYG1
expression and oxidative phosphorylation, the levels of the product
of oxidative phosphorylation, cellular ATP, were measured after
MYG1 knockdown and overexpression. The results demonstrated that
the levels of cellular ATP were significantly decreased following
knockdown of MYG1, but were significantly increased following MYG1
overexpression compared with those in the corresponding control
groups (Fig. 6C).
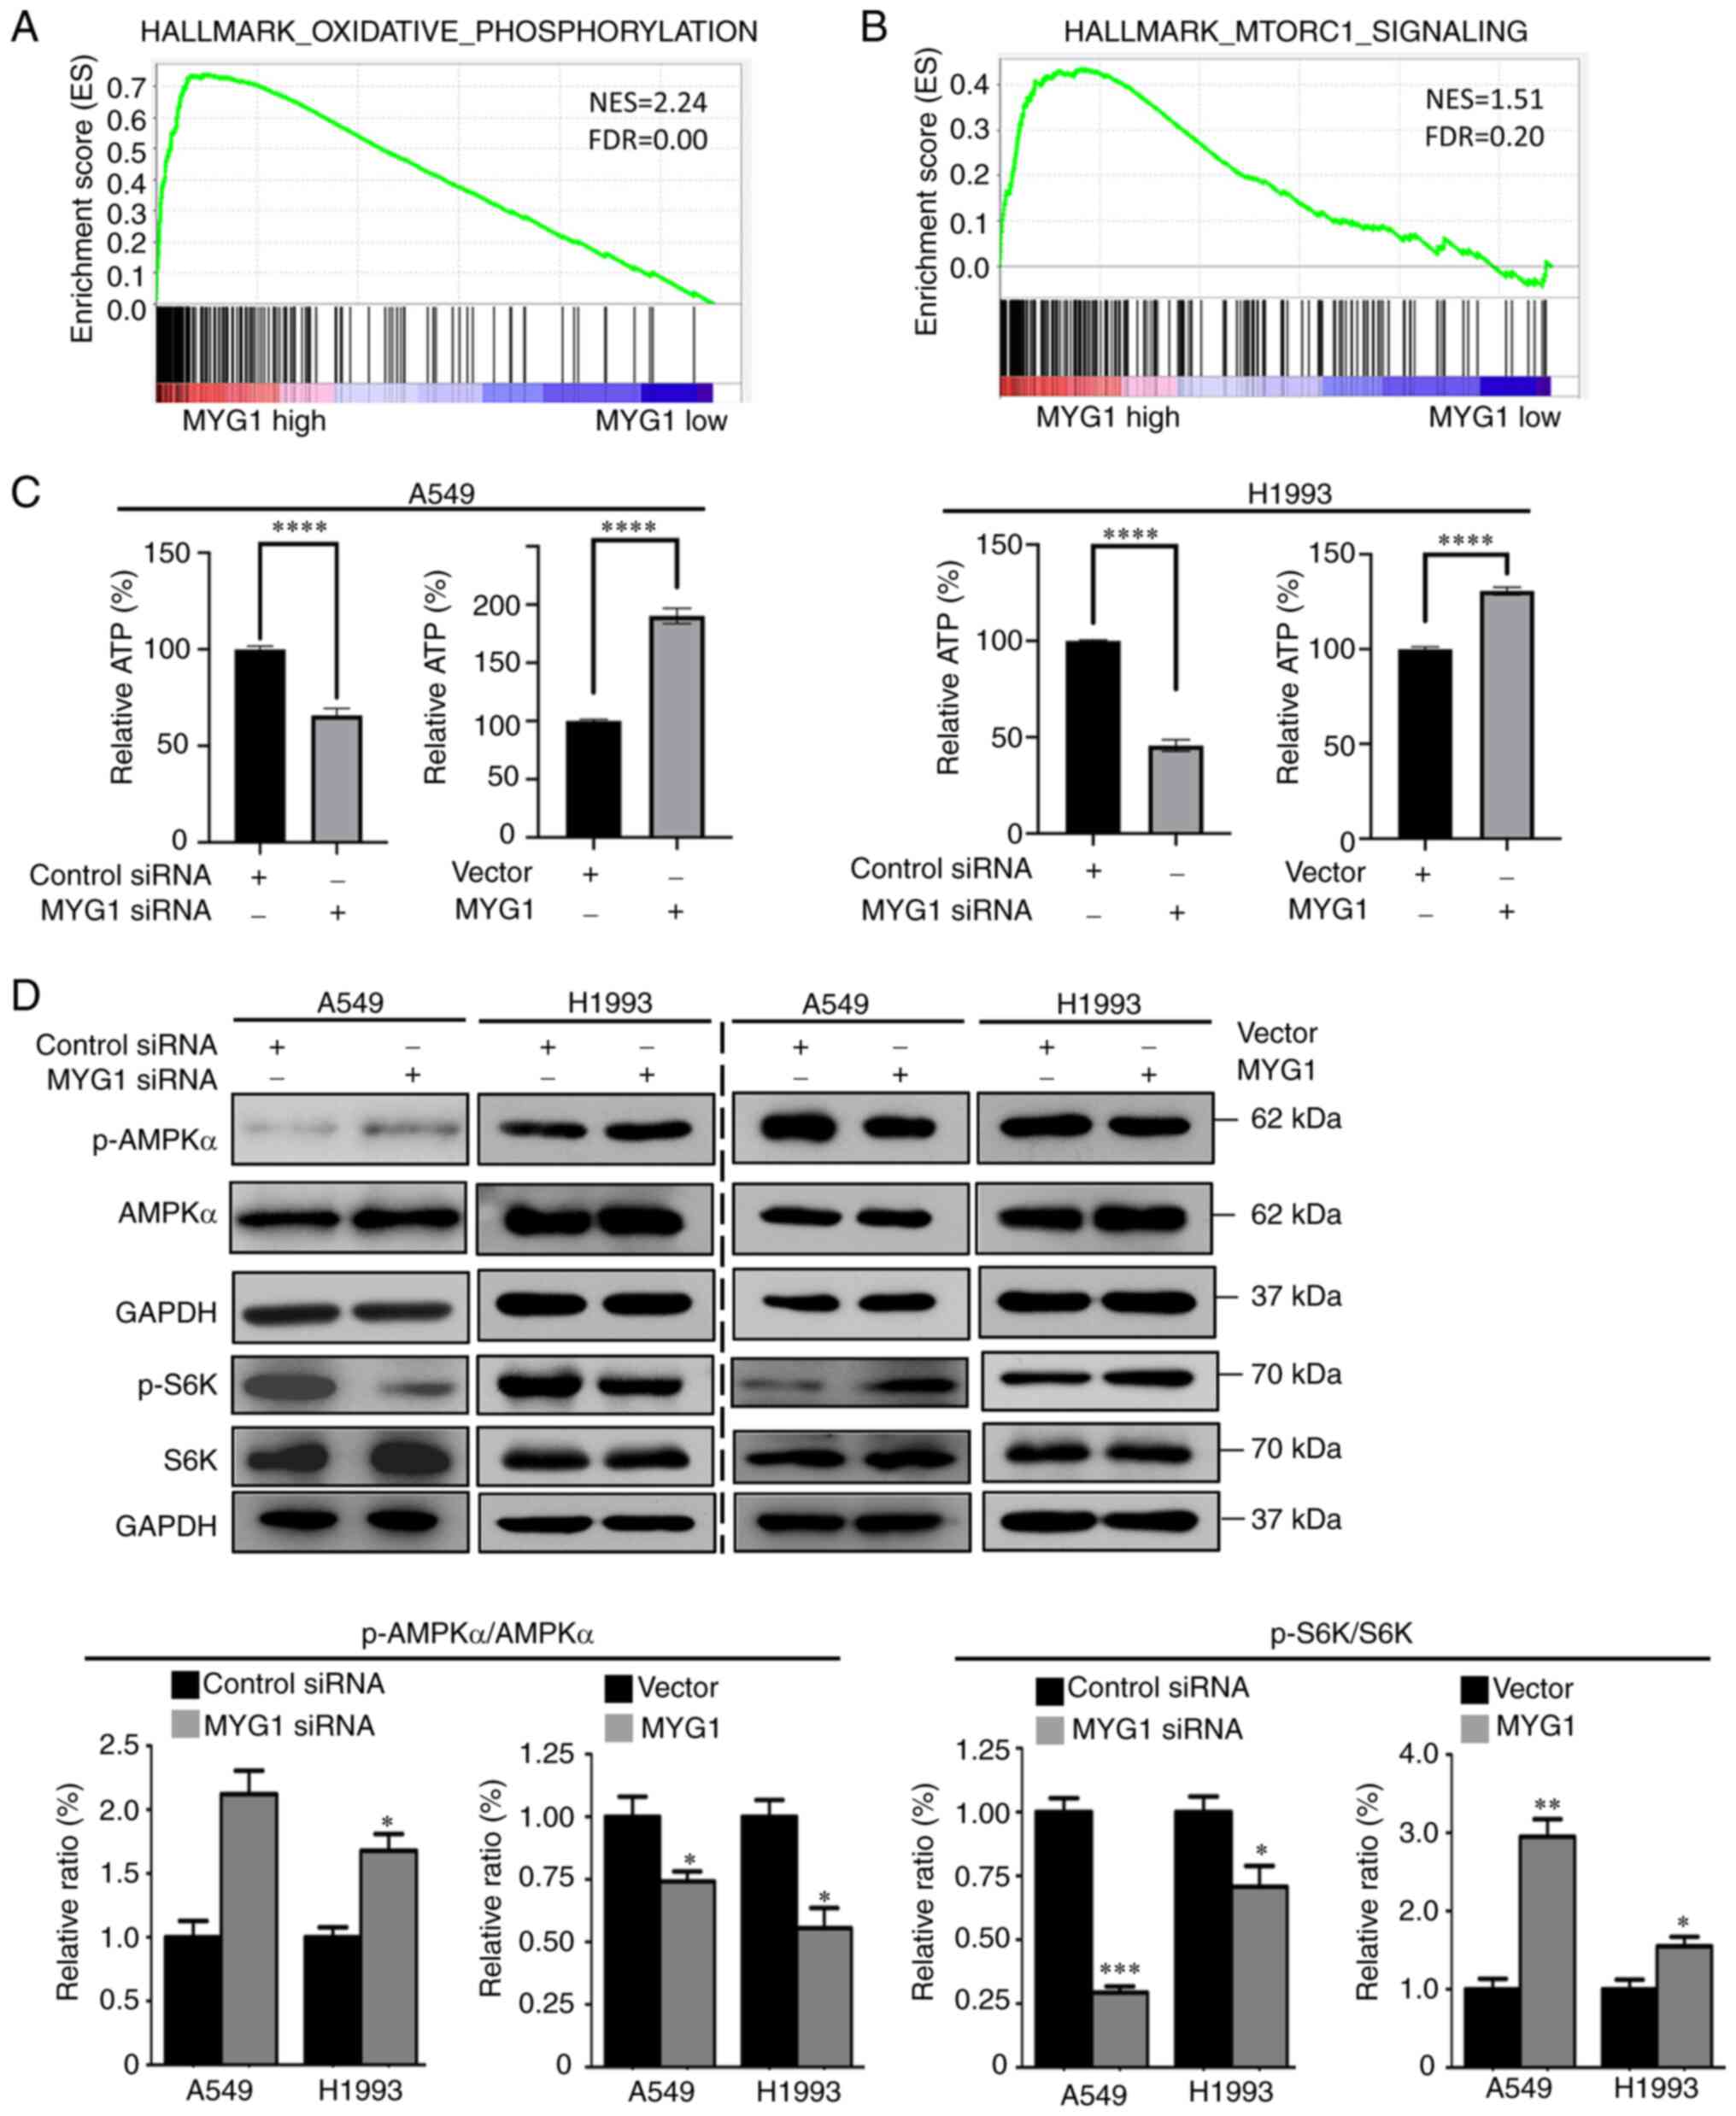 | Figure 6.MYG1 positively regulates the
AMPK/mTORC1 signaling pathway by promoting the production of ATP in
lung adenocarcinoma cells. (A and B) The Gene Set Enrichment
Analysis results indicated that the gene sets of
‘HALLMARK_OXIDATIVE_PHOSPHORYLATION’ and
‘HALLMARK_MTORC1_SIGNALING’ were enriched with high expression of
MYG1. (C) Knockdown of MYG1 suppressed the production of ATP in
A549 and H1993 cells, whereas overexpression of MYG1 enhanced the
production of ATP compared with that in the corresponding control
groups. (D) Knockdown of MYG1 promoted the levels of
phosphorylation of AMPKα, but inhibited the levels of
phosphorylation of p70S6K compared with those in the control
siRNA-transfected group; overexpression of MYG1 exerted the
opposite effects on the phosphorylation of AMPKα and p70S6K.
*P<0.05, **P<0.01, ***P<0.001 and ****P<0.0001. NES,
normalized enrichment score; FDR, false discovery rate; MYG1,
melanocyte proliferating gene 1; siRNA, small interfering RNA;
AMPKα, AMP-activated protein kinase α; mTORC1, mTOR complex 1; p-,
phosphorylated. |
AMPK is a cellular energy sensor, which is
phosphorylated and activated during cellular ATP depletion
(5). Therefore, phosphorylation of
AMPKα was determined in A549 and H1993 cells following MYG1
knockdown and overexpression. The results demonstrated that
knockdown of MYG1 enhanced the levels of AMPKα phosphorylation,
whereas MYG1 overexpression decreased the levels of AMPKα
phosphorylation compared with those in the corresponding control
groups (Fig. 6D). mTOR is a
serine/threonine kinase that forms mTORC1, which is downstream of
AMPK and negatively regulates autophagy (4). To determine mTORC1 activity following
MYG1 knockdown or overexpression, the phosphorylation of the mTORC1
substrate p70S6K was detected by western blot analysis. The results
demonstrated that the phosphorylation levels of p70S6K decreased
following MYG1 knockdown, but increased following MYG1
overexpression compared with those in the corresponding control
groups (Fig. 6D). Collectively,
these results suggested that MYG1 was positively associated with
cellular ATP production, and that high levels of MYG1 expression
may promote mTORC1 activity via AMPK.
Discussion
MYG1 is ubiquitously expressed in healthy human
tissues and is localized in the nucleus and mitochondria (6). MYG1 is an exonuclease that participates
in RNA processing and is required for mitochondrial functionality
(8). Mitochondria are key factors in
tumorigenesis due to their roles in energy production, regulation
of cell signaling and cell death (19). To the best of our knowledge, no
published studies are currently available on the function and
clinical significance of MYG1 in tumors, and thus, the present
study aimed to investigate the potential role of MYG1 in LUAD.
To examine the role of MYG1 in tumorigenesis, the
present study first compared the expression levels of MYG1 in LUAD
tissues with those in healthy tissue using the data of TCGA LUAD
cohort. The results demonstrated that MYG1 expression levels were
significantly upregulated in LUAD compared with those in the normal
tissues. However, MYG1 expression levels did not change
significantly from LUAD stage 1 to stage 4, indicating that MYG1
upregulation occurs early during the tumorigenesis of LUAD.
Subsequently, the association between the expression of MYG1 and
the prognosis as well as the clinicopathological characteristics of
patients with LUAD was evaluated, and the results indicated that
high expression levels of MYG1 were associated with the N stage.
Univariate analysis identified that high expression levels of MYG1
were associated with unfavorable OS and PPS rates. However, the
results of the multivariate analysis indicated that MYG1 expression
was not an independent indicator for either OS or PPS. Finally,
in vitro experiments were performed to determine how high
expression levels of MYG1 were associated with the progression of
LUAD at the cellular level. The results demonstrated that MYG1
promoted the proliferation, migration and invasion, but suppressed
autophagy.
As MYG1 knockout in yeast results in defects in
respiratory growth due to its key role in processing ribosomal and
messenger RNA transcripts in the mitochondria (8), we hypothesized that changes in MYG1
expression levels may affect the respiratory function of LUAD
cells. The results of the GSEA on LUAD gene expression data
suggested that high expression of MYG1 was enriched with the gene
set of ‘HALLMARK_OXIDATIVE_PHOSPHORYLATION’, which suggested that
the change in MYG1 expression may affect the production of ATP,
which is a product of oxidative phosphorylation. Thus, the amount
of ATP was measured following MYG1 knockdown, and the results
demonstrated the levels of ATP were reduced by ~40% in the MYG1
knockdown group compared with those in the control group. As AMPK
is a cellular energy sensor that is activated upon ATP depletion
(5), and based on the GSEA results
that suggested that the gene set of the mTORC1 signaling pathway
was enriched with high expression of MYG1, the activities of AMPK
and mTORC1 were examined following MYG1 knockdown. The results
demonstrated that knockdown of MYG1 increased the phosphorylation
levels of AMPKα and inhibited mTORC1 activity, which was
demonstrated by the decreased phosphorylation of S6K. mTORC1 serves
a central role in regulating numerous cellular processes, including
protein synthesis, lipid, nucleotide and glucose metabolism, and
autophagy (4). Therefore, high
expression levels of MYG1 may promote the cancerous features of
LUAD cells and may be associated with an unfavorable prognosis. To
the best of our knowledge, the present study was the first to
reveal the role and mechanism of MYG1 in tumorigenesis.
Since high MYG1 expression was observed in LUAD
tissues and may contribute to cancerous features in the present
study, the regulation of MYG1 expression LUAD should be further
investigated. As the in vitro experiments in the present
study were only performed in A549 and H1993 cells, further
experiments should be performed in additional LUAD cell lines in
order to confirm the present conclusions. In addition, since MYG1
expression was only accessed in TCGA LUAD tissue samples in the
present study, its expression needs to be evaluated in other
datasets to confirm the findings of this study. As it was observed
that AJCC stage N was not an independent prognostic factor for OS,
FP and PPS, and T stage was not an independent factor for PPS,
these results may represent a potential limitation due to the
cohort size. Therefore, more data from patients with LUAD should be
analyzed to overcome this limitation. In addition, the expression
levels and prognostic role of MYG1 in other types of cancer should
be investigated.
In conclusion, the results of the present study
demonstrated that the expression levels of MYG1 were upregulated in
LUAD compared with those in normal lung tissues, and high
expression of MYG1 was associated with unfavorable clinical
outcomes. Furthermore, MYG1 may promote the proliferation,
migration and invasion, as well as inhibit the autophagy of LUAD
cells via the AMPK/mTORC1 signaling pathway. Collectively, the
present results indicated that MYG1 may serve an oncogenic role in
LUAD and may be a potential therapeutic target for LUAD.
Acknowledgements
Not applicable.
Funding
This work was supported in part by the Research
Enhancement Project for Junior Faculty in Higher Education
Institutes of Guangxi (grant no. 2019KY0522), the Scientific
Research Project for Junior Faculty in Guilin Medical College
(grant no. 2018glmcy055), the Natural Science Foundation of Guangxi
(grant no. 2020JJA140139) and the Open Research Fund from Guangxi
Key Laboratory of Liver Injury and Repair Molecular Medicine (grant
no. GXLIRMMKL-201802, GXLIRMMKL-201816). GH was supported by the
Hundred Talents Program of Guangxi.
Availability of data and materials
The datasets used and/or analyzed during the current
study are available from the corresponding author on reasonable
request.
Authors' contributions
GH conceived the study and performed the
bioinformatical analysis. XH, WW, CW, LD and AL performed the
experiments. GH and XH confirm the authenticity of all the raw
data. GH and XH analyzed and interpreted the data, and wrote the
manuscript. All authors read and approved the final manuscript.
Ethics approval and consent to
participate
Not applicable.
Patient consent for publication
Not applicable.
Competing interests
The authors declare that they have no competing
interests.
References
|
1
|
Bray F, Ferlay J, Soerjomataram I, Siegel
RL, Torre LA and Jemal A: Global cancer statistics 2018: GLOBOCAN
estimates of incidence and mortality worldwide for 36 cancers in
185 countries. CA Cancer J Clin. 68:394–424. 2018. View Article : Google Scholar : PubMed/NCBI
|
|
2
|
Zappa C and Mousa SA: Non-small cell lung
cancer: Current treatment and future advances. Transl Lung Cancer
Res. 5:288–300. 2016. View Article : Google Scholar : PubMed/NCBI
|
|
3
|
Herbst RS, Morgensztern D and Boshoff C:
The biology and management of non-small cell lung cancer. Nature.
553:446–454. 2018. View Article : Google Scholar : PubMed/NCBI
|
|
4
|
Saxton RA and Sabatini DM: mTOR signaling
in growth, metabolism, and disease. Cell. 168:960–976. 2017.
View Article : Google Scholar : PubMed/NCBI
|
|
5
|
Herzig S and Shaw RJ: AMPK: Guardian of
metabolism and mitochondrial homeostasis. Nat Rev Mol Cell Biol.
19:121–135. 2018. View Article : Google Scholar : PubMed/NCBI
|
|
6
|
Philips M-A, Vikeså J, Luuk H, Jønson L,
Lilleväli K, Rehfeld JF, Vasar E, Kõks S and Nielsen FC:
Characterization of MYG1 gene and protein: Subcellular distribution
and function. Biol Cell. 101:361–377. 2009. View Article : Google Scholar : PubMed/NCBI
|
|
7
|
Philips MA, Kingo K, Karelson M, Rätsep R,
Aunin E, Reimann E, Reemann P, Porosaar O, Vikeså J, Nielsen FC, et
al: Promoter polymorphism-119C/G in MYG1 (C12orf10) gene is related
to vitiligo susceptibility and Arg4Gln affects mitochondrial
entrance of Myg1. BMC Med Genet. 11:562010. View Article : Google Scholar : PubMed/NCBI
|
|
8
|
Grover R, Burse SA, Shankrit S, Aggarwal
A, Kirty K, Narta K, Srivastav R, Ray AK, Malik G, Vats A, et al:
Myg1 exonuclease couples the nuclear and mitochondrial
translational programs through RNA processing. Nucleic Acids Res.
47:5852–5866. 2019. View Article : Google Scholar : PubMed/NCBI
|
|
9
|
Wang R, Wang W, Li A, Wang Y, Jin J, Huang
Z and Huang G: Lipopolysaccharide enhances DNA-induced IFN-β
expression and autophagy by upregulating cGAS expression in A549
cells. Exp Ther Med. 18:4157–4164. 2019.PubMed/NCBI
|
|
10
|
Grada A, Otero-Vinas M, Prieto-Castrillo
F, Obagi Z and Falanga V: Research techniques made simple: Analysis
of collective cell migration using the wound healing assay. J
Invest Dermatol. 137:e11–e16. 2017. View Article : Google Scholar : PubMed/NCBI
|
|
11
|
Zhang X, Zuo X, Yang B, Li Z, Xue Y, Zhou
Y, Huang J, Zhao X, Zhou J, Yan Y, et al: MicroRNA directly
enhances mitochondrial translation during muscle differentiation.
Cell. 158:607–619. 2014. View Article : Google Scholar : PubMed/NCBI
|
|
12
|
Chandrashekar DS, Bashel B, Balasubramanya
SAH, Creighton CJ, Ponce-Rodriguez I, Chakravarthi BVSK and
Varambally S: UALCAN: A portal for facilitating tumor subgroup gene
expression and survival analyses. Neoplasia. 19:649–658. 2017.
View Article : Google Scholar : PubMed/NCBI
|
|
13
|
Győrffy B, Surowiak P, Budczies J and
Lánczky A: Online survival analysis software to assess the
prognostic value of biomarkers using transcriptomic data in
non-small-cell lung cancer. PLoS One. 8:e822412013. View Article : Google Scholar : PubMed/NCBI
|
|
14
|
Mootha VK, Lindgren CM, Eriksson KF,
Subramanian A, Sihag S, Lehar J, Puigserver P, Carlsson E,
Ridderstråle M, Laurila E, et al: PGC-1alpha-responsive genes
involved in oxidative phosphorylation are coordinately
downregulated in human diabetes. Nat Genet. 34:267–273. 2003.
View Article : Google Scholar : PubMed/NCBI
|
|
15
|
Subramanian A, Tamayo P, Mootha VK,
Mukherjee S, Ebert BL, Gillette MA, Paulovich A, Pomeroy SL, Golub
TR, Lander ES and Mesirov JP: Gene set enrichment analysis: A
knowledge-based approach for interpreting genome-wide expression
profiles. Proc Natl Acad Sci USA. 102:15545–15550. 2005. View Article : Google Scholar : PubMed/NCBI
|
|
16
|
Hoadley KA, Yau C, Hinoue T, Wolf DM,
Lazar AJ, Drill E, Shen R, Taylor AM, Cherniack AD, Thorsson V, et
al: Cell-of-origin patterns dominate the molecular classification
of 10,000 tumors from 33 types of cancer. Cell. 173:291–304.e6.
2018. View Article : Google Scholar : PubMed/NCBI
|
|
17
|
White E: The role for autophagy in cancer.
J Clin Invest. 125:42–46. 2015. View
Article : Google Scholar : PubMed/NCBI
|
|
18
|
Klionsky DJ, Abdelmohsen K, Abe A, Abedin
MJ, Abeliovich H, Acevedo Arozena A, Adachi H, Adams CM, Adams PD,
Adeli K, et al: Guidelines for the use and interpretation of assays
for monitoring autophagy (3rd edition). Autophagy. 12:1–222. 2016.
View Article : Google Scholar : PubMed/NCBI
|
|
19
|
Vyas S, Zaganjor E and Haigis MC:
Mitochondria and cancer. Cell. 166:555–566. 2016. View Article : Google Scholar : PubMed/NCBI
|