Introduction
Bladder cancer (BLCA) is a common malignancy that
affects the urinary tract, with an estimated 81,400 new cases
diagnosed in the United States in 2020 (1). BLCA represents a major cause of
tumor-associated death that muscle-invasive bladder cancer outcomes
remain <10% survival at 5 years despite aggressive treatment
(2). Patients with BLCA are more
likely to develop distant metastasis when their respective tumor
cells invade the bladder's muscle membrane (3). Historically, the combination
chemotherapy, including methotrexate, vinblastine, doxorubicin and
cisplatin (MVAC), has been the first-line therapy for advanced
BLCA. Nevertheless, the clinical benefits of this
multi-chemotherapeutic approach have been restricted due to
extensive drug toxicity, which includes neutropenia, cardiac and
neurological conditions, thus making approximately half of patients
with BLCA ineligible for this type of chemotherapy (4,5).
The suppression of programmed cell death ligand 1
(PD-L1) or programmed cell death protein 1 (PD-1) may recover
immune cell cytotoxicity and also suppresses tumor progression
(6). Hence, the application of PD-L1
and PD-1 inhibitors appear to have a positive impact on the overall
survival (OS) of patients with advanced BLCA (7). Still, the immunotherapeutic efficiency
of these drugs varies among patients, where some patients can
achieve prolonged survival while others may show continuous tumor
progression (8). Therefore,
identifying novel prognostic genes that may predict patient
survival and sensitivity to immunotherapy is important so that
personalized treatments can be further implemented.
Previous studies, focused on the tumor
microenvironment (TME) associated with BCLA, have indicated that
the efficacy of certain immunotherapies is associated with host
immune response and the composition of infiltrated immune cells in
the TME (9,10). Indeed, a number of IRG signatures,
associated with prognosis of patients with MIBC, have been reported
(11). Although a number of genes
and mechanisms have been shown to be closely associated with the
immune response and prognosis of BLCA, a more comprehensive
overview of all potential immune-related genes (IRGs) and their
regulatory networks in BLCA is needed.
Upon analysis of The Cancer Genome Atlas (TCGA)
database, the present study investigated the immune landscape
associated with the transcriptome of patients with BLCA. Hence, the
differentially expressed IRGs and transcription factors (TFs)
associated with patients from high and low immune response groups
were compared. A putative prognostic model, mainly consisting of
nine IRGs and TFs, was constructed using a Least Absolute Shrinkage
and Selection Operator (LASSO) Cox regression model. According to
various statistical methods, the model was robust enough to predict
the OS of patients with BLCA. Additionally, a gene-based network
that could decipher the potential regulatory relationships between
TFs and IRGs was constructed. Finally, a small molecule inhibitor
named TW-37 was tested as a putative therapeutic drug for BLCA,
using T24 cells as an in vitro model.
Materials and methods
Normalization of gene expression data
and clinical information
Firstly, fragments per kilobase million (FPKM) data
of RNA-sequencing profiles from BLCA samples (n=433) were
downloaded from TCGA (https://portal.gdc.cancer.gov). Clinical information
of patients with BLCA (n=391) was downloaded from TCGA (https://portal.gdc.cancer.gov/). Case records
with unknown Tumor-Node-Metastasis stages or clinical stages were
excluded (n=35). Before data analysis, FPKM values were transformed
into transcripts per kilobase million (TPM) values using R software
3.6.3 (https://www.r-project.org).
Implementation of immune-related
hierarchy clustering
Immune, stromal and tumor purity scores, and
ESTIMATE scores were evaluated, based on normalized gene expression
data matrix, using the ESTIMATE R package (version 3.6.3) (12). IRGs, originated from respective tumor
tissues, were collected from the immunological signatures gene
dataset from the Molecular Signatures Database (MSIGDB) and
downloaded from the Broad Institute official website (https://www.gsea-msigdb.org/gsea/msigdb/collections).
The quantified scores of 29 IRG sets were acquired from published
signature gene lists across all BLCA samples using the
single-sample Gene Set Enrichment Analysis (ssGSEA) method
(13). The ssGSEA scores of each
individual IRG set were respectively obtained and normalized. The
quantified scores of each IRG set were grouped into high, medium
and low immune response group according to the ssGSEA scores. This
classification was performed using a hierarchical agglomerative
clustering method, based on Euclidean distance accessible on the
‘sparcl’ R package (14).
Estimative of the immune cell
proportions in the BLCA tumor microenvironment
The Cell Type Identification By Estimating Relative
(CIBERSORT) R package was utilized to assess the proportion of
tumor-infiltrating immune cells in the TME (15). BLCA gene expression profiles were
normalized using the limma-voom method (16) and transformed into an infiltrating
proportion of 22 immune cells. The relative proportions of these 22
immune cells for each sample was determined. Significant results
with P<0.05 were selected for further analyses.
Differentially expressed genes (DEGs)
from distinct immune response groups
The R package ‘limma’ was used to identify DEGs in
the low versus high immune response BLCA groups, the empirical
Bayesian approach was implemented to evaluate changes on gene
expression (17). Genes with
P<0.05 and a |log2 fold-change (FC) value|>1.0 were defined
as DEGs. The list of IRGs was retrieved from the Immunology
Database and Analysis Portal (ImmPort, http://immport.niaid.nih.gov) (18). Among the 2,498 IRGs retrieved from
the ImmPort database, 401 differentially expressed IRGs were
identified using a cut-off of |log2FC|>1.0 and adjusted
P<0.05. Tumor-related TFs were obtained from the Cistrome
project (http://cistrome.org/CistromeCancer/) for further
analysis (19).
Gene Ontology (GO) and Kyoto
Encyclopedia of Genes and Genomes (KEGG) pathway enrichment
analyses
The R package ‘clusterProfiler’ was used to
implement GO and KEGG evaluation as well as the Gene Set Enrichment
Analysis (GSEA) (20). The GSVA R
package was also used to perform the Gene Set Variation Analysis
(GSVA) among the tumor samples with changes on evaluated pathway
activity, upon comparing high versus low immune response groups
(13). The P<0.05 and
|log2FC|>0.20 was set as the cut-off threshold for the
comparative analysis of the activated or suppressed signaling
pathways.
Establishment of a prognostic gene
signature using LASSO Cox regression modeling
Genes from the ‘immunological signatures gene set’,
which was retrieved from the MSIGDB were selected as potential
prognostic biomarkers. For this, DEG analysis was performed by
comparing high versus low immune response groups to narrow down the
screening scope. Univariate and multivariate Cox regression
analyses were performed to build an appropriate prognostic
signature for BLCA samples, based on the differentially expressed
IRGs. The risk score of the prognostic immune gene model was
calculated, for each patient tumor, according to the relative
expression of each individual gene and its associated coefficient.
The calculation formula was the following: Risk score =
∑i=1n(coefi×Expri),
where: ‘Expri’ represents the expression
value of each specific IRG in the model of patient ‘I’,
‘coefi’ is the coefficient of gene ‘I’ obtained via
multivariate Cox regression analysis.
Prediction ability of the prognostic
gene signature
According to the patient clinical data obtained from
TCGA database (n=391), patients with BLCA were classified in low-
and high-risk groups, as determined by the risk scores, which were
generated using our IRG based prognostic model. Thereafter, a
time-dependent receiver operating characteristic (ROC) curve was
used to assess the sensitivity and specificity of the model. In
order to evaluate the prediction accuracy of the model, the area
under the curve (AUC) for 1-, 3- and 5-year OS was further
assessed, according to the ‘survival ROC’ R package (21).
Independence of the TF and IRG-based
prognostic model
To determine whether our prognostic model was
significantly distinct from standard clinical characteristics, all
patient details featured on the TCGA-BLCA dataset, including age,
sex, pathological tumor stage, histological subtype and TNM stage,
were assessed. Patients were divided according to their age (≤ and
≥65 years). Patient subgroups were generated according to sex, I–IV
pathological tumor stage, N0 and N1-3 stage, pathological T0-T2 and
T3-4 stage. Low and high-risk subgroups were defined according to
the mean risk score of OS assessed by the COX regression model for
each patient. Forest plots were used to illustrate the hazard ratio
(HR) of each subgroup.
TF binding site prediction and
correlation analysis between IRGs and TFs
Boxplots were constructed to show the relationship
between risk score and the distinct immune response subgroups.
Heatmaps were constructed according to the expression of IRGs from
each respective group (low, median and high immune response). Dot
plots and corresponding fit curves were used to illustrate the
correlation between model-related immune genes and prognostic
transcription factors. According to the expression values of each
IRG from the prognostic model and respective TFs, Pearson's
correlation coefficient analysis was performed. The TF binding
motifs (TFBMs) of related TFs, as well as the TF binding sites of
related target genes, were identified using the JASPAR 2020
database (22).
Correlation analysis between TFs and
drug sensitivity
Data were extracted from the Genomics of Drug
Sensitivity of Cancer database (GDSC; http://www.cancerrxgene.org), in which numerous
anticancer drugs were screened using various cancer cell lineages
to determine their sensitivity. Gene expression profiles in 990
cancer cell lines and a drug screening IC50 dataset, covering 265
compounds across 19 BLCA cell lines, was downloaded from the GDSC
database. The Pearson's correlation values between the gene
expressions of prognostic TFs and IC50 values of each compound was
investigated.
Reagents and kits
The small molecule inhibitor TW-37 (MCE; category
no. HY-12020) was purchased from MedChemExpress and stored as 10 mM
solution using DMSO as a solvent. Primary antibodies were against
FOSL1 (Cell Signaling Technology, Inc; cat. no. 5281) and GAPDH
(Wanlei Bio, http://www.wanleibio.cn; cat. no.
WL01114) were diluted 1,000 times using Tris-HCL buffer solution
(cat. no. WLA098, Wanlei Bio, http://www.wanleibio.cn). Secondary antibodies were
anti-rabbit and anti-mouse IgGs (Cell Signaling Technology, Inc;
cat. nos. 7074 and 7076) were diluted 3,000 times using Tris-HCL
buffer solution. Negative control fluorescein (FAM) and FOSL1
siRNAs were designed by Shanghai GenePharma Co., Ltd.
Cell culture and viability
analysis
T24 bladder cancer cells were obtained from The Cell
Bank of Type Culture Collection of The Chinese Academy of Sciences.
Cells were cultured using Dulbecco's modified Eagle medium (DMEM)
supplemented with 10% fetal bovine serum (FBS) (both Gibco; Thermo
Fisher Scientific, Inc.) and incubated at 37°C in an atmosphere of
5% CO2. Cell viability was assessed using an MTS Assay
kit (cat. no. ab197010; Abcam). Absorbance at a wavelength of 450
nm was measured using a BioTek ELISA reader.
Immunoblotting
T24 cells were collected from 12-well plates and
lysed with RIPA buffer (Cell Signaling Technology, Inc.) for 20
mins at 4°C. Whole cell lysates were then centrifuged at 12,000 × g
at 4°C for 15 mins, and respective supernatants were denatured at
100°C for 15 mins after addition of loading buffer. Protein samples
were quantified by protein electrophoresis method, using the
SDS-PAGE kit (cat. no. WLA013, Wanlei Bio, http://www.wanleibio.cn). The bicinchoninic acid
method was used to determine the protein content in each sample.
Protein (50 ug/lane) were separated via 12% SDS-PAGE. The separated
proteins were subsequently transferred onto nitrocellulose
membranes (EMD Millipore) and blocked with 20% skimmed milk tris
buffered saline (TBS) for 30 min at room temperature. The membranes
were incubated with primary antibodies at 4°C for 8 h.
Subsequently, the nitrocellulose membranes were washed with
Tris-Hcl solution for 10 min, and ECL chemiluminescent substrate
(Yeasen, Shanghai, China, http://www.yeasen.com) was used to visualize the
protein bands.
Transfection protocol
In total, ~10,000 T24 cells were seeded into each
well of the 12-well plate, and incubated with 10% fetal bovine
serum in DMEM for 24 h. After removing the cell culturing medium,
300 ng siRNAs with 3 µl Lipofectamine® 2000 (Invitrogen;
Thermo Fisher Scientific, Inc.) in 250 µl DMEM as the transfection
mixture was added to each well. The transfection mixture and extra
250 µl DMEM were added into each well of the 12-well plate. The
gene sequence of negative control siRNA was:
5′-UUCUUCGAACGUGUCACGUTT-3′, the gene sequence of FOSL1 targeted
siRNA was: 5′-UUAUGAAUGAAAAGUUCUCGG-3′. After incubation at room
temperature for 20 min, 500 µl pre-warmed 20% fetal bovine serum
DMEM was added per well. After cultivating the transfected T24
cells at 37°C for 48 h, cells were collected for detection of the
silencing efficiency.
Statistical analysis
Statistical analyses and data visualization were
performed using GraphPad Prism 8.0 or R software 3.6.3. P<0.05
was considered to indicate a statistically significant difference.
The Kruskal-Wallis followed by Dunn's or the Mann-Whitney U tests
were performed to determine the significance of the median value
between different groups. The two-tailed unpaired Student's t-test
was applied to define the significance when comparing mean values
of two unpaired groups with different characteristics. ANOVA and
Tukey's post hoc test was used to analyze data with more than two
groups. Kaplan-Meier survival curves were plotted to illustrate the
distinct OS between the groups. A log-rank test was used to
determine the statistical significance between survival curves.
Each in vitro assay was performed three times and data are
presented as the mean ± standard deviations.. For the cell
viability assays, the two-tailed unpaired Student's t-test was used
to compare differences between two groups.
Results
Immune response phenotype and
enrichment score landscape of the TME from BLCA samples
Infiltrated immune cells in the TME control a series
of immune-related processes that can frequently lead to antitumor
activities (23). The ssGSEA of the
BLCA gene expression data revealed quantified enrichment scores of
the immunological signature gene set (obtained from the MSIGDB)
that corresponded to 29 IRG subsets. Enrichment scores of the
identified normalized gene set were higher for genes related to i)
associate dendritic cells (aDCs), ii) antigen-presenting cells
(APC) co-inhibition, iii) APC co-stimulation, iv) B cells, v) CCR,
vi) CD8+ T Cells, vii) immune check-point, viii)
cytolytic activity, ix) DCs (dendritic cells), x) HLA genes, xi)
interdigitating (i) DCs, xii) inflammation-promoting, xiii)
macrophages, xiv) masT Cells, xv) MHC class I, xvi) neutrophils,
xvii) natural killer (NK) cells, xviii) para-inflammation, xix)
pDCs, xx) T Cell co-inhibition, xxi) T Cell co-stimulation, xxii) T
follicular helper cells (Tfh), xxiii) T helper 1 (Th1) cells, xxiv)
Th2 cells, xxv) TIL, xxvi) Treg cells, xxvii) type I IFN response
and xxviii) type II IFN response (Fig.
1E). According to the ssGSEA enrichment scores, BLCA samples
were divided into high (154 samples), median (168 samples) and low
(92 samples) immune response subgroups. Furthermore, the stromal,
immune and ESTIMATE scores were calculated as well as the tumor
purity of 414 BLCA samples. The violin plot indicated that BLCA
samples clustered in the low immune response subgroup had the
highest tumor purity but lower stromal, immune and ESTIMATE scores
compared with those included into the medium or high immune
response subgroups (Fig. 1A-D). The
enrichment scores of each IRG set were also lower in the low immune
response group when compared with the high immune response group
(Fig. 1E). The BLCA samples were
classified into three subgroups for further investigation using the
ssGSEA method, and the clinical characteristics of patients with
bladder cancer from TCGA database are listed in Table I.
 | Figure 1.Quantified assessment scores of tumor
purity, stromal cell percentage, immune cell percentage and IRG
sets of BLCA samples. (A-D) Violin plots of the (A) tumor purity
scores, (B) stromal scores, (C) immune scores and (D) ESTIMATE
scores among the low, medium and high immune response groups.
Differences between the two groups were compared using the
Kruskal-Wallis test followed by the Dunn's post hoc test. (E)
Landscape of quantified scores of each IRG subset in BLCA samples.
***P<0.001. BLCA, bladder cancer; DCs, dendritic cells; Th, T
helper; pDCs; TIL; APC, antigen presenting cell; aDCs; Treg,
regulatory T Cell; iDCs; NK, natural killer; IRG, immune-related
gene. |
 | Table I.Clinical characteristics of 391
patients (239 alive and 152 dead) with bladder cancer acquired from
The Cancer Genome Atlas database. |
Table I.
Clinical characteristics of 391
patients (239 alive and 152 dead) with bladder cancer acquired from
The Cancer Genome Atlas database.
|
| Patient status |
|
|---|
|
|
|
|
|---|
| Variable | Alive, n (%) | Dead, n (%) | Overall |
|---|
| Sex |
|
|
|
|
Female | 58 (24.3) | 42 (27.6) | 100 (25.6) |
|
Male | 181 (75.7) | 110 (72.4) | 291 (74.4) |
| Age, years |
|
|
|
|
≥65 | 131 (53.0) | 116 (47.0) | 247 (63.2) |
|
<65 | 108 (75.0) | 36 (25.0) | 144 (36.8) |
| Grade |
|
|
|
|
High | 216 (90.4) | 152 (100) | 368 (94.1) |
|
Low | 21 (8.8) | 0 (0) | 21 (5.4) |
|
Unknown | 2 (0.8) | 0 (0) | 2 (0.5) |
| Clinical Stage |
|
|
|
| I | 2 (0.8) | 0 (0) | 2 (0.5) |
| II | 98 (41.0) | 26 (17.1) | 124 (31.7) |
|
III | 85 (35.6) | 47 (30.9) | 132 (33.8) |
| IV | 54 (22.6) | 78 (51.3) | 132 (33.8) |
|
Unknown | 0 (0) | 1 (0.7) | 1 (0.3) |
| T stage |
|
|
|
| 0 | 1 (0.4) | 0 (0) | 1 (0.3) |
| 1 | 3 (1.3) | 0 (0) | 3 (0.8) |
| 2 | 30 (12.6) | 8 (5.3) | 38 (9.7) |
| 2a | 21 (8.8) | 2 (1.3) | 23 (5.9) |
| 2b | 35 (14.6) | 17 (11.2) | 52 (13.3) |
| 3 | 27 (11.3) | 13 (8.6) | 40 (10.2) |
| 3a | 36 (15.1) | 32 (21.1) | 68 (17.4) |
| 3b | 37 (15.5) | 41 (27.0) | 78 (19.9) |
| 4 | 5 (2.1) | 6 (3.9) | 11 (2.8) |
| 4a | 23 (9.6) | 18 (11.0) | 41 (10.5) |
| 4b | 1 (0.4) | 3 (2.0) | 4 (1.0) |
|
Unknown | 20 (8.4) | 11 (7.2) | 31 (7.9) |
| X | 0 (0) | 1 (0.7) | 1 (0.3) |
| N stage |
|
|
|
| 0 | 165 (69.0) | 60 (39.5) | 225 (57.5) |
| 1 | 20 (8.4) | 24 (15.8) | 44 (11.3) |
| 2 | 29 (12.1) | 45 (29.6) | 74 (18.9) |
| 3 | 3 (1.3) | 5 (3.3) | 8 (2.0) |
| X | 19 (7.9) | 16 (10.5) | 35 (9.0) |
|
Unknown | 3 (1.3) | 2 (1.3) | 5 (1.3) |
| M stage |
|
|
|
| 0 | 125 (52.3) | 59 (38.8) | 184 (47.1) |
| 1 | 4 (1.7) | 6 (3.9) | 10 (2.6) |
| X | 109 (45.6) | 86 (56.6) | 195 (49.9) |
|
Unknown | 1 (0.4) | 1 (0.7) | 2 (0.5) |
Enrichment scores of gene subsets
related to CD8+ T Cells may predict BLCA prognosis
The clinical data of patients with BLCA and their
corresponding immunological signatures were combined. Kaplan-Meier
survival analysis was performed to further search potential
prognostic factors that could show that the survival curve of the
high immune response group had a trend toward improved prognosis
compared with the low immune response group. However, these changes
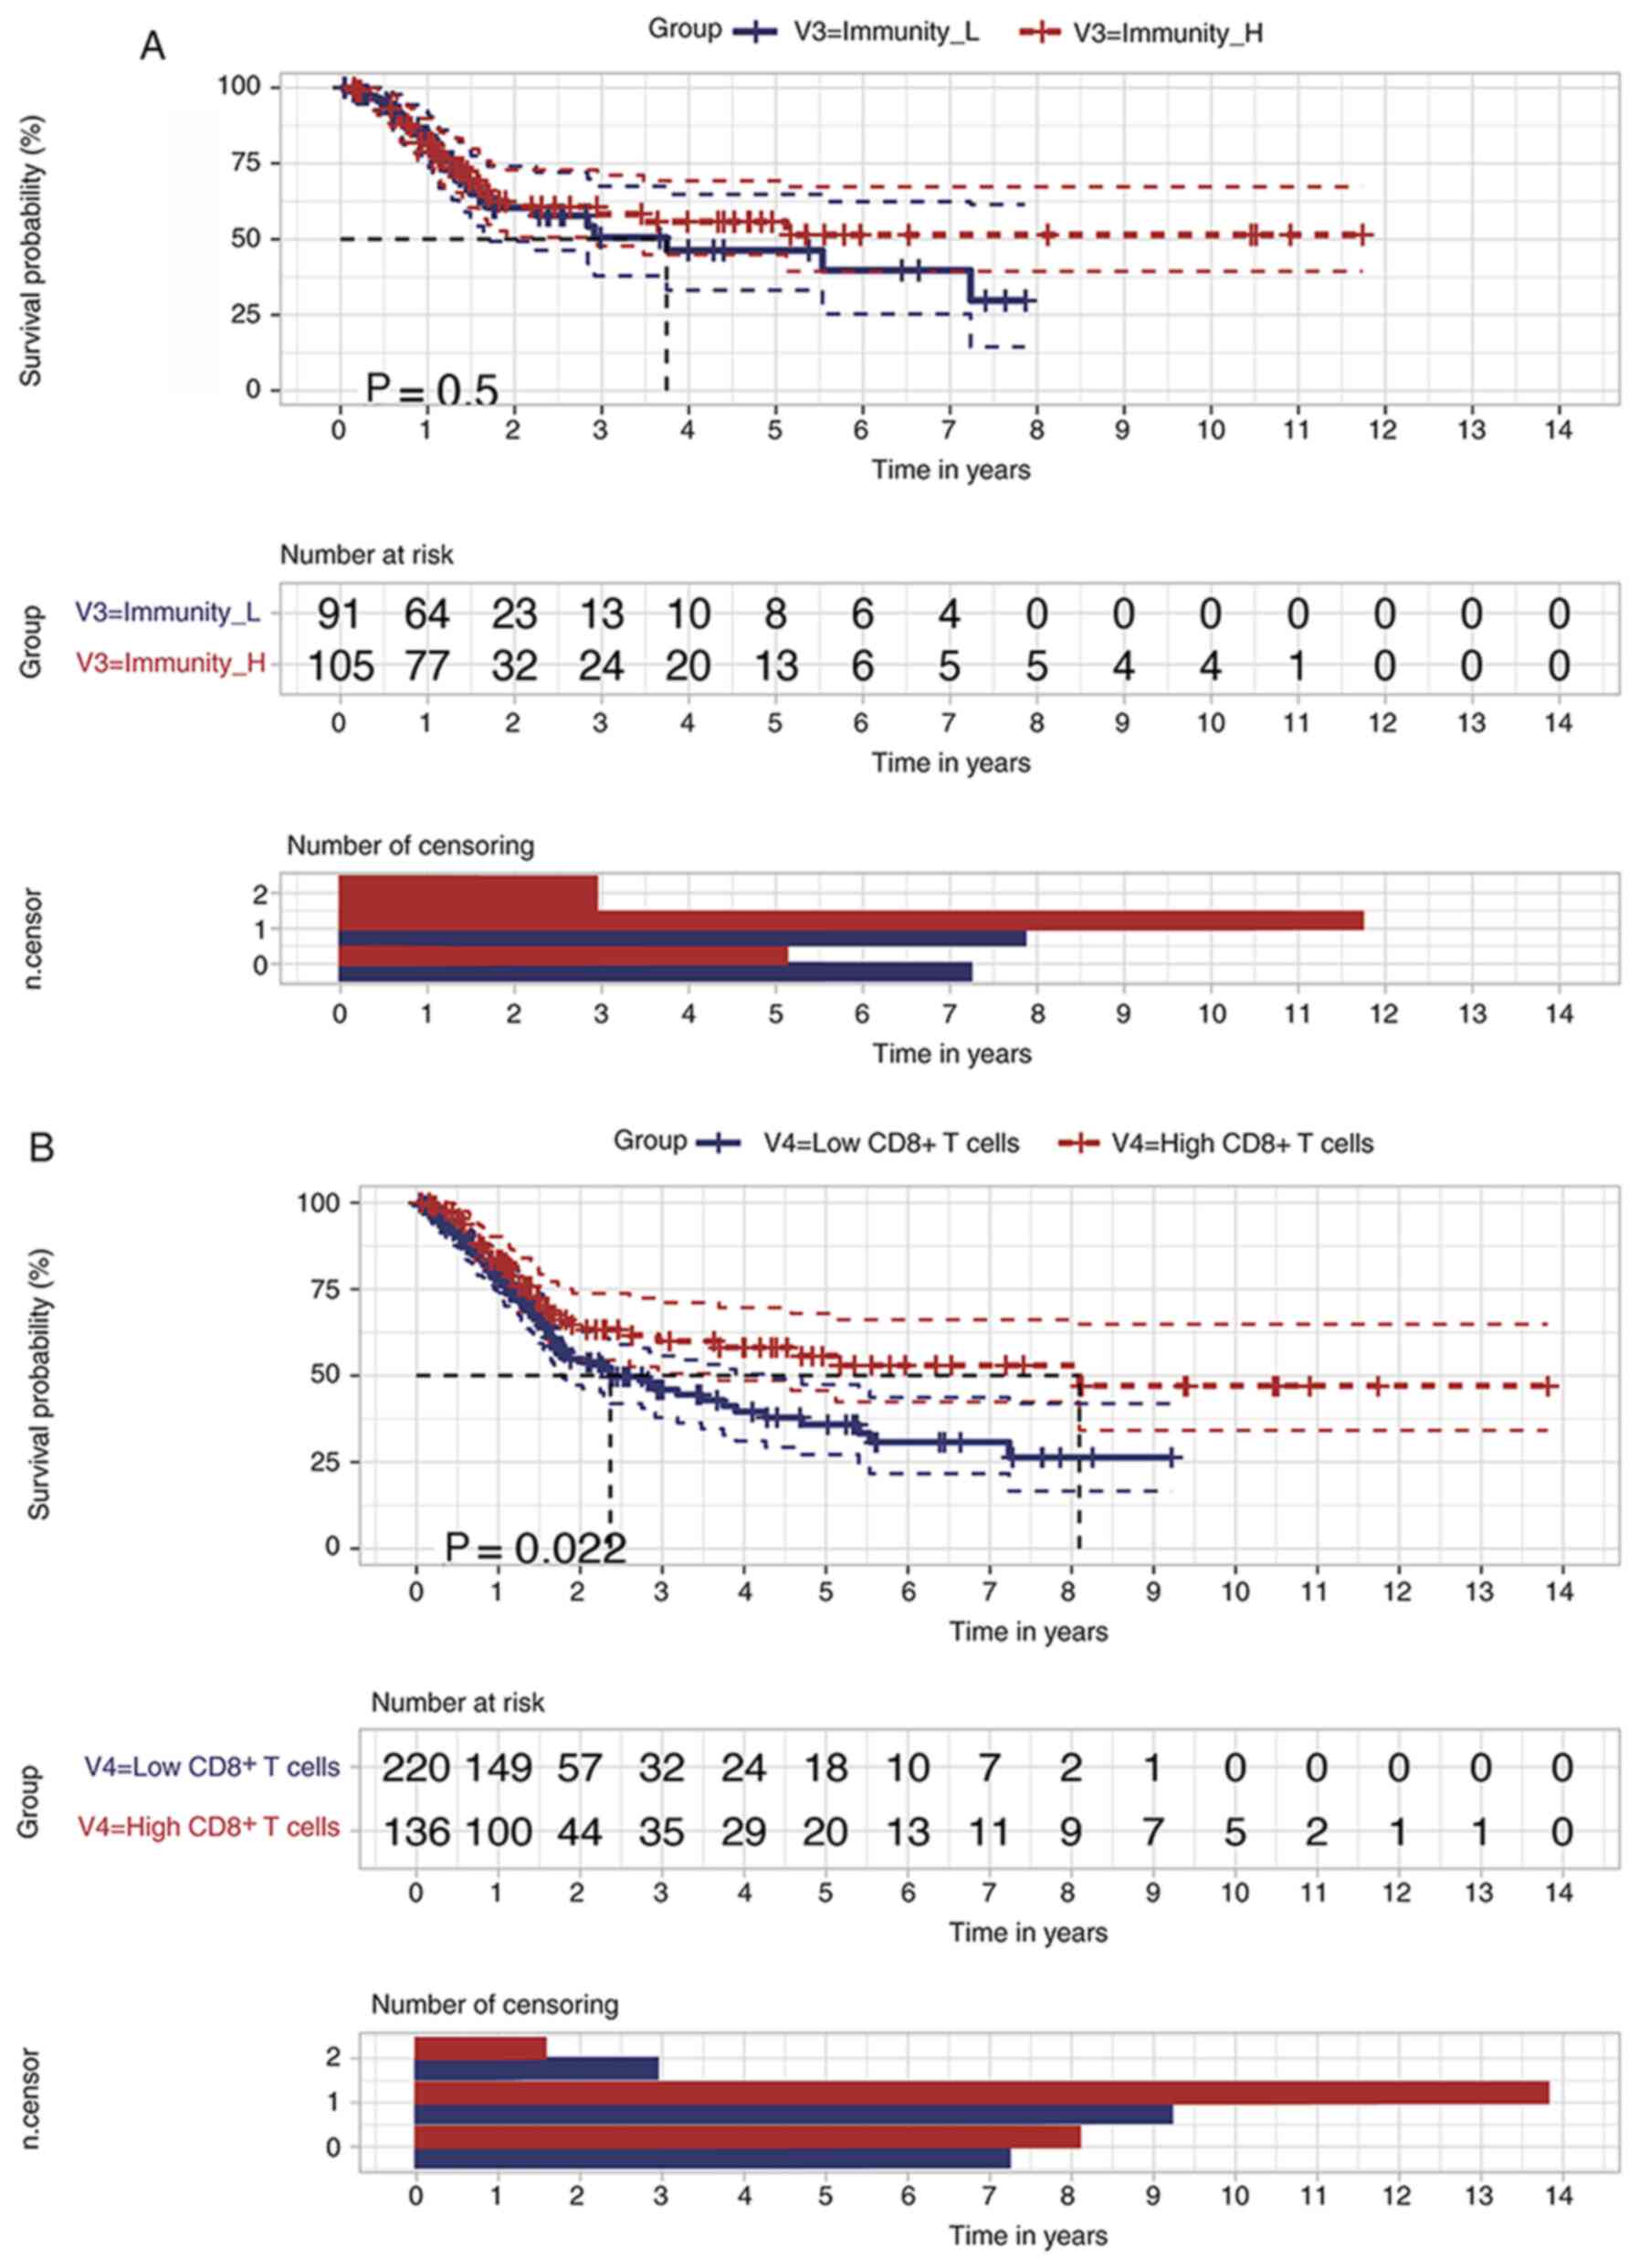
were not statistically significant (P=0.50; Fig. 2A). Moreover, it was verified that
higher enrichment scores (scores ≥ mean values) of CD8+
T Cell-related genes predicted an improved BLCA prognosis (Fig. 2B). The 5-year survival rate of the
low score CD8+ T Cell group was 35.9±5.09%, with a 95%
confidential interval from 0.272 to 0.474, while the rate was
55.8±5.65%, with a 95% confidential interval from 0.457 to 0.680,
in the high-score CD8+ T Cell group (P=0.022). Thus, the
increased infiltration rate of CD8+ T Cells may benefit
the long-term OS of patients with BLCA.
Landscape of immune cell infiltration
in the BLCA microenvironment
In order to estimate the immune cell infiltration in
each individual BLCA sample, the ‘CIBERSORT’ R package was applied
to the BLCA-specific gene expression profile data matrix. We found
22 types of infiltrated immune cells were identified (Fig. 3A). A higher abundance of resting DCs
and M2 macrophages was observed in the high immune response group
compared with the low response group. At the same time, activated
DCs and naive CD4+ T Cells were decreased in the high
immune response group (Fig. 3B). In
order to validate the prognostic effect of the amount of
CD8+ T Cell infiltration in patients with BLCA,
Kaplan-Meier curves and log-rank tests were implemented according
to the CIBERSORT results (Fig. 3C).
Although the changes were not statistically significant (P=0.061),
there was a trend toward an improved BLCA prognosis in the high
CD8+ T Cell infiltration group compared with the low
infiltration group. The 5-year survival rate of the low
CD8+ T Cell infiltration group was 35.6±8.16%, with a
95% confidential interval from 0.227 to 0.558, while the rate was
58.4±7.03%, with a 95% confidential interval from 0.461 to 0.739,
in the high infiltration group. Thus, according to the results of
ssGSEA and CIBERSORT analyses, higher infiltration of
CD8+ T Cells in the TME can improve the OS of patients
with BLCA.
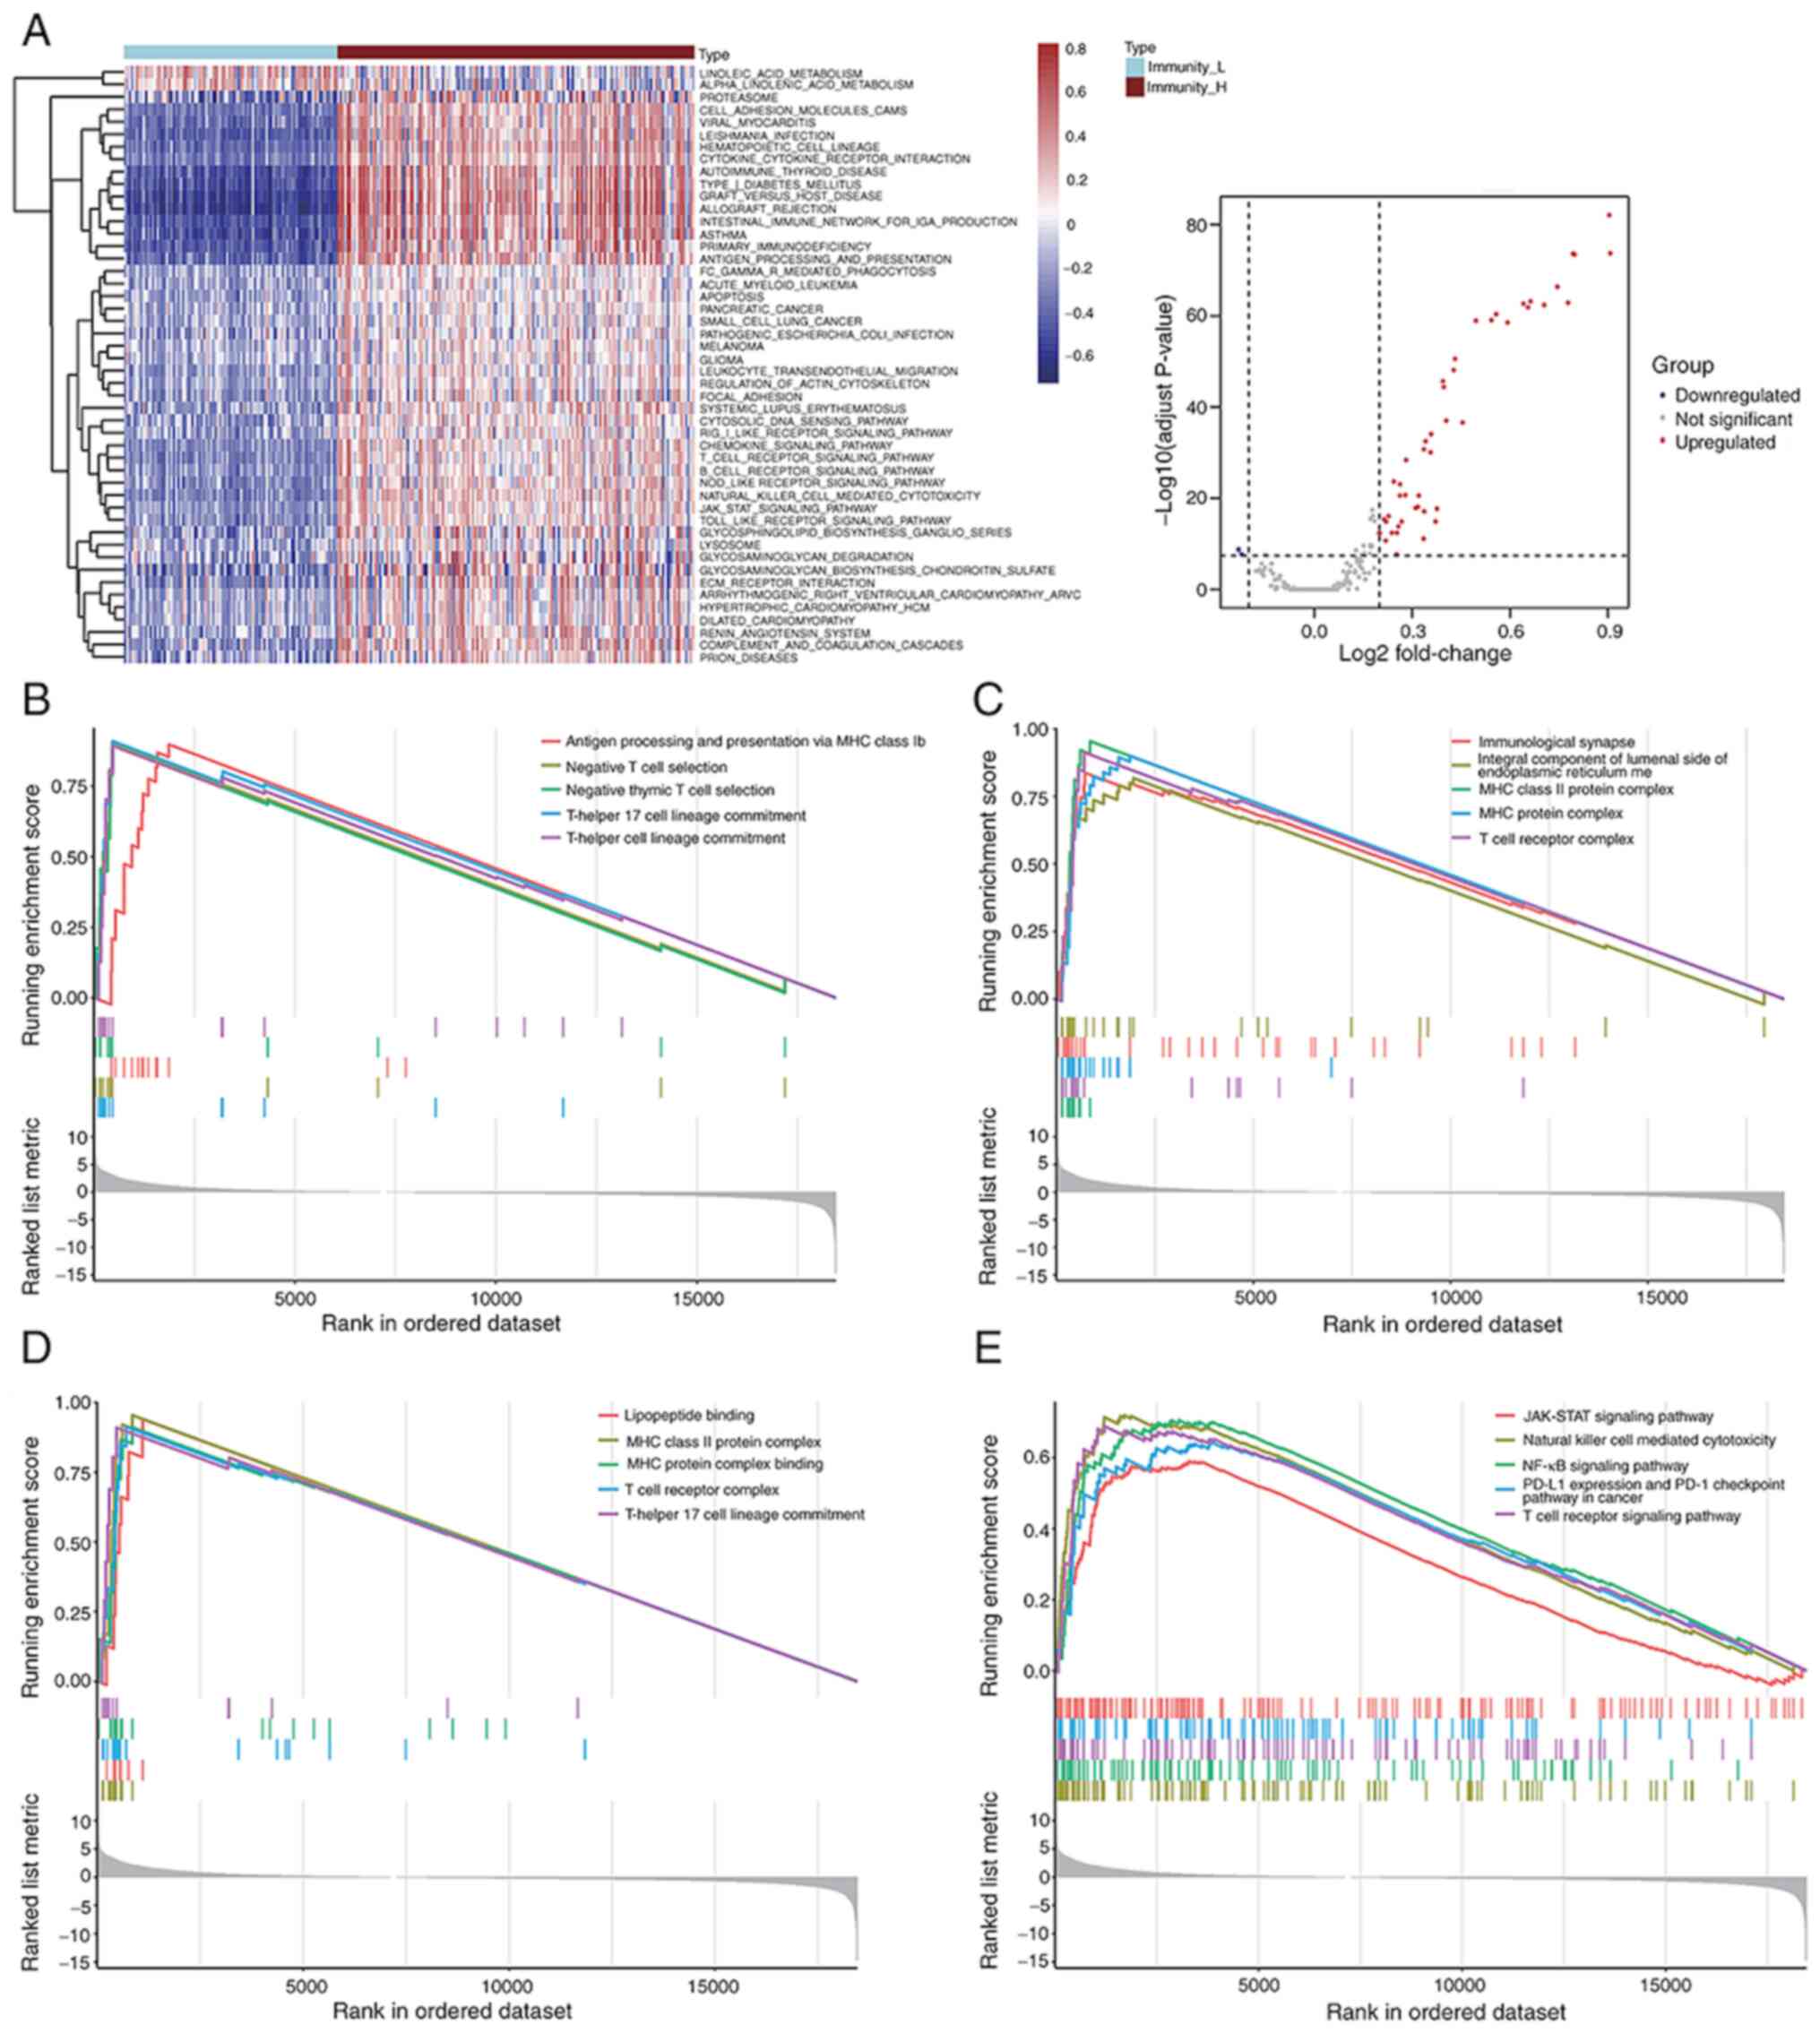
Assessment of signaling pathway
activities in low and high immune response groups
To evaluate the distinct signaling pathway
activities between the low and high immune response groups, a GSVA
of hallmark gene sets was implemented based on the gene expression
profiles of BLCA samples. Based on this comparative analysis, it
was demonstrated that there were 46 activated signaling pathways in
high immune response group. Both a volcano plot and heatmap were
constructed to show the landscape of most activated and/or
suppressed signaling pathways (Fig.
4A). In addition, biological process, cellular component,
molecular function and KEGG enrichment analysis were performed
using the GSEA approach. This analysis was performed according to
gene expression profile of identified IRG sets that were positively
enriched in the high immune response group (Fig. 4B-E). In the high immune response
group, immune related signaling pathways, including JAK-STAT, NF-κB
and PD-L1 expression, and PD-1 checkpoint pathway in cancer,
antigen processing and presentation via MHC class Ib, and T Cell
receptor signaling pathway were enriched according to GO and KEGG
enrichment analyses.
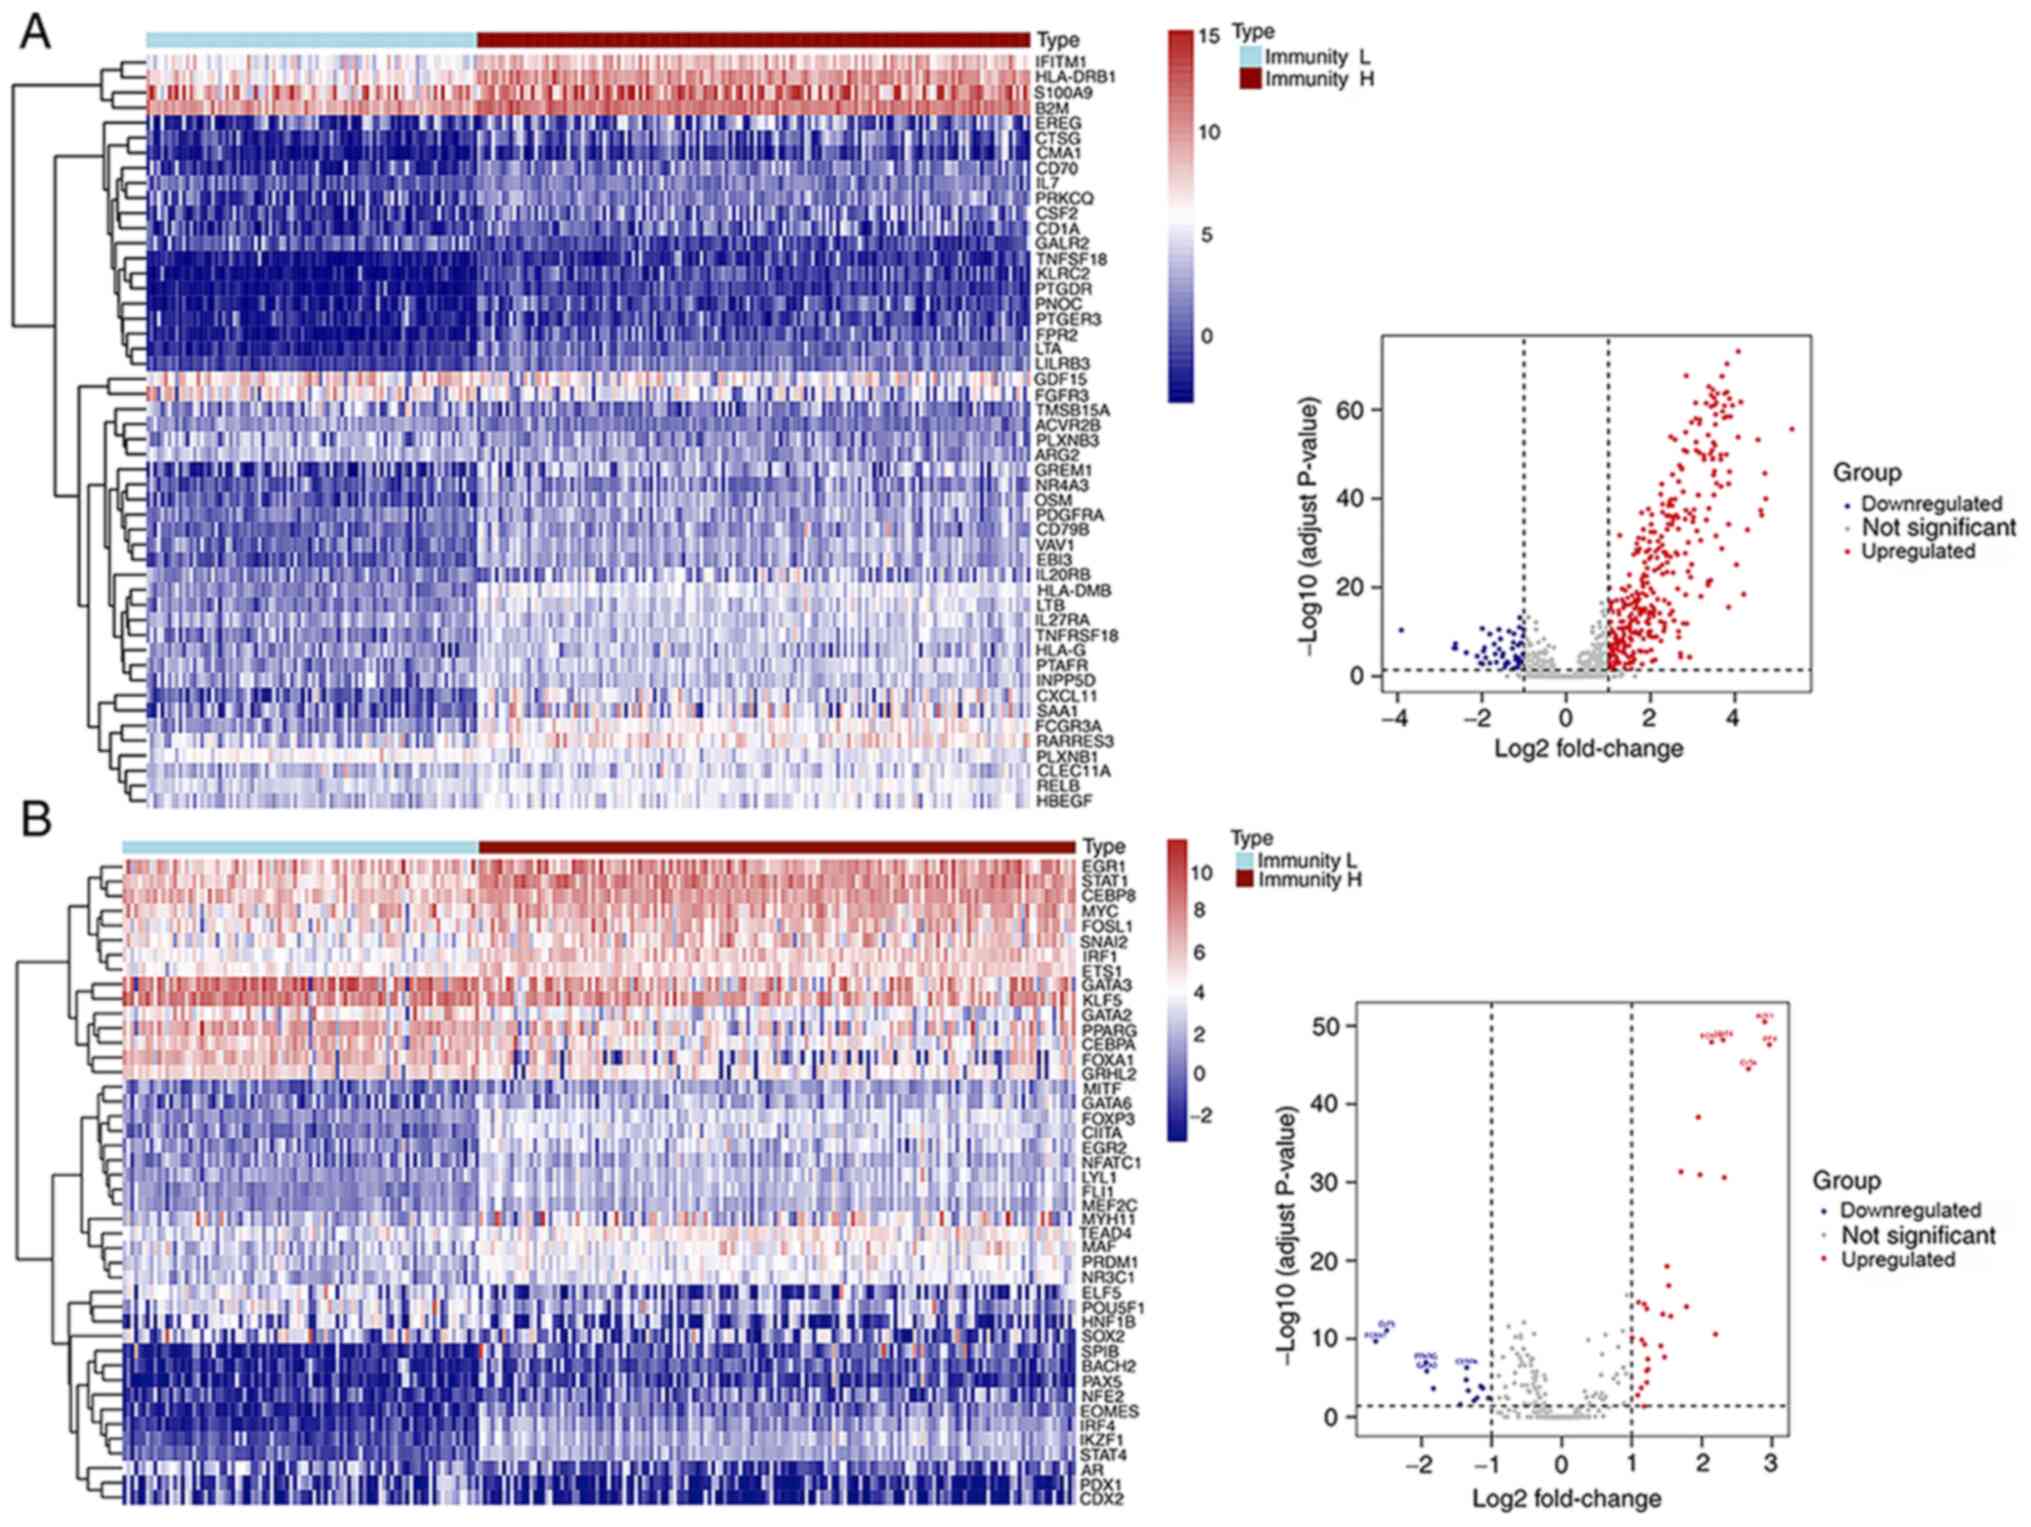
Differentially expressed tumor-related
IRGs and TFs in low and high immune response groups
Among the 2,498 IRGs retrieved from the ImmPort
database, 50 downregulated and 351 upregulated genes, were
identified as the differential expressed IRGs. A heatmap was
designed to illustrate the expression level of 50 random
immune-related DEGs, while a volcano plot shows the whole content
of immune-related DEGs identified (n=401) (Fig. 5A). The top 20 most significant
immune-related DEGs, identified in the comparison between low and
high immune response groups, are listed in Table II. Moreover, 318 tumor-related TFs
were obtained from the Cistrome database. In total, 44
differentially expressed TFs were detected, of which 14 were
downregulated and 30 were upregulated in the high immune response
group. A heatmap and a volcano plot were designed to illustrate the
expression landscape of differentially expressed TFs by comparing
the low and high immune response groups (Fig. 5B).
| Table II.Top 10 differentially expressed
immune-related genes. |
Table II.
Top 10 differentially expressed
immune-related genes.
| Gene ID | logFC | Average
expression | P-value | Adjusted
P-value |
|---|
| CRH | −3.909 | 0.3965 |
3.82×10⁻¹⁴ |
4.01×10⁻¹¹ |
| FAM3B | −2.658 | 2.9128 |
4.70×10⁻¹⁰ |
4.49×10−07 |
| FAM3D | −2.626 | 1.7495 |
4.59×10⁻¹¹ |
4.51×10−08 |
| BMP3 | −2.670 | 1.6009 |
5.20×10⁻¹⁰ |
4.96×10−07 |
| CHP2 | −2.370 | 1.0492 |
5.19×10⁻⁹ |
4.80×10−06 |
| IDO1 | 4.6126 | 3.1194 |
3.63×10−41 |
4.48×10−38 |
| CCL18 | 4.6353 | 3.8358 |
4.51×10−40 |
5.54×10−37 |
| CXCL10 | 4.7112 | 5.5732 |
1.64×10−49 |
2.06×10−46 |
| CXCL13 | 4.7314 | 3.5218 |
8.75×10−44 |
1.09×10−40 |
| CXCL9 | 5.3525 | 4.2464 |
1.84×10−59 |
2.36×10−56 |
Construction of a BLCA prognostic
model based on differential expressed IRGs and TFs
In order to identify the potential associations
between immune-related DEGs, differentially expressed TFs and BLCA
prognosis, univariate Cox regression analysis was implemented based
on gene expression and clinical information. Results from this
regression analysis indicated that 54 IRGs were associated with the
OS of patients with BLCA. Moreover, the HR values of five distinct
genes, including microtubule-associated protein tau (MAPT),
prostaglandin E2 receptor EP3 subtype (PTGER3), β nerve growth
factor, IL31RA and proepiregulin (EREG), were >1, while 49
prognosis-associated immune genes had HR values <1. Moreover,
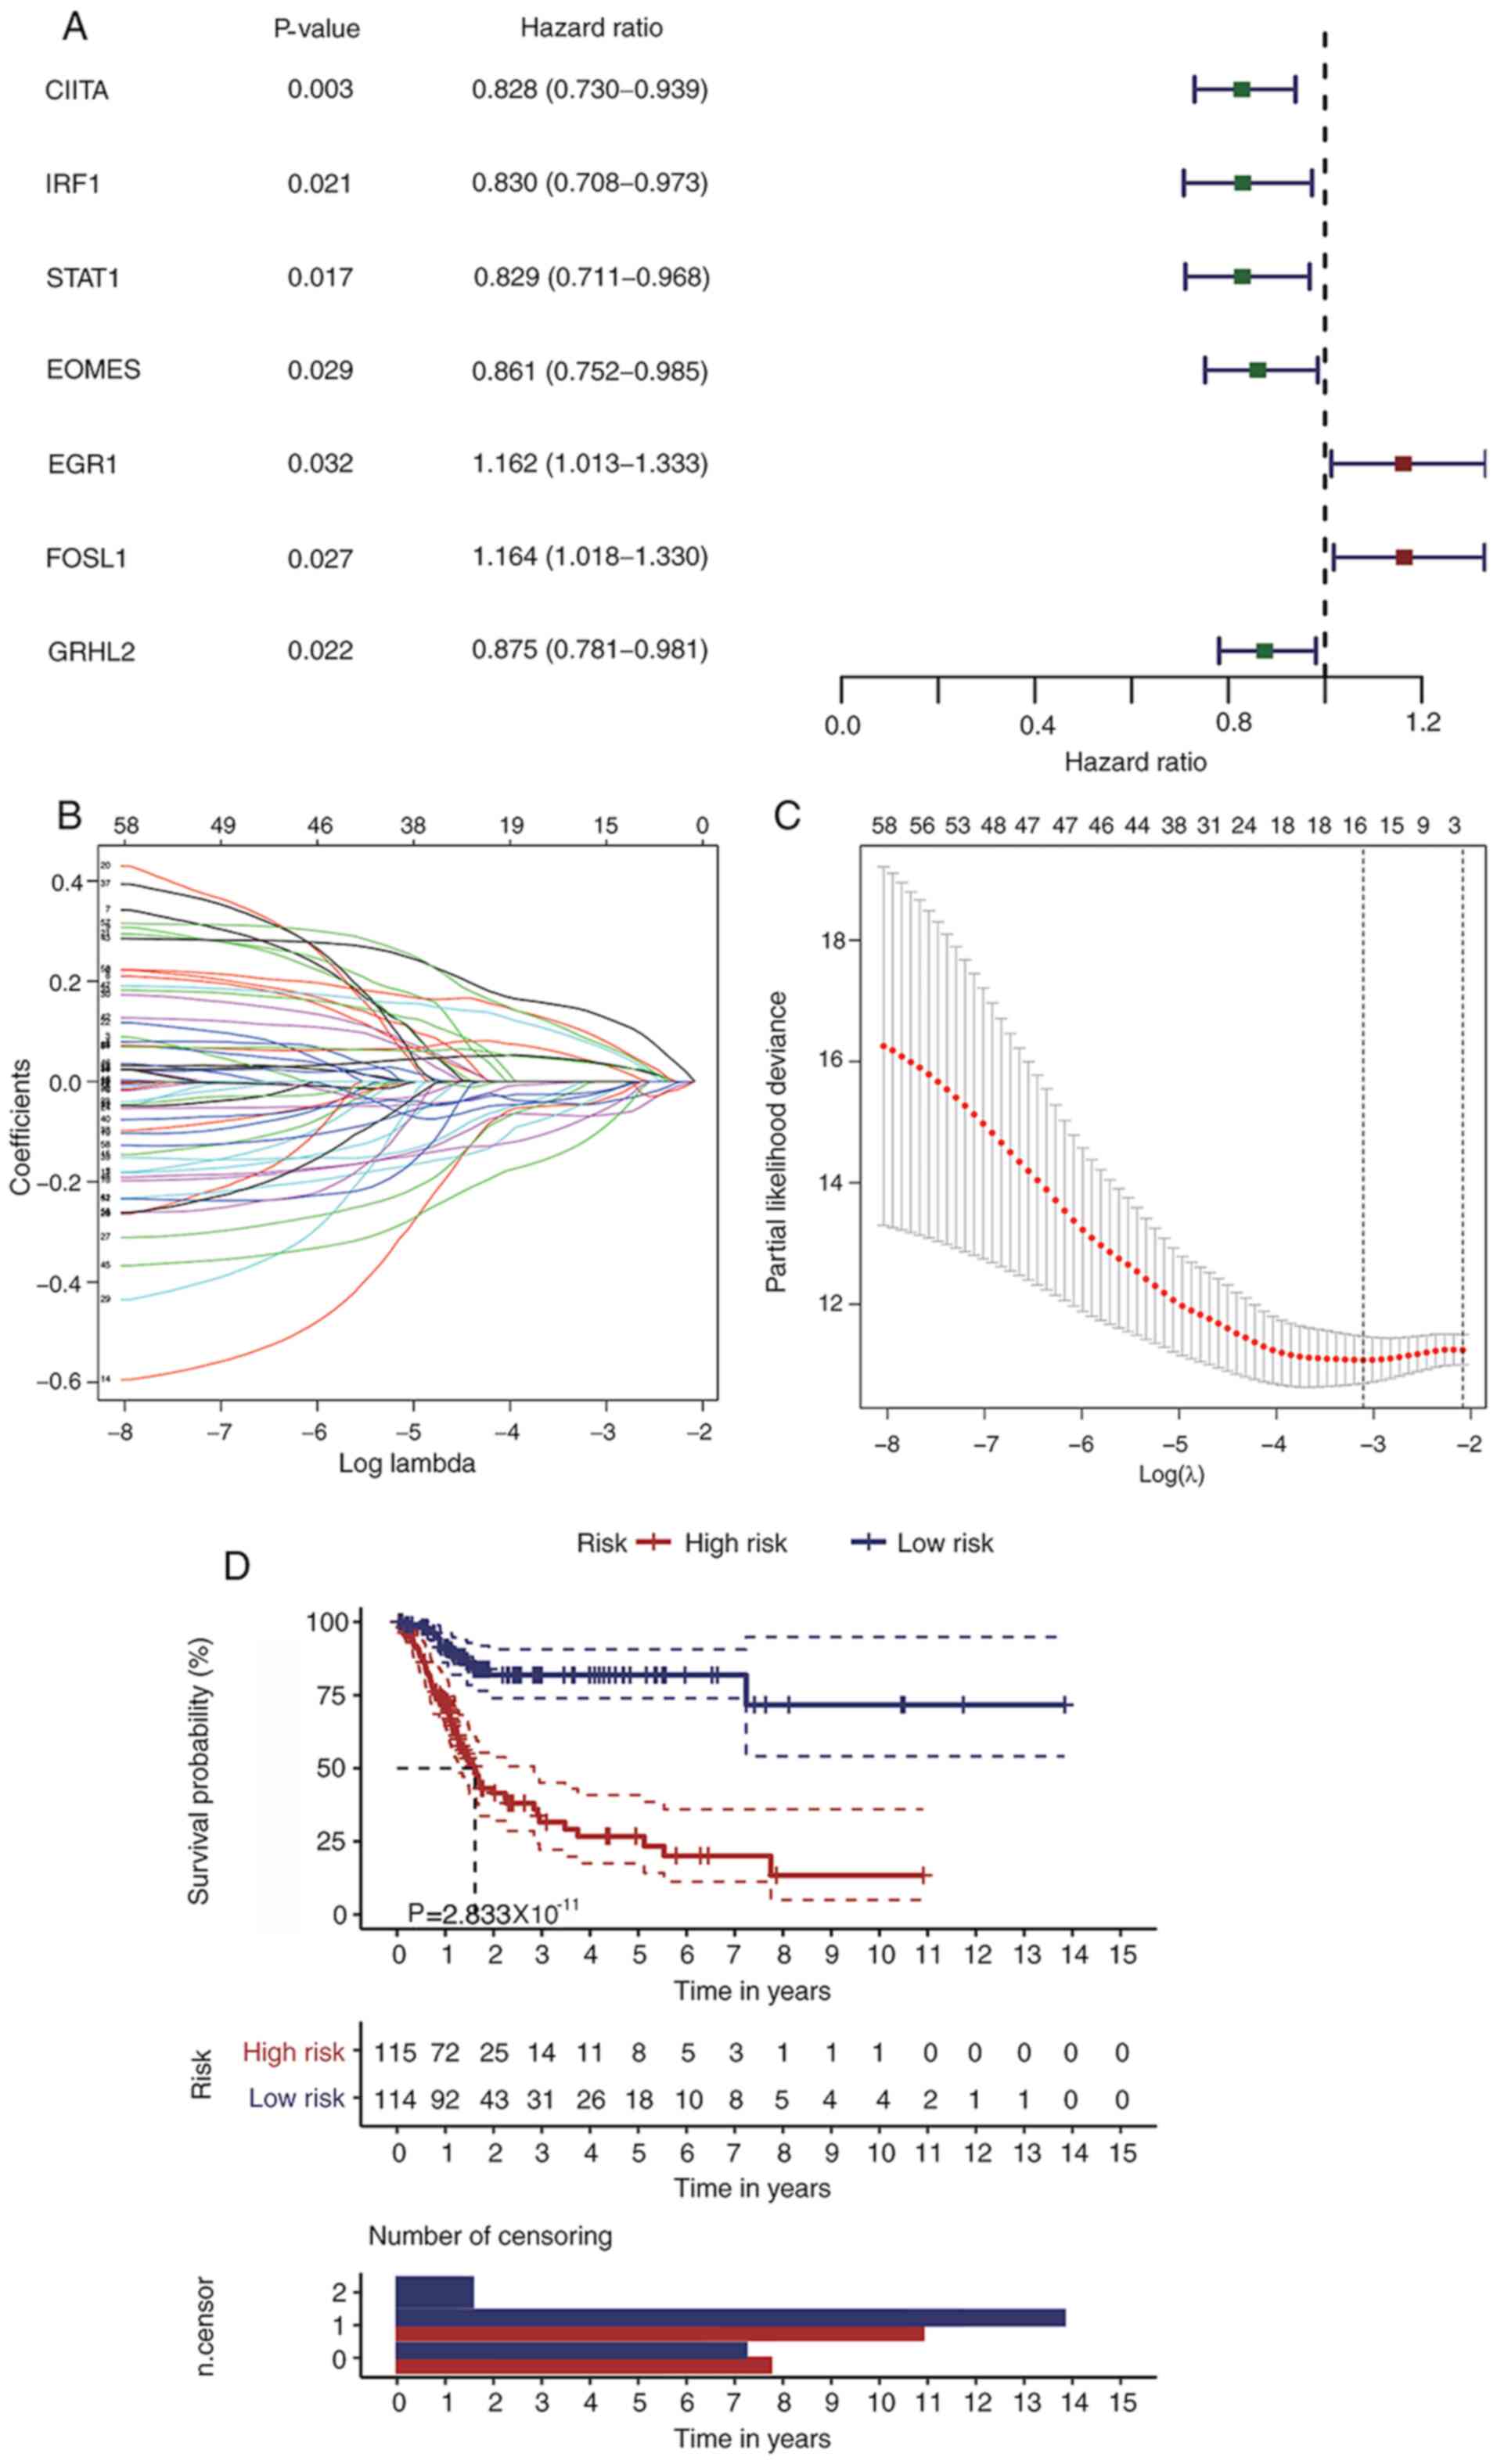
seven TFs were identified as putative prognostic factors (Fig. 6A). The LASSO method was applied to
further streamline potential prognostic genes originated from the
univariate Cox regression analysis. Hence, 15 genes were selected
with an optimal penalty parameter log (λ) value=−3 (Fig. 6B and C). Thereafter, a multivariate
Cox regression model was established based on the gene expression
value of the candidate genes (n=15). As a result, an immune-related
signature composed of nine candidate genes, was defined for the OS
prediction of patients with BLCA. The risk score of this prognostic
model was calculated as the following: Risk Score=CXCL13 expression
× (−0.128) + prepronociceptin expression × (−0.129) + MAPT
expression × (0.248) + major histocompatibility class (MHC) I
polypeptide-related sequence B (MICB) expression × (−0.268) +
PTGER3 expression × (0.192) + IL20RA expression × (−0.186) + EREG
expression × (0.0734) + early growth response protein 1 (EGR1)
expression × (0.162) + FOSL1 expression × (0.213). Patients with
BLCA were divided into low and high-risk groups according to the
median value of the risk score of each sample. The Kaplan-Meier
curves indicated that the low-risk group had prolonged OS compared
with the high-risk group (Fig. 6D).
The 5-year OS for the high-risk group was 23.4±5.95%, with a 95%
confidential interval from 0.142 to 0.385, while the 5-year OS for
the low risk group was 71.7±4.27%, with a 95% confidential interval
from 0.740 to 0.907 (P<0.05).
Prediction accuracy of the prognostic
IRG model
Time-dependent receiver operating characteristic
(ROC) curves were applied to examine the prediction accuracy of the
OS prognostic model over the 1-, 3- and 5-year period. The values
of area under the ROC (AUC) for the prognostic model were 0.73,
0.82, and 0.83 at 1-, 3- and 5-year period, respectively (Fig. 7A). Thereafter, the risk score of each
patient was sorted into a descending order. The survival status of
each patient was marked accordingly on the dot plots. It was
observed that patients with low risk scores had an improved OS rate
compared with patients with high risk scores (Fig. 7B and C). The heatmap shows the
expression levels of nine genes from the prognostic model (Fig. 7D). According to the results of the
present study, the differentially expressed IRGs and TFs based gene
model exhibited good predictive performance.
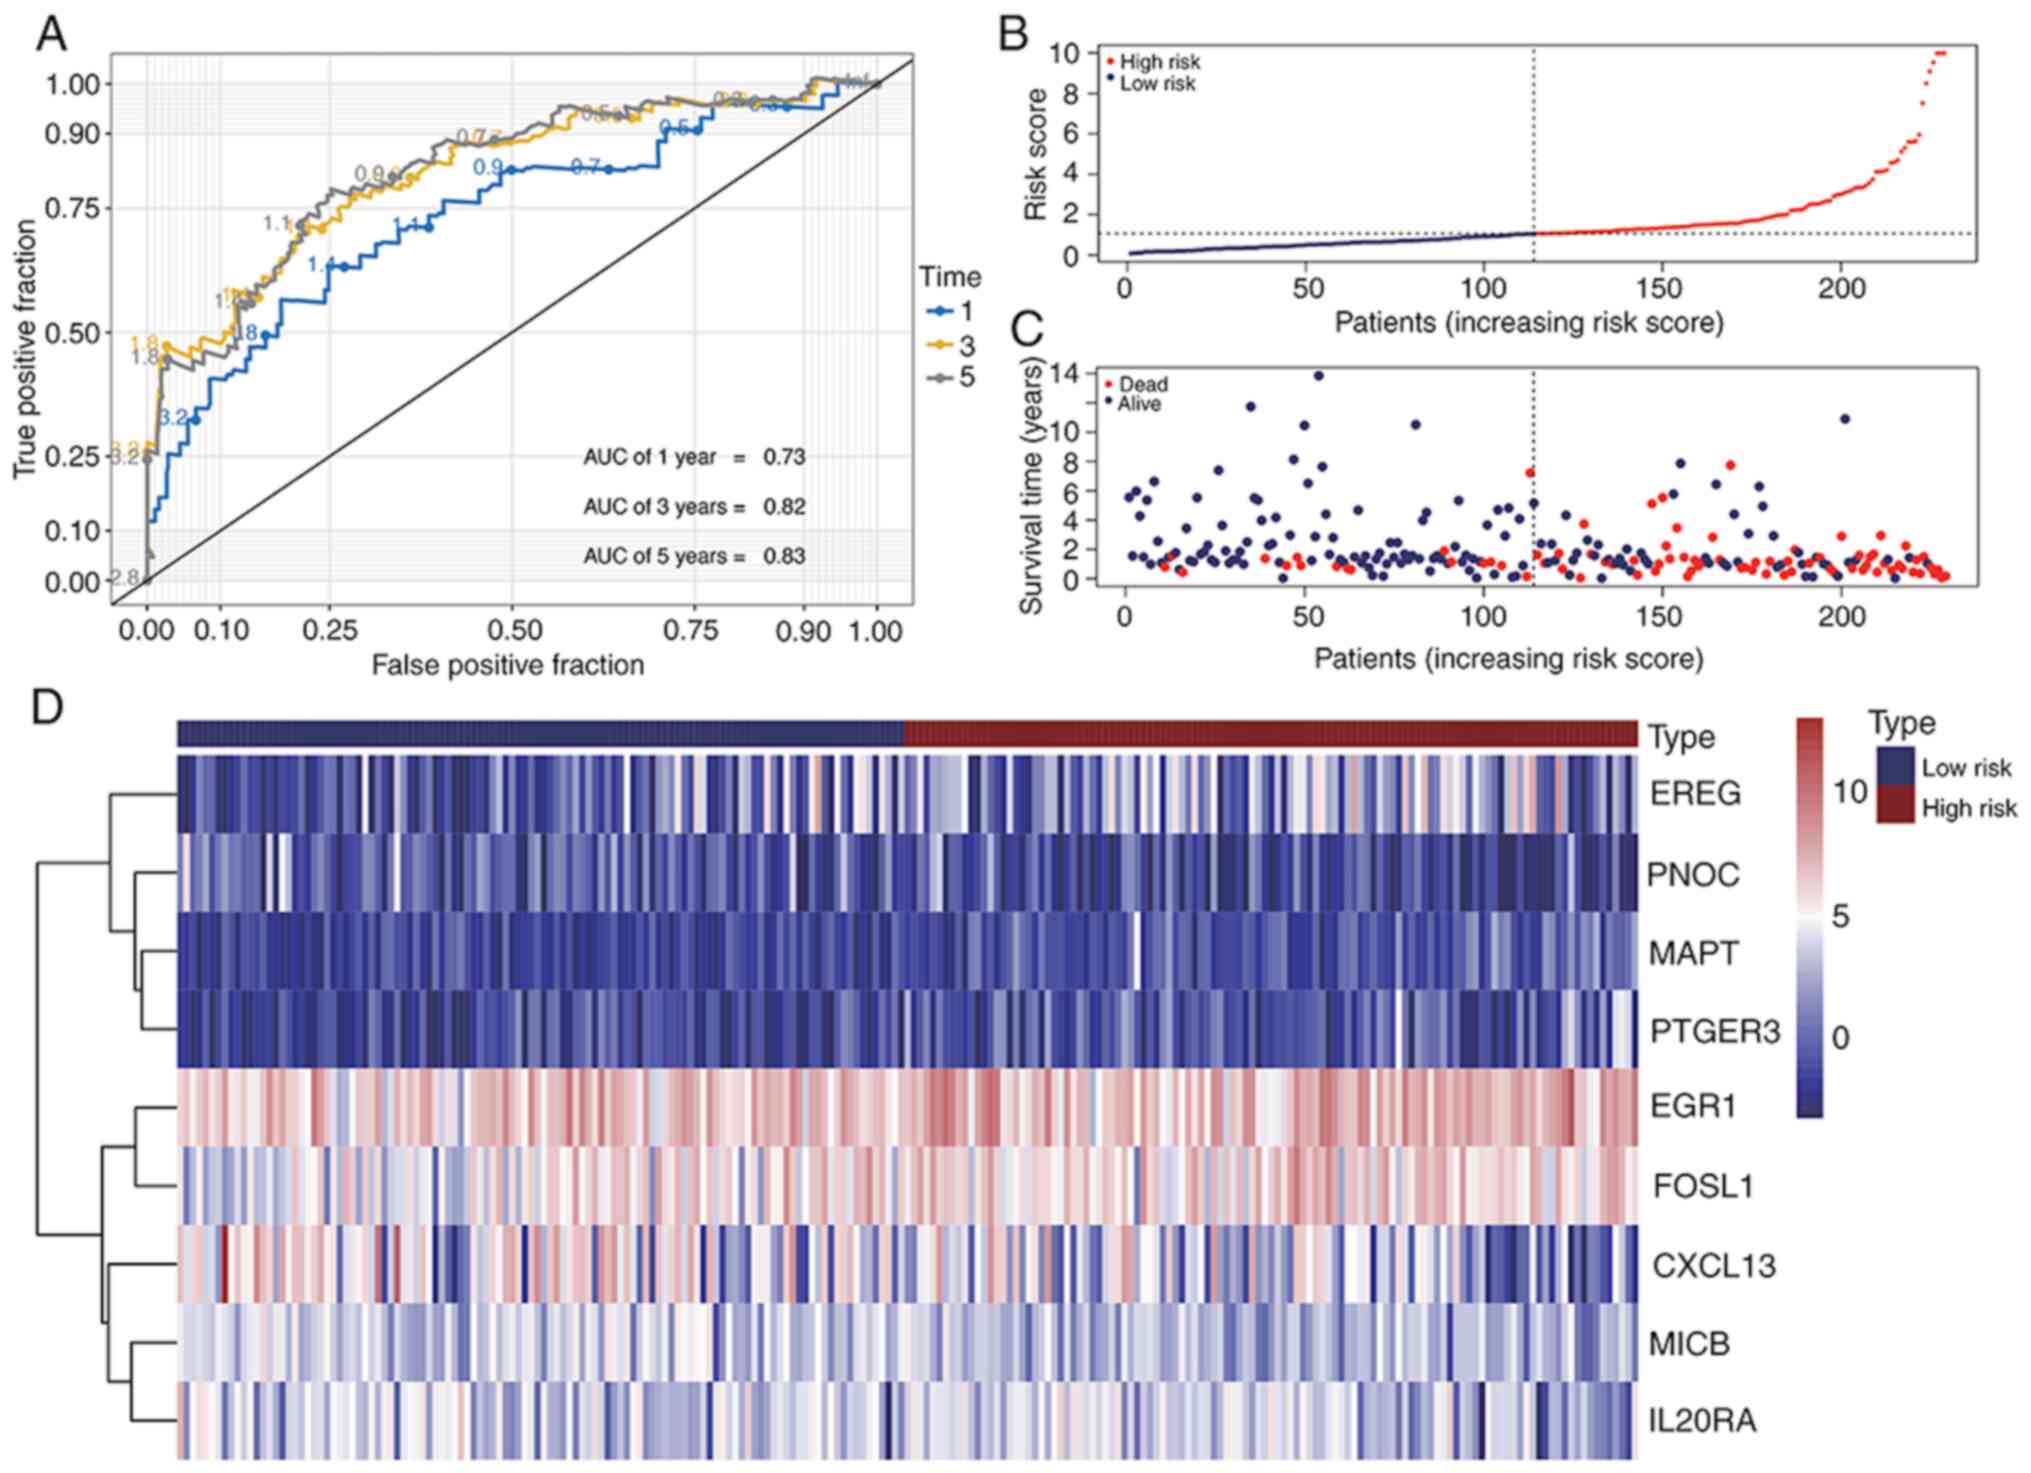 | Figure 7.Immune-related gene signature
predicts the OS of patients with BLCA. (A) Receiver operating
characteristic curves evaluating accuracy of the prognostic model
for predicting the OS of patients from The Cancer Genome Atlas BLCA
database in 1, 3 and 5 years. (B) Risk score of each patient
assessed by the prognostic model. (C) Distribution of survival
status scatters for patients according to the risk scores. (D)
Heatmap of gene expression levels of risk genes in the prognostic
model. BLCA, bladder cancer; OS, overall survival; AUC, area under
the curve; EREG, proepiregulin; PNOC, prepronociceptin; MAPT,
microtubule-associated protein tau; PTGER3, prostaglandin E2
receptor EP3 subtype; EGR1, early growth response protein 1; FOSL1,
FOS-related antigen 1; MICB, major histocompatibility class I
polypeptide-related sequence B. |
A robust prognostic gene model for
BLCA
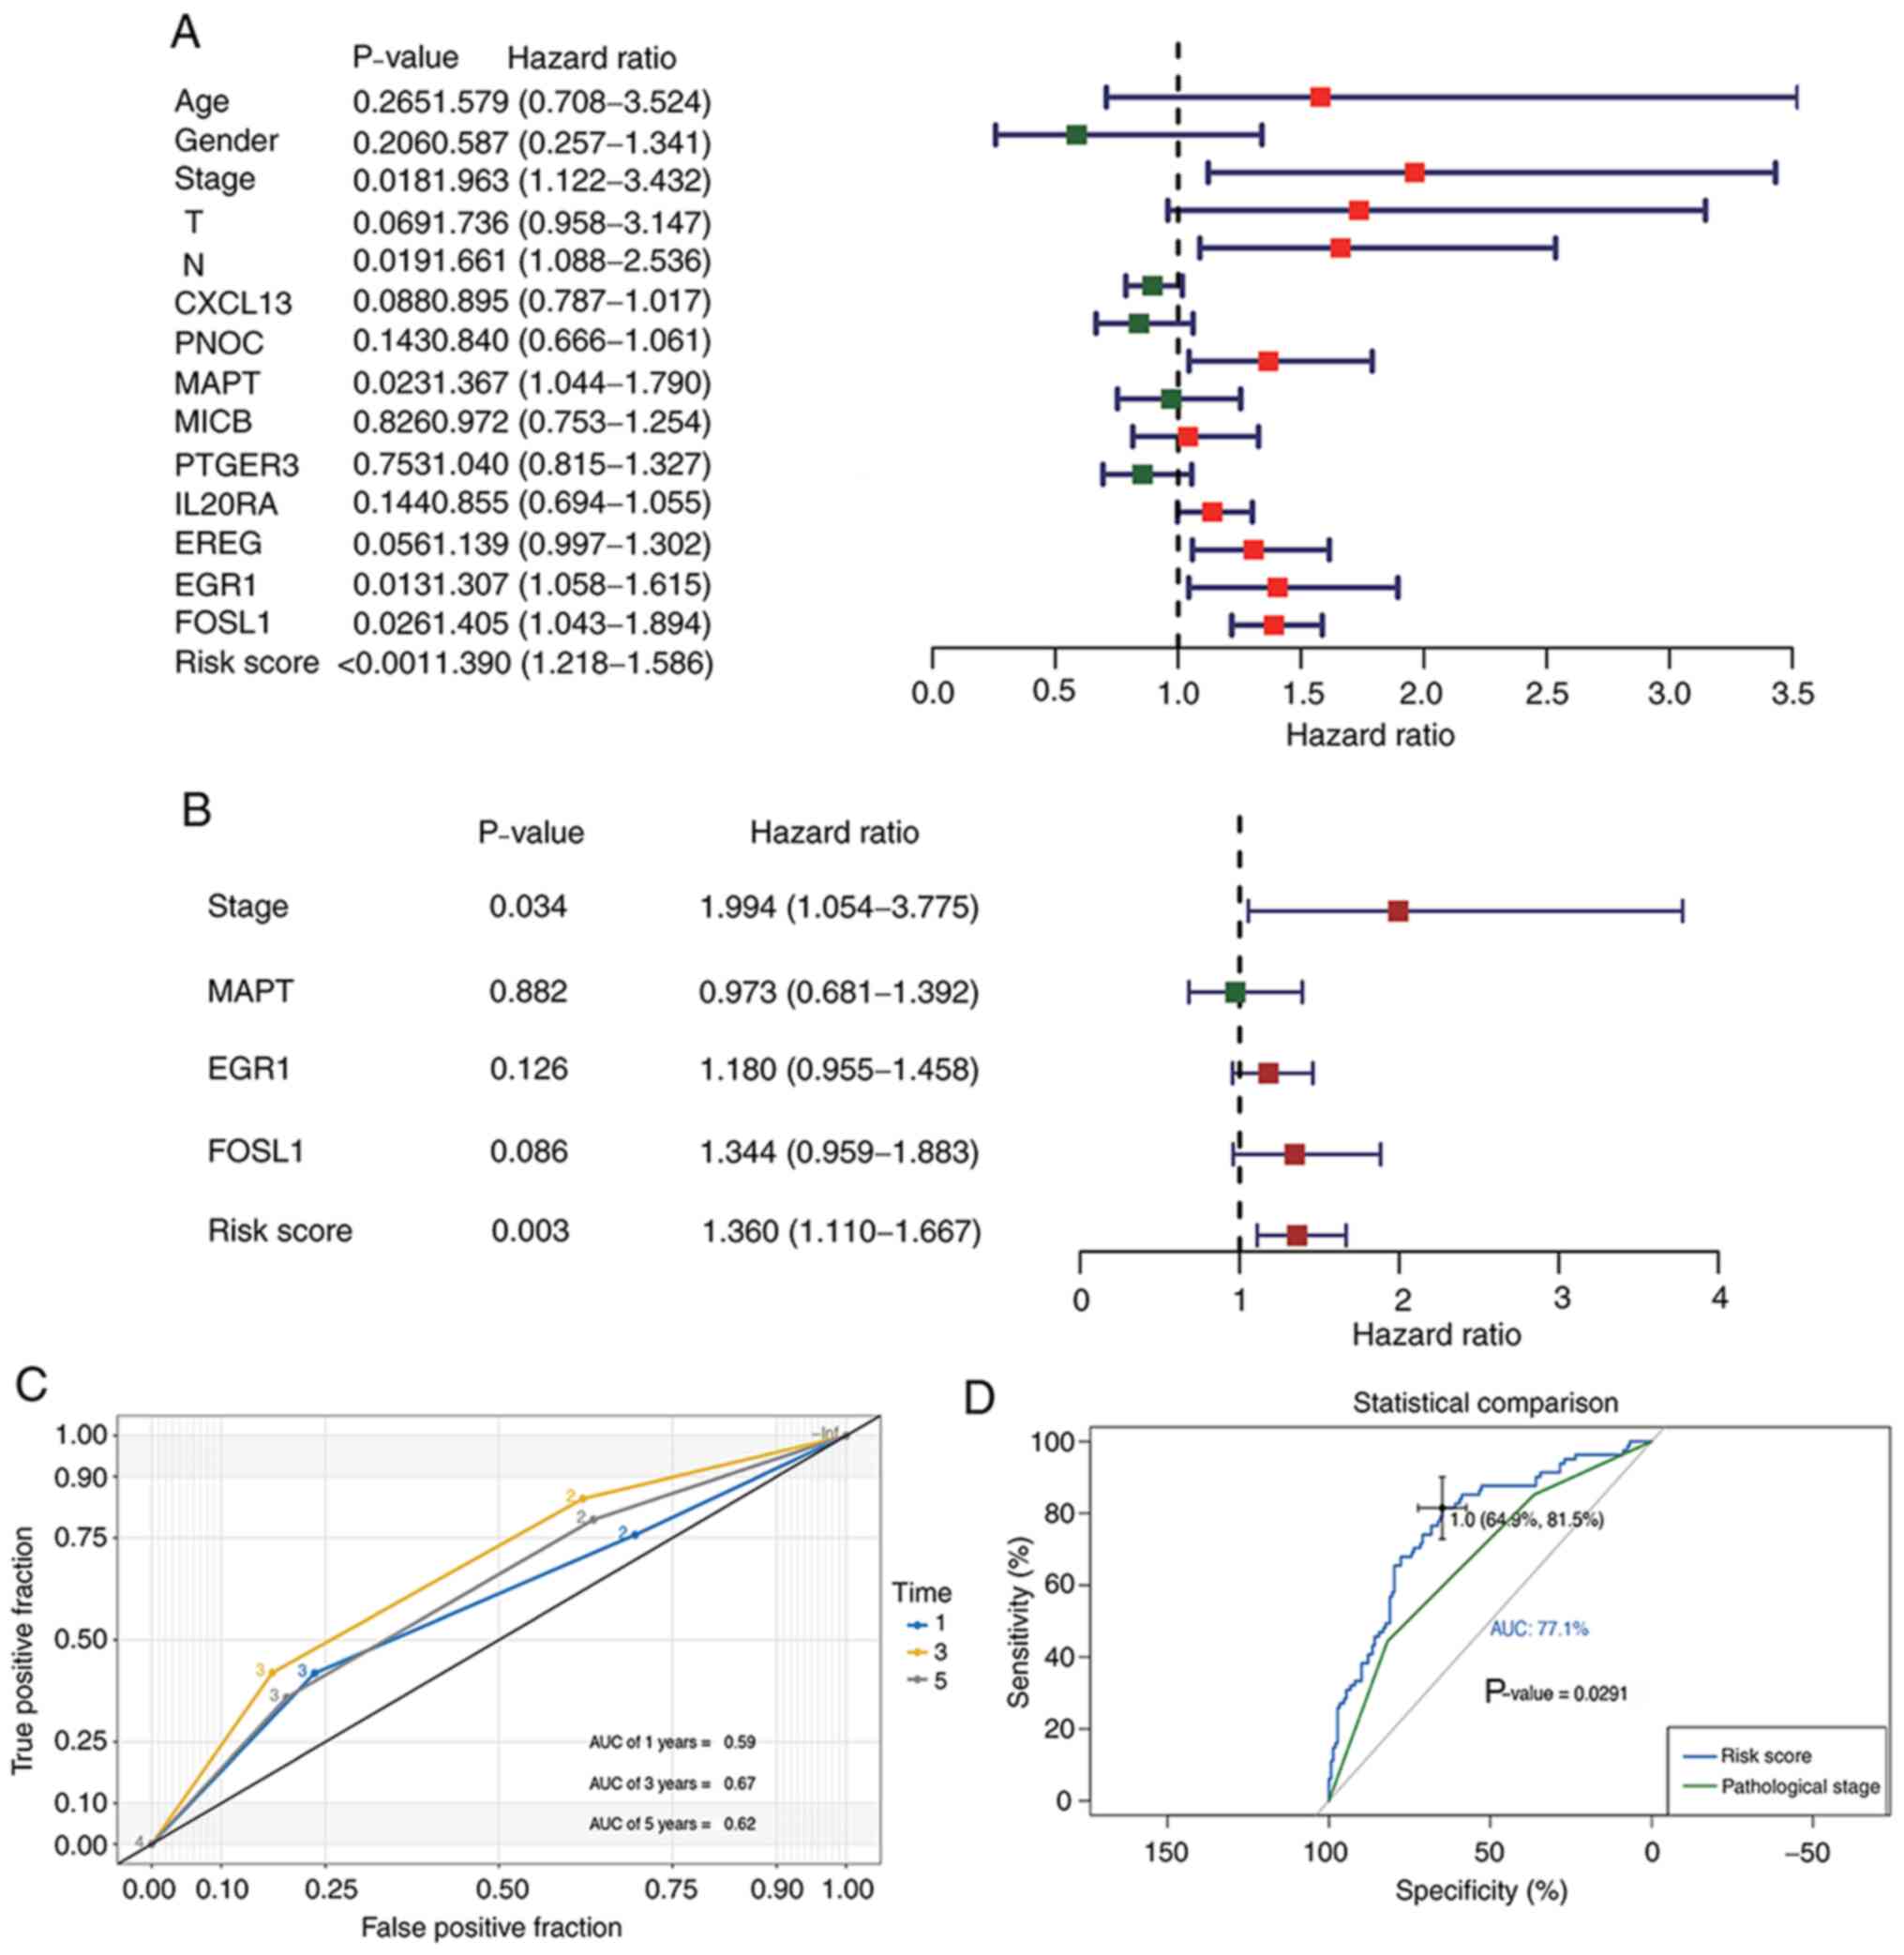
Cox regression analyses were performed to evaluate
whether our prognostic model acted as an independent prognostic
factor among other clinical traits, including age, sex, and
pathological and T/N stages. Univariate analysis indicated that
risk score, pathological stage, MAPT, EGR1 and/or
FOSL1 expression may affect the prognosis of patients with
BLCA (Fig. 8A). Multivariate Cox
regression results revealed that both pathological stage and risk
score served as independent prognostic factors for BLCA (Fig. 8B). The AUCs of the time dependent ROC
curves for pathological stage during the 1-, 3- and 5-year periods
were 0.59, 0.67 and 0.62, respectively (Fig. 8C). The comparison between the AUCs
for risk score and those for pathological stage indicated that the
present model had improved predictive accuracy (P=0.0029) of
patient OS compared with the pathological stage (Fig. 8D).
Clinical application of a novel
nomogram incorporating the IRG model
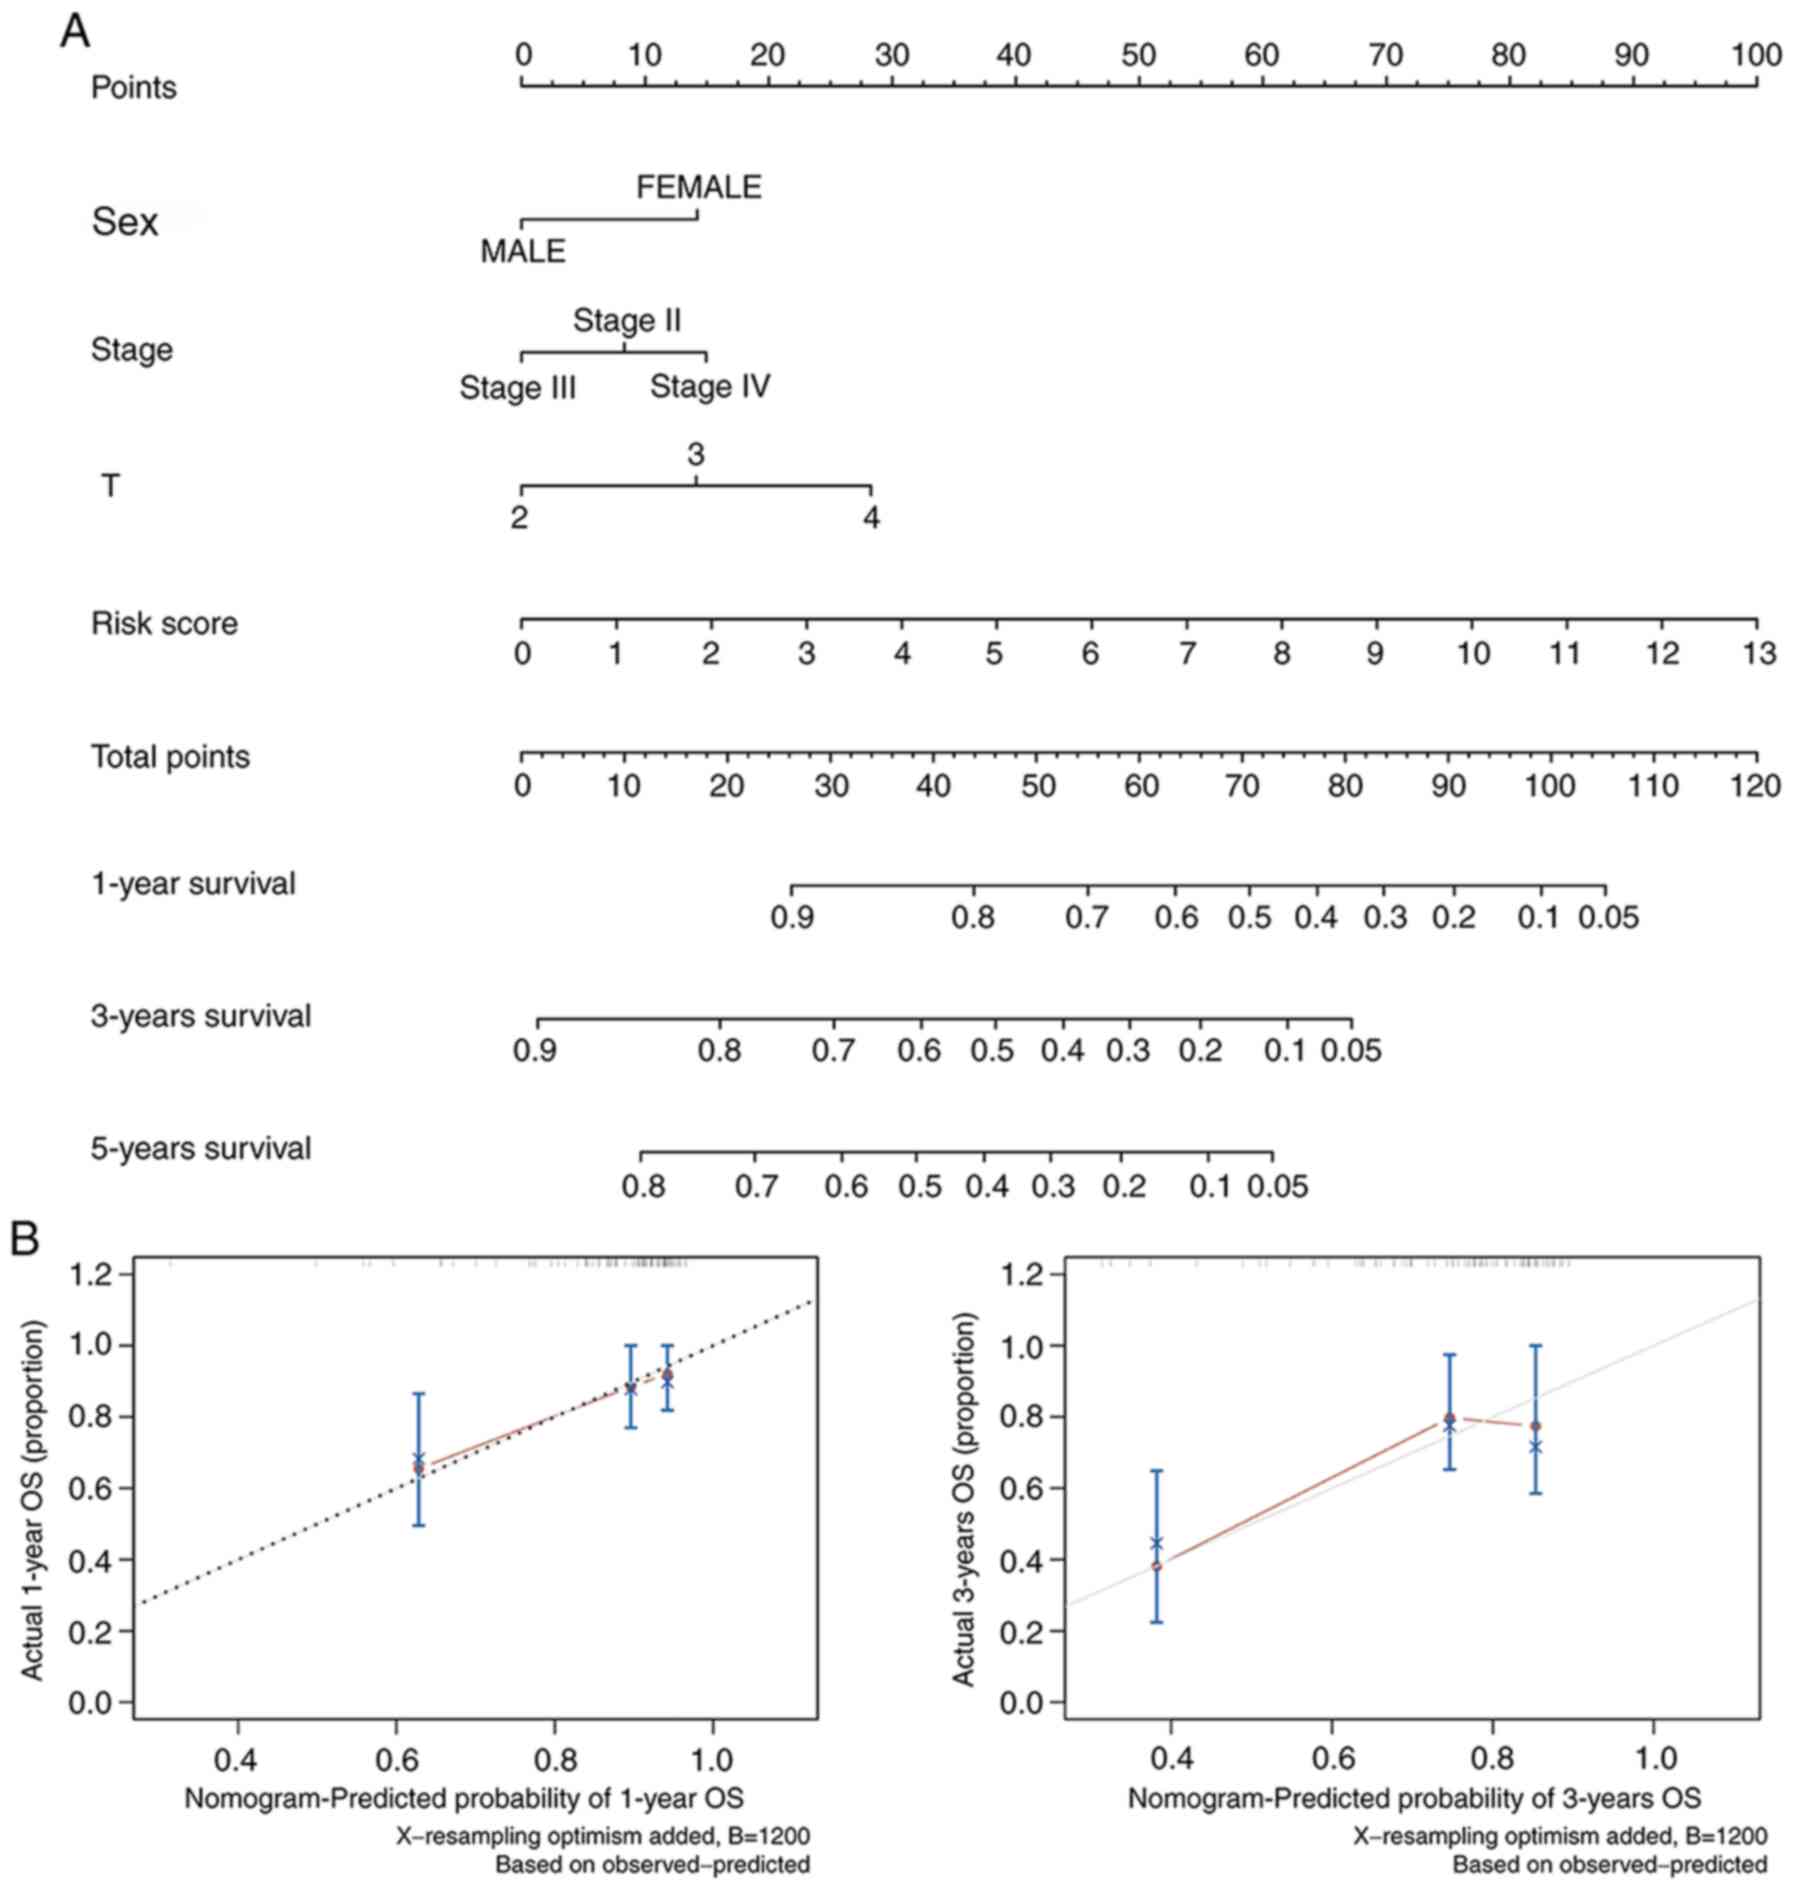
According to the results of Cox regression analyses,
which were based on the clinical traits and the risk score of the
prognostic model, a nomogram was constructed that combined other
factors, including age, sex, pathological and T/N stages, as well
as the IRG model to provide a more quantitative method for
clinicians to assess the 1-, 3- and 5-year OS of patients with BLCA
(Fig. 9A). In this manner, every
patient received a quantifiable point for each prognostic measuring
parameter. The calibration plots illustrated that, in comparison
with an ideal model, the current nomogram had a stable predictive
performance for 1- and 3-year OS (Fig.
9B).
Construction of a prognostic TF- and
IRG-based regulatory network
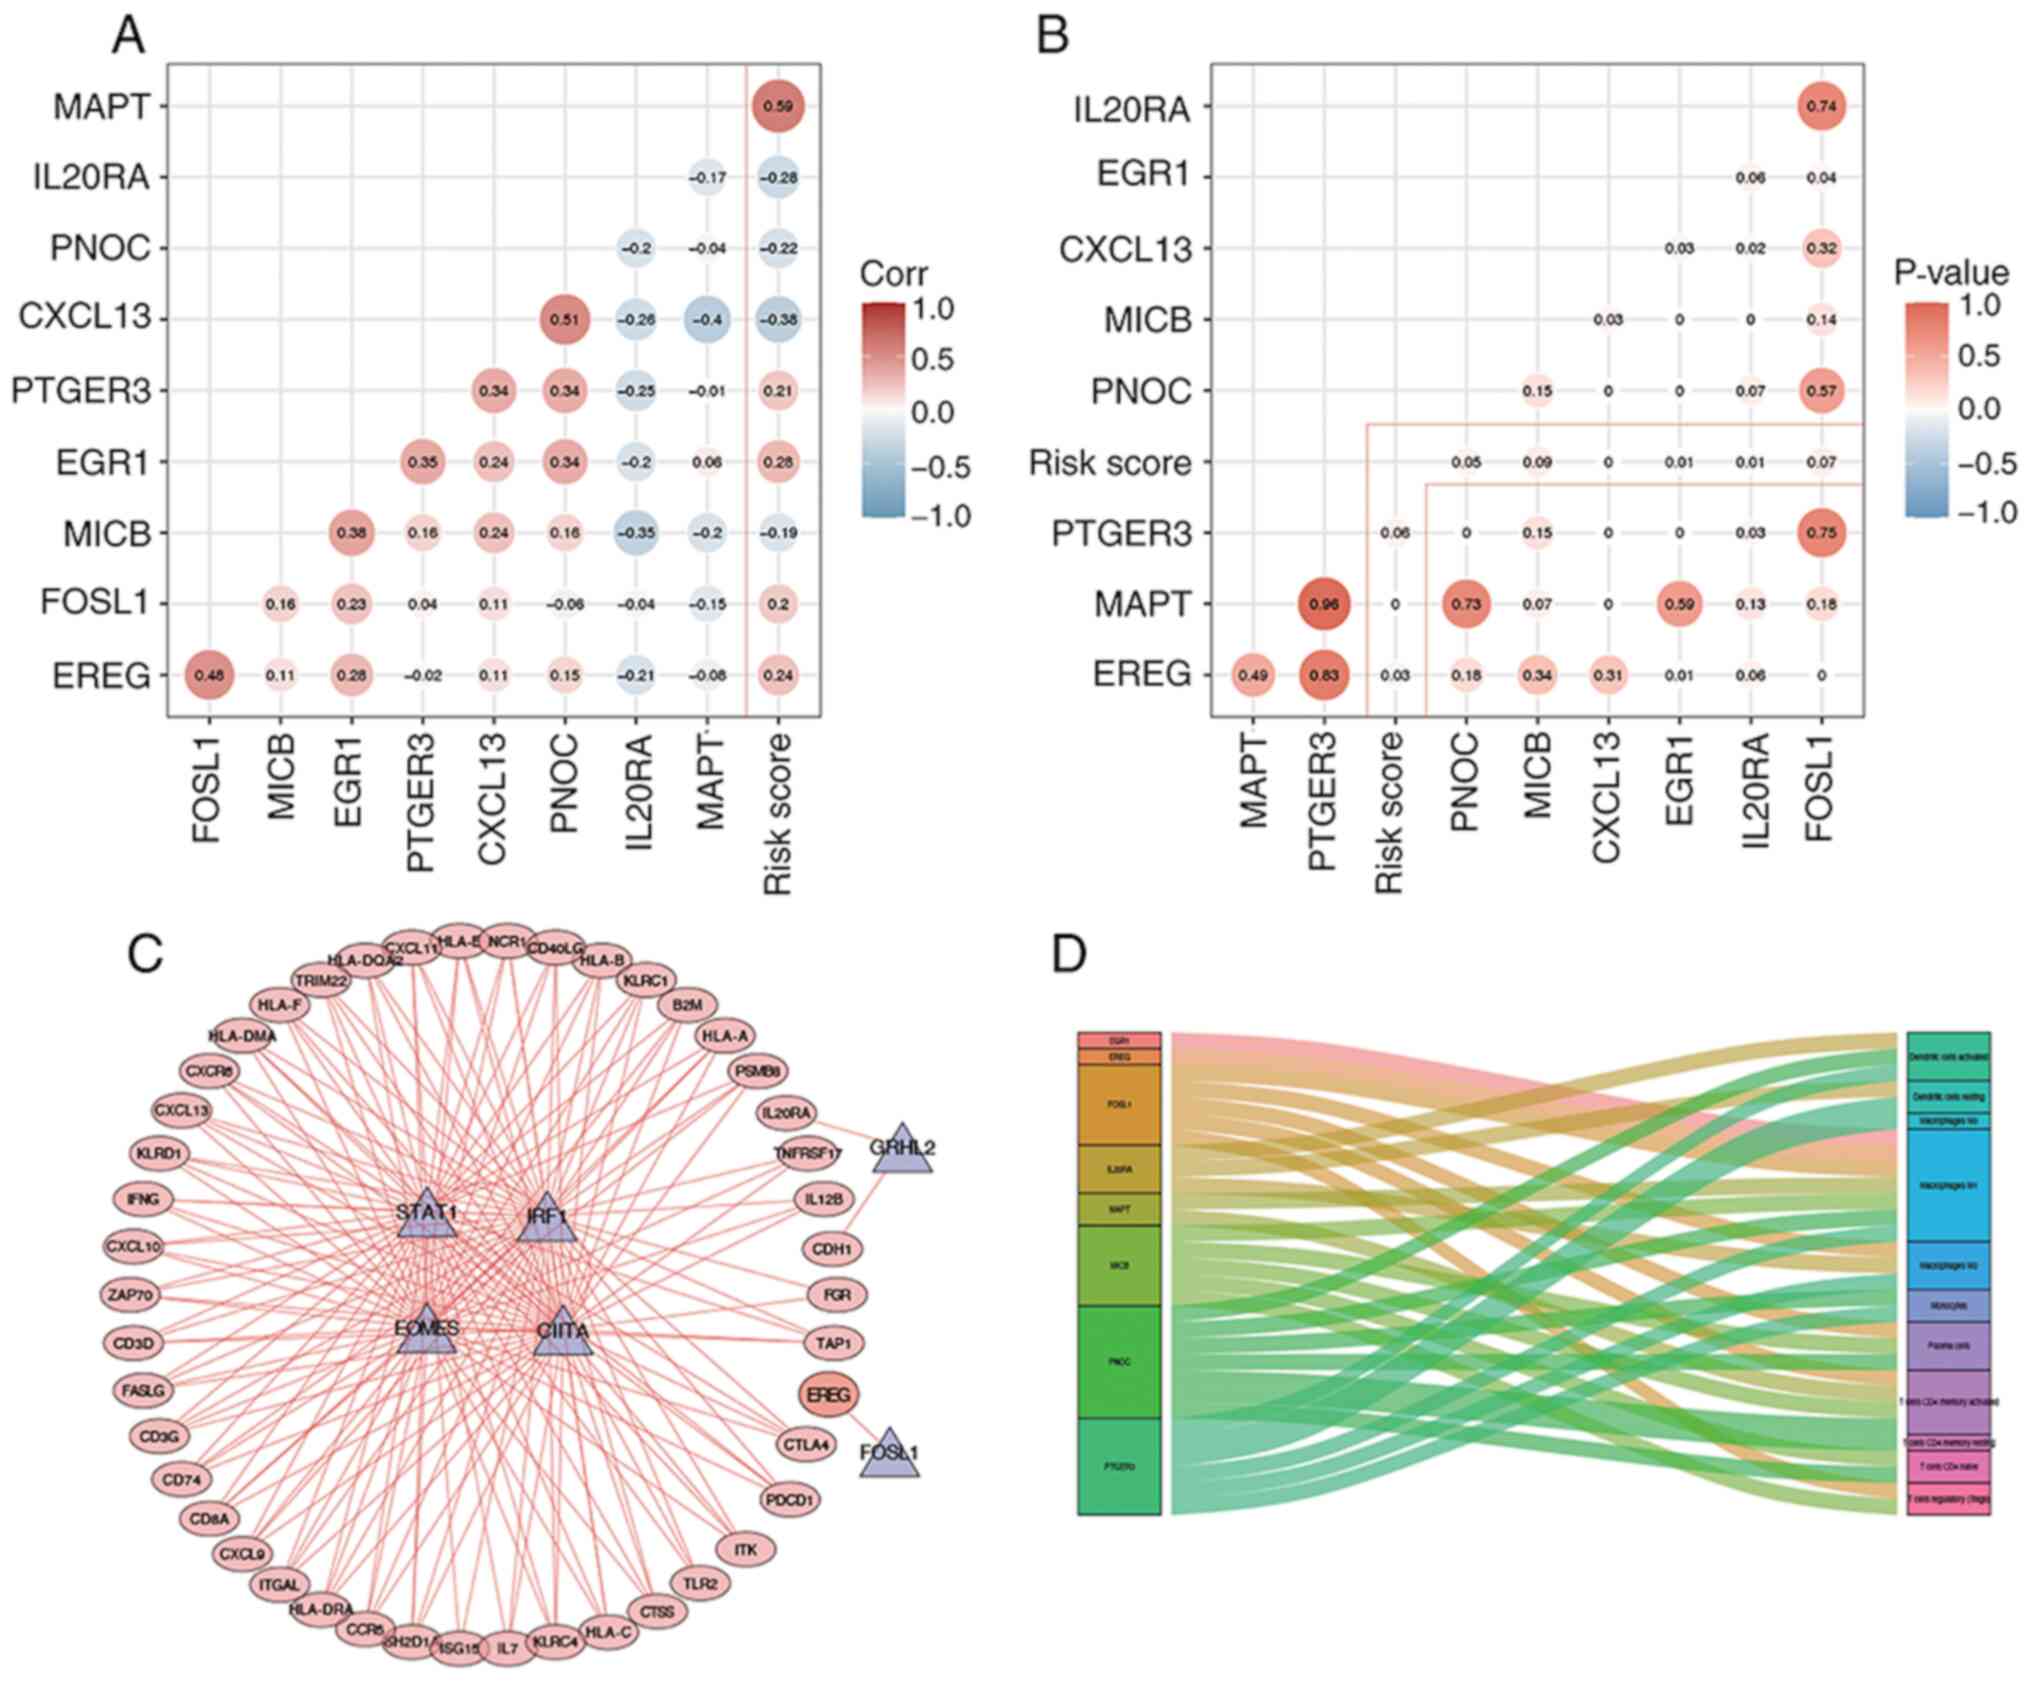
The correlation between the nine selected IRGs, used
to implement the prognostic model, and corresponding risk scores
was further established (Fig. 10A and
B). Thus, Pearson's correlation analysis was performed between
the prognostic TFs and IRGs. The cut-off thresholds presently
defined were |Pearson correlation coefficient value|>0.5 and
P<0.01. All prognostic IRGs (n=45) were positively regulated by
prognostic TFs, where EREG acted as a high-risk IRG that was
positively regulated by FOSL1 (Fig.
10C). A Sankey map illustrated the association between the
expression level of the nine selected IRGs and the infiltration of
immune cell subtypes (Fig. 10D).
According to the correlation analysis results, FOSL1 and ERG1 were
identified as two TFs capable of performing pivotal transcriptional
regulation processes within tumor cells.
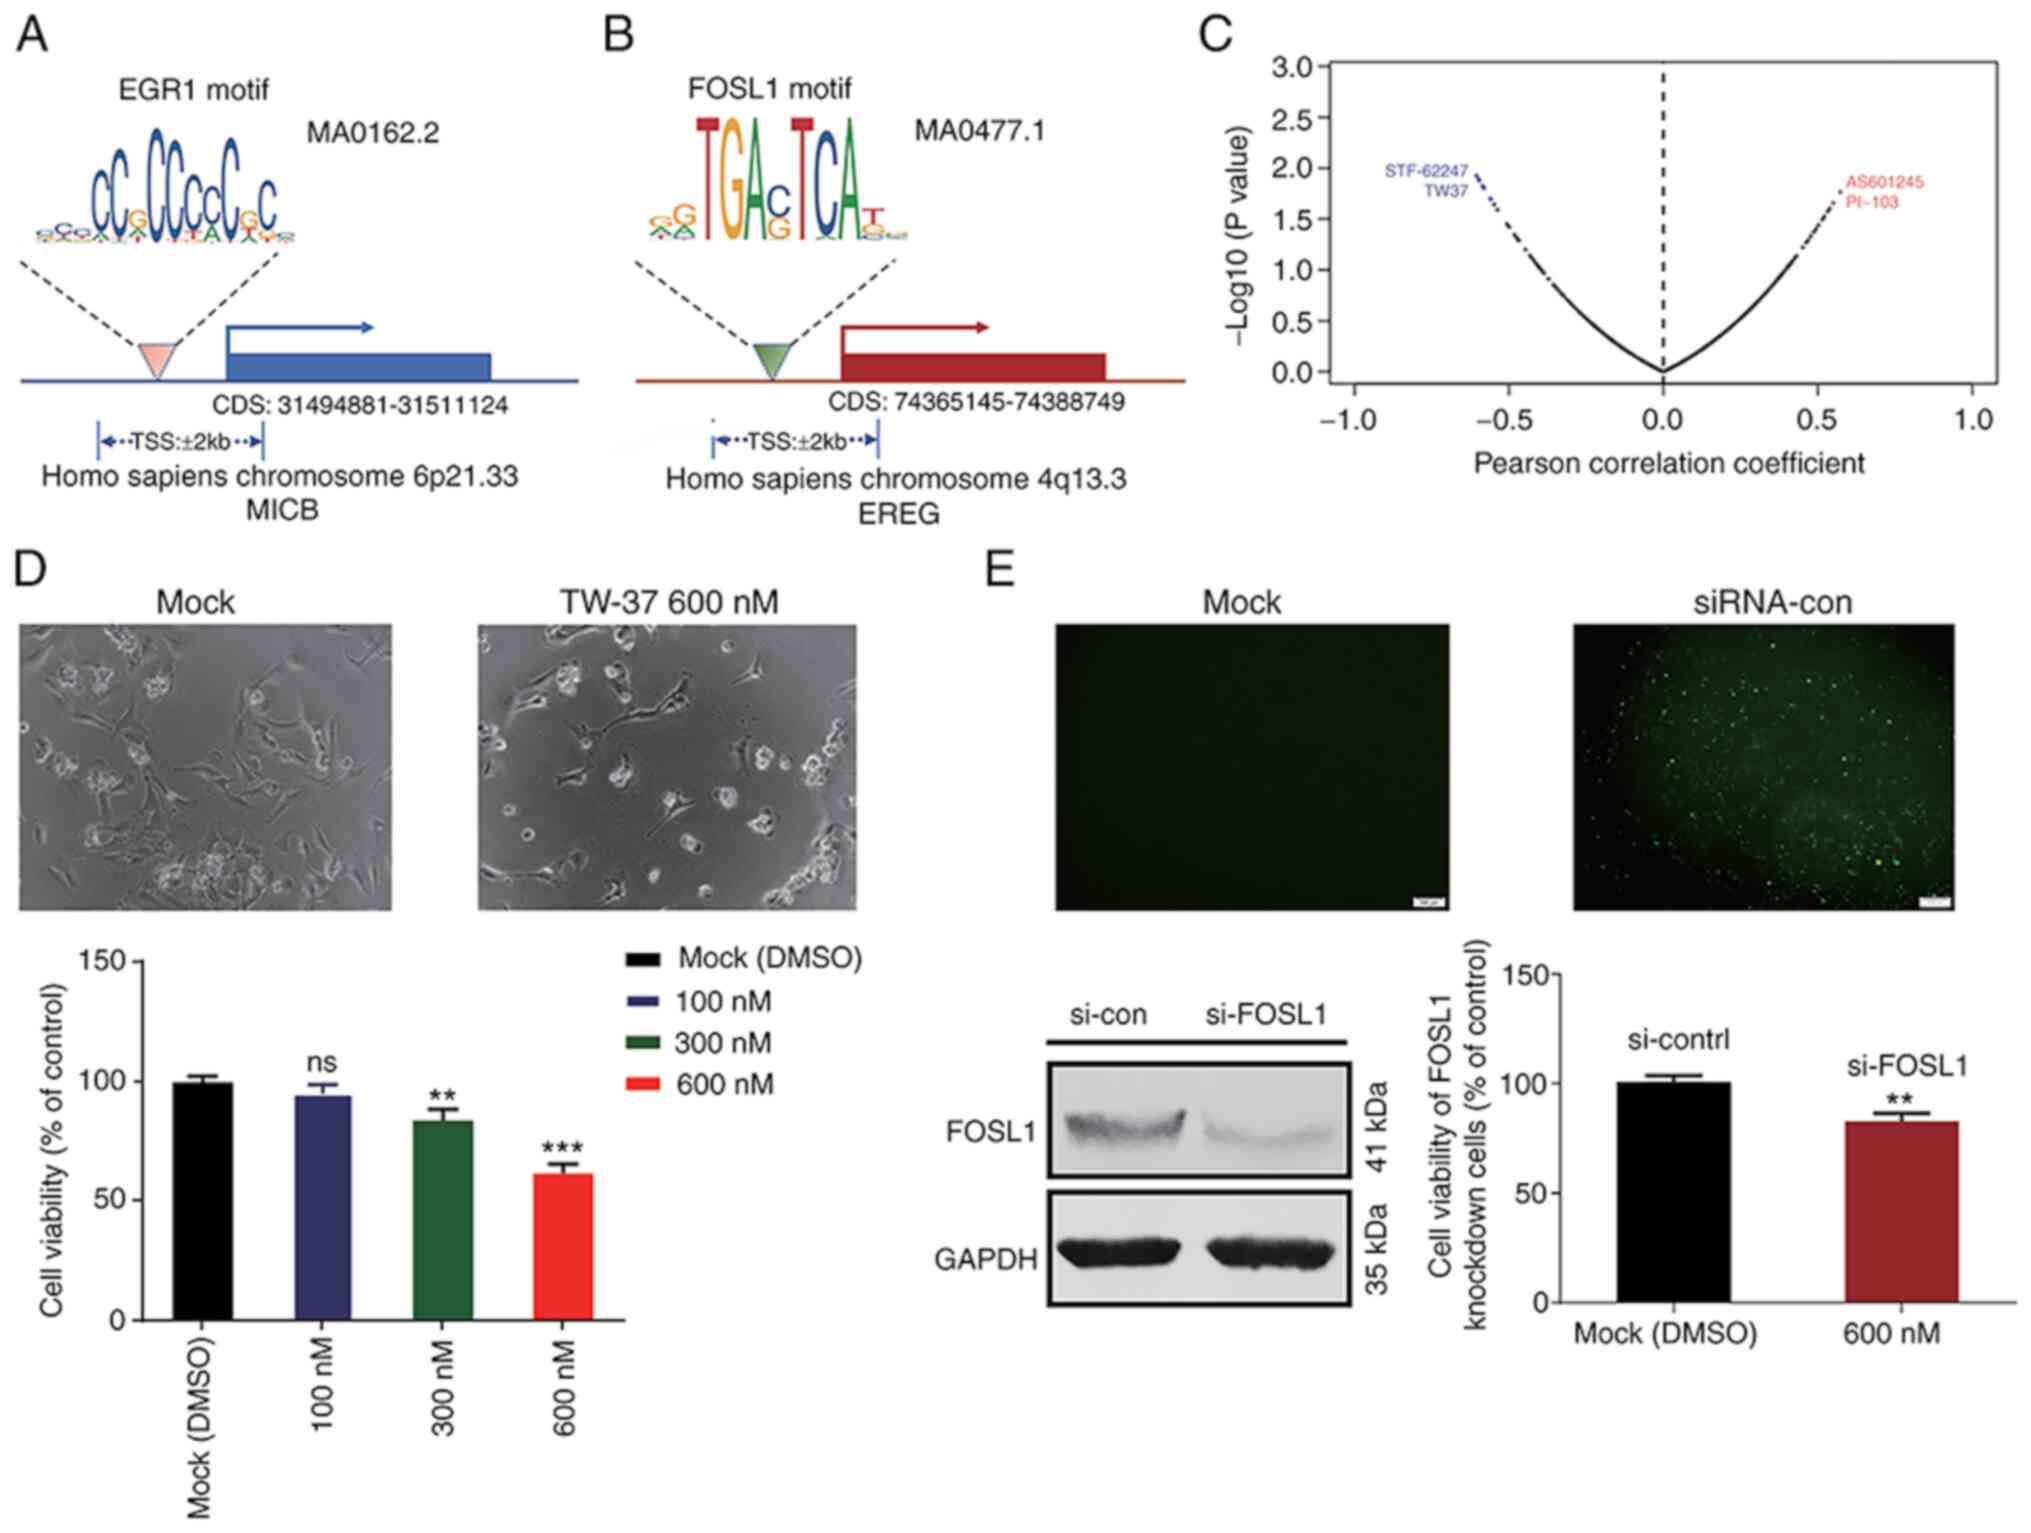
Analysis of TF binding motifs and
binding sites in targeted IRGs
According to the prognostic gene signature and
correlation analysis results, the specific TFBMs of FOSL1 and ERG1
were analyzed using the JASPAR 2020 database. The predicted matrix
IDs of TFBMs for EGR1 and FOSL1 were MA0162.2 and
MA0477.1, respectively (Fig. 11A and
B). According to the results of gene expression correlation
analysis, it was reported that MICB and EREG were
positively regulated by EGR1 and FOSL1, respectively. Therefore,
potential specific TFBSs for EGR1 and FOSL1 were identified within
the TSSs of MICB and EREG genes (Table III). Thus, blocking these potential
TFBSs may interfere the transcription process of related target
genes by inhibiting TF binding to respective TSS along the gene
sequences.
| Table III.Transcription factor binding site
matching results of target genes. |
Table III.
Transcription factor binding site
matching results of target genes.
| Matrix ID | Name | Score | Relative score | Start | End | Predicted
sequence |
|---|
| MA0162.2 | EGR1 | 16.342 | 0.9551 | 315 | 328 | TCCCCTCCCCCACC |
| MA0162.2 | EGR1 | 13.424 | 0.9239 | 277 | 290 | AGCCCTCCCCCTCC |
| MA0162.2 | EGR1 | 11.547 | 0.9038 | 928 | 941 | CCTCCTCCCCCATT |
| MA0477.1 | FOSL1 | 5.9175 | 0.8508 | 1809 | 1819 | AATGAGTTAGG |
| MA0477.1 | FOSL1 | 4.3821 | 0.8295 | 1677 | 1687 | TGTGAATAACC |
| MA0477.1 | FOSL1 | 4.1961 | 0.8269 | 467 | 477 | TGTGAGTCTGT |
Correlation between modeled gene
expression and sensitivity to targeted therapeutics
To examine the correlation between all gene
expressions integrated into our prognostic model and targeted drug
sensitivity, experimental drug sensitivity data covering 265
therapeutic compounds across 19 BLCA cell lines were retrieved from
the GDSC database. According to the expression profiles of the
present model genes, the top 10 correlated drugs were identified,
using a cut-off threshold of |Pearson correlation coefficient|
>0.5 and a P<0.025 (Table
IV). A Pearson correlation coefficient curve suggested that the
IC50 values of ‘AS601245’ and ‘PI-103’ were proportional
to EGR1 expression levels. At the same time, the
IC50 values of ‘TW 37’ and ‘STF-62247’ were inversely
correlated to the expression of FOSL1 (Fig. 11C).
| Table IV.Results of model gene and IC50 value
of therapeutics using the Pearson's correlation analysis based on
Genomics of Drug Sensitivity in Cancer bladder cancer cells
data. |
Table IV.
Results of model gene and IC50 value
of therapeutics using the Pearson's correlation analysis based on
Genomics of Drug Sensitivity in Cancer bladder cancer cells
data.
| Gene | Drug | Correlation | P-value | Target | Pathway |
|---|
| EGR1 | AS601245 | 0.572 | 0.0171 | JNK | JNK and p38
signaling |
| EGR1 | PI-103 | 0.550 | 0.0218 | PI3K α, DNAPK | PI3K signaling |
| FOSL1 | QL-XI-92 | −0.559 | 0.0201 | DDR1 | RTK signaling |
| FOSL1 | GSK269962A | −0.56 | 0.0198 | ROCK1, ROCK2 | Cytoskeleton |
| FOSL1 | Bicalutamide | −0.581 | 0.0156 | Androgen
receptor | Other |
| FOSL1 | MLN4924 | −0.584 | 0.0151 | NEDD8-activating
enzyme | Other |
| FOSL1 | Olaparib | −0.585 | 0.0149 | PARP1, PARP2 | Genome
integrity |
| FOSL1 | T0901317 | −0.596 | 0.0131 | LXR | Other |
| FOSL1 | STF-62247 | −0.598 | 0.0128 | Autophagy | Other |
| FOSL1 | TW 37 | −0.605 | 0.0118 | BCL-2, BCL-XL | Apoptosis
regulation |
Verification of the predicted
correlation between TW-37 and FOSL1
To further validate the predicted relationship
between the expression levels of FOSL1 and the
IC50 value of potential drugs, in vitro studies
were performed using T24 BLCA cells. Upon cell treatment, it was
observed that the TW-37 significantly impaired the viability of T24
cells at the concentration of 600 nM (Fig. 11D). However, the cytotoxicity of
TW-37 was attenuated after knockdown of FOSL1 (Fig. 11E). Cell viability was 61.76±3.66%
when T24 cells without knockdown of FOSL1 were treated with
600 nM TW-37 for 36 h. After depletion of FOSL1 in T24 cells, cell
viability increased to 83.06±3.57%. Thus, increased FOSL1
expression may improve the drug resistance of TW-37 in T24
cells.
Discussion
BLCA is considered a complex malignancy with high
morbidity and mortality rates, which have caused a severe
social-economic burden worldwide. So far, in 2020, a total of
17,980 estimated deaths in the USA have been related to BLCA
(1). Advances in the trans-urethral
resection of bladder tumor, as well as in the application of
bladder instillation therapy, have been able to control tumor
progression in patients with early BLCA (24). Still, approximately half of patients
with MIBC suffer from recurrence or distant metastasis after
radical cystectomy, which frequently results in a significant
decrease on the survival rate and makes the management of advanced
BLCA more challenging (25).
Recent progress on the field of immunotherapy have
provided opportunities for precision management and treatment of
BLCA. In the past decade, therapeutic approaches that target PD1
and PDL1 have already been applied to treat patients with BCLA
(26). Since high-throughput
sequencing technologies and bioinformatics analyses have become
more conventionally applied into biological studies, oncologists
can now implement such technologies to explore potential factors
that may predict prognostic outcomes and, consequently, affect the
efficacy of distinct cancer immunotherapies (27). Thus, identifying novel IRG signatures
is important to guide decision-making on immune therapeutics.
Previous research on TME alterations has been mostly
related to infiltrating immune cells, based on the deconvolution of
bulk gene expression profiles (28,29). In
the current study, a subset of BLCA samples were classified into
three categories (high, intermediate and low immune response
groups) according to the enrichment scores of 29 IRG sets via
ssGSEA. Estimated results of tumor purity indicated that the low
immune response group had a significantly higher tumor purity
compared with the high immune response group, implying that the
population of stromal and immune cells were decreased in samples
originated from low immune response tumors. Notably, it was
reported that high enrichment scores of genes related to
CD8+ T Cell infiltrates were correlated with improved
prognostic outcomes. Based on the CIBERSORT analysis, similar
findings validated that a high infiltration of CD8+ T
Cells could improve the 5-year OS of patients with BCLA.
CD8+ T Cells are typically considered anticancer cells
in the TME (27). Upon interaction
with T Cell antigen receptors, these cells bind peptide MHCs,
expressed on the antigen-presenting cell surface, to kill tumor
cells (30). However, after
infiltrating into tumor tissues, CD8+ T Cells gradually
become dysfunctional, which may disable their antitumor activity
(31). Identifying novel genes
associated with T Cell exhaustion, as well as therapies that could
restore the cell killing ability of CD8+ T Cells, should
be focused on in future immunological studies.
In the high immune response group, GSVA results
suggested that multiple classic pathways were activated, including
those related to apoptosis, antigen processing and presentation, T
Cell and B cell receptors, NK cell mediated cytotoxicity, JAK-STAT,
RIG-I-like, NOD-like receptor and TOLL-like receptor (TLR)
signaling cascades. Specifically, GSEA results based on the KEGG
database indicated that the NF-κB, PD-L1 and PD-1 checkpoint
pathways were enriched in the high immune response group. These
signaling pathways have been reported to be related to human immune
response process, and for decades they have been studied in the
area of onco-immunology (6,32). Pathways related to apoptosis
activation, antigen processing and presentation, cancer-associated
macrophages, T and B cell receptors, as well as NK cell-mediated
cytotoxicity, may suggest thaT Cellular immunity is activated in
the high immune response group. RIG-I-like receptor, NOD-like
receptor and TLR signaling pathways are pattern recognition
receptors that play a pivotal role in initiating the innate immune
response (33). TLR stimulation has
been shown to rescue activated Th1 cells from exhaustion.
Particularly, TLR2 engagement in CD8+ T Cells appears to
be capable of augmenting antitumor activity in vivo
(6). Relevant evidence has also
revealed that the rescue of chronically activated CD8+ T
Cells by blockage of checkpoint regulators (for example PD-1 and
cytotoxic T lymphocyte protein 4) is a successful platform cancer
immunotherapy (34). Accumulating
evidence also supports the possibility of manipulating TLR
signaling to further modulate the expression of immune checkpoint
molecules (35).
In the current study, a prognostic model was
constructed based on differentially expressed IRGs and TFs
identified in high and low immune response groups of BLCA samples.
EGR1 and FOSL1 are risk TFs, detected in the present model, which
may decrease the OS of patients. Some reports have claimed that
reactive oxygen species can induce the chromatin remodeling of
effector T Cells and their conversion into exhausted T Cells,
further attenuating host antitumor immunity (36). The FOSL1 transcription factor is a
major effector of RAS-ERK1/2 pathway and FOSL1 can enhance
pancreatic cancer metastasis by activating the EMT pathway
(37,38). Such evidence suggests that the
underlying mechanisms of EGR1 and FOSL1 as oncogenes may promote
tumorigenesis and metastasis, resulting in impaired prognosis of
patients with BLCA. Rodriguez-Aguayo et al (39) reported that silencing of
PTGER3 expression in ovarian cancer cells is associated with
decreased cell proliferation and attenuated invasiveness, while
higher PTGER3 expression is associated with a shorter
patient survival. The MAPT gene encodes the
microtubule-associated protein Tau (40). Studies have suggested that increased
levels of cytoplasmic and nuclear Tau, before intravesical
chemotherapy, are significantly associated with decreased patients'
recurrence-free survival (41). The
EREG gene encodes epiregulin, an epidermal growth factor
receptor ligand, which contributes to inflammation, angiogenesis,
vascular remodeling and cell proliferation (42). In the present prognostic model, these
aforementioned genes were recognized as risk factors for the
decreased OS of patients with BLCA, serving as promising targets in
a therapeutic intervention.
Previous studies have established gene models for
prognosis prediction in patients with BLCA using bioinformatic
analysis. Cao et al (43)
identified seven EMT-related genes as a signature for the prognosis
of MIBC. Jiang et al (11)
constructed an IRG signature (TIM signature), which partially
explains the complicated relationships between immune cell
infiltration of TME and the survival. Furthermore, due to the wide
use of the high throughput sequencing technologies and
bioinformatic analysis, researchers have reported that
differentially expressed non-coding RNAs also possess important
roles in the regulation of gene expression, as well as putative
predictors of patient survival in multiple types of cancer
(44,45). The present study implemented
comprehensive bioinformatics mining and then performed in
vitro tests for further validation, thus providing novel
insights for targeted therapies of BLCA in the near future. The
time-dependent ROC curve of OS exhibited an improved predictive
ability compared with pathological stage of patients with BLCA. A
gene regulatory network was established to depict the relationship
between the prognostic TFs and IRGs. The application of a nomogram,
based on our model, provided a reference tool for clinical work.
Hence, clinical oncologists may comprehensively assess the
prognostic risk of each patient with BLCA. Of note, the present
study proposed a prognostic model based on TFs and IRGs. Moreover,
upon analysis of drug sensitivity datasets (GDSC database), it was
observed that the expression of FOSL1 was negatively
associated with the drug sensitivity of eight distinct therapeutic
agents. In vitro experiments using T24 cells further
demonstrated that silencing FOSL1 expression may enhance the
drug resistance due to TW-37. These results provide supporting
experimental evidence for our theoretical hypothesis based on
bioinformatics analysis.
Inevitably, the current study had some limitations.
Data from TCGA database was used to assess the immune response
based on bioinformatics methods, the present study was unable to
collect substantial clinical data from multiple medical centers to
further confirm our current perspectives. Experimental assays using
patient-derived tumor tissues are required to validate the present
results. Additionally, the mechanisms of how non-coding RNAs could
impact BLCA development should be further investigated.
In summary, the present study implemented a
comprehensive way to assess the immune landscape of BLCA samples
from TCGA database by constructing a novel prognostic model based
on IRGs. The study also established a regulatory network of BLCA
prognostic TFs and IRGs, thus identifying potential effective
therapeutics which could target our model genes. The current study
identified novel predictive gene signatures of BLCA, and it may
also guide the development of drug combination strategies which may
benefit patients with BLCA in the future.
Acknowledgements
Not applicable.
Funding
The present study was supported by the Peking
University International Hospital Young and Middle-aged Research
Startup Fund (grant no. YN2016QN04).
Availability of data and materials
The datasets generated and/or analyzed during the
current study are available in The Cancer Genome Atlas (TCGA)
repository, https://www.cancer.gov/tcga. The additional datasets
used and/or analyzed during the current study are available from
the corresponding author on reasonable request.
Authors' contributions
YD and XW designed the study, performed the data
analysis and drafted the initial manuscript. TW, QW, XH and HL
collected data and participated in the analysis process of the gene
profiles. CY and QW performed the in vitro experiments. CY
and YZ provided academic urological advices and participated in
clinical data analyzing and drafting of the initial manuscript. YD
and XW confirmed the authenticity of all the raw data. All authors
have read and approved the final manuscript.
Ethics approval and consent to
participate
Not applicable.
Patient consent for publication
Not applicable.
Competing interests
The authors declare that they have no competing
interests.
Glossary
Abbreviations
Abbreviations:
|
BLCA
|
bladder cancer
|
|
MIBC
|
muscle invasive bladder cancer
|
|
TCGA
|
The Cancer Genome Atlas
|
|
DEGs
|
differentially expressed genes
|
|
ssGSEA
|
single-sample gene set enrichment
analysis
|
|
CIBERSORT
|
Cell Type Identification By Estimating
Relative
|
|
IRG
|
immune-related gene
|
|
TF
|
transcription factor
|
|
TFBM
|
transcription factor-binding motif
|
|
TFBS
|
transcription factor binding site
|
|
TSS
|
transcription starting site
|
|
GDSC
|
Genomics of Drug Sensitivity in
Cancer
|
|
MHC
|
major histocompatibility complex
|
|
TME
|
tumor microenvironment
|
|
NK
|
natural killer cell
|
|
Treg
|
regulatory T Cell
|
|
GO
|
Gene Ontology
|
|
KEGG
|
Kyoto Encyclopedia of Genes and
Genomes pathway
|
|
DCs
|
dendritic cells
|
References
|
1
|
Siegel RL, Miller KD and Jemal A: Cancer
statistics, 2020. CA Cancer J Clin. 70:7–30. 2020. View Article : Google Scholar : PubMed/NCBI
|
|
2
|
Babjuk M: Trends in bladder cancer
incidence and mortality: Success or disappointment? Eur Urol.
71:109–110. 2017. View Article : Google Scholar : PubMed/NCBI
|
|
3
|
Knowles MA and Hurst CD: Molecular biology
of bladder cancer: New insights into pathogenesis and clinical
diversity. Nat Rev Cancer. 15:25–41. 2015. View Article : Google Scholar : PubMed/NCBI
|
|
4
|
Nadal R and Bellmunt J: Management of
metastatic bladder cancer. Cancer Treat Rev. 76:10–21. 2019.
View Article : Google Scholar : PubMed/NCBI
|
|
5
|
Loehrer PJ Sr, Einhorn LH, Elson PJ,
Crawford ED, Kuebler P, Tannock I, Raghavan D, Stuart-Harris R,
Sarosdy MF, Lowe BA, et al: A randomized comparison of cisplatin
alone or in combination with methotrexate, vinblastine, and
doxorubicin in patients with metastatic urothelial carcinoma: A
cooperative group study. J Clin Oncol. 10:1066–1073. 1992.
View Article : Google Scholar : PubMed/NCBI
|
|
6
|
Zou W, Wolchok JD and Chen L: PD-L1
(B7-H1) and PD-1 pathway blockade for cancer therapy: Mechanisms,
response biomarkers, and combinations. Sci Transl Med.
8:328rv3242016. View Article : Google Scholar
|
|
7
|
Aggen DH and Drake CG: Biomarkers for
immunotherapy in bladder cancer: A moving target. J Immunother
Cancer. 5:942017. View Article : Google Scholar : PubMed/NCBI
|
|
8
|
Carosella ED, Ploussard G, LeMaoult J and
Desgrandchamps F: A systematic review of immunotherapy in urologic
cancer: Evolving roles for targeting of CTLA-4, PD-1/PD-L1, and
HLA-G. Eur Urol. 68:267–279. 2015. View Article : Google Scholar : PubMed/NCBI
|
|
9
|
Xue Y, Tong L, Liu F, Liu A, Liu A, Zeng
S, Xiong Q, Yang Z, He X, Sun Y and Xu C: Tumor infiltrating M2
macrophages driven by specific genomic alterations are associated
with prognosis in bladder cancer. Oncol Rep. 42:581–594.
2019.PubMed/NCBI
|
|
10
|
Miyake M, Tatsumi Y, Gotoh D, Ohnishi S,
Owari T, Iida K, Ohnishi K, Hori S, Morizawa Y, Itami Y, et al:
Regulatory T Cells and tumor-associated macrophages in the tumor
microenvironment in non-muscle invasive bladder cancer treated with
intravesical bacille calmette-guerin: A long-term follow-up study
of a Japanese cohort. Int J Mol Sci. 18:2017. View Article : Google Scholar : PubMed/NCBI
|
|
11
|
Jiang W, Zhu D, Wang C and Zhu Y: An
immune relevant signature for predicting prognoses and
immunotherapeutic responses in patients with muscle-invasive
bladder cancer (MIBC). Cancer Med. 9:2774–2790. 2020. View Article : Google Scholar : PubMed/NCBI
|
|
12
|
Yoshihara K, Shahmoradgoli M, Martinez E,
Vegesna R, Kim H, Torres-Garcia W, Treviño V, Shen H, Laird PW,
Levine DA, et al: Inferring tumour purity and stromal and immune
cell admixture from expression data. Nat Commun. 4:26122013.
View Article : Google Scholar : PubMed/NCBI
|
|
13
|
Hanzelmann S, Castelo R and Guinney J:
GSVA: Gene set variation analysis for microarray and RNA-seq data.
BMC Bioinformatics. 14:72013. View Article : Google Scholar : PubMed/NCBI
|
|
14
|
Witten DM and Tibshirani R: A framework
for feature selection in clustering. J Am Stat Assoc. 105:713–726.
2010. View Article : Google Scholar : PubMed/NCBI
|
|
15
|
Newman AM, Liu CL, Green MR, Gentles AJ,
Feng W, Xu Y, Hoang CD, Diehn M and Alizadeh AA: Robust enumeration
of cell subsets from tissue expression profiles. Nat Methods.
12:453–457. 2015. View Article : Google Scholar : PubMed/NCBI
|
|
16
|
da Silveira WA, Hazard ES, Chung D and
Hardiman G: Molecular profiling of RNA tumors using high-throughput
RNA sequencing: From raw data to systems level analyses. Methods
Mol Biol. 1908:185–204. 2019. View Article : Google Scholar : PubMed/NCBI
|
|
17
|
Ritchie ME, Phipson B, Wu D, Hu Y, Law CW,
Shi W and Smyth GK: Limma powers differential expression analyses
for RNA-sequencing and microarray studies. Nucleic Acids Res.
43:e472015. View Article : Google Scholar : PubMed/NCBI
|
|
18
|
Bhattacharya S, Andorf S, Gomes L, Dunn P,
Schaefer H, Pontius J, Berger P, Desborough V, Smith T, Campbell J,
et al: ImmPort: Disseminating data to the public for the future of
immunology. Immunol Res. 58:234–239. 2014. View Article : Google Scholar : PubMed/NCBI
|
|
19
|
Wan B, Liu B, Huang Y, Yu G and Lv C:
Prognostic value of immune-related genes in clear cell renal cell
carcinoma. Aging (Albany NY). 11:11474–11489. 2019. View Article : Google Scholar : PubMed/NCBI
|
|
20
|
Yu G, Wang LG, Han Y and He QY:
ClusterProfiler: An R package for comparing biological themes among
gene clusters. Omics. 16:284–287. 2012. View Article : Google Scholar : PubMed/NCBI
|
|
21
|
Heagerty PJ and Zheng Y: Survival model
predictive accuracy and ROC curves. Biometrics. 61:92–105. 2005.
View Article : Google Scholar : PubMed/NCBI
|
|
22
|
Fornes O, Castro-Mondragon JA, Khan A,
Khan A, Lee RVD, Zhang X, Richmond PA, Modi BP, Correard S,
Gheorghe M, et al: JASPAR 2020: Update of the open-access database
of transcription factor binding profiles. Nucleic Acids Res.
48:D87–d92. 2020.PubMed/NCBI
|
|
23
|
Song J, Deng Z, Su J, Yuan D, Liu J and
Zhu J: Patterns of immune infiltration in hnc and their clinical
implications: A gene expression-based study. Front Oncol.
9:12852019. View Article : Google Scholar : PubMed/NCBI
|
|
24
|
Ploeg M, Aben KK and Kiemeney LA: The
present and future burden of urinary bladder cancer in the world.
World J Urol. 27:289–293. 2009. View Article : Google Scholar : PubMed/NCBI
|
|
25
|
Babjuk M, Böhle A, Burger M, Capoun O,
Cohen D, Compérat EM, Hernández V, Kaasinen E, Palou J, Rouprêt M,
et al: EAU Guidelines on non-muscle-invasive urothelial carcinoma
of the bladder: Update 2016. Eur Urol. 71:447–461. 2017. View Article : Google Scholar : PubMed/NCBI
|
|
26
|
Felsenstein KM and Theodorescu D:
Precision medicine for urothelial bladder cancer: Update on tumour
genomics and immunotherapy. Nat Rev Urol. 15:92–111. 2018.
View Article : Google Scholar : PubMed/NCBI
|
|
27
|
Shu B, Zhang J, Sethuraman V, Cui G, Yi X
and Zhong G: Transcriptome analysis of Spodoptera frugiperda Sf9
cells reveals putative apoptosis-related genes and a preliminary
apoptosis mechanism induced by azadirachtin. Sci Rep. 7:132312017.
View Article : Google Scholar : PubMed/NCBI
|
|
28
|
Rui X, Shao S, Wang L and Leng J:
Identification of recurrence marker associated with immune
infiltration in prostate cancer with radical resection and build
prognostic nomogram. BMC Cancer. 19:11792019. View Article : Google Scholar : PubMed/NCBI
|
|
29
|
Zhang S, Zhang E, Long J, Hu Z, Peng J,
Liu L, Tang F, Li L, Ouyang Y and Zeng Z: Immune infiltration in
renal cell carcinoma. Cancer Sci. 110:1564–1572. 2019. View Article : Google Scholar : PubMed/NCBI
|
|
30
|
Rosenberg J and Huang J: CD8(+) T Cells
and NK cells: Parallel and complementary soldiers of immunotherapy.
Curr Opin Chem Eng. 19:9–20. 2018. View Article : Google Scholar : PubMed/NCBI
|
|
31
|
He QF, Xu Y, Li J, Huang ZM, Li XH and
Wang X: CD8+ T-cell exhaustion in cancer: Mechanisms and
new area for cancer immunotherapy. Brief Funct Genomics. 18:99–106.
2019. View Article : Google Scholar : PubMed/NCBI
|
|
32
|
Mitchell S, Vargas J and Hoffmann A:
Signaling via the NFκB system. Wiley Interdiscip Rev Syst Biol Med.
8:227–241. 2016. View Article : Google Scholar : PubMed/NCBI
|
|
33
|
Imanishi T and Saito T: T Cell
co-stimulation and functional modulation by innate signals. Trends
Immunol. 41:200–212. 2020. View Article : Google Scholar : PubMed/NCBI
|
|
34
|
Asprodites N, Zheng L, Geng D,
Velasco-Gonzalez C, Sanchez-Perez L and Davila E: Engagement of
Toll-like receptor-2 on cytotoxic T-lymphocytes occurs in vivo and
augments antitumor activity. Faseb J. 22:3628–3637. 2008.
View Article : Google Scholar : PubMed/NCBI
|
|
35
|
Chi D, Xu W, Tao X, Zhang T and Cui Y:
PD-L1 expression in colorectal cancer and its relationship with
TLR-4 expression. J Buon. 25:1423–1429. 2020.PubMed/NCBI
|
|
36
|
Dan L, Liu L, Sun Y, Song J, Yin Q, Zhang
G, Qi F, Hu Z, Yang Z, Zhou Z, et al: The phosphatase PAC1 acts as
a T cell suppressor and attenuates host antitumor immunity. Nat
Immunol. 21:287–297. 2020. View Article : Google Scholar : PubMed/NCBI
|
|
37
|
Elangovan IM, Vaz M, Tamatam CR, Potteti
HR, Reddy NM and Reddy SP: FOSL1 promotes kras-induced lung cancer
through amphiregulin and cell survival gene regulation. Am J Respir
Cell Mol Biol. 58:625–635. 2018. View Article : Google Scholar : PubMed/NCBI
|
|
38
|
Luo YZ, He P and Qiu MX: FOSL1 enhances
growth and metastasis of human prostate cancer cells through
epithelial mesenchymal transition pathway. Eur Rev Med Pharmacol
Sci. 22:8609–8615. 2018.PubMed/NCBI
|
|
39
|
Rodriguez-Aguayo C, Bayraktar E, Ivan C,
Aslan B, Mai J, He G, Mangala L, Jiang D, Nagaraja A, Ozpolat B, et
al: PTGER3 induces ovary tumorigenesis and confers resistance to
cisplatin therapy through up-regulation
Ras-MAPK/Erk-ETS1-ELK1/CFTR1 axis. EBioMedicine. 40:290–304. 2019.
View Article : Google Scholar : PubMed/NCBI
|
|
40
|
Coupland KG, Kim WS, Halliday GM, Hallupp
M, Dobson-Stone C and Kwok JB: Role of the long non-coding RNA
MAPT-AS1 in regulation of microtubule associated protein tau (MAPT)
expression in parkinson's disease. PLoS One. 11:e01579242016.
View Article : Google Scholar : PubMed/NCBI
|
|
41
|
Wosnitzer MS, Domingo-Domenech J,
Castillo-Martin M, Ritch C, Mansukhani M, Petrylack DP, Benson MC,
McKiernan JM and Cordon-Cardo C: Predictive value of microtubule
associated proteins tau and stathmin in patients with nonmuscle
invasive bladder cancer receiving adjuvant intravesical taxane
therapy. J Urol. 186:2094–2100. 2011. View Article : Google Scholar : PubMed/NCBI
|
|
42
|
Riese DJ 2nd and Cullum RL: Epiregulin:
roles in normal physiology and cancer. Semin Cell Dev Biol.
28:49–56. 2014. View Article : Google Scholar : PubMed/NCBI
|
|
43
|
Cao R, Yuan L, Ma B, Wang G, Qiu W and
Tian Y: An EMT-related gene signature for the prognosis of human
bladder cancer. J Cell Mol Med. 24:605–617. 2020. View Article : Google Scholar : PubMed/NCBI
|
|
44
|
Chen Z, Liu G, Hossain A, Danilova IG,
Bolkov MA, Liu G, Tuzankina IA and Tan W: A co-expression network
for differentially expressed genes in bladder cancer and a risk
score model for predicting survival. Hereditas. 156:242019.
View Article : Google Scholar : PubMed/NCBI
|
|
45
|
Liu S, Suo J, Wang C, Sun X, Wang D, He L,
Zhang Y and Li W: Prognostic significance of low miR-144 expression
in gastric cancer. Cancer Biomark. 20:547–552. 2017. View Article : Google Scholar : PubMed/NCBI
|