Introduction
Hepatocellular carcinoma (HCC) is one of the most
highly malignant and fatal cancers worldwide (1). It is the fourth leading cause of
cancer-associated mortality worldwide, with ~841,000 new cases and
782,000 mortalities per year (1).
The risk factors of HCC include hepatitis B virus or hepatitis C
virus infection, consumption of aflatoxin contaminated food,
alcohol abuse, obesity and smoking (2). Several strategies have been used for
HCC treatment, such as surgical resection, chemotherapy,
radiotherapy and targeted therapy (2). However, for patients with end-stage
HCC, the 5-year survival rate remains <10% (3). HCC is a neoplastic disease with complex
molecular mechanisms, which are affected by genetic or epigenetic
mutations, genomic instability and environmental factors (3,4). Chronic
inflammation, dysregulation of angiogenesis, changes in cellular
metabolism and abnormal endocrine hormones may also be involved in
the tumorigenesis of HCC (5).
Recently, several studies have revealed key signaling pathways and
genes that play critical roles in HCC (6,7).
However, the underlying molecular mechanisms of HCC onset and
progression remain unclear. Thus, it is important to investigate
the molecular mechanisms of HCC pathogenesis to identify key
molecular targets for the early diagnosis and treatment of patients
with HCC.
Recently, the development of high-throughput
sequencing and microarray technologies have provided a novel
platform for studies of gene expression profiles and identification
of key factors associated with tumor development. Microarray
technique is a method used to analyze general genetic alterations,
which has been extensively applied in the investigations of
tumorigenicity to identify promising biomarkers for cancer
diagnosis, treatment and prognosis (6,8). For
example, analysis of gene expression profiles of 64 primary
prostate tumors and 24 metastatic samples revealed that patients
with metastasis had 415 upregulated and 364 downregulated genes,
indicating high heterogeneity of the metastatic samples (9). Systematic analysis of publicly
available sequencing data using integrated bioinformatics methods
may be an efficient way to overcome limitations, such as the use of
different sequencing platforms or small sample sizes, and can
provide further insight for identifying novel diagnostic markers
and therapeutic targets in different types of tumor tissues, such
as endometrial cancer (10),
osteosarcoma (11), non-small cell
lung cancer (12) and gastric cancer
(13).
The present study analyzed three independent
sequencing datasets of HCC tissues and identified differentially
expressed genes (DEGs) using a series of bioinformatics analysis
methods. A protein-protein interaction (PPI) network was
constructed, and function enrichment and survival analyses were
performed to thoroughly investigate the molecular features of the
DEGs. In addition, the key targets affecting the tumorigenesis of
HCC cells were identified via biological function studies.
Materials and methods
Data source acquisition
The gene microarray expression datasets, GSE22058
(14,15), GSE57957 (16) and GSE14323 (17), including 186 HCC tissue samples and
150 adjacent tumor tissue samples, were downloaded from the Gene
Expression Omnibus (GEO) database (https://www.ncbi.nlm.nih.gov/geo). The microarray
datasets included in the present study satisfied the following
selection criteria: i) They included human HCC tissues and adjacent
tumor tissues; ii) the number of cases in the HCC and adjacent
tumor groups was at least 10 and iii) they had intact RNA
expression profiles for further analysis. The data acquisition and
application methods in the present study complied with the
guidelines and policies of the GEO database (18).
Identification of DEGs
The GSE22058, GSE57957 and GSE14323 expression
profiles were normalized and analyzed using the GEO2R tool
(https://www.ncbi.nlm.nih.gov/geo/geo2r). The criteria
of P<0.05 and |logFC|>1 was applied to screen for the DEGs.
The volcano plot of each dataset was constructed using the ‘volcano
R’ package (version 3.2.0; R Foundation). The overlap of DEGs
between the GSE22058, GSE57957 and GSE14323 datasets were
categorized as common DEGs, which were retained for further
studies.
PPI network and module analysis
The PPI network was constructed using Cytoscape
software (version 3.4.0; National Resource for Network Biology).
Associations between the DEG-encoded proteins were analyzed using
the Search Tool for the Retrieval of Interacting Genes/Proteins
(STRING) database (https://string-db.org/cgi/input.pl). PPIs with a
confidence score ≥0.4 were reserved.
Functional enrichment analysis of the
DEGs
Gene ontology (GO) enrichment and Kyoto Encyclopedia
of Genes and Genomes (KEGG) pathway analyses (19) were performed using the Database for
Annotation, Visualization and Integrated Discovery (DAVID)
(https://david.ncifcrf.gov) to identify
the biological processes, molecular functions and cellular
components, and signaling pathways associated with the DEGs.
P<0.05 was considered to indicate statistical significance.
Survival analysis
Overall survival (OS) and disease-free survival
(DFS) analyses of the integrated DEGs were performed using the
cBioPortal database (http://www.cbioportal.org). A total of five HCC
studies, including MSK, Clin Cancer Res 2018 (20); INSERM, Nat Genet 2015 (21); AMC, Hepatology 2014 (22); RIKEN, Nat Genet 2012 (23) and The Cancer Genome Atlas (TCGA)
(24), which included 1,000 patients
with clinical information, were selected. OS analysis was performed
using the Gene Expression Profiling Interactive Analysis (GEPIA)
database (http://gepia.cancer-pku.cn). A total
of 80 patients with HCC from the 920th Hospital were classified
into the high expression group (n=40) or the low expression group
(n=40), based on the median expression value (22.178) to determine
the prognosis of suppressor of cytokine signaling 2 (SOCS2) using
the ‘survival R’ package (version 3.2.0; R Foundation). P<0.05
was considered to indicate prognostic significance. Detailed
information of the 80 patients is listed in Table SV.
Expression levels of SOCS2, TAT, FOXO1
and SPINK in TCGA dataset
The mRNA expression and clinical data were
downloaded from TCGA-Liver Hepatocellular Carcinoma database
(TCGA-LIHC, http://tcga-data.nci.nih.gov/tcga), including 50
healthy individuals and 371 patients with HCC. The expression
levels of four prognosis-related genes (SOCS2, TAT, FOXO1 and
SPINK) were detected in healthy individuals and different
pathological stages of patients with HCC.
Receiver operating characteristic
(ROC) curve
ROC curves of SOCS2, TAT, FOXO1 and SPINK were
plotted based on their expression and sample feature (tumor vs.
normal) in the GSE22058 dataset to determine their diagnostic
values. The ROC curves were plotted using SPSS software (version
21; IBM Corp.).
Cell lines and clinical tissues
The HCC cell line, Huh7, was purchased from the
Chinese Academy of Sciences Cell Bank and maintained in DMEM medium
supplemented with 10% fetal bovine serum (Gibco; Thermo Fisher
Scientific, Inc.), at 37°C in 5% CO2.
A total of 12 pairs of HCC tissues and adjacent
normal tissues (5 cm away from HCC tissues) were collected from
patients with HCC who received surgical resection at the 920th
Hospital between June 2018 and October 2019. The patients included
9 men and 3 women (age range, 53–65 years; mean age, 60.17 years).
The histopathologic features of tumor tissues and adjacent normal
tissues were confirmed by H&E staining. Fresh clinical samples
were stored at −80°C until subsequent experimentation. The present
study was approved by the Ethics Committee of the 920th Hospital
(Kunming, China; approval no. 2018-020-01) and written informed
consent was provided by all patients prior to the study start.
Reverse transcription-quantitative
(RT-q)PCR
Total RNA was extracted from Huh7 cells using
TRIzol® reagent (Invitrogen; Thermo Fisher Scientific,
Inc.), according to the manufacturer's protocol. A total of 1 µg
RNA was reverse transcribed into cDNA using the Hifair®
II 1st Strand cDNA Synthesis SuperMix kit (Yeasen Biotech Co.),
under the following conditions: 25°C for 5 min, 55°C for 15 min and
85°C for 5 min. qPCR was subsequently performed using the
Hieff® qPCR SYBR Green Master Mix kit (Yeasen Biotech
Co.) in QuantStudio™ 5 System (Thermo Fisher Scientific, Inc.). The
following thermocycling conditions were used for qPCR: 95°C for 5
min, followed by 40 cycles at 95°C for 10 sec, 60°C for 30 sec and
elongation at 72°C for 2 min. The following primer sequences were
used for qPCR: SOCS2 forward, 5′-GAGCCGGAGAGTCTGGTTTC-3′ and
reverse, 5′-ATCCTGGAGGACGGATGACA-3′; and GAPDH forward,
5′-GGTCTCCTCTGACTTCAACA-3′ and reverse, 5′-GTGAGGGTCTCTCTCTTCCT-3′.
Relative mRNA levels were calculated using the 2−ΔΔCq
method (25) and normalized to the
internal reference gene GAPDH.
Plasmid construction and cell
transfection
To generate the SOCS2 overexpression construct, the
SOCS2 ORF sequence was amplified via RT PCR and cloned into a
pcDNA3.1 vector (Addgene) (OE). An empty pcDNA3.1 vector was used
as the negative control (NC). SOCS2-specific small interfering
(si)RNA and control siRNA were designed by Shanghai GenePharma Co.,
Ltd. The primer sequences used for vector construction and siRNA
sequences were as follows: SOCS2 forward,
5′-GGATCCATGACCCTGCGGTGCCTTGAG-3′ and reverse,
5′-CTCGAGTTATACCTGGAATTTATATTCTTC-3′; control siRNA,
5′-GGATCAACTAACTTCCGAA-3′; and SOCS2 siRNA,
5′-GGACCAACTAATCTTCGAA-3′. Cells were transfected with the plasmids
(2.5 µg) or siRNAs (50 nM) using Lipofectamine® 3000
reagent (Invitrogen; Thermo Fisher Scientific, Inc.) in 6-well
plates, according to the manufacturer's protocol. Following
incubation for 48 h at 37°C, transfected cells were harvested for
subsequent experimentation.
Western blotting
Total protein was extracted from Huh7 cells using
RIPA lysis buffer (Beyotime Institute of Biotechnology), containing
×100 protease inhibitor cocktail (Bio-Rad Laboratories, Inc.).
Protein concentrations of lysates were detected using the
bicinchoninic acid (BCA) assay (Beyotime Institute of
Biotechnology). Equal amounts of protein lysates (20 µg/well) were
separated by 10% SDS-PAGE, transferred onto polyvinylidene
difluoride membranes (Bio-Rad Laboratories, Inc.) and blocked with
5% skim milk solution for 1 h at room temperature. The membranes
were incubated with primary antibodies against SOCS2 (cat. no.
A5703) and GAPDH (cat. no. AC001) (both 1:1,000 and purchased from
ABclonal Biotech Co., Ltd.) overnight at 4°C. Following the primary
incubation, membranes were incubated with horseradish
peroxidase-conjugated Goat Anti-Rabbit IgG secondary antibody
(1:2,000; cat. no. AS014; ABclonal Biotech Co., Ltd.) for 1 h at
room temperature. Protein bands were visualized using BeyoECL Plus
regent (Beyotime Institute of Biotechnology) in ImageQuant LAS4000
(GE Healthcare). GAPDH was used as the loading control.
Cell proliferation assay
HCC cells were transfected with the indicated siRNAs
or plasmids for 24 h. Subsequently, cells were seeded into 96-well
culture plates at a density of 4,000 cells/well. Cell proliferation
was assessed via the Cell Counting Kit-8 (CCK-8) assay (Dojindo
Molecular Technologies, Inc.) at 0, 12, 24, 36 and 48 h following
cell culture. The cell proliferation curve at each time point was
plotted using the values of relative absorbance. EdU
immunofluorescence staining was performed using the EdU kit (Thermo
Fisher Scientific, Inc.), according to the manufacturer's protocol.
The results were quantified using ImageJ software (version 1.8.0;
National Institutes of Health).
Wound healing assay
HCC cells were seeded into 6-well plates at a
density of 4×10⁵ cells/well and cultured until they
reached 90% confluency. The cell monolayers were subsequently
scratched using 200 µl pipette tips to create a gap. Cells were
washed with phosphate buffered saline and cultured in fresh DMEM
serum-free medium (Gibco; Thermo Fisher Scientific, Inc.). Images
were acquired at 0 and 24 h using the Olympus IX73 light microscope
(Olympus Corporation) to assess cell migration. Wounded areas
between the cells were analyzed using ImageJ software (version
1.8.0; National Institutes of Health).
Statistical analysis
Statistical analysis was performed using GraphPad
Prism 6 software (GraphPad Software, Inc.). All in vitro
experiments were performed in triplicate and data are presented as
the mean ± standard deviation. A two-tailed unpaired or paired
Student's t-tests were used to compare differences between two
groups. One-way ANOVA followed by Dunnett's test were used to
compare differences between multiple groups. Pearson's correlation
analysis was performed to determine the correlation between SOCS2
and FOXO1 expression. Survival curves were obtained via
Kaplan-Meier analysis and the log-rank test between patients in the
high and low expression groups, and Landmark analysis was performed
when the survival curves cross. Age, gender, stage and SOCS2
expression level of 80 HCC patients were made for univariate and
multivariate Cox analyses using SPSS software (version 21; IBM
Corp.). P<0.05 was considered to indicate a statistically
significant difference.
Results
Identification of DEGs
To identify the key DEGs in a large cohort of HCC
samples, three sequencing datasets from the GEO database were
selected, including HCC samples and adjacent normal tumor samples.
Detailed information of the three datasets are presented in
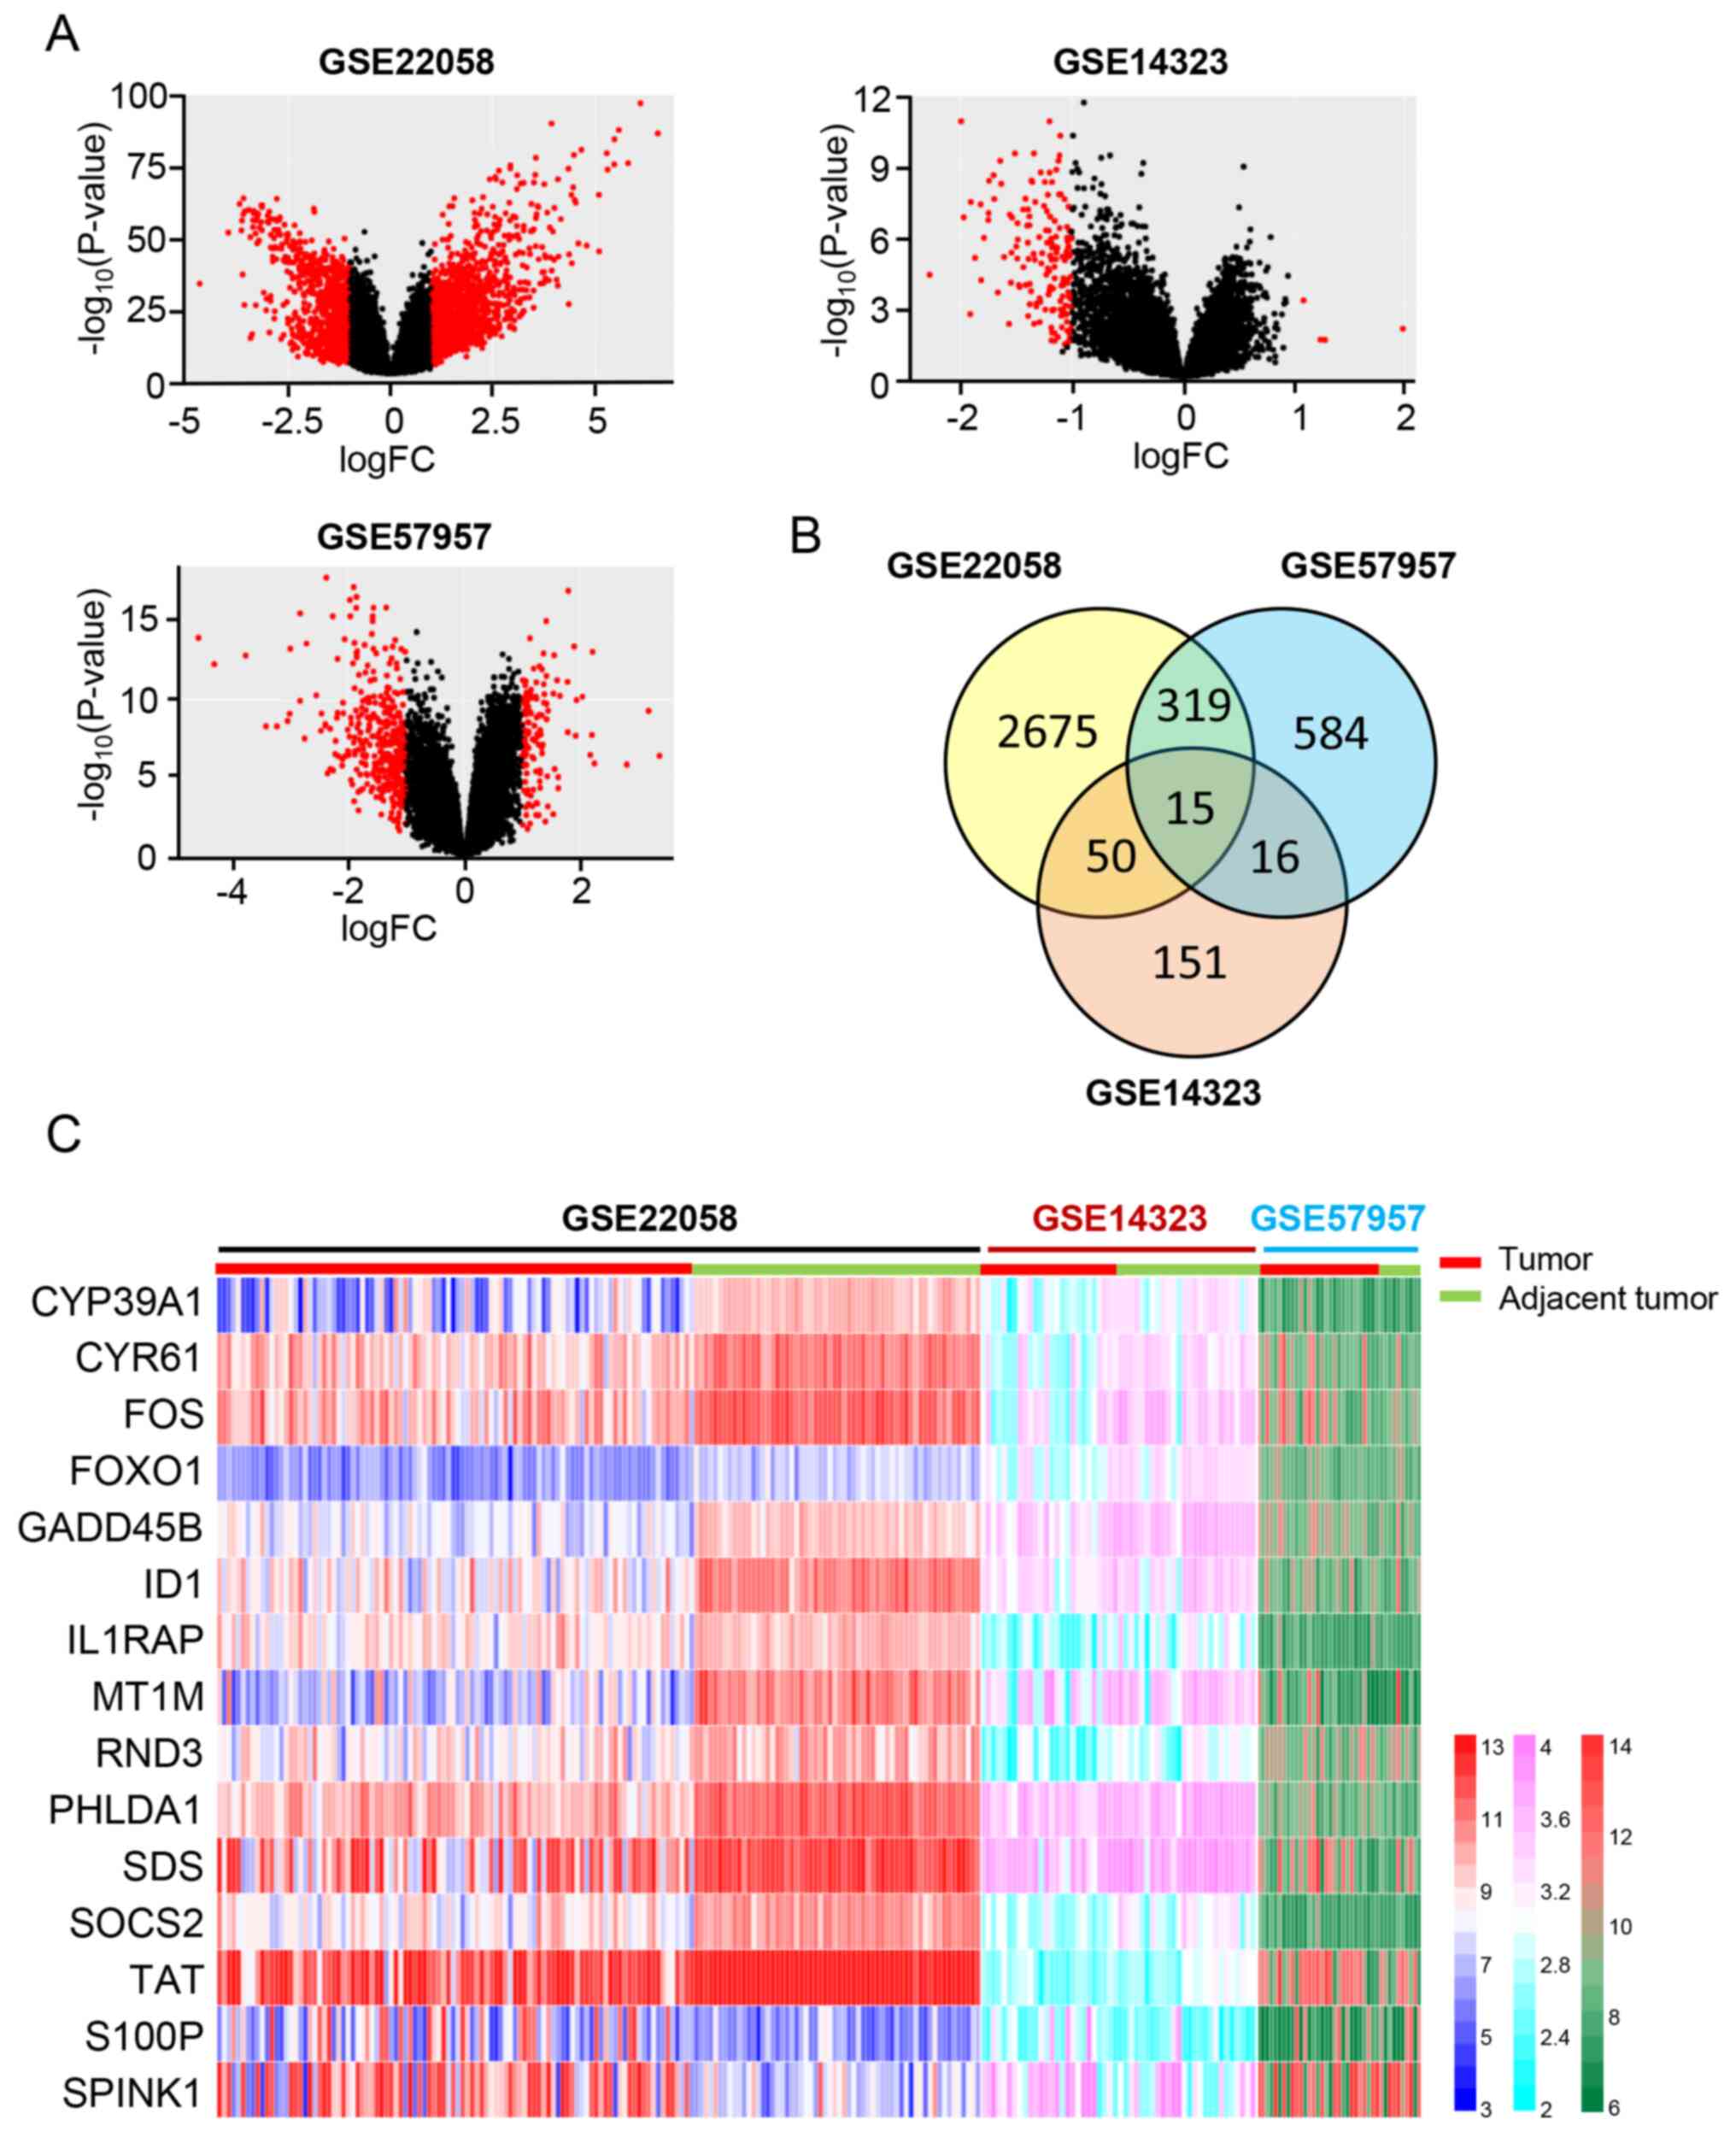
Table I. According to the screening
criteria, a total of 2,657 DEGs were identified between the HCC
tissues and adjacent normal tumor tissues in the GSE22058 dataset,
which included 981 upregulated genes and 1,694 downregulated genes.
A total of 584 DEGs were identified in the GSE57957 dataset, which
consisted of 256 upregulated genes and 328 downregulated genes in
HCC tissues compared with adjacent normal tumor tissues. The DEGs
obtained from the GSE14323 dataset included five upregulated genes
and 146 downregulated genes in HCC tissues. The volcano plots of
the three datasets are presented in Fig.
1A. A total of 15 overlapping DEGs (13 downregulated genes and
two upregulated genes) were identified by intersecting the three
datasets (Fig. 1B and Table II). The heat map displays the
detailed expression data of these 15 DEGs in each tissue sample of
the three sequencing datasets (Fig.
1C).
 | Table I.Gene Expression Omnibus datasets used
in the present study. |
Table I.
Gene Expression Omnibus datasets used
in the present study.
|
| Number of
samples |
|
|---|
|
|
|
|
|---|
| Dataset | Tumor tissues | Adjacent normal
tumor tissues | (Refs.) |
|---|
| GSE22058 | 100 | 97 | (14,15) |
| GSE57957 | 39 | 39 | (16) |
| GSE14323 | 47 | 14 | (17) |
| Table II.Detailed information of the 15 key
differentially expressed genes. |
Table II.
Detailed information of the 15 key
differentially expressed genes.
|
|
| GSE22058 | GSE57957 | GSE14323 |
|---|
|
|
|
|
|
|
|---|
| Gene symbol | Gene title | P-value | logFC | P-value | logFC | P-value | logFC |
|---|
| CYP39A1 | Cytochrome P450
family 39 subfamily A member 1 |
6.33×10⁻²⁹ | −2.93 |
1.55×10⁻¹³ | −1.55 | 0.000307 | −1.11 |
| CYR61 | Cysteine rich
angiogenic inducer 61 |
3.11×10⁻²⁹ | −1.66 |
1.23×10−07 | −1.40 | 0.000624 | −1.12 |
| FOS | Fos proto-oncogene,
AP-1 transcription factor subunit |
2.75×10⁻²⁹ | −2.05 |
1.17×10⁻¹³ | −2.54 | 0.00240 | −1.21 |
| FOXO1 | Forkhead
transcription factor 1 |
4.62×10⁻²² | −1.25 |
9.36×10⁻¹⁰ | −1.12 |
3.51×10−04 | −1.22 |
| GADD45B | Growth arrest and
DNA damage inducible β |
3.86×10⁻³⁵ | −1.79 |
6.63×10⁻¹² | −1.58 | 0.000124 | −1.06 |
| ID1 | Inhibitor of DNA
binding 1, HLH protein |
3.89×10−41 | −2.54 |
2.06×10−08 | −1.42 | 0.000219 | −1.03 |
| IL1RAP | Interleukin-1
receptor accessory protein |
2.24×10⁻¹⁴ | −1.02 |
4.64×10⁻¹¹ | −1.34 | 0.000798 | −1.09 |
| MT1M |
Metallothionein-1M |
2.23×10−53 | −3.97 |
4.54×10⁻¹⁰ | −2.75 | 0.00324 | −1.22 |
| PHLDA1 | Pleckstrin
homology-like domain family A member 1 |
4.83×10⁻²¹ | −1.67 |
5.45×10−05 | −1.09 |
1.28×10−04 | −1.40 |
| RND3 | Rho family GTPase
3 |
2.45×10−42 | −1.94 |
1.94×10⁻¹³ | −1.64 |
1.32×10−04 | −1.03 |
| SDS | Serine
dehydratase |
2.16×10⁻¹⁵ | −2.25 |
8.1×10−07 | −1.95 | 0.00144 | −1.04 |
| SOCS2 | Suppressor of
cytokine signaling 2 |
2.95×10⁻³⁴ | −2.13 |
3.66×10⁻¹⁰ | −1.24 | 0.000347 | −1.00 |
| TAT | Tyrosine
aminotransferase |
1.64×10⁻¹² | −1.38 |
6.28×10−08 | −2.10 |
1.40×10−09 | −1.40 |
| S100P | S100
calcium-binding protein P |
6.41×10−08 | 1.73 | 0.000373 | 1.25 | 0.00182 | 1.27 |
| SPINK1 | Serine protease
inhibitor Kazal-type 1 |
6.06×10⁻¹³ | 2.67 |
1.1×10−08 | 3.38 | 0.001 | 1.93 |
PPI network and functional enrichment
analysis of DEGs
To determine the associations between DEG-encoded
proteins, a PPI network was constructed using the STRING database.
In total, 34 proteins, 14 DEGs and 20 neighbor genes were obtained,
and 251 edges were included in the PPI network (Fig. S1A). In the network, a large protein
node indicated a strong ability to interact with other proteins.
The top five highest value nodes were serine/threonine-protein
kinase 1, V-Jun avian sarcoma virus 17 oncogene homolog,
mitogen-activated protein kinase 8, mammalian target of rapamycin
and early growth response 1, all of which have been reported to be
involved in the development of multiple tumors (26–29). The
top five highest value DEGs were Fos proto-oncogene (FOS), SOCS2,
forkhead transcription factor 1 (FOXO1), growth arrest and DNA
damage inducible β (GADD45B) and cysteine rich angiogenic inducer
61 (CYR61), which are also considered to play critical roles in
tumor progression (30–34).
GO and KEGG enrichment analyses of the DEGs were
performed using DAVID. The results demonstrated that the DEGs were
predominantly enriched in ‘nucleoplasm’ and ‘transcription factor
AP-1 complex’. Furthermore, they were significantly enriched in
multiple biological processes and molecular functions associated
with response to ‘abiotic stimuli’, ‘regulation of cell death’,
‘transcription factor binding’ and ‘activity of DNA-binding
transcription activator’ (Fig.
S1B-D and Tables SI–III). According to KEGG pathway enrichment
analysis, the DEGs were significantly involved in ‘colorectal
cancer’, ‘FOXO signaling pathway’, ‘osteoclast differentiation’,
‘insulin signaling pathway’ and ‘prolactin signaling pathway’
(Fig. S1E and Table SIV).
Survival analysis
According to the clinical information of patients
with HCC in the cBioPortal database, five HCC studies; MSK, Clin
Cancer Res 2018 (20); INSERM, Nat
Genet 2015 (21); AMC, Hepatology
2014 (22); RIKEN, Nat Genet 2012
(23) and TCGA (24), were selected to determine the
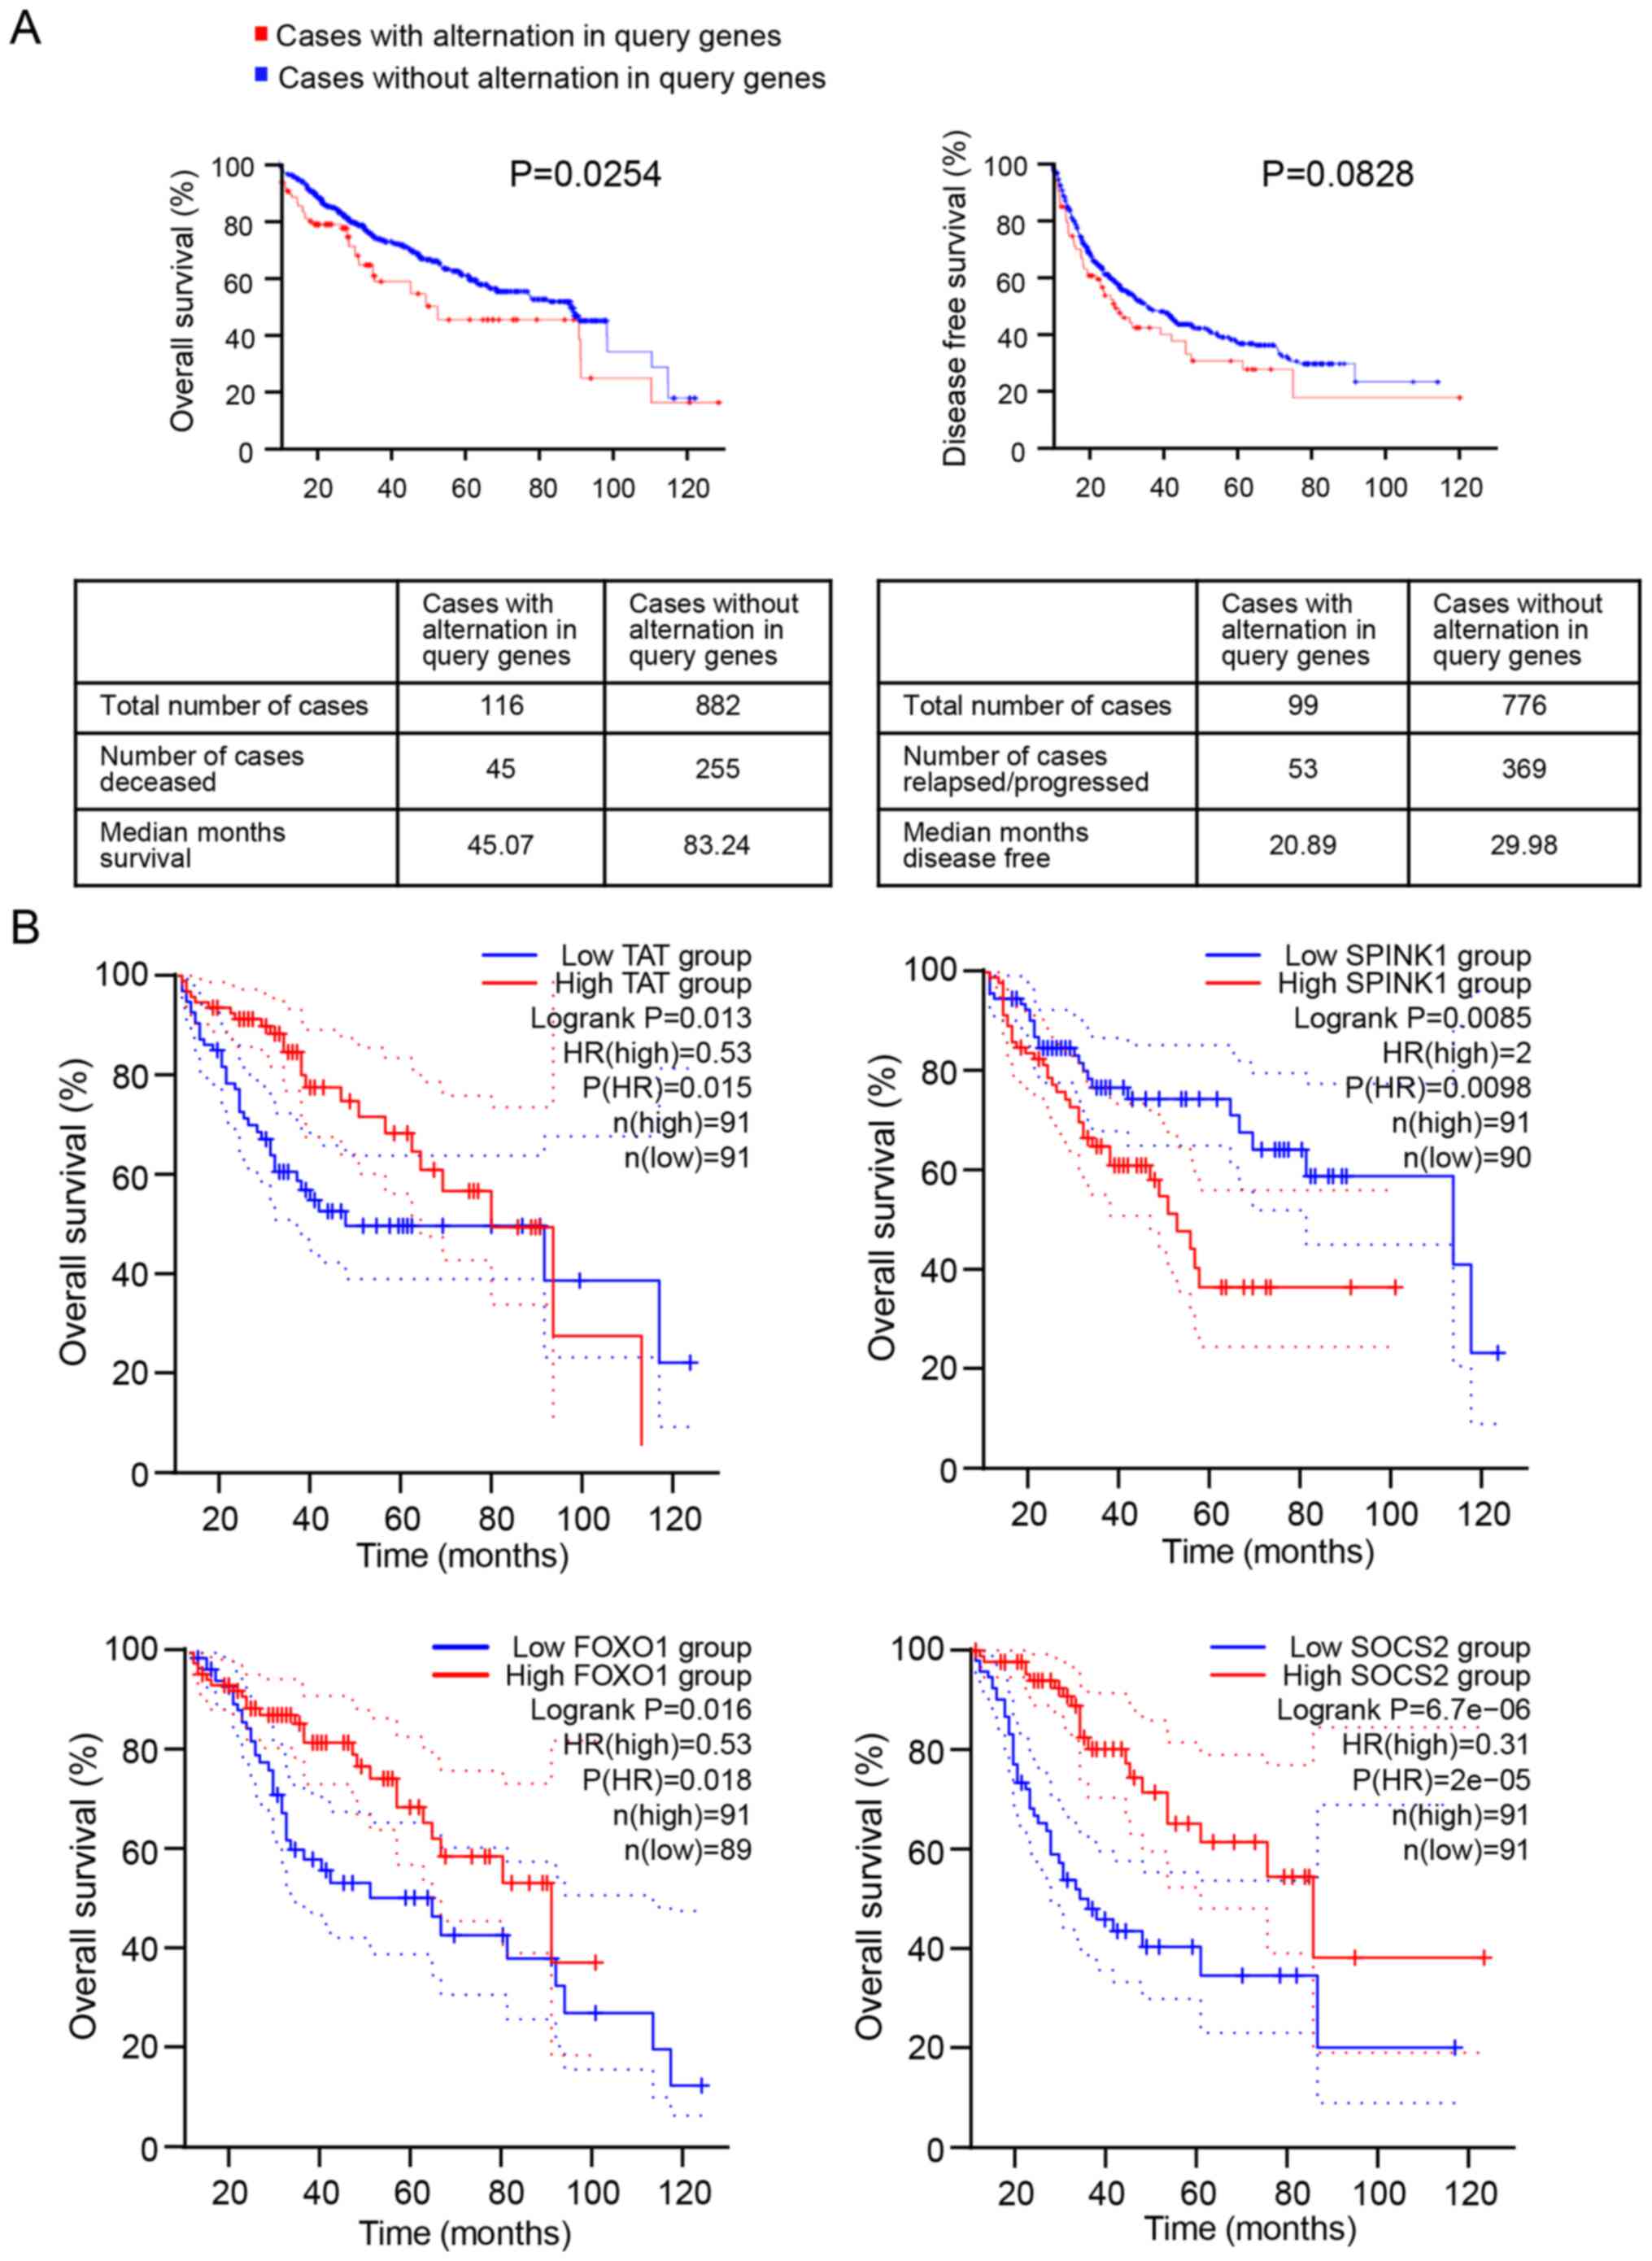
prognostic values of the 15 DEGs. As presented in Fig. 2A, expression alteration of the 15
DEGs was significantly associated with a shorter OS time of
patients with HCC (P=0.0254). The median survival time of 116
patients with DEG expression changes was 45.07 months, and the
median survival time of 882 patients without alterations in DEG
expression was 83.24 months. However, no significant difference was
observed between the alteration of DEG levels and the DFS time of
patients with HCC (P=0.0828).
To further investigate the association between the
15 DEGs and OS time of patients with HCC, Kaplan-Meier survival
analysis of each DEG was performed using the GEPIA database. The
results demonstrated that only four DEGs were significantly
associated with the OS time of patients with HCC, including FOXO1
(P=0.016), serine protease inhibitor Kazal-type 1 (SPINK1,
P=0.0085), SOCS2 (P=6.7×10−06) and tyrosine
aminotransferase (TAT, P=0.013) (Figs.
2B and S2). Notably, low
expression levels of FOXO1, SOCS2 and TAT, and high SPINK1
expression were associated with poor prognosis of patients with
HCC.
SOCS2 is associated with HCC stages
and demonstrates good diagnostic ability for HCC
The expression levels of the four prognosis-related
DEGs in TCGA dataset were assessed. The results demonstrated that
the expression levels of FOXO1, SOCS2 and TAT were significantly
downregulated in HCC tissues, whereas SPINK1 expression was
significantly upregulated in HCC tissues compared with adjacent
normal tissues. In addition, FOXO1 and SOCS2 expression were
associated with HCC progression, whereby lower expression levels
were observed in stage 4 patients with HCC (Fig. 3A). Furthermore, FOXO1 expression was
positively correlated with SOCS2 in the GSE22058 dataset (Fig. 3B). ROC curve analysis demonstrated
that SOCS2 presented a good diagnostic ability for HCC (Fig. 3C), and its area under the curve (AUC)
value was 0.940 [95% confidence interval (CI), 0.906–0.975]. The
AUC value of TAT, FOXO1 and SPINK1 were 0.827 (95% CI,
0.764–0.891), 0.891 (95% CI, 0.838–0.944) and 0.209 (95% CI,
0.138–0.280), respectively (Table
SV).
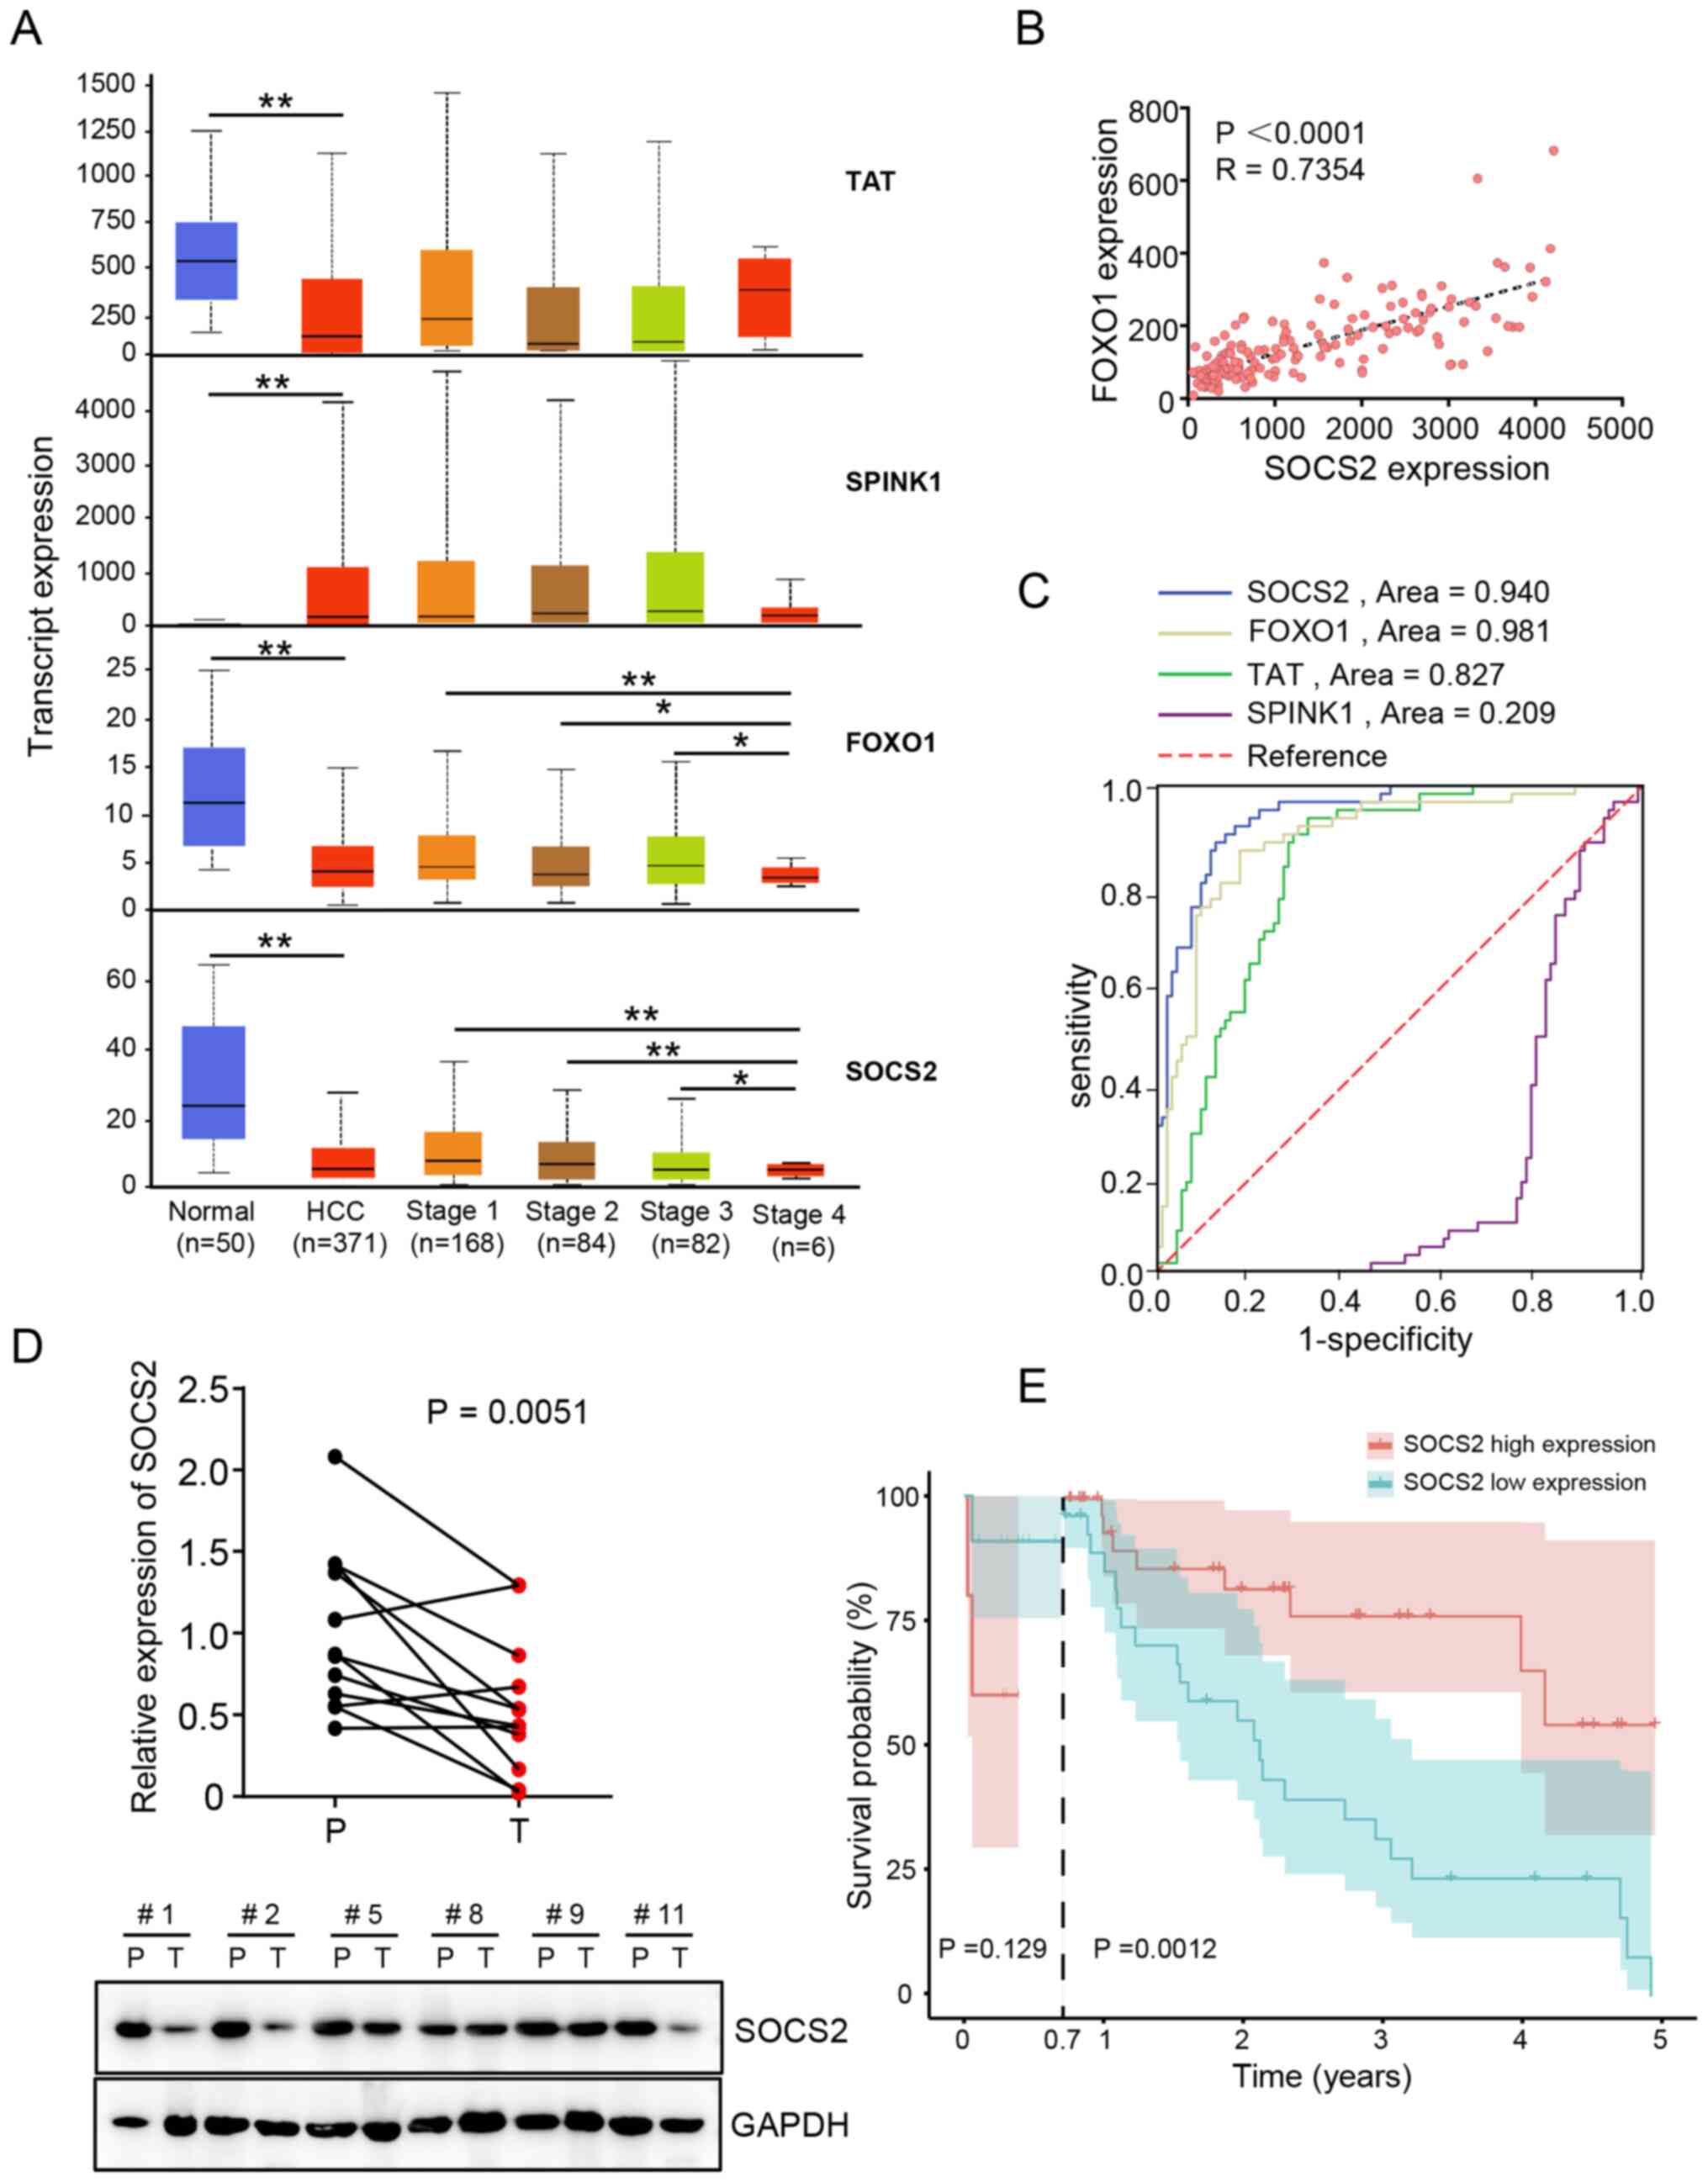 | Figure 3.SOCS2 is a potential diagnostic
marker for HCC. (A) The expression levels of the four key DEGs in
The Cancer Genome Atlas HCC dataset. (B) FOXO1 expression was
positively correlated with SOCS2 expression in the GSE22058
dataset. (C) Receiver operating characteristic curves of the four
key DEGs were used to determine their diagnostic values. (D) SOCS2
mRNA (above, n=12 pairs) and protein (below, n=6 pairs) expression
levels in clinical tissues. (E) Overall survival analysis of 80
patients with HCC from the 920th Hospital, based on SOCS2
expression. *P<0.05, **P<0.01 SOCS2, suppressor of cytokine
signaling 2; HCC, hepatocellular carcinoma; DEGs, differentially
expressed genes; FOXO1, forkhead transcription factor 1; SPINK1,
serine protease inhibitor Kazal-type 1; TAT, tyrosine
aminotransferase; P, normal tissue; T, HCC tissue. |
SOCS2 expression was further validated in 12 pairs
of clinical HCC tissues and adjacent normal tissues. The results
demonstrated that SOCS2 mRNA and protein expression levels were
downregulated in HCC tissues compared with adjacent normal tissues
(Fig. 3D). Based on the median SOCS2
expression values, 80 patients with HCC from the 920th Hospital
were classified into the high expression group (n=40) or the low
expression group (n=40) (Table
SVI). Long-term follow-up (0.7–5.0 years) showed that HCC cases
in the low expression group were associated with a poor prognosis
compared with the high expression group (P=0.0012), while there was
no significant difference between the two groups in the short-term
follow-up (0.0–0.7 years) (Fig. 3E).
Furthermore, univariate and multivariate Cox analyses demonstrated
that HCC clinical stage 1 and SOCS2 levels were independent
prognostic factors for patients with HCC (Table III).
| Table III.Univariate and multivariate Cox
analyses of hepatocellular carcinoma clinical characteristics and
SOCS2 expression. |
Table III.
Univariate and multivariate Cox
analyses of hepatocellular carcinoma clinical characteristics and
SOCS2 expression.
|
| Univariate
analysis | Multivariate
analysis |
|---|
|
|
|
|
|---|
| Variable | HR (95% CI) | P-value | HR (95% CI) | P-value |
|---|
| Age | 1.005
(0.986–1.024) | 0.593 | – | – |
| Gender | 1.033
(0.565–1.888) | 0.916 | – | – |
| Stage |
|
|
|
|
| I | 2.338
(1.245–4.392) | 0.008 | 2.295
(1.093–4.821) | 0.028 |
| II | 0.657
(0.347–1.245) | 0.198 | – | – |
|
III/IV | 0.517
(0.270–0.989) | 0.046 | 1.128
(0.512–2.485) | 0.765 |
| SOCS2 | 0.968
(0.942–0.994) | 0.018 | 0.968
(0.941–0.996) | 0.024 |
SOCS2 is a tumor suppressor for HCC
progression
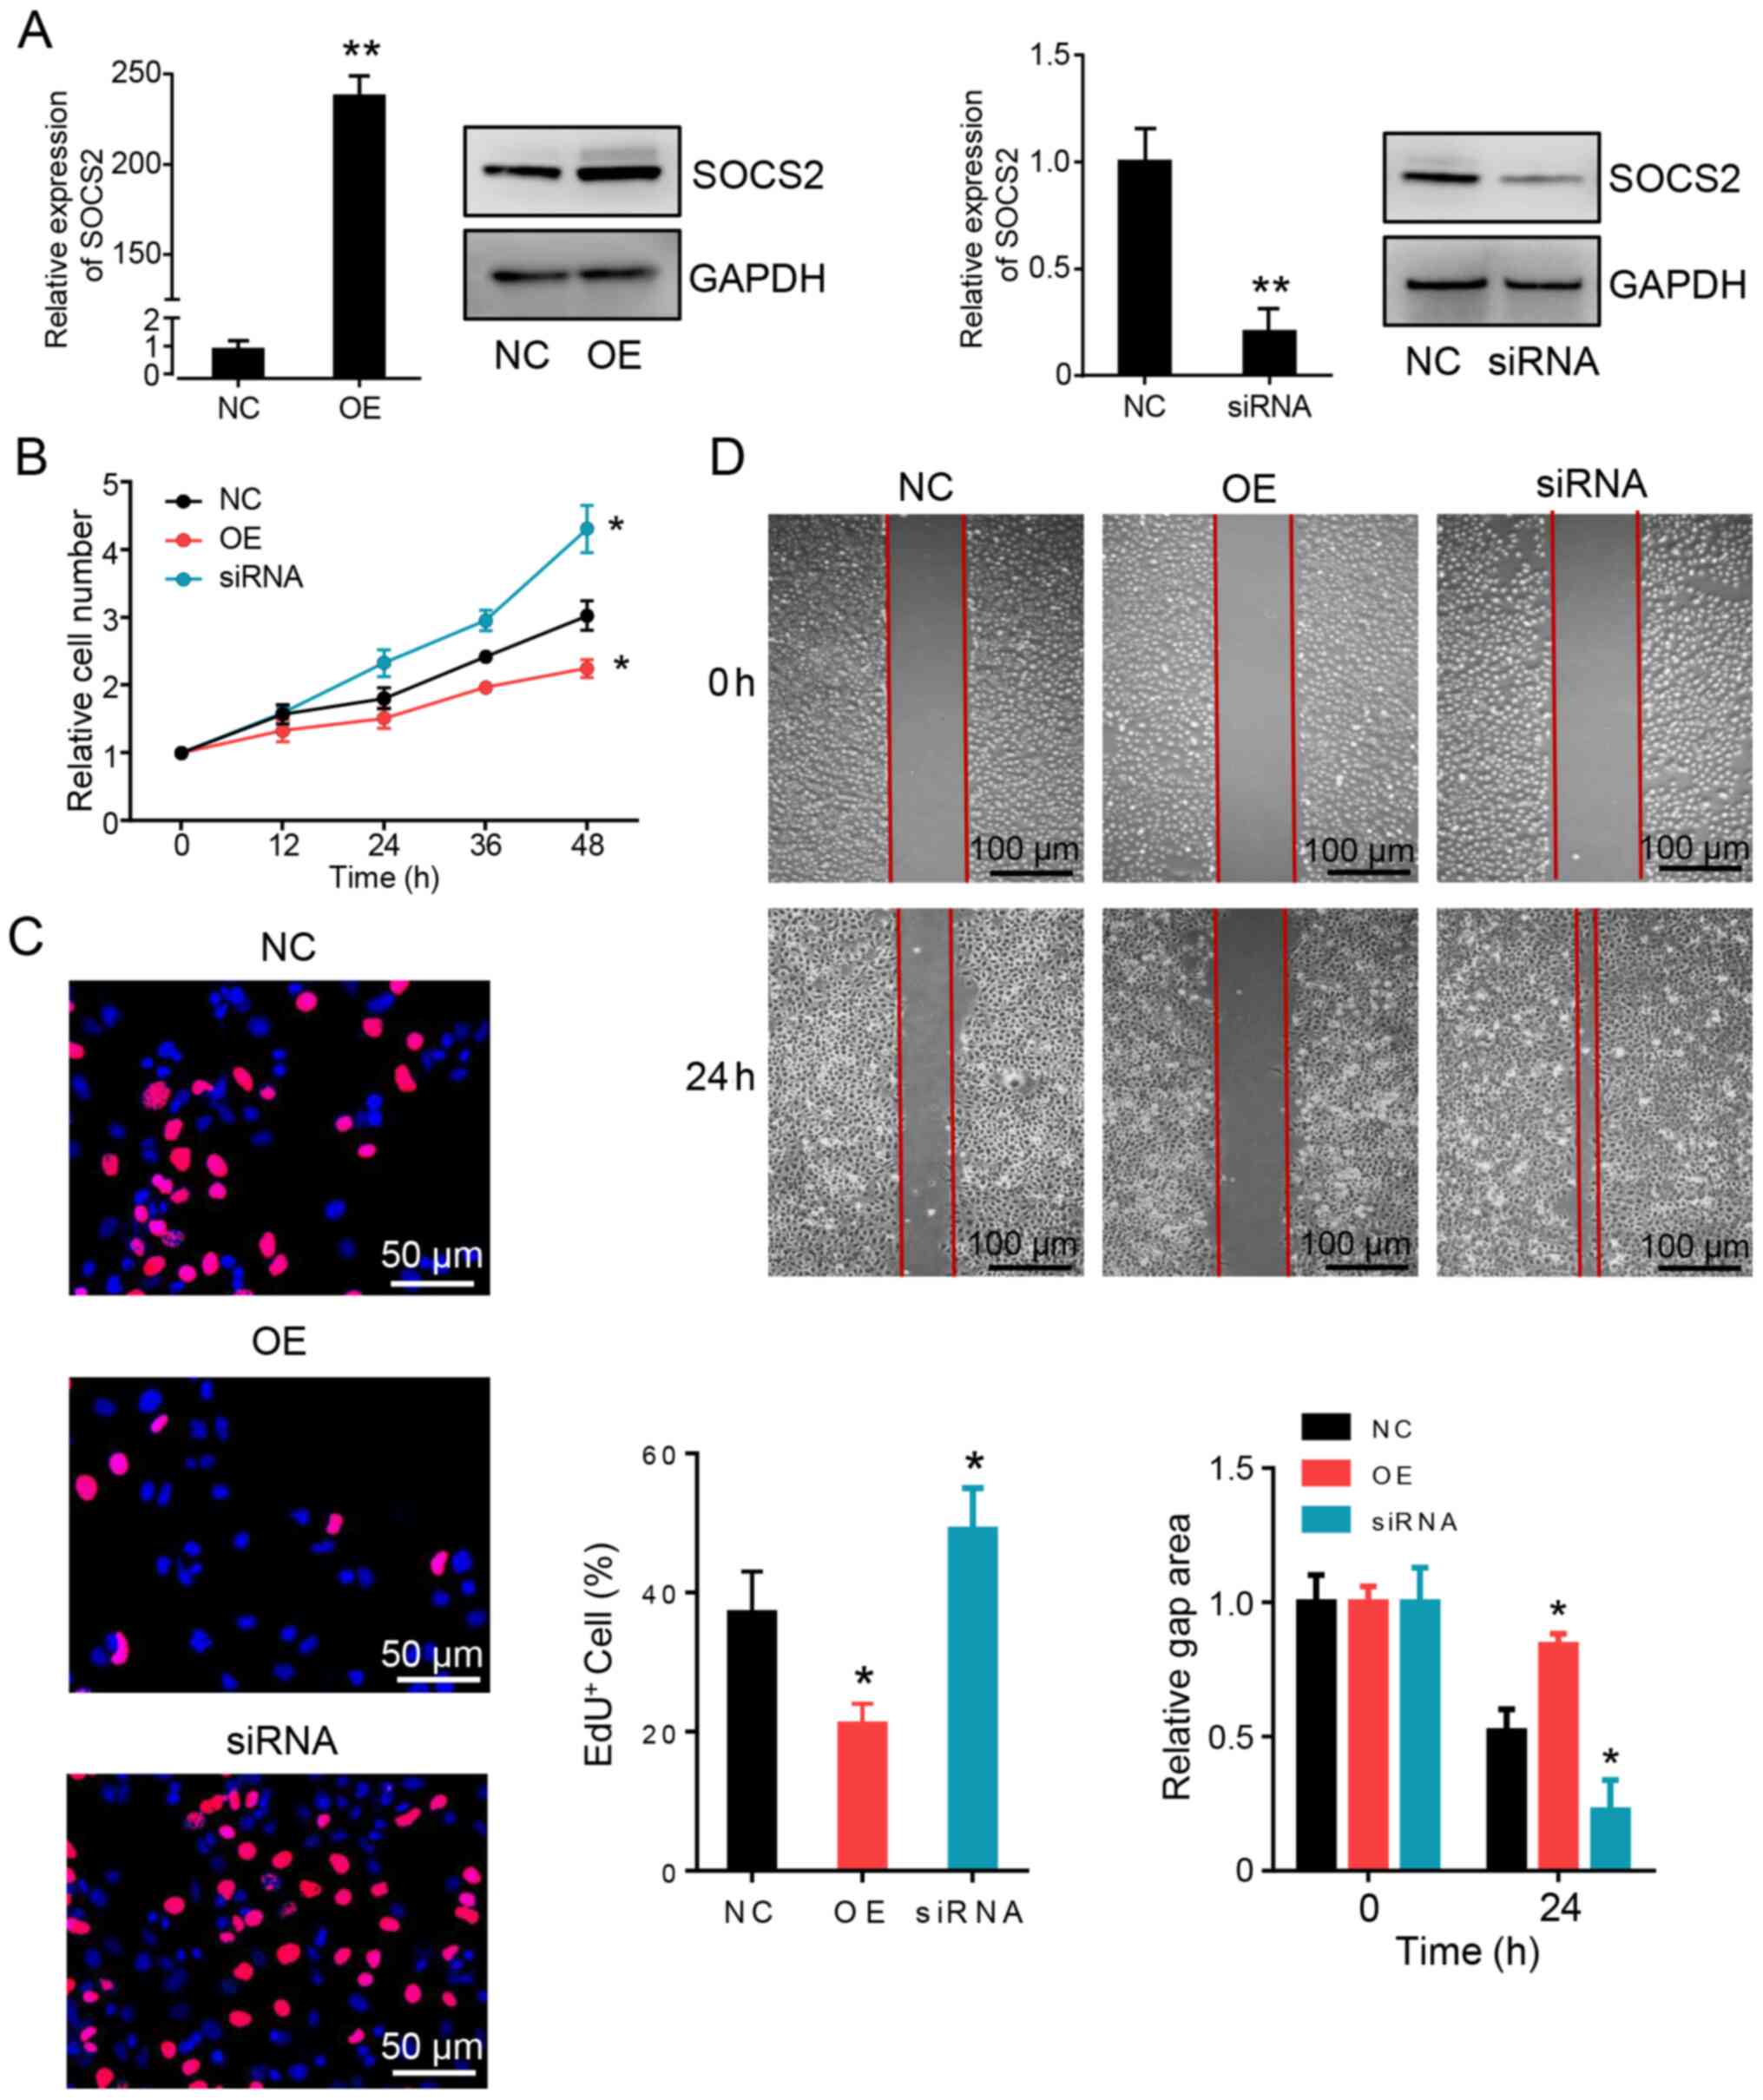
To determine the biological function of SOCS2 in HCC
cells, SOCS2 expression in Huh7 cells was exogenously changed using
recombinant expression plasmids and siRNAs. Both the overexpression
and knockdown phenotypes of SOCS2 were confirmed via RT-qPCR and
western blot analyses (Fig. 4A).
Ectopic overexpression of SOCS2 inhibited HCC cell proliferation,
as measured by the CCK-8 assay (Fig.
4B) and EdU staining (Fig. 4C).
The wound healing assay demonstrated that overexpression of SOCS2
inhibited HCC cell metastasis compared with cells in the control
group (Fig. 4D). Notably, SOCS2
knockdown promoted HCC cell proliferation and metastasis. Taken
together, these results suggest that SOCS2 inhibits tumorigenesis
in HCC cells.
Discussion
HCC carcinogenesis is a sophisticated and complex
pathological process associated with specific tumor genes, multiple
signaling cascades and epigenetic modifications (35,36).
Recently, bioinformatics analyses have been extensively performed
to identify novel diagnostic markers and therapeutic targets for
different types of cancer (37,38),
thus providing useful tools in tumor research.
The present study performed bioinformatics analyses
to investigate the DEGs between HCC tissues and adjacent normal
tumor tissues, based on three independent GEO expression datasets.
A total of 15 overlapping DEGs were identified, including
cytochrome P450 family 39 subfamily A member 1, CYR61, FOS, FOXO1,
GADD45B, inhibitor of DNA binding 1, interleukin-1 receptor
accessory protein, metallothionein-1M, pleckstrin homology-like
domain family A member 1, Rho family GTPase 3, serine dehydratase,
SOCS2, TAT, S100 calcium-binding protein P and SPINK1, all of which
exhibited consistent expression patterns in the three sequencing
datasets. A total of four potentially prognostic DEGs (FOXO1,
SPINK1, SOCS2 and TAT) were further identified via Kaplan-Meier
analysis.
FOXO1 is one of the forkhead family transcription
factors, which participates in several processes of tumor
development (30,39). It is well-known that FOXO1 expression
is downregulated in the early stages of human pancreatic ductal
adenocarcinoma, and may function as a valuable diagnostic marker
(39). Sequencing analyses have
demonstrated that FOXO1 and paired box 3 (PAX3) expression are
upregulated in alveolar rhabdomyosarcoma; double knockdown of PAX3
and FOXO1 significantly inhibits tumor cell proliferation, survival
and migration by targeting interleukin-24 (30). SOCS2 is involved in the inhibition of
signal transduction (40). It has
been reported that SOCS2 regulates the immune response during acute
liver injury caused by acetaminophen (41). SOCS2 also plays a critical role in
the development of prostate cancer (42). TAT is a tyrosine transaminase that is
predominantly expressed in liver tissues, and its deficiency can
lead to tyrosinemia (43). Low TAT
expression has been observed in HCC and is associated with tumor
progression (44). Previous studies
have reported that SPINK1 is associated with the development of
different types of cancer (8,45,46).
Microarray analysis has demonstrated that SPINK1 expression is
upregulated in HCC, which promotes the proliferation, migration and
invasion of HCC cells (45). SOCS2
was selected as a hub gene in the present study due to its
pathological stage association and good diagnostic ability in
patients with HCC. Functional studies demonstrated that
overexpression of SOCS2 inhibited HCC cell proliferation and
migration, whereas SOCS2 knockdown promoted HCC tumorigenesis,
suggesting that SOCS2 may function as a tumor suppressor in HCC
development.
The present study was not without limitations.
First, mechanistic experiments for the antitumor role of SOCS2 are
required to determine the molecular mechanism of SOCS2 in HCC
progression. Secondly, the present study only investigated the
function of SOCS2 in HCC cells. Further biological experiments are
required to validate the roles of other DEGs in the diagnosis and
treatment of HCC. Thirdly, the quality and heterogeneity of the
public data that were uploaded by other researchers and used in the
present study cannot be accurately determined.
In conclusion, the present study identified four key
DEGs from the HCC gene expression profile datasets using integrated
bioinformatics analyses. The PPI network, and functional enrichment
and prognostic analyses suggest that these DEGs may be involved in
the pathogenesis and prognosis of HCC. In addition, the antitumor
role of SOCS2 was investigated, and the results demonstrated that
SOCS2 may serve as a potential diagnostic marker in patients with
HCC. Collectively, these results provide further insight on the
prognostic prediction and molecular targeting therapy for patients
with HCC.
Supplementary Material
Supporting Data
Supporting Data
Supporting Data
Acknowledgements
Not applicable.
Funding
The present study was supported by the research
projects fund of 920th Hospital (grant no. 2019YGB20).
Availability of data and materials
The datasets used and/or analyzed during the present
study are available from the corresponding author upon reasonable
request. GSE22058, GSE57957, GSE14323 datasets are available in the
GEO (https://www.ncbi.nlm.nih.gov/geo).
Authors' contributions
JL, ZL and SZ conceived the study. JL, ZL and WL
collected data. ZL and WL performed the experiments. JL and ZL
analyzed the data. JL, ZL, WL and SZ drafted the initial
manuscript. SZ supervised the study. JL and SZ confirmed the
authenticity of all raw data. JL and SZ revised the manuscript for
important intellectual content. All authors have read and approved
the final manuscript.
Ethics approval and consent to
participate
The present study was approved by the Ethics
Committee of 920th Hospital (Kunming, China; grant no.
2018-020-01). Written informed consent was provided by all patients
prior to the study start.
Patient consent for publication
Not applicable.
Competing interests
The authors declare that they have no competing
interests.
References
|
1
|
Bray F, Ferlay J, Soerjomataram I, Siegel
RL, Torre LA and Jemal A: Global cancer statistics 2018: GLOBOCAN
estimates of incidence and mortality worldwide for 36 cancers in
185 countries. CA Cancer J Clini. 68:394–424. 2018. View Article : Google Scholar
|
|
2
|
Kulik L and El-Serag HB: Epidemiology and
management of hepatocellular carcinoma. Gastroenterology.
156:477–491.e1. 2019. View Article : Google Scholar : PubMed/NCBI
|
|
3
|
Wang H, Lu Z and Zhao X: Tumorigenesis,
diagnosis, and therapeutic potential of exosomes in liver cancer. J
Hematol Oncol. 12:1332019. View Article : Google Scholar : PubMed/NCBI
|
|
4
|
Dhanasekaran R and Felsher DW: A tale of
two complications of obesity: NASH and hepatocellular carcinoma.
Hepatology. 70:1056–1058. 2019. View Article : Google Scholar : PubMed/NCBI
|
|
5
|
Kudo M: Systemic therapy for
hepatocellular carcinoma: Recent advances and future perspective.
Nihon Shokakibyo Gakkai Zasshi. 116:8–17. 2019.(In Japanese).
PubMed/NCBI
|
|
6
|
Weng Q, Chen M, Li M, Zheng YF, Shao G,
Fan W, Xu XM and Ji J: Global microarray profiling identified
hsa_circ_ 0064428 as a potential immune-associated prognosis
biomarker for hepatocellular carcinoma. J Med Genet. 56:32–38.
2019. View Article : Google Scholar : PubMed/NCBI
|
|
7
|
Lin J, Lin W, Ye Y, Wang L, Chen X, Zang S
and Huang A: Kindlin-2 promotes hepatocellular carcinoma invasion
and metastasis by increasing Wnt/β-catenin signaling. J Exp Clin
Cancer Res. 36:1342017. View Article : Google Scholar : PubMed/NCBI
|
|
8
|
Bhatia V, Yadav A, Tiwari R, Nigam S, Goel
S, Carskadon S, Gupta N, Goel A, Palanisamy N and Ateeq B:
Epigenetic silencing of miRNA-338-5p and miRNA-421 drives
SPINK1-positive prostate cancer. Clin Cancer Res. 25:2755–2768.
2019.PubMed/NCBI
|
|
9
|
Chandran UR, Ma C, Dhir R, Bisceglia M,
Lyons-Weiler M, Liang W, Michalopoulos G, Becich M and Monzon FA:
Gene expression profiles of prostate cancer reveal involvement of
multiple molecular pathways in the metastatic process. BMC Cancer.
7:642007. View Article : Google Scholar : PubMed/NCBI
|
|
10
|
Liu L, Lin J and He H: Identification of
potential crucial genes associated with the pathogenesis and
prognosis of endometrial cancer. Front Genet. 10:3732019.
View Article : Google Scholar : PubMed/NCBI
|
|
11
|
Hu G, Cheng Z, Wu Z and Wang H:
Identification of potential key genes associated with osteosarcoma
based on integrated bioinformatics analyses. J Cell Biochem.
120:13554–13561. 2019. View Article : Google Scholar : PubMed/NCBI
|
|
12
|
Ni M, Liu X, Wu J, Zhang D, Tian J, Wang
T, Liu S, Meng Z, Wang K, Duan X, et al: Identification of
candidate biomarkers correlated with the pathogenesis and prognosis
of non-small cell lung cancer via integrated bioinformatics
analysis. Front Genet. 9:4692018. View Article : Google Scholar : PubMed/NCBI
|
|
13
|
Liu X, Wu J, Zhang D, Bing Z, Tian J, Ni
M, Zhang X, Meng Z and Liu S: Identification of potential key genes
associated with the pathogenesis and prognosis of gastric cancer
based on integrated bioinformatics analysis. Front Genet.
9:2652018. View Article : Google Scholar : PubMed/NCBI
|
|
14
|
Burchard J, Zhang C, Liu AM, Poon RT, Lee
NP, Wong KF, Sham PC, Lam BY, Ferguson MD, Tokiwa G, et al:
microRNA-122 as a regulator of mitochondrial metabolic gene network
in hepatocellular carcinoma. Mol Syst Biol. 6:4022010. View Article : Google Scholar : PubMed/NCBI
|
|
15
|
Liu AM, Yao TJ, Wang W, Wong KF, Lee NP,
Fan ST, Poon RT, Gao C and Luk JM: Circulating miR-15b and miR-130b
in serum as potential markers for detecting hepatocellular
carcinoma: A retrospective cohort study. BMJ Open. 2:e0008252012.
View Article : Google Scholar : PubMed/NCBI
|
|
16
|
Mah WC, Thurnherr T, Chow PK, Chung AY,
Ooi LL, Toh HC, Teh BT, Saunthararajah Y and Lee CG: Methylation
profiles reveal distinct subgroup of hepatocellular carcinoma
patients with poor prognosis. PLoS One. 9:e1041582014. View Article : Google Scholar : PubMed/NCBI
|
|
17
|
Mas VR, Maluf DG, Archer KJ, Yanek K, Kong
X, Kulik L, Freise CE, Olthoff KM, Ghobrial RM, McIver P and Fisher
R: Genes involved in viral carcinogenesis and tumor initiation in
hepatitis C virus-induced hepatocellular carcinoma. Mol Med.
15:85–94. 2009. View Article : Google Scholar : PubMed/NCBI
|
|
18
|
Edgar R and Barrett T: NCBI GEO standards
and services for microarray data. Nat Biotechnol. 24:1471–1472.
2006. View Article : Google Scholar : PubMed/NCBI
|
|
19
|
Kanehisa M and Goto S: KEGG: Kyoto
encyclopedia of genes and genomes. Nucleic Acids Res. 28:27–30.
2000. View Article : Google Scholar : PubMed/NCBI
|
|
20
|
Harding JJ, Nandakumar S, Armenia J,
Khalil DN, Albano M, Ly M, Shia J, Hechtman JF, Kundra R, El Dika
I, et al: Prospective genotyping of hepatocellular carcinoma:
Clinical implications of next-generation sequencing for matching
patients to targeted and immune therapies. Clin Cancer Res.
25:2116–2126. 2019. View Article : Google Scholar : PubMed/NCBI
|
|
21
|
Schulze K, Imbeaud S, Letouze E,
Alexandrov LB, Calderaro J, Rebouissou S, Couchy G, Meiller C,
Shinde J, Soysouvanh F, et al: Exome sequencing of hepatocellular
carcinomas identifies new mutational signatures and potential
therapeutic targets. Nat Genet. 47:505–511. 2015. View Article : Google Scholar : PubMed/NCBI
|
|
22
|
Ahn SM, Jang SJ, Shim JH, Kim D, Hong SM,
Sung CO, Baek D, Haq F, Ansari AA, Lee SY, et al: Genomic portrait
of resectable hepatocellular carcinomas: Implications of RB1 and
FGF19 aberrations for patient stratification. Hepatology.
60:1972–1982. 2014. View Article : Google Scholar : PubMed/NCBI
|
|
23
|
Fujimoto A, Totoki Y, Abe T, Boroevich KA,
Hosoda F, Nguyen HH, Aoki M, Hosono N, Kubo M, Miya F, et al:
Whole-genome sequencing of liver cancers identifies etiological
influences on mutation patterns and recurrent mutations in
chromatin regulators. Nat Genet. 44:760–764. 2012. View Article : Google Scholar : PubMed/NCBI
|
|
24
|
Sanchez-Vega F, Mina M, Armenia J, Chatila
WK, Luna A, La KC, Dimitriadoy S, Liu DL, Kantheti HS, Saghafinia
S, et al: Oncogenic signaling pathways in the cancer genome atlas.
Cell. 173:321–337.e10. 2018. View Article : Google Scholar : PubMed/NCBI
|
|
25
|
Livak KJ and Schmittgen TD: Analysis of
relative gene expression data using real-time quantitative PCR and
the 2(-Delta Delta C(T)) method. Methods. 25:402–408. 2001.
View Article : Google Scholar : PubMed/NCBI
|
|
26
|
Chen DG, Zhu B, Lv SQ, Zhu H, Tang J,
Huang C, Li Q, Zhou P, Wang DL and Li GH: Inhibition of EGR1
inhibits glioma proliferation by targeting CCND1 promoter. J Exp
Clin Cancer Res. 36:1862017. View Article : Google Scholar : PubMed/NCBI
|
|
27
|
Xu Z, Xu M, Liu P, Zhang S, Shang R, Qiao
Y, Che L, Ribback S, Cigliano A, Evert K, et al: The mTORC2-Akt1
cascade is crucial for c-Myc to promote hepatocarcinogenesis in
mice and humans. Hepatology. 70:1600–1613. 2019. View Article : Google Scholar : PubMed/NCBI
|
|
28
|
Yoon H, Kim M, Jang K, Shin M, Besser A,
Xiao X, Zhao D, Wander SA, Briegel K, Morey L, et al: p27
transcriptionally coregulates cJun to drive programs of tumor
progression. Proc Natl Acad Sci USA. 116:7005–7014. 2019.
View Article : Google Scholar : PubMed/NCBI
|
|
29
|
Xu P, Zhang G, Hou S and Sha LG: MAPK8
mediates resistance to temozolomide and apoptosis of glioblastoma
cells through MAPK signaling pathway. Biomed Pharmacother.
106:1419–1427. 2018. View Article : Google Scholar : PubMed/NCBI
|
|
30
|
Lacey A, Hedrick E, Cheng Y, Mohankumar K,
Warren M and Safe S: Interleukin-24 (IL24) is suppressed by
PAX3-FOXO1 and is a novel therapy for rhabdomyosarcoma. Mol Cancer
Ther. 17:2756–2766. 2018. View Article : Google Scholar : PubMed/NCBI
|
|
31
|
Kim JH, Lee MJ, Yu GR, Kim SW, Jang KY, Yu
HC, Cho BH and Kim DG: Alterations in the p53-SOCS2 axis contribute
to tumor growth in colon cancer. Exp Mol Med. 50:1–10. 2018.
View Article : Google Scholar
|
|
32
|
Senapati P, Dey S, Sudarshan D, Das S,
Kumar M, Kaypee S, Mohiyuddin A, Kodaganur GS and Kundu TK:
Oncogene c-fos and mutant R175H p53 regulate expression of
Nucleophosmin implicating cancer manifestation. FEBS J.
285:3503–3524. 2018. View Article : Google Scholar : PubMed/NCBI
|
|
33
|
Huang H, Wang Q, Du T, Lin C, Lai Y, Zhu
D, Wu W, Ma X, Bai S, Li Z, et al: Matrine inhibits the progression
of prostate cancer by promoting expression of GADD45B. Prostate.
78:327–335. 2018. View Article : Google Scholar : PubMed/NCBI
|
|
34
|
Habel N, Stefanovska B, Carene D,
Patino-Garcia A, Lecanda F and Fromigue O: CYR61 triggers
osteosarcoma metastatic spreading via an IGF1Rβ-dependent EMT-like
process. BMC Cancer. 19:622019. View Article : Google Scholar : PubMed/NCBI
|
|
35
|
Liu Z, Li W, Pang Y, Zhou Z and Liu S,
Cheng K, Qin Q, Jia Y and Liu S: SF3B4 is regulated by
microRNA-133b and promotes cell proliferation and metastasis in
hepatocellular carcinoma. EBioMedicine. 38:57–68. 2018. View Article : Google Scholar : PubMed/NCBI
|
|
36
|
Toh TB, Lim JJ and Chow EK: Epigenetics in
cancer stem cells. Mol Cancer. 16:292017. View Article : Google Scholar : PubMed/NCBI
|
|
37
|
Cantini L, Bertoli G, Cava C, Dubois T,
Zinovyev A, Caselle M, Castiglioni I, Barillot E and Martignetti L:
Identification of microRNA clusters cooperatively acting on
epithelial to mesenchymal transition in triple negative breast
cancer. Nucleic Acids Res. 47:2205–2215. 2019. View Article : Google Scholar : PubMed/NCBI
|
|
38
|
Liang Y, Zhang C and Dai DQ:
Identification of differentially expressed genes regulated by
methylation in colon cancer based on bioinformatics analysis. World
J Gastroenterol. 25:3392–3407. 2019. View Article : Google Scholar : PubMed/NCBI
|
|
39
|
Al-Zoughbi W, Schauer S, Pichler M and
Hoefler G: Early loss of forkhead transcription factor, O subgroup,
member 1 protein in the development of pancreatic ductal
adenocarcinoma. Pathobiology. 85:342–347. 2018. View Article : Google Scholar : PubMed/NCBI
|
|
40
|
Quentmeier H, Geffers R, Jost E, Macleod
RA, Nagel S, Röhrs S, Romani J, Scherr M, Zaborski M and Drexler
HG: SOCS2: Inhibitor of JAK2V617F-mediated signal transduction.
Leukemia. 22:2169–2175. 2008. View Article : Google Scholar : PubMed/NCBI
|
|
41
|
Monti-Rocha R, Cramer A, Gaio Leite P,
Antunes MM, Pereira RVS, Barroso A, Queiroz-Junior CM, David BA,
Teixeira MM, Menezes GB and Machado FS: SOCS2 is critical for the
balancing of immune response and oxidate stress protecting against
acetaminophen-induced acute liver injury. Front Immunol.
9:31342018. View Article : Google Scholar : PubMed/NCBI
|
|
42
|
Das R, Gregory PA, Fernandes RC, Denis I,
Wang Q, Townley SL, Zhao SG, Hanson AR, Pickering MA, Armstrong HK,
et al: MicroRNA-194 promotes prostate cancer metastasis by
inhibiting SOCS2. Cancer Res. 77:1021–1034. 2017. View Article : Google Scholar : PubMed/NCBI
|
|
43
|
Gokay S, Kendirci M, Ustkoyuncu PS, Kardas
F, Bayram AK, Per H and Poyrazoğlu HG: Tyrosinemia type II: Novel
mutations in TAT in a boy with unusual presentation. Pediatr Int.
58:1069–1072. 2016. View Article : Google Scholar : PubMed/NCBI
|
|
44
|
Fu L, Dong SS, Xie YW, Tai LS, Chen L,
Kong KL, Man K, Xie D, Li Y, Cheng Y, et al: Down-regulation of
tyrosine aminotransferase at a frequently deleted region 16q22
contributes to the pathogenesis of hepatocellular carcinoma.
Hepatology. 51:1624–1634. 2010. View Article : Google Scholar : PubMed/NCBI
|
|
45
|
Huang K, Xie W, Wang S, Li Q, Wei X, Chen
B, Hua Y, Li S, Peng B and Shen S: High SPINK1 expression predicts
poor prognosis and promotes cell proliferation and metastasis of
hepatocellular carcinoma. J Invest Surg. 33:1–10. 2020. View Article : Google Scholar : PubMed/NCBI
|
|
46
|
Xu L, Lu C, Huang Y, Zhou J, Wang X, Liu
C, Chen J and Le H: SPINK1 promotes cell growth and metastasis of
lung adenocarcinoma and acts as a novel prognostic biomarker. BMB
Rep. 51:648–653. 2018. View Article : Google Scholar : PubMed/NCBI
|