Introduction
Breast cancer (BC) is a complex and heterogeneous
disease and a leading cause of mortality among women (1). Familial BC accounts for 5–7% of all BC
cases (2,3). Within this group, only around 25% of
patients are carriers of germ line mutations in the two high
susceptibility genes for BC, BRCA1 and BRCA2 (4). The patients with familial BC who do not
have mutation of these genes fall under the BRCAX category
(5).
Tumorigenesis is a multistep process that results
from the accumulation of genetic and epigenetic alterations
(6). A total of 40–50% of human
genes have CpG islands (CGIs) located in or near the promoter
and/or first exon. Their methylation level is critical to regulate
the expression of these genes and essential for the development and
proper functioning of the cell. Alterations of the DNA methylation
status are frequently associated with human cancer. To date,
several studies have determined the methylation profile of specific
genes in familial and sporadic forms of BC and between the patients
carrying mutations in BRCA1, BRCA2 or BRCAX (7). Flanagan et al (8) have reported data about the global DNA
methylation variations in some cases of female familial BC
characterized by a given mutation status. BC may also affect men
albeit more rarely than women with an incidence of 1% of all cases
of BC diagnosed annually. It has been suggested by numerous studies
that male breast cancer (MBC) is different from female breast
cancer (FBC), at both the clinical and molecular levels (9–12). In
fact, even though MBC treatment follows the same indications as
postmenopausal FBC, the clinical and pathological characteristics
of MBC do not overlap with those of FBC, which could explain why
mortality and survival rates are significantly worse in men, as
compared to women (13). At present,
the epigenetic alterations in MBC have been the focus of a limited
number of studies (14). Among them,
some investigated the differences in the DNA methylation level of
putative genes between FBC and MBC. Kornegoor et al
(15), examined the promoter
methylation of 25 cancer-related genes in 108 cases of MBC using
methylation specific multiplex ligation dependent probe
amplification. These authors concluded that the methylation of
promoters was common in MBC and that the high methylation status
was correlated with the aggressive phenotype and poor outcome
(15). Using the same technique,
Vermeulen et al (16) studied
the promoter methylation of 25 BC-related genes in situ in
pure ductal carcinoma of the male breast. Subsequently, Pinto et
al (17) identified different
expression patterns in RASSF1A, RARβ and in four selected miRNAs
studying the differences between MBC and FBC in a set of 56
familial BC cases. Using methylation-sensitive high resolution
techniques, Deb et al (18)
tested a panel of 10 genes in 60 men, and concluded that
BRCA2-related MBC was characterized by high methylation levels of
specific genes and that the average methylation index might be a
useful prognostic marker. Finally, in a study by Rizzolo et
al (19), the results of
promoter methylation analysis of genes involved in signal
transduction and hormone signaling in 69 men with BC, showed that
variations in methylation patterns were common in BC and might
identify specific subgroups based on BRCA1/2 mutation status or
certain clinicopathologic features.
The aim of the present study was therefore to study
DNA methylation pattern using a novel global approach (MeDip-chip;
based on human promoter arrays comprising 4.6 million probes tiled
through 25,500 human promoter regions) in familiar BC to identify
differences between FBC and MBC, as well as among BRCA1, BRCA2 and
BRCAX mutations within FBC. In particular, comparisons in DNA
methylation levels were performed based on sex and mutation status
and the differentially methylated genes in each comparison class
were subjected to functional enrichment analysis. The enriched Gene
Ontology terms and molecular pathways could be useful for
identifying sex and/or mutation related biological differences with
a potential clinical impact.
Materials and methods
Clinical and pathological
characteristics of BC patients
The present study involved 24 patients with familial
BC, including 7 men and 17 women who underwent surgery between May
1997 and February 2012 in 5 different Italian hospital institutes
as indicated in Table I. The group
of men was between 45 and 79 years (mean 56±13.5) and the group of
women was between 33 and 60 years (mean 44.56±7.39). All patients
were previously subjected to genomic DNA sequencing from peripheral
blood mononuclear cells as requested by the medical genetic
counsellors to identify germline mutations of the BRCA1 and BRCA2
genes. Among the men, one patient carried a mutation of the BRCA2
gene while the remaining patients were wild type for BRCA1 or BRCA2
genes and included in the group BRCAX. Among the group of women,
four patients carried BRCA1 gene mutations, three carried BRCA2
gene mutations, and ten were included in the BRCAX group (see
Table I for the list of mutations).
Ethical approval for the study was obtained from Ethic Committee of
Spedali Civili of Brescia (approval no. NP 1439). Written informed
consent for research purpose in the fields of genomics and
epigenomics was obtained from each patient at the original date of
the surgery.
 | Table I.Clinicopathological characteristics
of patients with breast cancer enrolled in the present study. |
Table I.
Clinicopathological characteristics
of patients with breast cancer enrolled in the present study.
| Case number | Sex | Age, years | Mutation | ER | PR | HER2 | Ki67/MIB1 | Molecular subtype
predicted | Surgical resection,
year | Hospital
institutea |
|---|
| Case 01 | Female | 41 | BRCA 2 458stop | – | – | – | – | – | 1997 | SC-BS |
| Case 02 | Female | 46 | BRCA X | – | – | – | – | – | 1997 | SC-BS |
| Case 03 | Female | 42 | BRCA 2 T703N | Positive | Positive | Negative | Negative | Luminal A | 2005 | FP-BS |
| Case 04 | Female | 43 | BRCA 1 C64R | Negative | Negative | Negative | Positive |
Triple-negative | 2011 | FP-BS |
| Case 05 | Female | 49 | BRCA X | Positive | Positive | – | Negative | Luminal A | 2005 | SC-BS |
| Case 06 | Female | 38 | BRCA 1 C64R | Negative | Negative | Negative | Positive |
Triple-negative | 2008 | SA-BS |
| Case 07 | Female | 33 | BRCA 2 Q2960X | Positive | Positive | Positive | Positive | Luminal B | 2011 | FP-BS |
| Case 08 | Female | 51 | BRCA X | Positive | Positive | Negative | Negative | Luminal A | 2005 | SA-BS |
| Case 09 | Female | 60 | BRCA X | Positive | Positive | – | – | Luminal A | 2007 | SA-BS |
| Case 10 | Female | 59 | BRCA X | Positive | Positive | Positive | Negative | Luminal B | 2008 | SA-BS |
| Case 11 | Female | 36 | BRCA 1C64R | Negative | Negative | Negative | Positive |
Triple-negative | 2009 | FP-BS |
| Case 12 | Female | 50 | BRCA X | Positive | Positive | Negative | Negative | Luminal A | 2008 | FP-BS |
| Case 13 | Female | 38 | BRCA1 M1652I | Negative | Negative | Negative | Positive |
Triple-negative | 2001 | SC-BS |
| Case 14 | Female | 43 | BRCA X | Positive | Positive | Negative | Positive | Luminal A | 2007 | SC-BS |
| Case 15 | Female | 41 | BRCA X | Positive | Positive | Positive | Negative | Luminal B | 2000 | SC-BS |
| Case 16 | Female | 43 | BRCA X | Positive | Positive | Negative | Negative | Luminal A | 2006 | SC-BS |
| Case 17 | Female | 43 | BRCA X | Positive | Positive | Negative | Positive | Luminal A | 2002 | SC-BS |
| Case 18 | Male | 49 | BRCA 2 delA9158FS +
29 stop | Positive | Negative | Positive | Negative | HER2-enriched | 2007 | SC-BS |
| Case 19 | Male | 45 | BRCA X | Positive | Negative | Negative | Positive | Luminal A | 2011 | FP-BS |
| Case 20 | Male | 46 | BRCA X | Positive | Positive | Positive | Positive | Luminal B | 2012 | FP-BS |
| Case 21 | Male | 79 | BRCA X | – | – | – | – | – | 2007 | CR |
| Case 22 | Male | 71 | BRCA X | – | – | – | – | – | 2009 | CR |
| Case 23 | Male | 54 | BRCA X | Negative | Negative | Positive | Negative | HER2-enriched | 2011 | CR |
| Case 24 | Male | 48 | BRCA X | Positive | Positive | Negative | Positive | Luminal A | 2012 | PC |
DNA isolation from formalin-fixed
paraffin-embedded (FFPE) BC tissues
The genomic DNA was extracted from FFPE tissues (10
of 5 µm sections for each patient) using QIAamp DNA FFPE Tissue Kit
supplied by Qiagen, Inc.. The genomic DNA was digested using the
micrococcal nuclease (New England Biolabs, Inc.), following the
manufacturer's specifications, in order to obtain DNA fragments
ranging from 200 to 500 bp (labelled input DNA). Agilent
Bioanalyzer with the RNA 6000 Nano LabChip Kit was used to check
the size, quality and quantity of fragmented DNA.
Methylated DNA immunoprecipitation on
chip (MeDip-chip)
The DNA methylome of 24 patients with BC was
obtained by MeDip followed by Affymetrix Human Promoter 1.0R Tiling
Arrays hybridization (MeDip-chip) using the modified protocol of
the Affymetrix chromatin immunoprecipitation assay as previously
described (20). The human promoter
array is a single array comprising 4.6 million probes tiled through
25,500 human promoter regions. Sequences used in the design of the
human promoter arrays were selected from NCBI human genome assembly
(BUILD 34). Purified DNA (4 µg), named input DNA, was
immunoprecipitated with 10 µl anti-5-MethylCytosine Antibody (cat.
no. BI-MECY-0100; Eurogentec) using the MeDip protocol (21), with minor modifications. The
antibody-DNA complexes were immunoprecipitated using
Dynabeads® Protein G immunoprecipitation kit (Thermo
Fisher scientific, Inc.) and the enriched methylated DNA (labelled
MeDip DNA) was purified by standard phenol/chloroform procedure and
precipitated with isopropanol. A total of 200 ng input or MeDip DNA
were amplified using the Affymetrix Chromatin Immunoprecipitation
Assay Protocol. Hybridization on Human Promoter 1.0R array was
performed using the GeneChip®Hybridization, Wash, and
Stain Kit (Thermo Fisher scientific, Inc.) and the
GeneChip® 640 hybridization oven. Arrays were washed and
stained using the Fluidics Station 450 (Thermo Fisher scientific,
Inc.), were scanned with the GeneChip Scanner 3000 7G and raw data
were extracted with the GeneChip Operating System (GCOS) software.
In total, 2 microarrays were used for each patient (one for MeDip
DNA and one for input DNA). Data obtained from MeDip and input DNA
microarrays have been deposited in the NCBI Gene 97 Expression
Omnibus (GEO) data repository (GSE153636).
Quantification of methylated DNA by
qPCR
To verify the effectiveness of the protocol, the
input and MeDip DNA of three random patients with BC were amplified
by qPCR. The methylated DNA was amplified using specific primers
for the H19 gene, which is known to be hypermethylated (H19, chr11:
1,973,061-1,973,234 hg18) and primers for a control region without
CpG dinucleotides (CTRL, chr7: 84,768,017-84,768,155 hg18). H19
forward primer: 5′-CGAGTGTGCGTGAGTGTGAG-3′and reverse primer:
5′-GGCGTAATGGAATGCTTGAA-3′. CTRL forward primer:
5′-GAGAGCATTAGGGCAGACAAA-3′ and reverse primer:
5′-GTTCCTCAGACAGCCACATTT-3′. DNA (25 ng) was used for each reaction
and assayed in triplicate. qPCR was run with a first step of
denaturation at 95°C for 10 min, then 40 cycles at 95°C for 30 sec,
56°C for 30 sec, 72°C for 30 sec. GoTaq qPCR Master Mix with SYBR
Green was used (Promega corporation).
The enrichment level for the methylated regions was
calculated using the qPCR threshold cycle (Ct) values applied to
the following formula previously described (22,23):
2−[(H19me-H19in)-(CTRLme-CTRLin)] where H19me and H19in
are the qPCR Ct values obtained for the H19 gene qPCR primers pair
using MeDip and Input DNA as template, respectively; CTRLme and
CTRLin are the qPCR Ct values obtained for the control region qPCR
primers pair using MeDip and Input DNA as a template, respectively.
Samples with low Ct value (<10) were considered as non-enriched
and were therefore excluded from the study.
Statistical analysis
The raw data of 48. CEL files (24 from input DNA and
24 from MeDip DNA) were imported into Partek Genomics Suite (PGS)
software version 6.6, normalized with the RMA algorithm and
converted into log2 values. Hierarchical clustering and
Principal Component Analysis were performed to verify that input
DNA clustered in the same group compared to the MeDip DNA samples
confirming the success of the MeDip protocol. For each patient, the
DNA methylation was scored as Δ methylation value: The MeDip. CEL
files were normalized against input DNA by subtracting the
log2 of the signal intensity value of each of the 4.6
million array probes of the input DNA to the corresponding
log2 signal intensity values for MeDip. The association
between the DNA methylation levels of keratin genes and the
pathological characteristics of the patients was evaluated using
Fisher's exact test. For each gene, the median Δ methylation value
was selected as the cutoff point to classify keratin methylation
levels as ‘high’ or ‘low’. One-way ANOVA and Tukey's pairwise
comparison tests were used to determine the statistical differences
in the mean Δ methylation values among the different molecular
subtypes of BC.
Significant differentially methylated regions (DMRs)
were obtained using the model-based analysis of tiling arrays (MAT)
algorithm (24) using the parameters
described in Data S1. The DMRs of patients grouped based on some of
their characteristics (Table II)
were analyzed by ANOVA. In each pairwise comparison, the positive
or negative MAT score indicated hypermethylation or
hypomethylation, respectively of a given DMR compared to the other
in the pair. The genomic coordinates of the DMRs were calculated
based on UCSC human genomic assembly version 18 and PGS was used
for the corresponding DMR gene annotation. The DNA methylation
levels of gene promoters and gene bodies were calculated
considering the DMRs located between-5,000 bp upstream the
transcription start site (TSS) and +5,000 bp downstream the end
codon of the nearest gene. Since both FBC and MBC cases were
analyzed, DMRs located on chromosome Y were not considered. DAVID
(25) was used for functional
enrichment analysis to identify gene ontology terms and molecular
signaling pathways. The P-value cut-offs used for each comparison
have been included in Data S1.
| Table II.Comparisons performed and the
relative DMRs found. |
Table II.
Comparisons performed and the
relative DMRs found.
| Groups
compared | Cases
considered | Number of DMRs
found | Hypomethylated
DMRs, % | Hypermethylated
DMRs, % | Number of DMRs
associated with genes |
|---|
| 1: FBC vs. MBC (17
cases vs. 7 cases) | All cases | 2,846 | 67.83 | 32.17 | 2,486 |
| 2: FBC vs. MBC (10
cases vs. 6 cases) | BRCAX cases
only | 1,242 | 93.56 | 6.44 | 1,102 |
| 3: BRCAX vs.
BRCA1/2 (16 cases vs. 8 cases) | All cases | 364 | 46.70 | 53.30 | 357 |
| 4: BRCA1 vs. BRCA2
(4 cases vs. 3 cases) | Female cases
only | 802 | 54.74 | 45.26 | 755 |
| 5: BRCA1 vs. BRCAX
(4 cases vs. 10 cases) | Female cases
only | 484 | 60.54 | 39.46 | 464 |
| 6: BRCA2 vs. BRCAX
(3 cases vs. 10 cases) | Female cases
only | 673 | 52.01 | 47.99 | 629 |
| 7: BRCA1 vs.
BRCA2/X (4 cases vs. 13 cases) | Female cases
only | 861 | 43.79 | 56.21 | 819 |
| 8: BRCA2 vs.
BRCA1/X (4 cases vs. 14 cases) | Female cases
only | 1,380 | 38.19 | 61.81 | 1,251 |
| 9: BRCAX vs.
BRCA1/2 (10 cases vs. 7 cases) | Female cases
only | 962 | 51.14 | 48.86 | 914 |
Results
MeDip-chip analysis of BC tissues
The present study was designed to establish the
global DNA methylation profile of 24 familial BC cases in order to
identify sex-(FBC vs. MBC) and mutation-related differences among
women with BRCA1, BRCA2 and BRCAX mutations.
In detail, the DNA methylome was examined in 17 FBC
(4 with BRCA1 mutations, 3 with BRCA2 mutations and 10 with BRCAX
condition) and 7 MBC (1 with BRCA2 and 6 with BRCAX conditions)
(Table I). MeDip was performed
followed by hybridization on Affymetrix Promoter 1.0 Tiling arrays
to identify genomic regions that were either hypo- or
hypermethylated when compared to the same regions in patients from
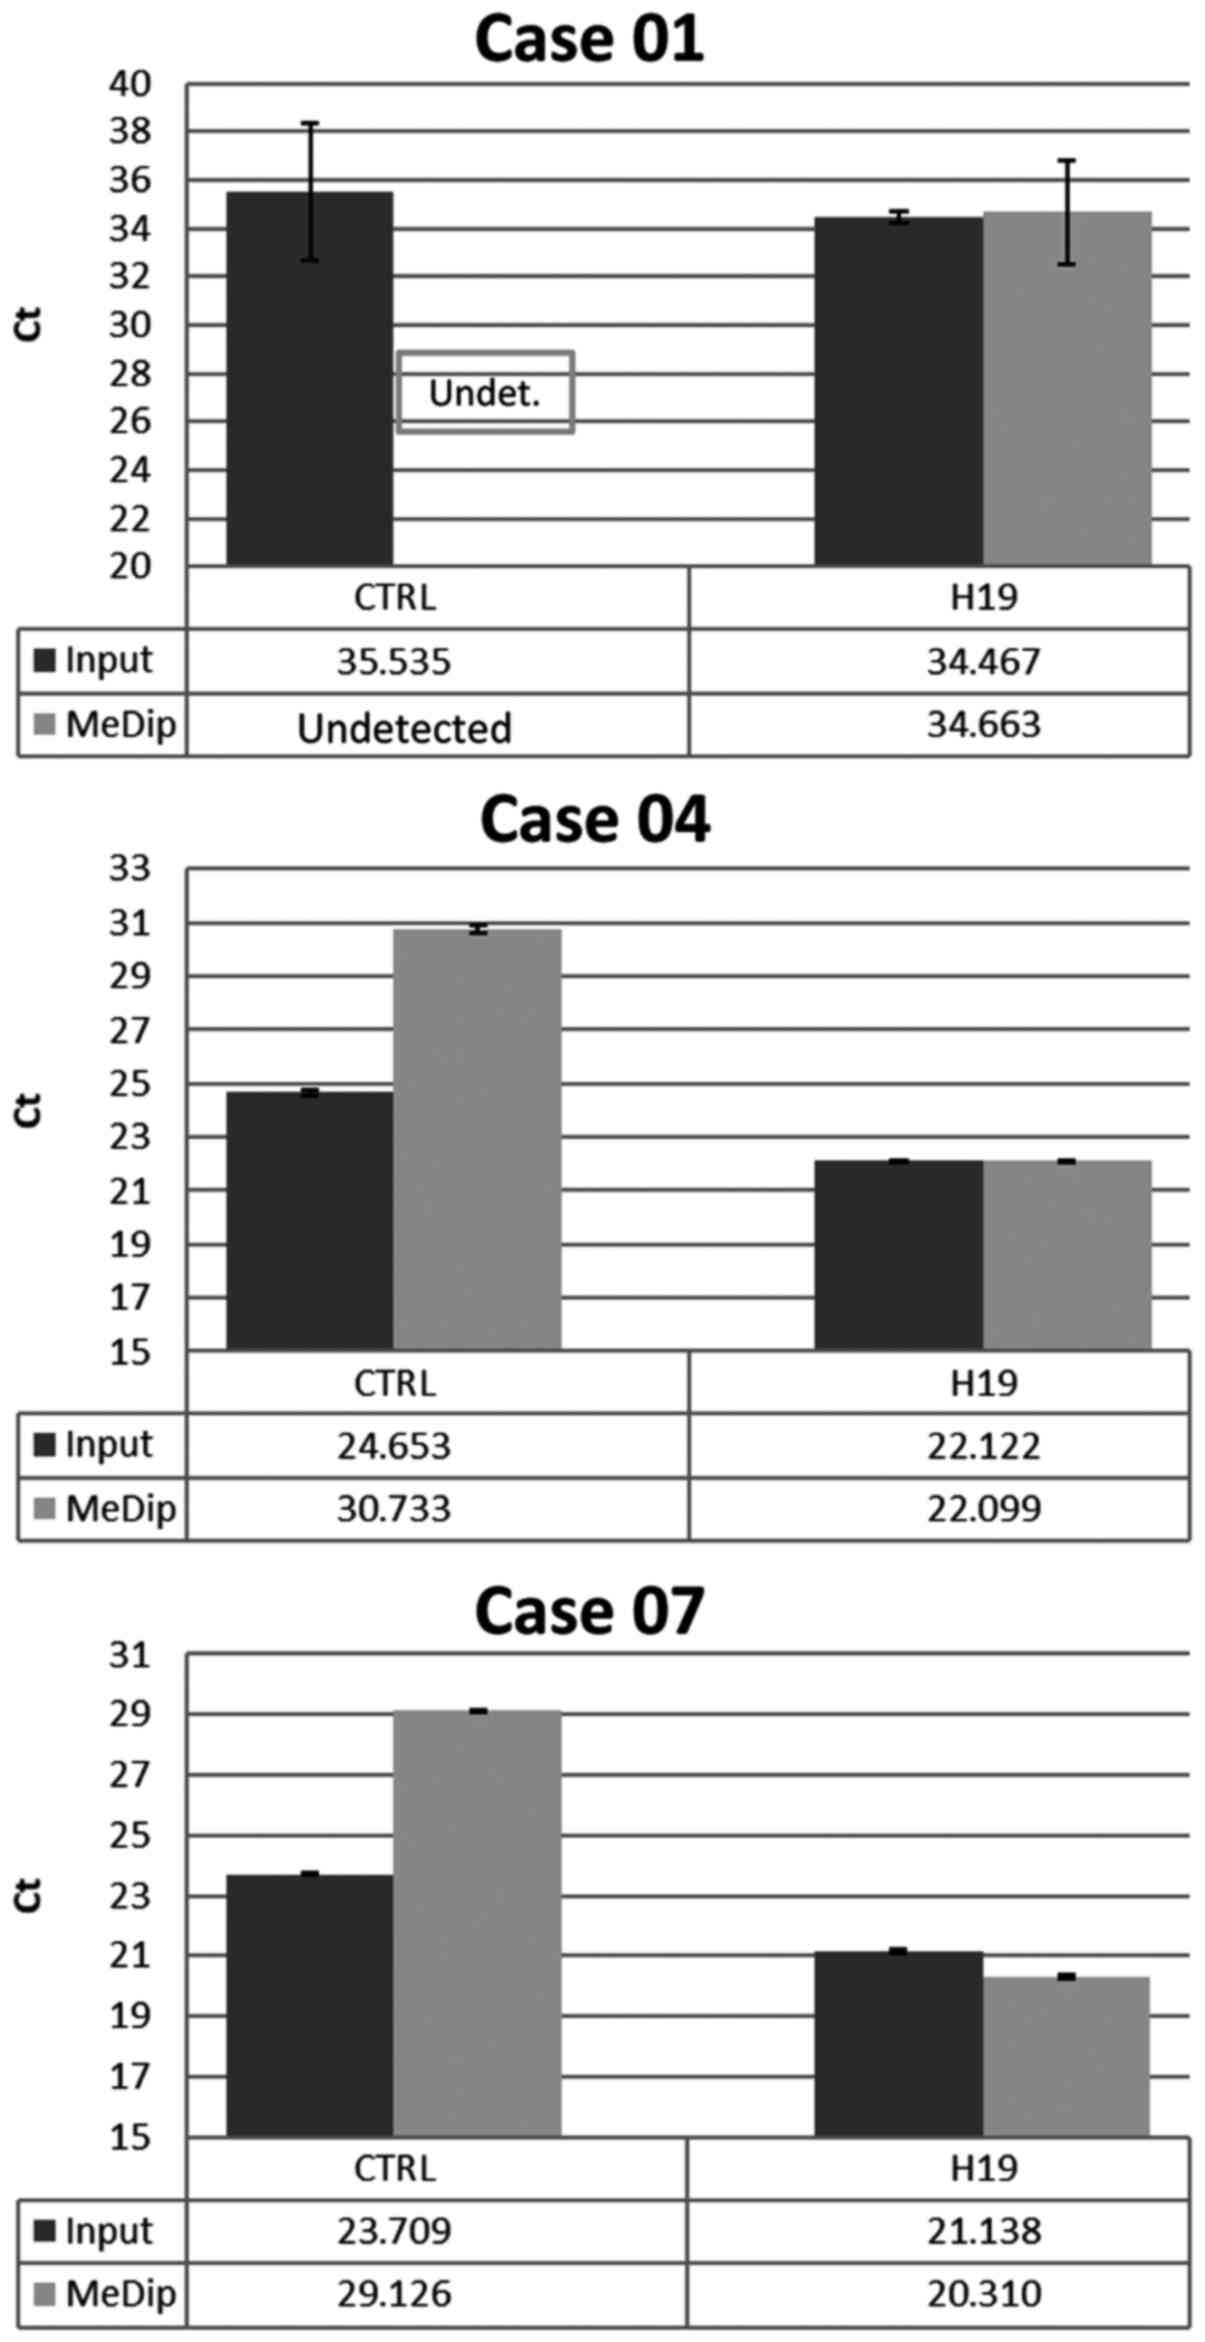
different groups. To quantify the enriched methylated DNA following
the MeDip process, a DNA region containing the highly methylated
H19 gene and a genomic DNA region without any CpG
dinucleotides named CTRL were amplified by qPCR in randomly
selected BC cases. The results showed that the average Ct values
for H19 in input DNA and MeDip DNA were similar. On the contrary,
the average Ct values for CTRL were higher in MeDip DNA samples as
compared with DNA input samples. These results indicated the loss
of the unmethylated DNA in the MeDip phase and thus an enrichment
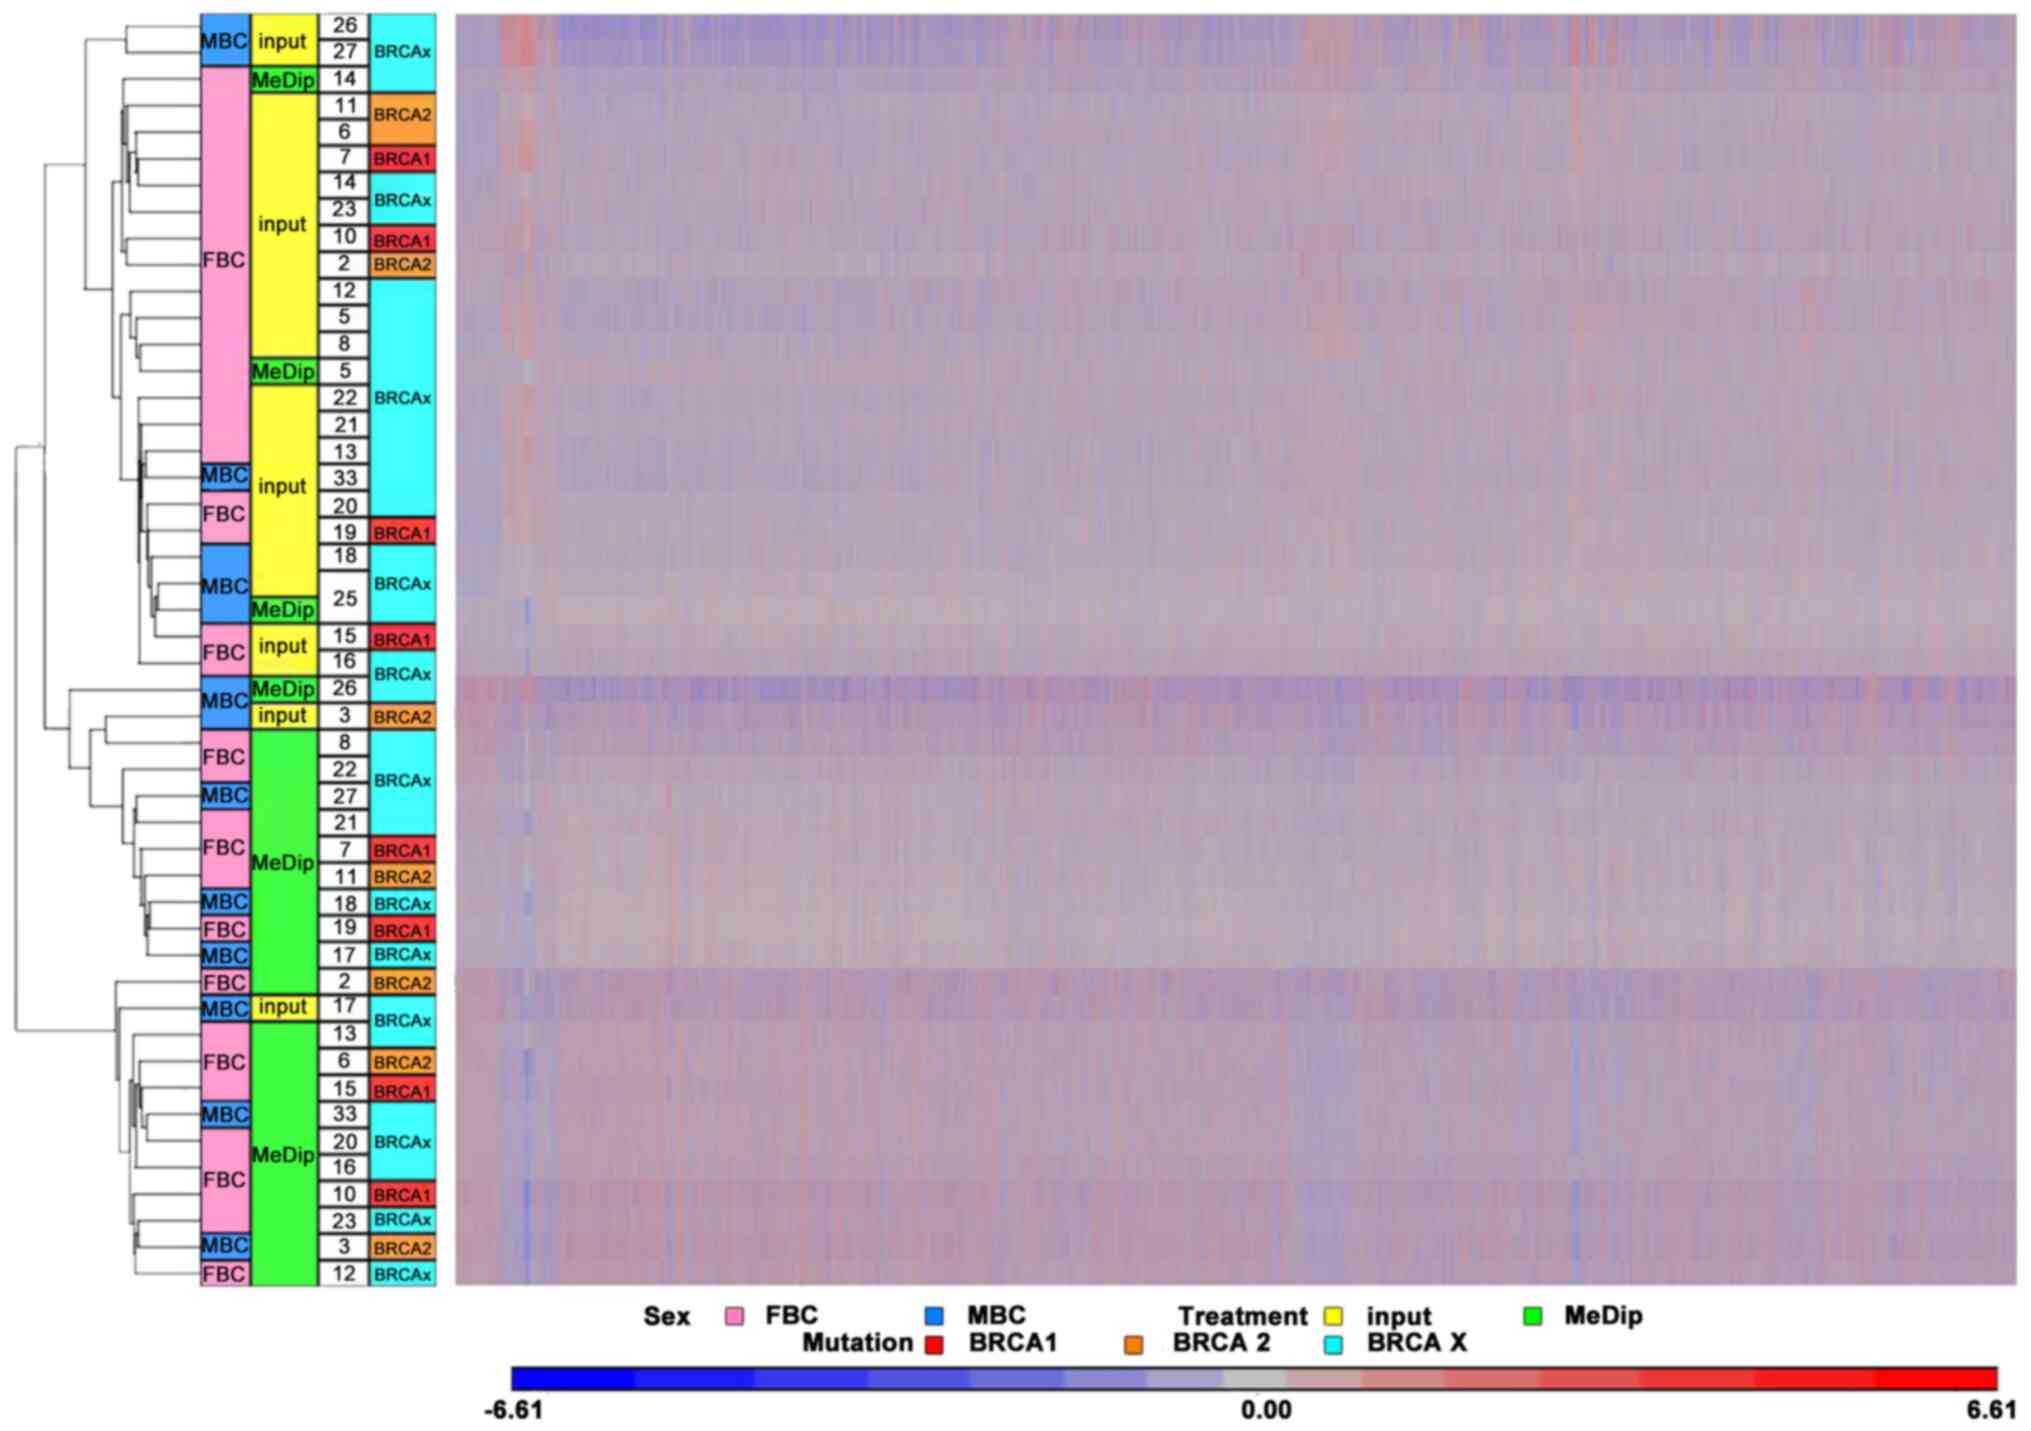
of methylated DNA (Fig. 1). To
further assess the quality of the MeDip-chip protocol, the
hierarchical clustering of the raw data was generated using Partek
Genomic Suite (PGS) software. The heat map showed two robust
clusters: One cluster including MeDip DNA (green) and one including
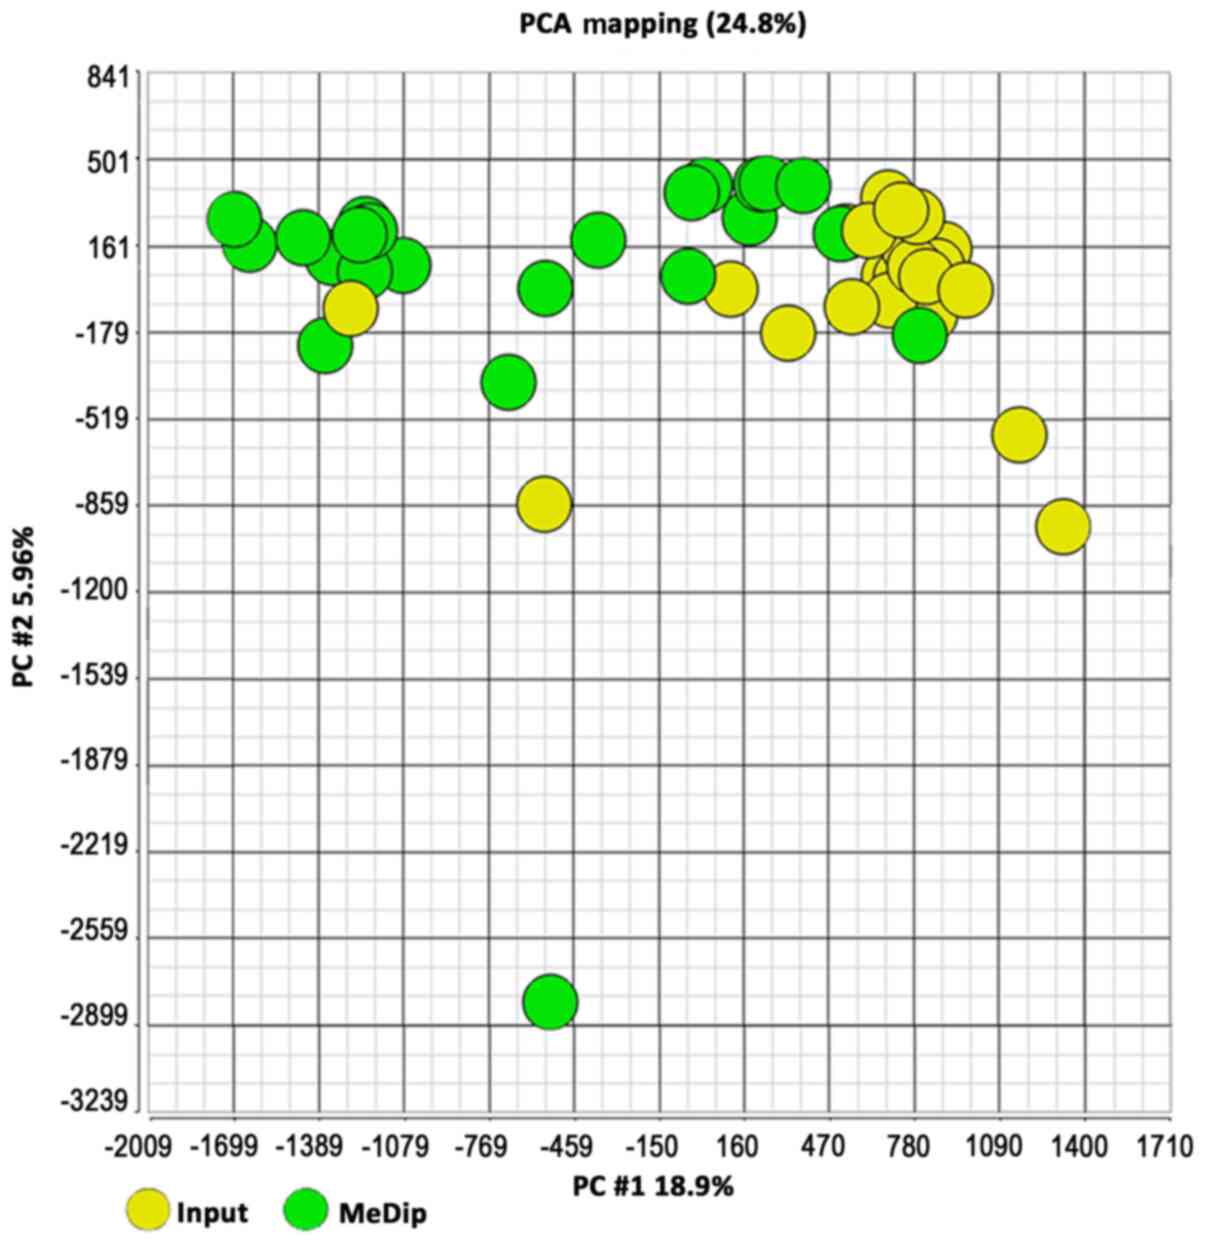
input DNA (yellow; Fig. 2). The same
clusters were obtained by Principal Component Analysis (Fig. 3).
Identification of DMRs in FBC as
compared to MBC and between groups with different BRCA mutation
statuses
The DNA methylation profiles of the 24 BC cases were
achieved by subtracting the mean signal obtained from the Input
array from the matching MeDip array for each probe. A total of nine
pairwise comparisons were performed according to sex and mutation
status (Table II). The number of
the significant differentially methylated regions (DMRs) were
obtained by Partek Genomics Suite using ANOVA and MAT algorithms
with specific parameters (see Materials and methods).
A list of DMRs for each pairwise comparison was
obtained (nine lists in total) and their associated genes were
identified. The lists of genes associated with the 20 most
significant DMRs are described in Table
SI A-I and Figs. S1–S9. All genes associated with the DMRs of
the nine comparisons considered were catalogued using the online
repository of HGNC (HUGO gene nomenclature committee) in order to
obtain an overview of the gene classes involved (Table SIIA-I) and were analyzed in relation
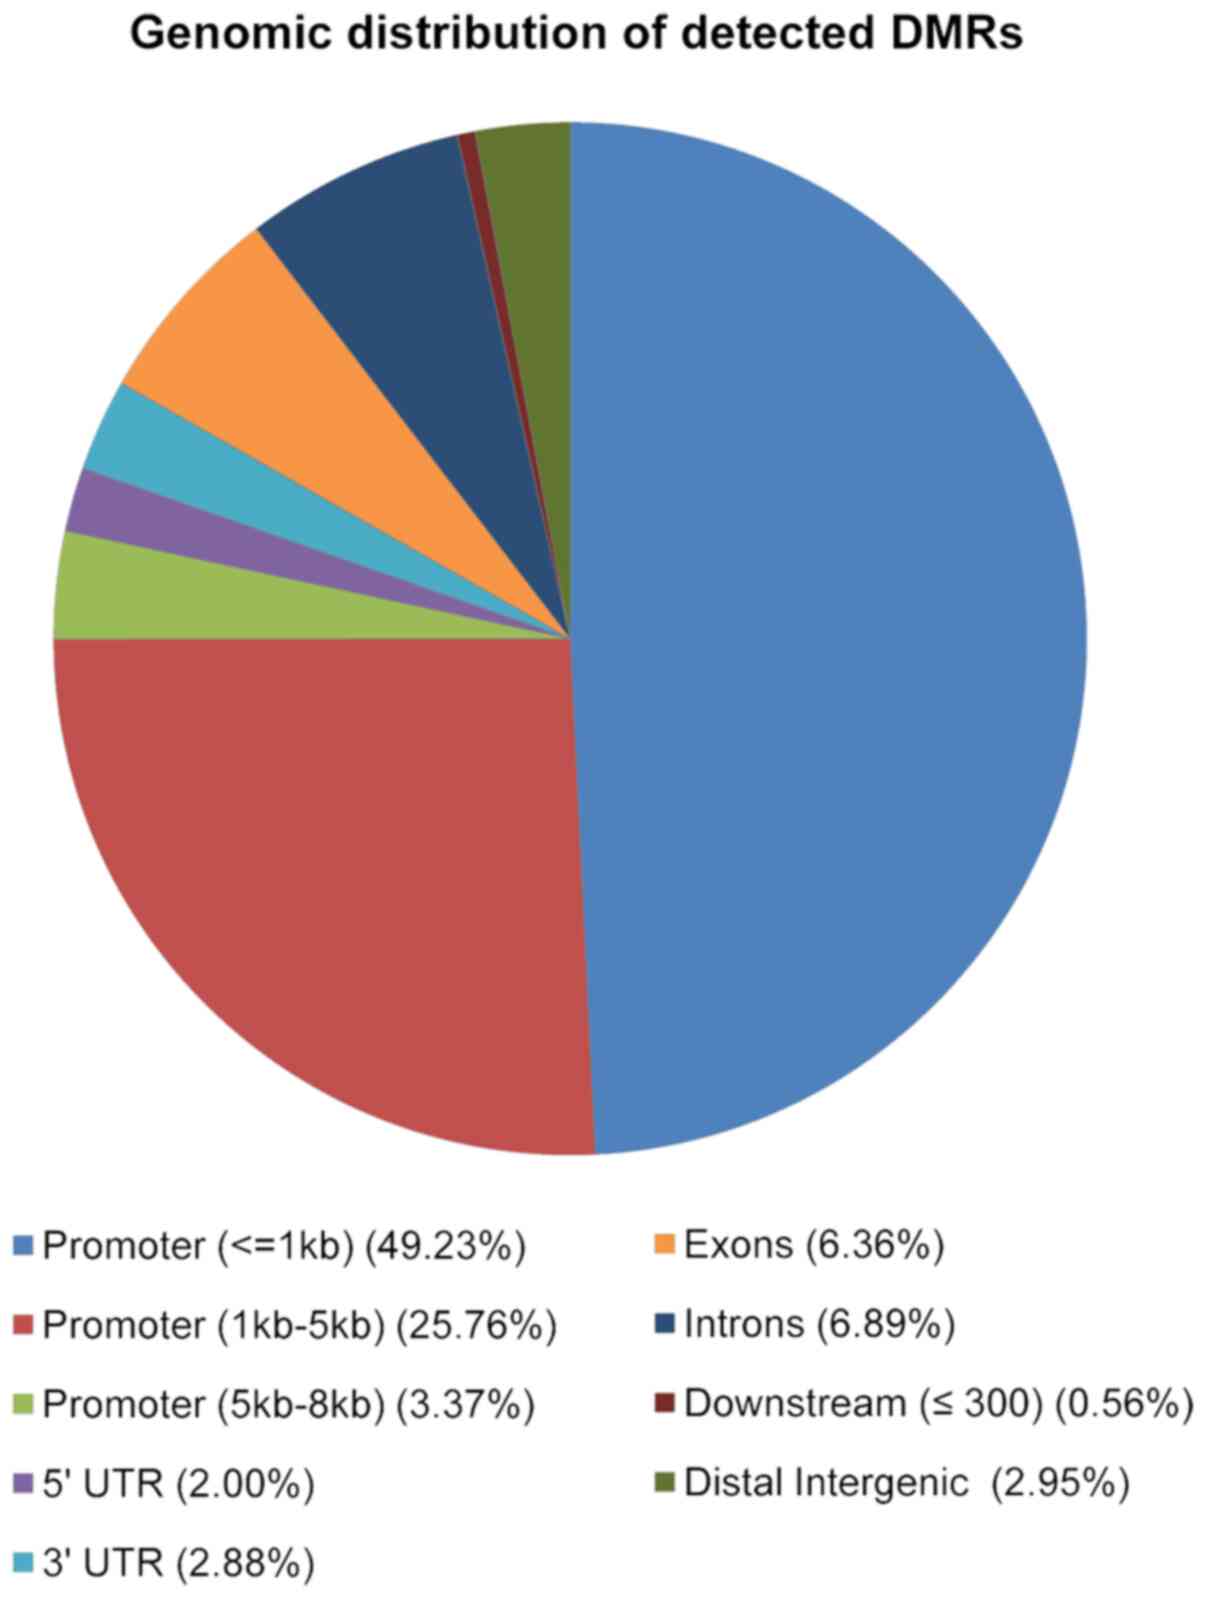
to their genomic location. As shown in Fig. 4, the majority of 2,846 DMRs were
located in promoter regions (49% were located in the 1kb region
upstream the TSS; 26% in the region 1-5kb upstream the TSS and 3%
in the region between 5-8kb upstream the TSS), 7% in introns, 6% in
exons, 3% in the 3′UTR and, 2% in the 5′UTR (Fig. 4).
Sex-related DNA methylation
differences between FBC and MBC
The methylome of FBC (n=17) was compared with that
of MBC (n=7) and 2,846 DMRs associated with 2,486 annotated genes
were identified. Functional enrichment analysis performed by DAVID
identified nine enriched GO terms (Table III). The most significant enriched
terms were the GO Cellular Component (CC) concerning the structure
of the cytoskeleton, including ‘GO:0045095: Keratin filament’,
‘GO:0005882: Intermediate filament’ and ‘GO:0044430: Cytoskeletal
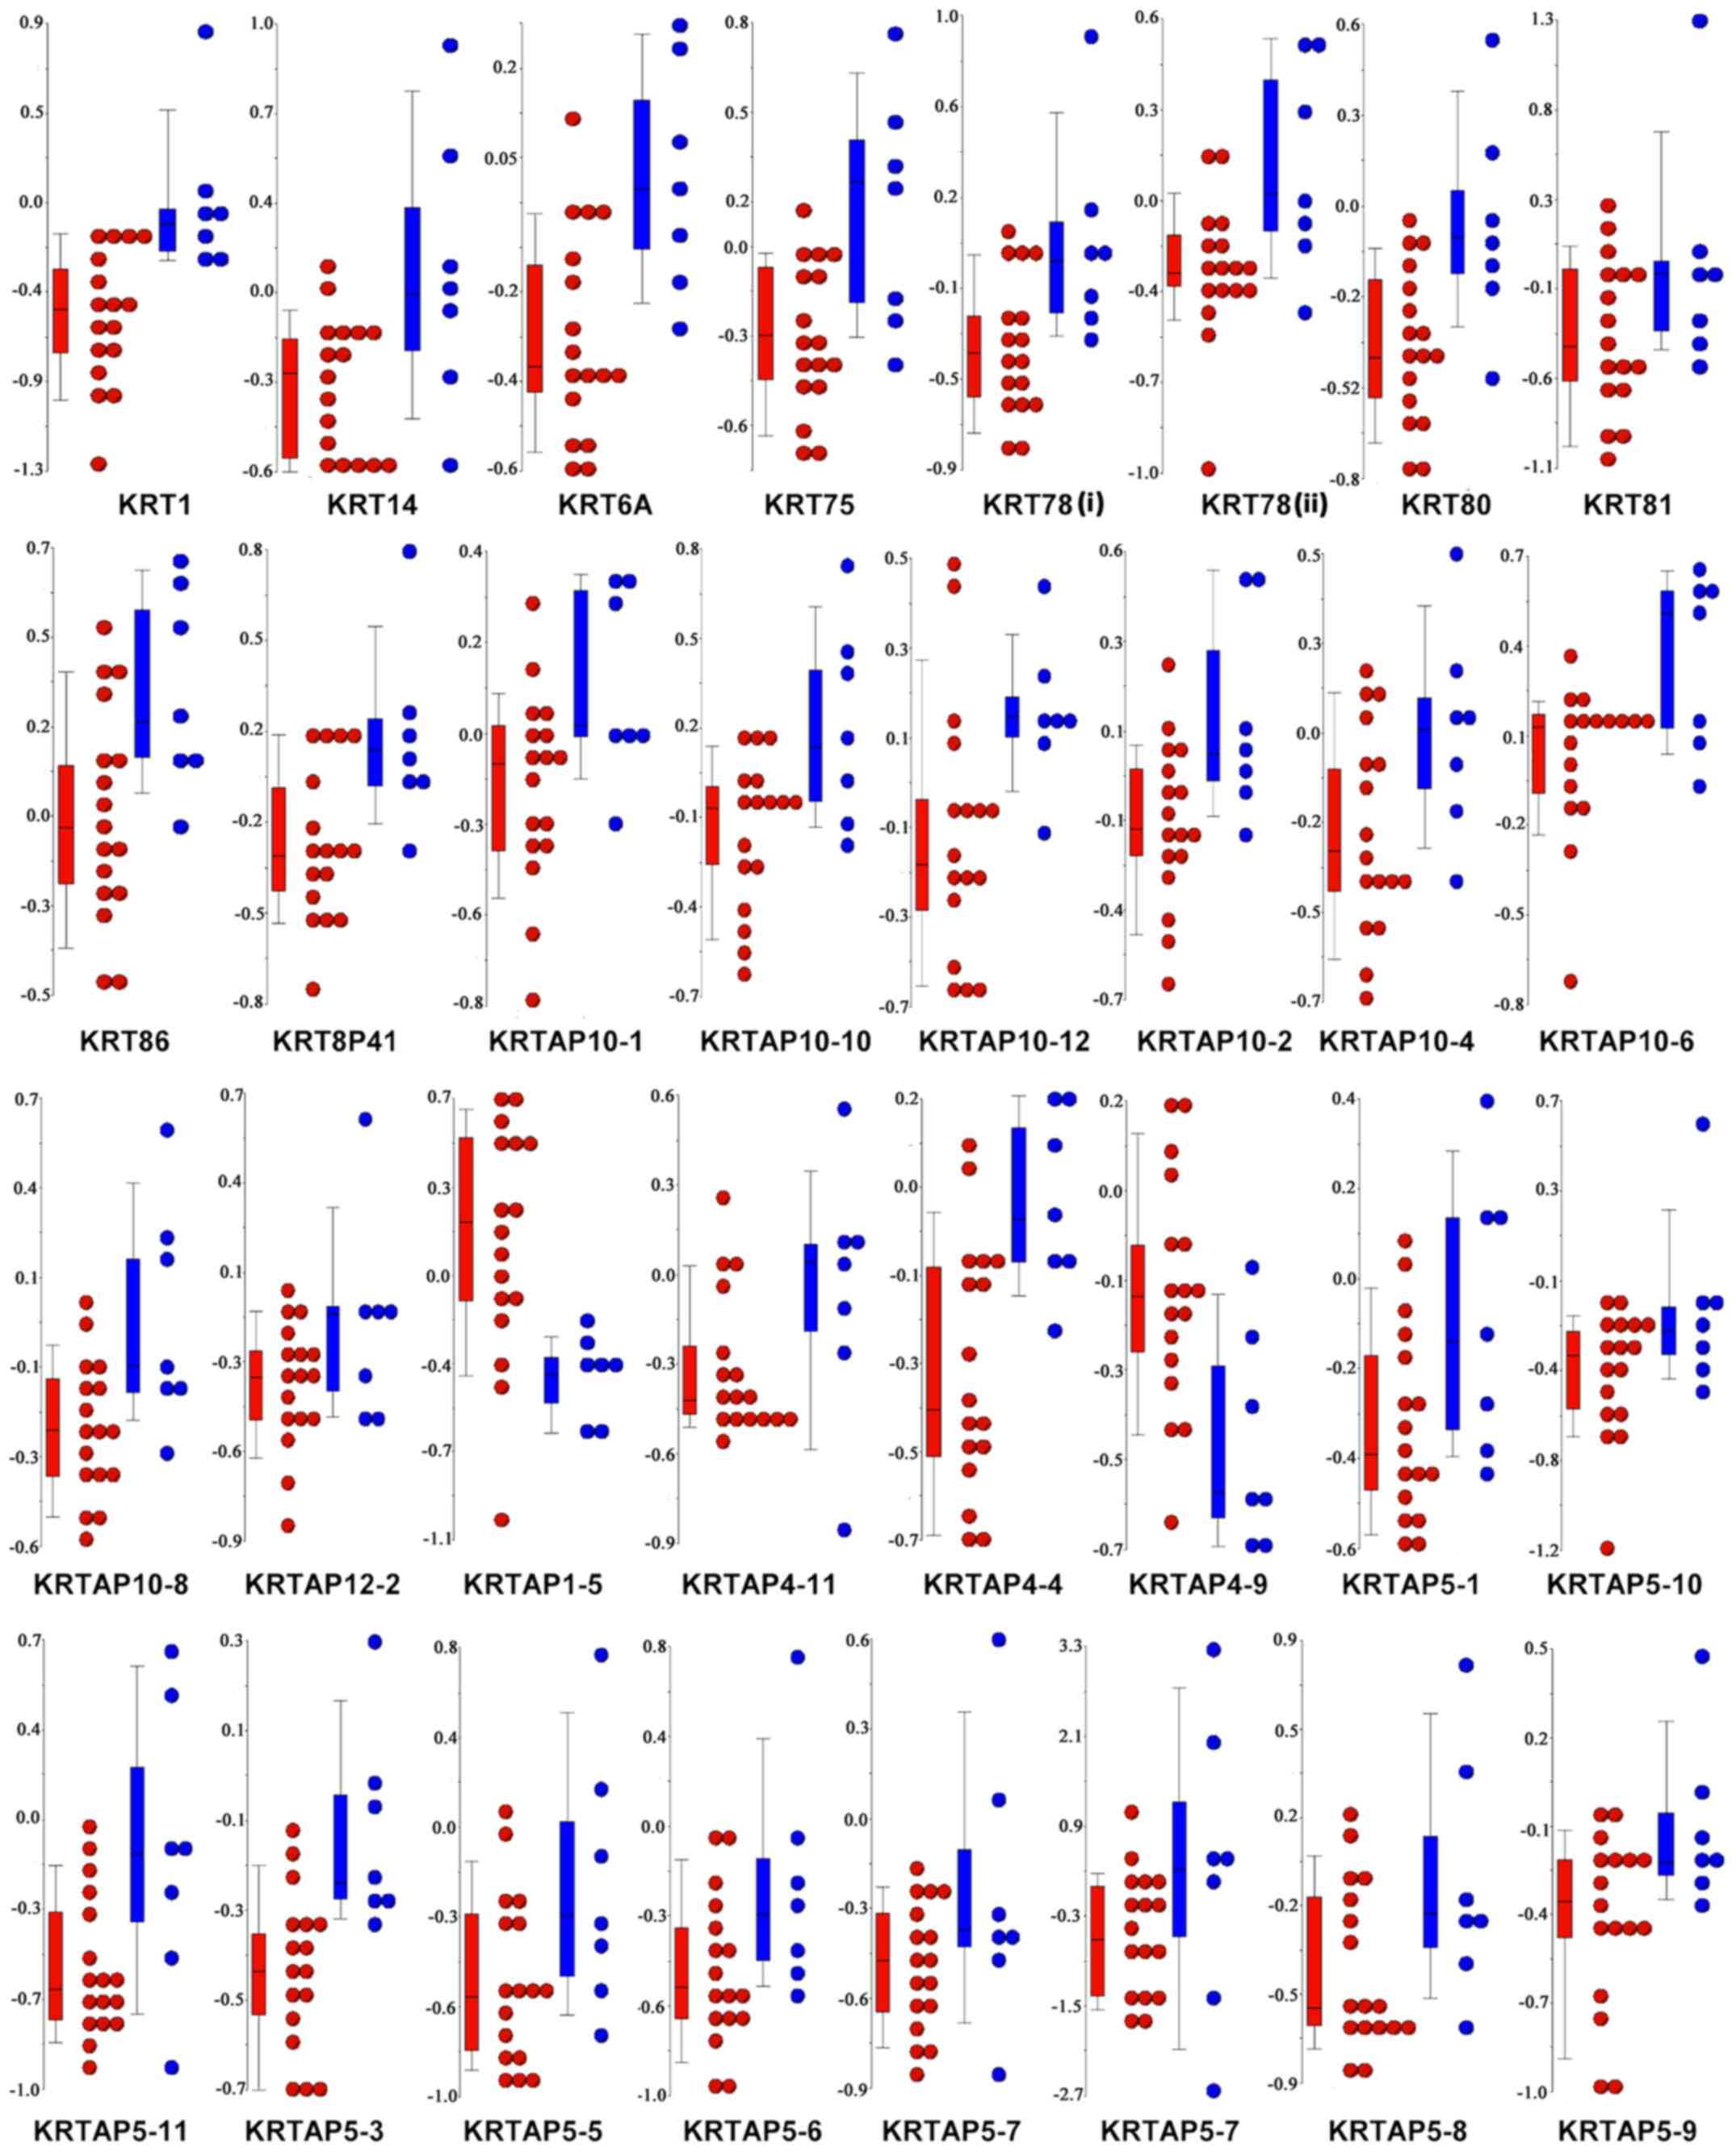
part’. As indicated by the negative MAT score (Table IV) and the Δ methylation value for
each patient (Fig. 5), almost all
the genes associated with the ‘GO:0045095: Keratin filament’ term
were significantly hypomethylated in FBC, as compared with MBC.
This result prompted us to combine the methylation level of keratin
(KRT) genes with the pathological characteristics patients with BC.
Of note, the DNA methylation levels of KRT14, KRT81, and KRT86 were
significantly associated with the progesterone receptor status, and
KRT75 was found to be differentially methylated among the BC
molecular subtypes (Table SIII). No
correlations were found between the methylation level of the
remaining KRTs and the other pathological characteristics,
including estrogen receptor (ER), HER2, and Ki67 status.
| Table III.Enriched GO terms found by Database
for Annotation, Visualization and Integrated Discovery when all
female breast cancer cases were compared with all male breast
cancer cases. |
Table III.
Enriched GO terms found by Database
for Annotation, Visualization and Integrated Discovery when all
female breast cancer cases were compared with all male breast
cancer cases.
| Category | Term | Genes | Count | P-value | Benjamini |
|---|
| GO: CC | GO:0045095 Keratin
filament | KRT1, KRT14, KRT6A,
KRT75, KRT78, KRT80, KRT81, KRT86, KRT8P41, KRTAP10-1, KRTAP10-10,
KRTAP10-12, KRTAP10-2, KRTAP10-4, KRTAP10-6, KRTAP10-8, KRTAP12-2,
KRTAP1-5, KRTAP4-11, KRTAP4-4, KRTAP4-9, KRTAP5-1, KRTAP5-10,
KRTAP5-11, KRTAP5-3, KRTAP5-5, KRTAP5-6, KRTAP5-7, KRTAP5-8,
KRTAP5-9 | 30 | 0.000000264 | 0.0000156 |
| GO: CC | GO:0044430
Cytoskeletal part | ADORA2A, AKT1,
ARHGAP32, ATM, B9D2, BMX, CAMK2N1, CAMSAP1, CAPZB, CC2D2A, CCDC85B,
CCIN, CDH23, CEP135, CEP170B, CEP72, CETN2, CHRM1, CLASP2, CNN3,
CNTLN, DFNB31, DLG4, DLGAP2, DNAH14, DNAH2, DNAI2, DNAL4, DYNLT1,
EML1, EML4, EML6, EVI5, FILIP1L, GAS7, GAS8, HAUS1, HAUS7, HAUS8,
HIPK2, HOOK3, IFFO1, JAKMIP1, KATNAL1, KIF13B, KIF16B, KIF21A,
KIF24, KIF25, KIF2A, KIFC2, KLC3, KLC4, KRT1, KRT14, KRT15,
KRT16P2, KRT17, KRT20, KRT6A, KRT75, KRT78, KRT80, KRT81, KRT86,
KRT8P41, KRTAP10-1, KRTAP10-10, KRTAP10-12, KRTAP10-2, KRTAP10-4,
KRTAP10-6, KRTAP10-8, KRTAP12-2, KRTAP1-5, KRTAP4-11, KRTAP4-4,
KRTAP4-9, KRTAP5-1, KRTAP5-10, KRTAP5-11, KRTAP5-3, KRTAP5-5,
KRTAP5-6, KRTAP5-7, KRTAP5-8, KRTAP5-9, LLGL1, LMNB2, MAP1A, MAPT,
MC1R, MCPH1, MED12, MYBPH, MYH14, MYH2, MYH6, MYH7, MYH7B, MYL12A,
MYL12B, MYL3, MYLPF, MYO15A, MYO1G, MYO7B, MYO9B, NAV1, NDRG2,
NEFH, NIN, NTRK2, NUP62, PDE4D, PDE4DIP, PDLIM7, PIN4, PPP1R9A,
PPP1R9B, RAB3GAP2, RAB3IP, RANBP1, RHOU, RMDN2, RNF19A, SEPT11,
SEPT8, SEPT9, SHANK3, SIRT2, SMEK1, SPAG6, SPDL1, SPTB, SPTBN5,
SSNA1, SVIL, SYNM, SYNPO, TACC1, TACC2, TBCD, TNNT3, TPM4, TPX2,
TRIM55, TTLL5, TTLL7, TUBA3E, TUBB1, TUBB3, TUBB8, UBXN6 | 153 | 0.0000111 | 0.0032717 |
| GO: CC | GO:0005882
Intermediate filament | ADORA2A, DLGAP2,
IFFO1, KRT1, KRT14, KRT15, KRT16P2, KRT17, KRT20, KRT6A, KRT75,
KRT78, KRT80, KRT81, KRT86, KRT8P41, KRTAP10-1, KRTAP10-10,
KRTAP10-12, KRTAP10-2, KRTAP10-4, KRTAP10-6, KRTAP10-8, KRTAP12-2,
KRTAP1-5, KRTAP4-11, KRTAP4-4, KRTAP4-9, KRTAP5-1, KRTAP5-10,
KRTAP5-11, KRTAP5-3, KRTAP5-5, KRTAP5-6, KRTAP5-7, KRTAP5-8,
KRTAP5-9, LMNB2, NEFH, SYNM | 40 | 0.0000301 | 0.0044294 |
| GO: CC | GO:0045111
Intermediate filament cytoskeleton | ADORA2A, DLGAP2,
IFFO1, KRT1, KRT14, KRT15, KRT16P2, KRT17, KRT20, KRT6A, KRT75,
KRT78, KRT80, KRT81, KRT86, KRT8P41, KRTAP10-1, KRTAP10-10,
KRTAP10-12, KRTAP10-2, KRTAP10-4, KRTAP10-6, KRTAP10-8, KRTAP12-2,
KRTAP1-5, KRTAP4-11, KRTAP4-4, KRTAP4-9, KRTAP5-1, KRTAP5-10,
KRTAP5-11, KRTAP5-3, KRTAP5-5, KRTAP5-6, KRTAP5-7, KRTAP5-8,
KRTAP5-9, LMNB2, MACF1, NEFH, SYNM | 41 | 0.0000228 | 0.0044762 |
| GO: MF | GO:0008047 Enzyme
activator activity | ABR, ACAP2, AGAP3,
AGAP6, AGAP9, AHSA2, AIFM3, ANGPT4, ANKRD27, APOA2, APOA5, ARAP1,
ARAP3, ARFGAP3, ARHGAP11A, ARHGAP19, ARHGAP19-SLIT1, ARHGAP23,
ARHGAP32, ARHGAP35, ARHGAP40, BCRP2, CDK5R2, CHM, CTAGE4, CTAGE5,
DEPDC1B, DLC1, DOCK2, EVI5, FAM13B, FN1, FZR1, GAPVD1, GDI2, GHRL,
GMIP, GPSM3, GRTP1, IGFBP3, IQGAP2, MALT1, MMP15, MMP16, MYO9B,
NRG3, PPP1R12B, PRKAG2, PRR5-ARHGAP8, RANBP1, RASA3, RASA4,
RASA4CP, RGS12, RGS3, RGS5, RGS6, SEC14L2, SH3BP1, SRGAP1,
TBC1D10B, TBC1D16, TBC1D19, TBC1D2, TBC1D22A, TBC1D25, TBC1D29,
TBC1D3B, TBC1D3F, TBC1D8B, TBC1D9B, TIAM2, USP6 | 69 | 0.0000779 | 0.0052097 |
| GO: MF | GO:0005096 GTPase
activator activity | ABR, ACAP2, AGAP3,
AGAP6, AGAP9, ANKRD27, ARAP1, ARAP3, ARFGAP3, ARHGAP11A, ARHGAP19,
ARHGAP19-SLIT1, ARHGAP23, ARHGAP32, ARHGAP35, ARHGAP40, BCRP2, CHM,
DEPDC1B, DLC1, DOCK2, EVI5, FAM13B, GAPVD1, GDI2, GMIP, GPSM3,
GRTP1, IQGAP2, MYO9B, PRR5-ARHGAP8, RANBP1, RASA3, RASA4, RASA4CP,
RGS12, RGS3, RGS5, RGS6, SH3BP1, SRGAP1, TBC1D10B, TBC1D16,
TBC1D19, TBC1D2, TBC1D22A, TBC1D25, TBC1D29, TBC1D3B, TBC1D3F,
TBC1D3G, TBC1D8B, TBC1D9B, TIAM2, USP6 | 51 | 0.0000459 | 0.0061401 |
| GO: CC | GO:0005856
Cytoskeleton | ABL2, ACTB,
ADORA2A, AFAP1, AKT1, ANK1, ARAP3, ARHGAP32, ARHGAP35, ATM, B9D2,
BMX, CAMK2N1, CAMSAP1, CAPZB, CC2D2A, CCDC85B, CCIN, CDH23, CDK5,
CEP135, CEP170B, CEP72, CETN2, CHRM1, CLASP2, CNFN, CNN2, CNN3,
CNTLN, CORO2B, CYLD, DAPK1, DFNB31, DLG4, DLGAP2, DMD, DMTN,
DNAH14, DNAH2, DNAI2, DNAL4, DOCK2, DPYSL2, DYNLT1, EDA, EML1,
EML4, EML6, EPB41L1, EPPK1, ESPN, EVI5, FAM65B, FARP2, FGD5, FHL2,
FILIP1L, FRMD1, FRMD7, GAS7, GAS8, HAUS1, HAUS7, HAUS8, HINT1,
HIPK2, HOOK3, HRNR, IFFO1, IQGAP2, JAKMIP1, KALRN, KATNAL1, KIF13B,
KIF16B, KIF21A, KIF24, KIF25, KIF2A, KIFC2, KLC3, KLC4, KRIT1,
KRT1, KRT14, KRT15, KRT16P2, KRT17, KRT20, KRT6A, KRT75, KRT78,
KRT80, KRT81, KRT86, KRT8P41, KRTAP10-1, KRTAP10-10, KRTAP10-12,
KRTAP10-2, KRTAP10-4, KRTAP10-6, KRTAP10-8, KRTAP12-2, KRTAP1-5,
KRTAP4-11, KRTAP4-4, KRTAP4-9, KRTAP5-1, KRTAP5-10, KRTAP5-11,
KRTAP5-3, KRTAP5-5, KRTAP5-6, KRTAP5-7, KRTAP5-8, KRTAP5-9, LLGL1,
LMNB2, MACF1, MAP1A, MAP3K1, MAP6D1, MAPT, MC1R, MCPH1, MED12,
MICAL3, MYBPH, MYH14, MYH2, MYH6, MYH7, MYH7B, MYL12A, MYL12B,
MYL3, MYLPF, MYO15A, MYO1G, MYO7B, MYO9B, NAV1, NDRG2, NEFH, NF2,
NIN, NTRK2, NUP62, NXF2B, PDE4D, PDE4DIP, PDLIM7, PIN4, PNP, POTEJ,
PPP1R9A, PPP1R9B, RAB3GAP2, RAB3IP, RANBP1, RDX, RHOU, RMDN2,
RNF19A, SEPT11, SEPT8, SEPT9, SGCA, SGCE, SHANK3, SIRT2, SLC4A1,
SMEK1, SPAG6, SPDL1, SPRR2B, SPTB, SPTBN5, SSNA1, STRBP, SVIL,
SYNE2, SYNM, SYNPO, TACC1, TACC2, TBCD, TGM1, TNNT3, TPM4, TPX2,
TRADD, TRIM55, TTLL5, TTLL7, TUBA3E, TUBB1, TUBB3, TUBB8, TWF1,
UBXN6, ZNF174 | 203 | 0.000145 | 0.0170134 |
| GO: MF | GO:0060589
Nucleoside-triphosphatase regulator activity | ABR, ACAP2, AGAP3,
AGAP6, AGAP9, AHSA2, ANKRD27, ARAP1, ARAP3, ARFGAP3, ARHGAP11A,
ARHGAP19, ARHGAP19-SLIT1, ARHGAP23, ARHGAP32, ARHGAP35, ARHGAP40,
ARHGEF10, ARHGEF25, ARHGEF5, BCRP2, CHM, DEPDC1B, DLC1, DOCK2,
DOCK3, DOCK8, EVI5, FAM13B, FARP2, FGD5, GAPVD1, GDI2, GMIP, GPSM3,
GRTP1, IQGAP2, ITSN2, KALRN, KNDC1, KRIT1, MINK1, MYO9B, PLEKHG1,
PLEKHG4B, PLEKHG7, PRR5-ARHGAP8, PSD4, RAB3IP, RANBP1, RAPGEF3,
RASA3, RASA4, RASA4CP, RASGRP2, RGL2, RGS12, RGS3, RGS5, RGS6,
RIMS2, RPH3AL, SH3BP1, SRGAP1, SYTL2, SYTL3, TBC1D10B, TBC1D16,
TBC1D19, TBC1D2, TBC1D22A, TBC1D25, TBC1D29, TBC1D3B, TBC1D3F,
TBC1D3G, TBC1D8B, TBC1D9B, TIAM1, TIAM2, TNK2, USP6 | 78 | 0.000568 | 0.0188541 |
| GO: MF | GO:0030695 GTPase
regulator activity | ABR, ACAP2, AGAP3,
AGAP6, AGAP9, ANKRD27, ARAP1, ARAP3, ARFGAP3, ARHGAP11A, ARHGAP19,
ARHGAP19-SLIT1, ARHGAP23, ARHGAP32, ARHGAP35, ARHGAP40, ARHGEF10,
ARHGEF25, ARHGEF5, BCRP2, CHM, DEPDC1B, DLC1, DOCK2, DOCK3, DOCK8,
EVI5, FAM13B, FARP2, FGD5, GAPVD1, GDI2, GMIP, GPSM3, GRTP1,
IQGAP2, ITSN2, KALRN, KNDC1, KRIT1, MINK1, MYO9B, PLEKHG1,
PLEKHG4B, PLEKHG7, PRR5-ARHGAP8, PSD4, RAB3IP, RANBP1, RAPGEF3,
RASA3, RASA4, RASA4CP, RASGRP2, RGL2, RGS12, RGS3, RGS5, RGS6,
RIMS2, RPH3AL, SH3BP1, SRGAP1, SYTL2, SYTL3, TBC1D10B, TBC1D16,
TBC1D19, TBC1D2, TBC1D22A, TBC1D25, TBC1D29, TBC1D3B, TBC1D3F,
TBC1D3G, TBC1D8B, TBC1D9B, TIAM1, TIAM2, TNK2, USP6 | 77 | 0.000467 | 0.0206520 |
| Table IV.Genes corresponding to the DMRs
associated with GO term ‘GO: 0045095: Keratin filament’ when all
female breast cancer cases were compared with all male breast
cancer cases. |
Table IV.
Genes corresponding to the DMRs
associated with GO term ‘GO: 0045095: Keratin filament’ when all
female breast cancer cases were compared with all male breast
cancer cases.
| Gene symbol | P-value | MAT score | Chromosome | Region start | Region end | DMR length, bp | Probes in
region | DMR position |
|---|
| KRT1 |
1.42×10⁻⁵ | −5.317 | chr12 | 51362805 | 51365485 | 2,681 | 48 | Upstream TSS |
| KRT14 |
8.51×10⁻⁵ | −4.142 | chr17 | 36996508 | 36998231 | 1,724 | 42 | Promoter |
| KRT6A |
2.84×10⁻⁵ | −4.458 | chr12 | 51172288 | 51173829 | 1,542 | 43 | Promoter |
| KRT75 |
8.51×10⁻⁵ | −4.166 | chr12 | 51117744 | 51119993 | 2,250 | 56 | Upstream TSS |
| KRT78 |
8.51×10⁻⁵ | −4.104 | chr12 | 51516089 | 51517502 | 1,414 | 24 | Downstream CDS
end |
| KRT78 |
7.09×10⁻⁵ | −4.282 | chr12 | 51518324 | 51520224 | 1,901 | 53 | Promoter |
| KRT80 |
8.51×10⁻⁵ | −4.101 | chr12 | 50873925 | 50876076 | 2,152 | 57 | Upstream TSS |
| KRT81 |
8.51×10⁻⁵ | −4.123 | chr12 | 50969856 | 50971294 | 1,439 | 39 | Exon |
| KRT86 |
8.51×10⁻⁵ | −4.229 | chr12 | 50981621 | 50983635 | 2,015 | 55 | Promoter |
| KRT8P41 |
1.42×10⁻⁵ | −5.508 | chr11 | 9071904 | 9074578 | 2,675 | 76 | Exon |
| KRTAP10-1 |
8.51×10⁻⁵ | −4.109 | chr21 | 44782903 | 44784728 | 1,826 | 47 | Exon |
| KRTAP10-10 |
8.51×10⁻⁵ | −4.208 | chr21 | 44880449 | 44882191 | 1,743 | 44 | Promoter |
| KRTAP10-12 |
7.09×10⁻⁵ | −4.255 | chr21 | 44941119 | 44942642 | 1,524 | 38 | Exon |
| KRTAP10-2 |
8.51×10⁻⁵ | −4.224 | chr21 | 44795043 | 44796629 | 1,587 | 43 | Promoter |
| KRTAP10-4 |
7.09×10⁻⁵ | −4.273 | chr21 | 44817595 | 44819882 | 2,288 | 63 | Exon |
| KRTAP10-6 |
8.51×10⁻⁵ | −4.226 | chr21 | 44835328 | 44836747 | 1,420 | 40 | Promoter |
| KRTAP10-8 |
1.42×10⁻⁵ | −6.221 | chr21 | 44855891 | 44858376 | 2,486 | 66 | Exon |
| KRTAP12-2 |
8.51×10⁻⁵ | −4.093 | chr21 | 44910070 | 44911658 | 1,589 | 45 | Exon |
| KRTAP1-5 |
5.68×10⁻⁵ | 4.200 | chr17 | 36436999 | 36438048 | 1,050 | 29 | Upstream TSS |
| KRTAP4-11 |
8.51×10⁻⁵ | −4.239 | chr17 | 36526929 | 36528798 | 1,870 | 48 | Exon |
| KRTAP4-4 |
8.51×10⁻⁵ | −4.142 | chr17 | 36569481 | 36571301 | 1,821 | 49 | Promoter |
| KRTAP4-9 |
2.84×10⁻⁵ | 4.518 | chr17 | 36513351 | 36515335 | 1,985 | 50 | Promoter |
| KRTAP5-1 |
1.42×10⁻⁵ | −5.387 | chr11 | 1561553 | 1564020 | 2,468 | 54 | Exon |
| KRTAP5-10 |
8.51×10⁻⁵ | −4.180 | chr11 | 70953946 | 70955693 | 1,748 | 45 | Exon |
| KRTAP5-11 |
8.51×10⁻⁵ | −4.225 | chr11 | 70970806 | 70972121 | 1,316 | 33 | Promoter |
| KRTAP5-3 |
7.09×10⁻⁵ | −4.258 | chr11 | 1584784 | 1586547 | 1,764 | 46 | Exon |
| KRTAP5-5 |
8.51×10⁻⁵ | −4.222 | chr11 | 1607571 | 1609218 | 1,648 | 39 | Exon |
| KRTAP5-6 |
1.42×10⁻⁵ | −5.126 | chr11 | 1674136 | 1675916 | 1,781 | 38 | Exon |
| KRTAP5-7 |
8.51×10⁻⁵ | −4.239 | chr11 | 70915825 | 70917331 | 1,507 | 38 | Exon |
| KRTAP5-7 |
1.42×10⁻⁵ | −7.019 | chr11 | 70909034 | 70912320 | 3,287 | 74 | Upstream TSS |
| KRTAP5-8 |
1.42×10⁻⁵ | −5.033 | chr11 | 70926237 | 70927983 | 1,747 | 48 | Exon |
| KRTAP5-9 |
8.51×10⁻⁵ | −4.115 | chr11 | 70936504 | 70937899 | 1,396 | 35 | Promoter |
Among the most significantly enriched terms, we also
found the GO Molecular Function (MF) term concerning GTPase
superfamily ‘GO:0005096: GTPase activator activity’ (Table III). Numerous differentially
methylated genes belonged to the five RAS GTPase families. In
particular, 4 genes from the ARF family were generally implicated
in vesicular transport, 9 genes from the RAB family were mainly
involved in membrane trafficking, 2 genes from the RAN family were
associated with nuclear transport, 6 genes from the RAS family were
implicated in cellular proliferation and 25 genes from the RHO
family were involved in cytoskeletal dynamics and morphology
(Table V). These results pointed
towards a different methylation profile of RAS GTPases genes in
FBC, as compared with MBC.
| Table V.Ras GTPase superfamily genes
identified to be differentially methylated when female breast
cancer cases were compared with male breast cancer cases. |
Table V.
Ras GTPase superfamily genes
identified to be differentially methylated when female breast
cancer cases were compared with male breast cancer cases.
| Gene symbol | Ras subfamily | P-value | MAT score | Chromosome | Region start
at: | Region end at: | DMR length, bp | Probes in
region | DMR position |
|---|
| ARF1 | Arf |
5.68×10⁻⁵ | 4.105 | chr1 | 226336193 | 226338188 | 1,996 | 52 | Promoter |
| ARF4 | Arf |
7.09×10⁻⁵ | 4.004 | chr3 | 57557804 | 57559228 | 1,425 | 40 | Promoter |
| ARFGAP3 | Arf |
8.51×10⁻⁵ | −4.234 | chr22 | 41520156 | 41522358 | 2,203 | 40 | Downstream CDS
end |
| ARL16 | Arf |
2.84×10⁻⁵ | −4.533 | chr17 | 77258588 | 77260369 | 1,782 | 34 | Promoter |
| RAB24 | Rab |
7.09×10⁻⁵ | −4.266 | chr5 | 176661091 | 176662461 | 1,371 | 38 | Exon |
| RAB26 | Rab |
8.51×10⁻⁵ | −4.113 | chr16 | 2141352 | 2142806 | 1,455 | 26 | Exon |
| RAB36 | Rab |
8.51×10⁻⁵ | −4.182 | chr22 | 21838547 | 21839857 | 1,311 | 33 | Downstream CDS
end |
| RAB3GAP2 | Rab |
2.84×10⁻⁵ | 4.379 | chr1 | 218510144 | 218511588 | 1,445 | 41 | Intron |
| RAB3IP | Rab |
5.68×10⁻⁵ | 4.103 | chr12 | 68492976 | 68494498 | 1,523 | 42 | Exon |
| RAB4A | Rab |
8.51×10⁻⁵ | −4.155 | chr1 | 227474954 | 227476365 | 1,412 | 32 | Intron |
| RAB5A | Rab |
4.26×10⁻⁵ | 4.266 | chr3 | 19963331 | 19965486 | 2,156 | 57 | Promoter |
| RAB7L1 | Rab |
7.09×10⁻⁵ | −4.254 | chr1 | 204009073 | 204011081 | 2,009 | 48 | Exon |
| RABGGTA | Rab |
4.26×10⁻⁵ | −4.383 | chr14 | 23805254 | 23806759 | 1,506 | 42 | Exon |
| RANBP1 | Ran |
8.51×10⁻⁵ | −4.095 | chr22 | 18495324 | 18496829 | 1,506 | 30 | Downstream CDS
end |
| RANBP1 | Ran |
8.51×10⁻⁵ | −4.156 | chr22 | 18491321 | 18493103 | 1,783 | 50 | Exon |
| RANBP3L | Ran |
5.68×10⁻⁵ | 4.066 | chr5 | 36282283 | 36283445 | 1,163 | 21 | Downstream CDS
end |
| RANBP3L | Ran |
2.84×10⁻⁵ | 4.341 | chr5 | 36336981 | 36338826 | 1,846 | 52 | Promoter |
| HRAS | Ras |
1.42×10⁻⁵ | −5.077 | chr11 | 520023 | 522094 | 2,072 | 59 | Downstream CDS
end |
| RAP1A | Ras |
1.42×10⁻⁵ | −5.056 | chr1 | 111991970 | 111993933 | 1,964 | 51 | Intron |
| RASD1 | Ras |
5.68×10⁻⁵ | 4.214 | chr17 | 17338882 | 17341351 | 2,470 | 65 | Promoter |
| RASD2 | Ras |
5.68×10⁻⁵ | 4.104 | chr22 | 34265450 | 34266847 | 1,398 | 25 | Upstream TSS |
| RASGRP2 | Ras |
7.09×10⁻⁵ | −4.299 | chr11 | 64247878 | 64250375 | 2,498 | 68 | Downstream CDS
end |
| RASL10A | Ras |
8.51×10⁻⁵ | −4.092 | chr22 | 28041625 | 28043157 | 1,533 | 38 | Promoter |
| RHOU | Rho |
8.51×10⁻⁵ | −4.149 | chr1 | 226844408 | 226845837 | 1,430 | 33 | Upstream TSS |
| ARHGAP11A | Rho-GAP |
2.84×10⁻⁵ | 4.353 | chr15 | 30718918 | 30720431 | 1,514 | 32 | Promoter |
| ARHGAP19 | Rho-GAP |
5.68×10⁻⁵ | 4.068 | chr10 | 99019196 | 99020955 | 1,760 | 41 | Intron |
| ARHGAP19-SLIT1 | Rho-GAP |
8.51×10⁻⁵ | −4.172 | chr10 | 98938793 | 98940326 | 1,534 | 33 | Intron |
| ARHGAP23 | Rho-GAP |
8.51×10⁻⁵ | −4.181 | chr17 | 33872823 | 33874371 | 1,549 | 43 | Exon |
| ARHGAP32 | Rho-GAP |
5.68×10⁻⁵ | 4.202 | chr11 | 128444021 | 128445428 | 1,408 | 32 | Intron |
| ARHGAP32 | Rho-GAP |
5.68×10⁻⁵ | 4.150 | chr11 | 128438912 | 128440364 | 1,453 | 36 | Exon |
| ARHGAP35 | Rho-GAP |
8.51×10⁻⁵ | −4.156 | chr19 | 52193356 | 52195197 | 1,842 | 50 | Exon |
| ARHGAP40 | Rho-GAP |
8.51×10⁻⁵ | −4.197 | chr20 | 36676834 | 36678364 | 1,531 | 43 | Intron |
| DLC1 | Rho-GAP |
7.09×10⁻⁵ | 4.005 | chr8 | 13414150 | 13415703 | 1,554 | 33 | Intron |
| FAM13B | Rho-GAP |
5.68×10⁻⁵ | 4.186 | chr5 | 137395434 | 137396944 | 1,511 | 41 | Promoter |
| GMIP | Rho-GAP |
5.68×10⁻⁵ | −4.377 | chr19 | 19605567 | 19607497 | 1,931 | 49 | Exon |
| SH3BP1 | Rho-GAP |
8.51×10⁻⁵ | −4.153 | chr22 | 36367680 | 36369434 | 1,755 | 38 | Exon |
| SRGAP1 | Rho-GAP |
5.68×10⁻⁵ | −4.352 | chr12 | 62522064 | 62523557 | 1,494 | 13 | Upstream TSS |
| ABR | Rho-GEF |
8.51×10⁻⁵ | −4.159 | chr17 | 961466 | 963170 | 1,705 | 42 | Intron |
| ARHGEF10 | Rho-GEF |
1.42×10⁻⁵ | −7.052 | chr8 | 1773070 | 1777363 | 4,294 | 103 | Intron |
| ARHGEF25 | Rho-GEF |
8.51×10⁻⁵ | −4.212 | chr12 | 56293862 | 56295869 | 2,008 | 55 | Exon |
| ARHGEF34P | Rho-GEF |
1.42×10⁻⁵ | −6.205 | chr7 | 143612540 | 143615423 | 2,884 | 80 | Promoter |
| ARHGEF35 | Rho-GEF |
8.51×10⁻⁵ | −4.117 | chr7 | 143518580 | 143520964 | 2,385 | 46 | Intron |
| ARHGEF5 | Rho-GEF |
8.51×10⁻⁵ | −4.199 | chr7 | 143683885 | 143685539 | 1,655 | 46 | Intron |
| ARHGEF5 | Rho-GEF |
1.42×10⁻⁵ | −5.067 | chr7 | 143692916 | 143695114 | 2,199 | 61 | Exon |
| ARHGEF5 | Rho-GEF |
1.42×10⁻⁵ | −5.142 | chr7 | 143690467 | 143692900 | 2,434 | 67 | Exon |
| FARP2 | Rho-GEF |
7.09×10⁻⁵ | 4.051 | chr2 | 241943420 | 241944877 | 1,458 | 25 | Promoter |
| FGD5 | Rho-GEF |
8.51×10⁻⁵ | −4.214 | chr3 | 14835085 | 14836481 | 1,397 | 39 | Promoter |
| ITSN2 | Rho-GEF |
2.84×10⁻⁵ | 4.387 | chr2 | 24334440 | 24336066 | 1,627 | 44 | Exon |
| KALRN | Rho-GEF |
8.51×10⁻⁵ | −4.138 | chr3 | 125292634 | 125294221 | 1,588 | 44 | Upstream TSS |
| PLEKHG1 | Rho-GEF |
8.51×10⁻⁵ | −4.136 | chr6 | 151185066 | 151186484 | 1,419 | 19 | Exon |
| TIAM1 | Rho-GEF |
7.09×10⁻⁵ | 4.004 | chr21 | 31851782 | 31853729 | 1,948 | 53 | Promoter |
| TIAM2 | Rho-GEF |
8.51×10⁻⁵ | −4.169 | chr6 | 155580243 | 155582141 | 1,899 | 48 | Intron |
We further performed the comparison between FBC
(n=10) and MBC (n=6) with BRCAX mutation condition. A total of
1,242 DMRs corresponding to 1,102 genes were reported. A total of 8
GO terms generally associated with RAS GTPase superfamily,
particularly RHO-GAP and RHO-GEF proteins and RAB GTPase activity,
were identified using the DAVID database, (Table SIVA) as already observed when all
cases were considered.
Mutation-related DNA methylation
differences in FBC among patients with BRCA1, BRCA2 and BRCAX
mutations
Initially, we compared the DNA methylation profile
of BRCAX patients (n=16) was compared with that of those with BRCA1
and BRCA2 mutations (n=8), irrespective of their sex. A total of
364 DMRs were reported; however, no significant GO terms associated
with these genes were identified by DAVID analysis. Therefore, to
limit the intrinsic heterogeneity within the groups, the next
comparisons were restricted to women. The mutation classes were
compared as follows:
a) BRCA1 vs. BRCA2 (n=4; n=3)
Following the comparison between women with BRCA1
and those with BRCA2 mutations, 802 DMRs associated with 755 genes
were reported and the term ‘GO:0019787: Small conjugating protein
ligase activity’ was found by DAVID analysis to be highly
represented (Table SIVB) Despite
the limited number of cases, this result may indicate a different
modulation of the ubiquitination pathway between BRCA1 and BRCA2
FBC.
b) BRCA1 vs. BRCAX (n=4; n=10)
Following the comparison between patients with BRCA1
and those with BRCAX conditions, 484 DMRs associated with 464 genes
were found and the term ‘GO:0051240: Positive regulation of
multicellular organismal process’ (Table SIVC) was identified by DAVID
analysis. This term is very broad making it challenging to
establish the biological differences between these patient groups.
Of note, BRCAX patients were heterogeneous and belonged to
different molecular subtypes. On the contrary, patients with BRCA1
mutations were more homogeneous and belonged to the triple-negative
molecular subtype (Table I).
c) BRCA2 vs. BRCAX (n=3; n=10)
Following the comparison between patients with BRCA2
mutations and those with a BRCAX condition, 673 DMRs corresponding
to 629 genes were reported. Following DAVID analysis, 2 significant
GO terms and 1 KEGG pathway (Table
SIVD) were identified. These terms were ‘GO:0008047: Enzyme
activator activity’, ‘GO: 0060589: Nucleoside-triphosphatase
regulator activity’ and ‘hsa05220: Chronic myeloid leukemia’. Some
genes found differentially methylated and included in the ‘chronic
myeloid leukemia’ KEGG pathway, such as CDKN1B (p27) and PIK3R1,
were also found frequently mutated in a very large study on BC
(26).
d) BRCA1 vs. BRCA2/BRCAX (n=4;
n=13)
Following the comparison between patients with BRCA1
and those with BRCA2/BRCAX mutations, 861 DMRs corresponding to 819
genes were reported. Following DAVID analysis, the term
‘GO:0008092: Cytoskeletal protein binding’ was identified (Table SIVE). Certain genes included in the
term are known to interact with microfilaments, microtubules and
intermediate filaments. This result indicated that these groups of
patients have a different DNA methylation profile of the
cytoskeleton-related genes when compared against each other and
this probably influences the architecture of the cytoskeleton.
e) BRCA2 vs. BRCA1/BRCAX (n=3;
n=14)
Following the comparison between patients with BRCA2
and those with BRCA1/BRCAX mutations, found 1,380 DMRs
corresponding to 1,251 genes were reported. Following DAVID
analysis, 7 enriched KEGG pathways were identified, most of which
were associated with cancer (Table
SIVF). Of note, PIK3CA and PIK3R1 were found to be frequently
mutated in a very large study on BC (26).
However, it is difficult to make conclusions about
the importance of these results in discriminating BRCA2 from
BRCA1/BRCAX patients, since BRCA2 group consisted of a limited
number of cases (n=3).
f) BRCAX vs. BRCA1/BRCA2 (n=10;
n=7)
Following the comparison between BRCAX patients and
those with BRCA1/BRCA2 mutations, 962 DMRs corresponding to 914
genes were reported. Following DAVID analysis, 3 enriched GO MF
terms associated with GTPase regulatory activity were identified
(Table SIVG). These results
indicated that the DNA methylation levels of the GTPase genes may
be a discriminatory factor between BRCA1/BRCA2 and BRCAX cases.
Discussion
Aberrant DNA methylation is an important and
frequent event extensively studied in cancer, including BC.
Published data have revealed that such epigenetics modifications
are directly associated with tumor onset and progression. To the
best of our knowledge, a comprehensive global DNA methylation study
exploring differences in the methylome of female and male BC has
not been performed by using Affymetrix human promoter arrays.
This-omic platform allowed the quantification of the methylation
levels of the CpG islands located in 25,500 human promoter regions.
The DNA methylation profiles of 24 patients with familial BC were
studied. Following the comparison between FBC and MBC, 2,486
significant differentially methylated genes were identified. The
enrichment analysis suggested that most of the genes encompassed
processes associated with the cytoskeleton composition and
architecture such as ‘keratin filament’, ‘intermediate filament’
and ‘cytoskeletal part’. Of note, almost all genes included in the
GO term: ‘Keratin filament’ were hypomethylated in FBC, as compared
with MBC, suggesting their probable over-expression in the former,
as compared to the latter. In particular, the hypomethylation of
the cytokeratin genes KRT6A and KRT14 was observed in
FBC, as compared with MBC. Keratins are considered to be
immunohistochemical diagnostic tumor markers and several studies
have provided evidence on active keratin involvement in cancer cell
invasion and metastasis, as well as treatment responsiveness
(27). The overexpression of these
genes has been found to be positively correlated with a high tumor
grade in BC and the expression of KRT6A and KRT14 to be frequently
associated with basal molecular subtype (28).
Following the comparison between the FBC and MCB
methylome, several differentially methylated genes that belonged to
the RAS GTPase superfamily and whose role in cancer is well
documented, were identified. The same results were obtained by
limiting the comparison to FBC and MBC patients with BRCAX
condition. The RAS GTPase superfamily is composed of 5 families:
RHO, RAS, RAB, ARF and RAN; all these families were represented in
our findings with numerous RHO genes found to be differentially
methylated. Consequently, a different regulation of the expression
of proteins in the RHO pathways in male and female BC may occur
affecting cell migration and invasion. In fact, the RHO GTPase
family plays an important role in cytoskeleton rearrangements and
is a key regulator of processes involved in cellular adhesion,
migration, proliferation, survival, differentiation and malignant
transformation. The RHO family includes RHO-GEF and RHO-GAP
proteins that are often deregulated not only in BC but also in
several other tumor types (29).
With regard to other RAS GTPase families, RAB genes
were found to be both hyper- and hypo-methylated when comparing FBC
and MBC methylomes, which could likely down- or upregulate gene
expression, respectively. More specifically, 12 members of the
RAB-GAP were found to be differentially methylated in FBC, as
compared with MBC. The RAB proteins are involved in a wide range of
functions including the trafficking between Golgi and endosomes,
phagocytosis and the assembly of adherent junctions and
mitochondrial dynamics. Certain studies have reported the
involvement of RAB GTPases in different types of cancer (30,31)
included BC. In a study by Callari et al (32) the global gene expression of 53 FBC
was compared to that of 37 MBC by microarray technology and the
dysregulation of members of the RAS GTPase superfamily was
observed, in line with the present results. Transcriptional
alteration of genes belonging to all 5 families was also identify
in that study. The authors hypothesized that there was a
sex-related modulation of the cytoskeleton organization in BC cells
that influenced the cancer invasion process. In combination, the
present results suggested that genes involved in cytoskeleton
dynamics such as keratins and genes of the RAS GTPase superfamily,
have different DNA methylation levels in FBC, as compared to MBC.
According to Callari et al (32), we hypothesized that the expression
dysregulation, likely determined by the variations of DNA
methylation, may influence these cancer aggressive properties, in
which the cytoskeleton plays an essential role (i.e. adhesion,
migration and invasion).
To identify novel patterns of DNA methylation
specific to the different mutations (BRCA1, BRCA2 or BRCAX) only
FBC cases were used, since that was the largest group in our cohort
of patients. Below, the salient results found in the different
comparison classes are discussed.
Following the comparison between patients with BRCA1
and BRCA2 mutations, variations were observed in the DNA
methylation of genes involved in the ubiquitination pathway. BRCA1
works with BARD1 to catalyze the transfer of ubiquitin onto protein
substrates. The RING domain contained in the N-terminal region of
both BRCA1 and BARD1 is responsible for dimerization and ubiquitin
ligase activity, which is required for its tumor suppressor
function (33). Moreover, the
missense mutations in the BRCA1 RING domain were identified in
families with a high risk for BC. Therefore, the BRCA1 mutation
could alter the ubiquitination pathway and in turn affects the DNA
methylation level of the genes belonging to this pathway. The
methylome comparison was performed on a limited number of cases; a
larger number of patients may confirm this hypothesis.
Following the comparison between patients with BRCA1
and those with BRCA2 or BRCAX mutations, a hypo/hyper-methylation
of genes encoding cytoskeletal binding proteins was observed, which
may suggest a different expression modulation of genes involved in
cytoskeletal dynamics.
The patients with BRCA1 enrolled in the present
study had triple-negative/basal-like tumors while the BRCA2/BRCAX
cases had luminal A/B tumors. The basal-like tumors originate from
normal mammary myoepithelial cells and express genes associated
with the normal myoepithelium such as high molecular weight
cytokeratins (CK5/6, CK14 and CK17). Conversely, luminal A/B tumors
originate from luminal cells of the breast duct and lobule and they
express genes associated with luminal cells such as ER, low
molecular weight cytokeratins (CK7, CK8, CK18 and CK19), as well as
PGR, GATA3, BCL2 and other ER-induced genes (34). In this context, the different
methylation pattern of the cytoskeletal binding proteins may be
associated with the expression of distinct cytoskeleton-related
proteins in tumors with distinct molecular sub-types.
Following the comparison between patients with BRCAX
and those with BRCA1 or BRCA2 mutations, variations in DNA
methylation were identified among genes associated with the GTPase
regulatory activity. The results may help to obtain a better
understanding of the biology of BRCAX groups, as compared to
BRCA1/BRCA2 groups. Pending confirmation by a study with a larger
number of cases, the evaluation of the GTPase regulatory
activity-related genes methylation levels could characterize and
distinguish these groups of patients. In conclusion, in the current
study for the first time, the global DNA methylation was profiled
in FBC and MBC patients with a positive family history by using the
Affymetrix human promoter array platform. With regards to MBC, only
Johansson et al (35)
assessed genome-wide DNA methylation profiles using Illumina 450K
Infinium methylation arrays and compared them with the
transcriptional subgroups of MBC, luminal M1 and M2. They
identified two epitypes through unsupervised clustering (ME1 and
ME2) associated with the two transcriptional subgroups and the DNA
methylation data underscored the heterogeneity of MBC, suggesting
it should not be defined using the conventional criteria applied to
FBC. The present data reported different DNA methylation levels of
GTPase-related genes (RHO-GAP, RHO-GEF and RAB GTPase) and
keratin-related genes, which are important components of
cytoskeleton, between FBC and MBC. These results may help elucidate
an aspect of the molecular differences between male and female BC.
The comparisons of DNA methylation profiles among women with BRCA1,
BRCA2 or BRCAX mutations led to several observations and
conclusions. In patients with BRCA1 or BRCA2 mutations there may be
a different modulation of the ubiquitination pathway. Different DNA
methylation levels of genes crucial for cancer pathways were
identified in patients with BRCA2, as compared to those with BRCAX
or BRCA1/BRCAX mutations. Different DNA methylation levels of genes
involved in cytoskeleton architecture were identified in patients
with BRCA1, as compared to those with BRCA2/BRCAX mutations; this
was consistent with the fact that BRCA1 tumors frequently exhibit a
basal-like molecular subtype, while BRCA2/X tumors exhibit a
luminal molecular subtype. Finally, different DNA methylation
levels in certain GTPase genes were observed in BRCAX patients, as
compared to BRCA1/2 cases; these results may help better identify
and distinguish groups of patients carrying these mutations in the
future. In a next prospective study we will increase the number of
patients (especially cases of familial MBC) to carry out the
analysis of the methylome. We will collect fresh BC biopsy
specimens for gene expression analysis in order to correlate the
most relevant hyper/hypo-methylated genes to their expression
levels.
Supplementary Material
Supporting Data
Acknowledgements
The authors would like to thank Dr Marialuisa
Crosatti (University of Leicester, Leicester, UK) for the
linguistic revision of the manuscript, as well as Professor Marina
Colombi and Professor Massimo Gennarelli, who were responsible for
the Affymetrix platform at the Department of Molecular and
Translational Medicine, Division of Biology and Genetics
(University of Brescia, Brescia, Italy).
Funding
The present study was supported by funding from Lega
Italiana per la Lotta contro i Tumori (LILT) Roma-Brescia (grant
no. 2762012), Comitato Nazionale Universitario (CNU)-Brescia, the
Italian Ministry of University and Research (FFRB grant), the
University of Brescia (local grants). EA was supported by a
postdoctoral fellowship from Associazione Davide Rodella Onlus,
Brescia. IG was supported by a Postdoctoral fellowship
from-Ricerchiamo Onlus-, Brescia, Italy.
Availability of data and materials
The datasets generated and/or analysed during the
current study are available in the Gene Expression Omnibus
repository (www.ncbi.nlm.nih.gov/geo/query/acc.cgi?acc=GSE153636).
Authors' contributions
EA, AS and GDP conceived the project. EA performed
the experiments, interpreted the results and generated the figures.
AS and EA wrote the manuscript. IG contributed to the plotting of
the data and their interpretation, as well as the revision of the
manuscript. AS and GDP assessed and confirmed the authenticity of
all raw data. GDP and MC made their intellectual contribution in
the interpretation of the results and the critical revision of the
manuscript. The medical doctors, EM and PC, contributed as
geneticists; the medical doctors AC, PI, FZ, PLC and CTP provided
the formalin-fixed paraffin-embedded tissues sections from patients
with breast cancer; all medical doctors contributed to the
acquisition of clinical data. Furthermore, EM, PC, AC, PI, FZ, PLC
and CTP made substantive contributions to analysis and
interpretation of experimental data. All co-authors critically
revised the manuscript. All authors read and approved the final
manuscript.
Ethics approval and consent to
participate
The present study was approved by the Ethics
Committee of Spedali Civili of Brescia (approval no. NP 1439;
Brescia, Italy). Written informed consent was obtained from all
patients.
Patient consent for publication
Not applicable.
Competing interests
The authors declare that they have no competing
interests.
References
|
1
|
Harbeck N, Penault-Llorca F, Cortes J,
Gnant M, Houssami N, Poortmans P, Ruddy K, Tsang J and Cardoso F:
Breast cancer. Nat Rev Dis Prim. 5:662019. View Article : Google Scholar : PubMed/NCBI
|
|
2
|
Kobayashi H, Ohno S, Sasaki Y and Matsuura
M: Hereditary breast and ovarian cancer susceptibility genes
(Review). Oncol Rep. 30:1019–1029. 2013. View Article : Google Scholar : PubMed/NCBI
|
|
3
|
Marchina E, Fontana MG, Speziani M, Salvi
A, Ricca G, Di Lorenzo D, Gervasi M, Caimi L and Barlati S: BRCA1
and BRCA2 genetic test in high risk patients and families:
Counselling and management. Oncol Rep. 24:1661–1667. 2010.
View Article : Google Scholar : PubMed/NCBI
|
|
4
|
Wang YA, Jian JW, Hung CF, Peng HP, Yang
CF, Cheng HCS and Yang AS: Germline breast cancer susceptibility
gene mutations and breast cancer outcomes. BMC Cancer. 18:3152018.
View Article : Google Scholar : PubMed/NCBI
|
|
5
|
Melchor L and Benítez J: The complex
genetic landscape of familial breast cancer. Hum Genet.
132:845–863. 2013. View Article : Google Scholar : PubMed/NCBI
|
|
6
|
Kulis M and Esteller M: DNA methylation
and cancer. Adv Genet. 70:27–56. 2010. View Article : Google Scholar : PubMed/NCBI
|
|
7
|
Pinto R, Summa S, Pilato B and Tommasi S:
DNA methylation and miRNAs regulation in hereditary breast cancer:
Epigenetic changes, players in transcriptional and
post-transcriptional regulation in hereditary breast cancer. Curr
Mol Med. 14:45–57. 2014. View Article : Google Scholar : PubMed/NCBI
|
|
8
|
Flanagan J, Kugler S, Waddell N, Johnstone
CN, Marsh A, Henderson S, Simpson P, da Silva L; kConFab
Investigators, ; Khanna K, et al: DNA methylome of familial breast
cancer identifies distinct profiles defined by mutation status.
Breast Cancer Res. 86:420–33. 2010.
|
|
9
|
Gucalp A, Traina TA, Eisner JR, Parker JS,
Selitsky SR, Park BH, Elias AD, Baskin-Bey ES and Cardoso F: Male
breast cancer: A disease distinct from female breast cancer. Breast
Cancer Res Treat. 173:37–48. 2019. View Article : Google Scholar : PubMed/NCBI
|
|
10
|
Kornegoor R, van Diest PJ, Buerger H and
Korsching E: Tracing differences between male and female breast
cancer: Both diseases own a different biology. Histopathology.
67:888–897. 2015. View Article : Google Scholar : PubMed/NCBI
|
|
11
|
Moncini S, Salvi A, Zuccotti P, Viero G,
Quattrone A, Barlati S, De Petro G, Venturin M and Riva P: The role
of miR-103 and miR-107 in regulation of CDK5R1 expression and in
cellular migration. PLoS One. 6:e200382011. View Article : Google Scholar : PubMed/NCBI
|
|
12
|
Johansson I, Ringnér M and Hedenfalk I:
The landscape of candidate driver genes differs between male and
female breast cancer. PLoS One. 8:e782992013. View Article : Google Scholar : PubMed/NCBI
|
|
13
|
Rizzolo P, Silvestri V, Tommasi S, Pinto
R, Danza K, Falchetti M, Gulino M, Frati P and Ottini L: Male
breast cancer: Genetics, epigenetics, and ethical aspects. Ann
Oncol. 24 (Suppl 8):viii75–viii82. 2013. View Article : Google Scholar
|
|
14
|
André S, Nunes SP, Silva F, Henrique R,
Félix A and Jerónimo C: Analysis of epigenetic alterations in
homologous recombination dna repair genes in male breast cancer.
Int J Mol Sci. 21:27152020. View Article : Google Scholar
|
|
15
|
Kornegoor R, Moelans CB, Verschuur-Maes
AH, Hogenes MCH, de Bruin PC, Oudejans JJ and van Diest PJ:
Promoter hypermethylation in male breast cancer: Analysis by
multiplex ligation-dependent probe amplification. Breast Cancer
Res. 14:R1012012. View
Article : Google Scholar : PubMed/NCBI
|
|
16
|
Vermeulen MA, van Deurzen CHM, Doebar SC,
de Leng WWJ, Martens JWM, van Diest PJ and Moelans CB: Promoter
hypermethylation in ductal carcinoma in situ of the male breast.
Endocr Relat Cancer. 26:575–584. 2019. View Article : Google Scholar : PubMed/NCBI
|
|
17
|
Pinto R, Pilato B, Ottini L, Lambo R,
Simone G, Paradiso A and Tommasi S: Different methylation and
MicroRNA expression pattern in male and female familial breast
cancer. J Cell Physiol. 228:1264–1269. 2013. View Article : Google Scholar : PubMed/NCBI
|
|
18
|
Deb S, Gorringe KL, Pang JM, Byrne DJ,
Takano EA; kConFab Investigators, ; Dobrovic A and Fox SB: BRCA2
carriers with male breast cancer show elevated tumour methylation.
BMC Cancer. 17:6412017. View Article : Google Scholar : PubMed/NCBI
|
|
19
|
Rizzolo P, Silvestri V, Valentini V, Zelli
V, Zanna I, Masala G, Bianchi S, Palli D and Ottini L:
Gene-specific methylation profiles in BRCA-mutation positive and
BRCA-mutation negative male breast cancers. Oncotarget.
9:19783–19792. 2018. View Article : Google Scholar : PubMed/NCBI
|
|
20
|
Abeni E, Salvi A, Marchina E, Traversa M,
Arici B and De Petro G: Sorafenib induces variations of the DNA
methylome in HA22T/VGH human hepatocellular carcinoma-derived
cells. Int J Oncol. 51:128–144. 2017. View Article : Google Scholar : PubMed/NCBI
|
|
21
|
Omura N, Li CP, Li A, Hong SM, Walter K,
Jimeno A, Hidalgo M and Goggins M: Genome-wide profiling of
methylated promoters in pancreatic adenocarcinoma. Cancer Biol
Ther. 7:1146–1156. 2008. View Article : Google Scholar : PubMed/NCBI
|
|
22
|
Ling G and Waxman DJ: DNase I digestion of
isolated nulcei for genome-wide mapping of DNase hypersensitivity
sites in chromatin. Methods Mol Biol. 977:21–33. 2013. View Article : Google Scholar : PubMed/NCBI
|
|
23
|
Livak KJ and Schmittgen TD: Analysis of
relative gene expression data using real-time quantitative PCR and
the 2(-Delta Delta C(T)) method. Methods. 25:402–408. 2001.
View Article : Google Scholar : PubMed/NCBI
|
|
24
|
Johnson WE, Li W, Meyer CA, Gottardo R,
Carroll JS, Brown M and Liu XS: Model-based analysis of
tiling-arrays for ChIP-chip. Proc Natl Acad Sci USA.
103:12457–12462. 2006. View Article : Google Scholar : PubMed/NCBI
|
|
25
|
Huang DW, Sherman BT and Lempicki RA:
Systematic and integrative analysis of large gene lists using DAVID
bioinformatics resources. Nat Protoc. 4:44–57. 2009. View Article : Google Scholar : PubMed/NCBI
|
|
26
|
Cancer Genome Atlas Network, .
Comprehensive molecular portraits of human breast tumours. Nature.
490:61–70. 2012. View Article : Google Scholar : PubMed/NCBI
|
|
27
|
Karantza V: Keratins in health and cancer:
More than mere epithelial cell markers. Oncogene. 30:127–138. 2011.
View Article : Google Scholar : PubMed/NCBI
|
|
28
|
Shao MM, Chan SK, Yu AM, Lam CC, Tsang JY,
Lui PC, Law BK, Tan PH and Tse GM: Keratin expression in breast
cancers. Virchows Arch. 461:313–322. 2012. View Article : Google Scholar : PubMed/NCBI
|
|
29
|
Wertheimer E, Gutierrez-Uzquiza A,
Rosemblit C, Lopez-Haber C, Sosa MS and Kazanietz MG: Rac signaling
in breast cancer: A tale of GEFs and GAPs. Cell Signal. 24:353–362.
2012. View Article : Google Scholar : PubMed/NCBI
|
|
30
|
Subramani D and Alahari SK:
Integrin-mediated function of Rab GTPases in cancer progression.
Mol Cancer. 9:3122010. View Article : Google Scholar : PubMed/NCBI
|
|
31
|
Ishibashi K, Kanno E, Itoh T and Fukuda M:
Identification and characterization of a novel Tre-2/Bub2/Cdc16
(TBC) protein that possesses Rab3A-GAP activity. Genes Cells.
14:41–52. 2009. View Article : Google Scholar : PubMed/NCBI
|
|
32
|
Callari M, Cappelletti V, De Cecco L,
Musella V, Miodini P, Veneroni S, Gariboldi M, Pierotti MA and
Daidone MG: Gene expression analysis reveals a different
transcriptomic landscape in female and male breast cancer. Breast
Cancer Res Treat. 127:601–610. 2011. View Article : Google Scholar : PubMed/NCBI
|
|
33
|
Wu W, Koike A, Takeshita T and Ohta T: The
ubiquitin E3 ligase activity of BRCA1 and its biological functions.
Cell Div. 3:12008. View Article : Google Scholar : PubMed/NCBI
|
|
34
|
Bertucci F, Finetti P and Birnbaum D:
Basal breast cancer: A complex and deadly molecular subtype. Curr
Mol Med. 12:96–110. 2011. View Article : Google Scholar
|
|
35
|
Johansson I, Lauss M, Holm K, Staaf J,
Nilsson C, Fjällskog ML, Ringnér M and Hedenfalk I: Genome
methylation patterns in male breast cancer-Identification of an
epitype with hypermethylation of polycomb target genes. Mol Oncol.
9:1565–1579. 2015. View Article : Google Scholar : PubMed/NCBI
|