Introduction
Mycosis fungoides (MF) is the most common type of
cutaneous T-cell lymphoma (CTCL), accounting for ~60% of all CTCL
cases (1). The incidence of MF has
increased rapidly in recent years and it is now the second most
common type of extra-nodal non-Hodgkin lymphoma (2). However, current understanding of MF
remains very limited. The course of MF is insidious, with
early-stage patients exhibiting erythema and plaques on the skin
(T1/T2 stage) (3). Skin tumors then
develop as the disease reaches the advanced stage (T3 stage)
(3). In the advanced stage,
malignant T-cells may invade peripheral blood and other organs,
leading to the development of leukemia MF or Sézary syndrome
(4). For patients with early-stage
MF, skin-specific treatments, including local application of
glucocorticoids, retinoic acid, UVB irradiation and local radiation
therapy, tend to achieve more favorable results (5). However, as the disease progresses to
the advanced stage, the spread of the lesions affects the
surrounding lymph nodes and internal organs. Local treatment can
then only relieve the symptoms and treating the disease through
systemic chemotherapy is difficult to achieve (6). The 5-year survival rate of Sézary
syndrome is only 24% (7). The lack
of effective treatments for advanced MF and Sézary syndrome is
largely due to the poor understanding of its pathogenesis.
Growth factor independence-1 (GFI-1) is a nuclear
zinc finger protein that serves an important biological function in
the occurrence and development of hematopoietic cells and nerve
cells (8,9). GFI-1 is required as a transcriptional
repressor in several stages of hematopoietic cell development; for
example, in the progression from stem cells to precursor cells to
differentiated mature lymphocytes and myeloid cells (10). It also serves an important biological
role in the development of T-cells, particularly in the
differentiation and function of Th2 cells (9,11).
Studies have reported that during the development of T-cells, the
thymus T-cell precursors endogenously express a certain amount of
GFI-1, whereas mature peripheral T-cells do not express any
detectable GFI-1. However, antigen stimulation and activation of
Erk1/2 cause T-cell activation, leading to upregulation of GFI-1
expression in peripheral mature T-cells, indicating that it serves
an important role in the activation of T-cells (12). GFI-1 serves an important role in the
differentiation and proliferation of IL-4-mediated Th2 cells, and a
retrovirally mediated increase in GIF-1 expression promotes the
proliferation of Th2 cells (11).
GFI-1 may serve a suppressive role in the formation of
hematological tumors; in mouse models, the absence of GFI-1
expression may lead to the development of myeloid leukemia, whereas
overexpression of GFI-1 may cause lymphoma. Therefore, depending on
the environment in which the cells are located, GFI-1 has
tumor-suppressive and tumor-promoting effects (13). These studies demonstrate that
abnormal expression of GFI-1 serves an important role in the
occurrence and development of tumors, but the expression and role
of GFI-1 in cutaneous T-cell lymphoma remains unclear.
In the present study, the protein expression of
GFI-1 in patients with MF at different clinical stages was first
determined by immunohistochemistry. Subsequently,
lentivirus-mediated cell transfection was used to specifically
knockdown GFI-1 expression. MTS-based cell viability assays
and colony formation assays were performed to detect cell
proliferation and colony formation in vitro following GFI-1
knockdown. The present study aimed to investigate whether GFI-1
silencing can increase spontaneous apoptosis and induce cell cycle
arrest in vitro. Transcriptome analysis was performed to
detect the changes in apoptosis and cell cycle-related genes
following GFI-1 knockdown. The dual-luciferase reporter assay was
performed to determine whether GFI-1 directly regulates the
transcription of P21 in Hut-78 cells.
Materials and methods
Skin tissue sections of MF and benign
inflammatory dermatoses (BIDs)
Skin biopsy tissues were fixed with 10% neutral
buffered formalin for 24 h at room temperature, paraffin-embedded
tissue sections (3 µm) from 33 patients at different stages of MF
(patch stage MF, n=11; plaque stage MF, n=11; tumor stage MF, n=11)
were obtained from the clinical databases of the Department of
Dermatology and Venereology, Peking University Third Hospital and
the Department of Dermatology and Venereology, Aviation General
Hospital, Beijing, China, with approval from the Clinical Ethics
Board of Peking University Third Hospital and Aviation General
Hospital. All experiments were performed in accordance with the
Declaration of Helsinki. The characteristics of the recruited
patients are listed in Table I. The
histological diagnosis of MF was confirmed by two independent
pathologists according to the clinical and pathological diagnoses
criteria published by the International Society of Cutaneous
Lymphoma. The age range of the patients was 27–82 years, with a
mean age of 46.1 years. and there were 18 males and 15 females. The
disease durations ranged between 3 months and 30 years, with a mean
duration of 15.8 years. Skin biopsies were also obtained from 11
subjects with BIDs (chronic dermatitis n=7, lichen planus n=4) and
used as controls.
 | Table I.Characteristics of subjects with MF
(n=33). |
Table I.
Characteristics of subjects with MF
(n=33).
| Patient no. | Sex | Age | Disease duration,
yearsa | MF lesion type | Biopsy site | Overall stage |
|---|
| 1 | F | 27 | 6 | Patch | Left thigh | IB |
| 2 | M | 42 | 5 | Patch | Right waist | IB |
| 3 | M | 82 | 2 | Patch | Left thigh | IB |
| 4 | M | 37 | 26 | Patch | Back | IB |
| 5 | M | 40 | 6 | Patch | Waist | IB |
| 6 | F | 58 | >10 | Patch | Back | IB |
| 7 | M | 32 | 13 | Patch | Back | IB |
| 8 | F | 25 | >10 | Patch | Right buttock | IB |
| 9 | F | 37 | 13 | Patch | Left waist | IB |
| 10 | M | 28 | 13 | Patch | NA | IB |
| 11 | M | 68 | 3 | Patch | Thigh | IA |
| 12 | F | 58 | >30 | Plaque | Left thigh | IIIA |
| 13 | F | 30 | 5 | Plaque | trunk | IB |
| 14 | F | 42 | 6 | Plaque | Left arm | IB |
| 15 | F | 36 | 8 | Plaque | buttock | IIIA |
| 16 | M | 52 | 17 | Plaque | Left buttock | IIIB |
| 17 | F | 64 | 2 | Plaque | Right arm | IIA |
| 18 | M | 74 | 3 months | Plaque | Hack | IA |
| 19 | M | 52 | 7 | Plaque | Trunk | IIA |
| 20 | F | 45 | >30 | Plaque | Left waist | IIIB |
| 21 | F | 44 | 13 | Plaque | Right back | IIA |
| 22 | F | 37 | >10 | Plaque | Back | IA |
| 23 | M | 35 | 3 | Tumor | Left arm | II |
| 24 | F | 44 | 13 | Tumor | Back | IIA |
| 25 | M | 30 | 7 | Tumor | Left waist | II |
| 26 | M | 61 | 3 | Tumor | NA | IVA |
| 27 | M | 47 | 15 | Tumor | Left waist | II |
| 28 | F | 54 | 13 | Tumor | Back | IIA |
| 29 | F | 44 | 13 | Tumor | Right back | IIA |
| 30 | M | 58 | 3 | Tumor | Right back | IVA |
| 31 | M | 58 | 2 | Tumor | Right neck | II |
| 32 | M | 28 | 7 | Tumor | Chest | IIB |
| 33 | M | 52 | 8 | Tumor | Right buttock | II |
Immunohistochemistry
Paraffin-embedded sections from 33 MF and 11 BID
cases were deparaffinized in xylene for 20 min and rehydrated with
decreasing concentrations of ethanol solutions for 5 min each, then
rinsed three times with PBS for 5 min. Next, the sections were
incubated in 3% H2O2 for 20 min at 23–26°C.
Following microwaving for antigen retrieval (15 min), the sections
were washed three times with PBS. They were incubated overnight at
4°C in a 1:50 dilution of polyclonal rabbit anti-human GFI-1
antibody (cat. no. ab21061; Abcam), and then stained using the goat
anti-rabbit/mouse antibody detection kit (cat. no. PV-9000D;
OriGene Technologies, Inc.). Following diaminobenzidine treatment,
the slides were counterstained with Mayer's hematoxylin (0.25%) at
room temperature for 10 sec. The tissue slides were scanned using
NanoZoomer (NanoZoomer-SQ C13140-01). Positive and negative
controls were included with each run of the samples. The percentage
of positive cells was assessed under high-power magnification
(×400) using an Olympus light microscope, and the mean positive
cells of three fields of view was used.
Cell lines and cell culture
The human CTCL Hut-78 cell line (ATCC no. TIB-161)
was cultured in RPMI-1640 medium supplemented with 10% FBS, 100
U/ml penicillin and 0.1 mg/ml streptomycin (Gibco; Thermo Fisher
Scientific, Inc.), and incubated at 37°C with 5% CO2 in
a humidified incubator. The peripheral blood cells of 5 patients
with benign inflammatory dermatoses (BID) patients were purified by
negative selection with monoclonal antibodies directed against
granulocytes, B cells by utilizing a Rosette Sep kit (Stemcell
Technologies, Inc.). The purity of cells was verified by FACS using
fluorescein isothiocyanate-conjugated anti-CD4 antibody (Becton
Dickinson Immunocytometry Systems). More than 90% purity of cells
was confirmed by immune phenotyping.
Lentivirus short hairpin RNA (shRNA)
vector-mediated gene knockdown
A total of four lentiviral shRNA (SH1-4) vectors
were constructed by ligating four different oligo nucleotides
encoding shRNAs against GFI-1 to an mU6-MCS-Ubi-EGFP vector (GV118;
Shanghai GeneChem Co., Ltd.) between the HpaI and
XhoI restriction enzyme sites. The oligonucleotides encoding
a scrambled shRNA were used as the control (SH0). All constructs
were verified by DNA sequencing, Lentiviruses containing shRNA
vectors were packaged and produced by Shanghai GeneChem Co., Ltd.
The Lentiviruses containing shRNA vectors were diluted at 1:10 in
medium containing polybrene (final concentration, 5 mg/ml) in the
wells with the cells. Following incubation for 12 h at 37°C, the
cultures were replenished with fresh medium and maintained for a
further 60 h. Lentiviral production and transduction were performed
as previously described (14).
Cell viability assay
Cell viability analysis was performed using a Cell
Viability Colorimetric assay kit, which is an MTS-based cell
viability assay (Promega Corporation), according to the
manufacturer's protocol. In brief, the Hut-78 cell lines were
cultured in growth factor-free RPMI-1640 medium with 10% FBS, and
were plated into 6-well plates (2×10⁴ cells/ml per well)
in 2 ml medium and incubated at 37°C with 5% CO2 for 96
h. Every 24 h, 100 µl cell suspension was transferred to a 96-well
plate, 20 µl MTS solution was added, and the sample was left for an
additional 2 h. The relative cell viability was measured at 490 nm
using a spectrophotometer. Each condition was assessed in
triplicate, and biological replicates were repeated twice.
Colony formation assay
Methylcellulose medium (MethoCult CFC; Stemcell
Technologies, Inc.) was used to analyze the ability of the cells to
form colonies in vitro. Methylcellulose medium allows for
the formation of colonies from a single cell in situ to form
a clonal colony. In the two lentiviral transfection groups (SH1 and
SH2), the untransfected cells (Hut-78), and the scramble shRNA
sequence group (SH0), 103 cells were counted under an
Olympus confocal microscope (magnification, ×200). Cells were added
to the methylcellulose medium and shaken. A syringe with a
blunt-tip needle was then used to inoculate the mixed cells into a
petri dish, where they were cultured at 37°C with 5% CO2
for 14 days. Cells were then counted and colony types evaluated
using an inverted microscope (×200) and a grid counting dish. The
experiment was repeated three times and the mean calculated.
Cell cycle and apoptosis analysis
using flow cytometry
For the analysis of spontaneous apoptosis, the cells
in the lentiviral transfection groups (SH1 and SH2), the
untransfected group (Hut-78), and the scrambled shRNA sequence
group (SH0) were seeded at 4×10⁵/ml in 2 ml RPMI-1640
medium for 24 h, prior to the cells being washed with cold PBS and
fixed in cold 70% ethanol overnight at −20°C. Next, the cells were
suspended in 100 µl PBS, and then stained with 5 µl
7-aminoactinomycin D and 5 µl phycoerythrin-conjugated Annexin V
using the Annexin V-PE Detection kit I (BD Pharmingen) at room
temperature for 15 min, and quantified by flow cytometric analysis
on a FACScan flow cytometer (BD Biosciences). Cell cycle analysis
was performed using PI-mediated flow cytometry. A total of
5×10⁵ transfected cells (SH1 and SH2), as well as
control cells (Hut-78 and SH0) were collected, fixed and
permeabilized with 100% ethanol for 1 h at 4°C. Following treatment
with DNase-free RNase, the cells were stained with 50 µg/ml PI for
1 h at room temperature. Distribution of the cell-cycle phases was
determined using a FACScan flow cytometer (BD Pharmingen). For each
sample, 10,000 gated events were obtained. Flow cytometry data were
analyzed using CellQuest Pro and ModFit v3.3 software (BD
Biosciences). The experiments were performed in triplicate and
repeated at least three times.
Gene expression profile analysis
Total RNA was extracted from cells using
TRIzol® reagent (Invitrogen; Thermo Fisher Scientific,
Inc.), purified and reverse-transcribed into cDNA using the Reverse
Transcription System (Promega Corporation). The reaction steps were
as follows: Add 2 µl of total RNA to the RT system to control the
total reaction system to 20 µl. The RT reaction conditions were as
follows: 42°C for 15 min, 95°C for 5 min and 4°C for 5 min.
Hybridization of the cDNA library was performed on Whole Human
Genome Oligo microarrays (cat. no. G4112F; Agilent Technologies,
Inc.). Agilent microarray slides were scanned using the Agilent DNA
Microarray Scanner (Agilent Technologies, Inc.). Hybridization
signals were normalized and analyzed using GeneSpring software
version 7.3 to identify significantly differentially expressed
genes.
Western blot analysis
Cell lysates were prepared using RIPA lysis and
extraction buffer (cat. no. 89900; Thermo Fisher Scientific, Inc.),
and the concentrations were quantified using a BCA assay. Protein
lysates were then separated on NuPAGE Novex Bis-Tris Gels
(Invitrogen; Thermo Fisher Scientific, Inc.). A total of 40 µg
protein/lane was separated by 12% SDS-PAGE. The separated proteins
were subsequently transferred onto nitrocellulose membranes and
blocked with 1×Tris buffered saline containing Tween-20 and 2.5%
skimmed milk at 25°C for 1 h. The membranes were incubated with the
following primary antibodies: Rabbit anti-GFI-1 antibody (1:500;
cat. no. ab21061; Abcam), rabbit anti-Bax antibody (1:1,000; cat.
no. Ab32503; Abcam), monoclonal rabbit anti-pro-caspase3 antibody
(1:1,000; cat. no. Ab32150; Abcam), monoclonal rabbit
anti-cleaved-caspase3 antibody (1:500; cat. no. Ab32042; Abcam),
monoclonal rabbit anti-P21 antibody (1:1,000; cat. no. Ab109199;
Abcam), monoclonal rabbit anti-CDK2 antibody (1:1,000; cat. no.
Ab32147; Abcam), monoclonal rabbit anti-GAPDH antibody (1:2,000;
cat. no. Ab8245; Abcam) and monoclonal mouse anti-β-Actin antibody
(1:2,000; cat. no. Ab32150; Abcam), overnight at 4°C and rinsed
with 1×TBST 3 times for 5 min each. Following the primary
incubation, membranes were incubated with 1:10,000 HRP labeled Goat
anti-Mouse antibody (cat. no. G-21040; Thermo Fisher Scientific,
Inc.), 1:10,000 HRP labeled Goat anti-Rabbit antibody (cat. no.
G-21234; Thermo Fisher Scientific, Inc.), for 1 h at 25°C,
subsequently washed with TBST and imaged on a LI-COR
Odyssey® Imaging System. Relative protein expression was
determined using ImageQuant version 5.2 software (Molecular
Dynamics).
RT-qPCR
Total RNA was extracted from aliquots of cells using
TRIzol® Reagent (Invitrogen; Thermo Fisher Scientific,
Inc.), according to the manufacturer's protocol. and RT reactions
were performed as previously described (15,16).
qPCR was performed according to our previous study (17), Reaction conditions were as follows:
Denaturation at 95°C for 10 min; then denaturation at 95°C for 15s
and annealing at 60°C for 1 min repeat 40 cycles. Real time PCR
dissociation curve: 95°C foe 15 sec, 60°C for 1 min and 95°C for 15
sec. Quantification of gene expression was performed using a 7500
Real Time PCR system (Applied Biosystems; Thermo Fisher Scientific,
Inc.) with GAPDH as the internal control. The results are
presented as copies of the specific genes per 10,000 copies of
GAPDH. The sequences of the primers were as follows:
GFI-1 forward, 5′-GCCCTACCCCTGTCAGTACTGT-3′ and reverse,
5′-CACCAGTGTGGATGAAAGTGTGT-3′; P21 forward,
5′-GGCAGACCAGCATGACAGATT-3′ and reverse, 5′-TTCCTGTGGGCGGATTAGG-3′;
CDK2 forward, 5′-TAAAGTTGTACCTCCCCTGGATGA-3′ and reverse
5′-AAATCCGCTTGTTAGGGTCGTA-3′; Bax forward,
5′-ACCAAGAAGCTGAGCGAATGT-3′ and reverse,
5′-CAGATGGTGAGTGACGCAGTAAG-3′; Caspase-3 forward
5′-GCAAACCTCAGGGAAACATT-3′ and reverse, 5′-TTTTCAGGTCAACAGGTCCA-3′;
and GAPDH forward, 5′-AAGATCATCAGCAATGCCTCC-3′ and reverse,
5′-TGGACTGTGGTCATGAGTCCTT-3′.
Luciferase reporter assay
The wild-type P21 promoter of Hut-78 cell
genome (from base pair 1,122 to + 247 relative to the transcription
start site) was amplified by PCR. The mutated P21 promoter
was generated by introducing point mutations to the key nucleotides
in the GFI-1 binding motif using the Fast Mutagenesis system
kit (Beijing Transgen Biotech Co., Ltd.), according to the
manufacturer's protocol. Wild-type and the mutated promoter were
cloned into the pGL3-Basic luciferase vector (Promega Corporation)
between the MluI and BglII restriction enzyme sites
by MluI, BglII restriction enzyme and T4 DNA Ligase
(NEB, Inc.), separately. Hut-78 cells were introduced into cells by
electroporation using the dual-luciferase reporter assay system
(Promega Corporation), according to the manufacturer's protocol.
Entranster™-E (Engreen Biosystem Co, Ltd.) was used to improve
electrotransfection efficiency. Cells were cultured for 48 h after
transfection for luciferase activity measurement, Relative
luciferase activity was quantified by normalization to
Renilla luciferase activity, which served as an internal
control for transfection efficiency.
Statistical analysis
Statistical analysis was performed using SPSS
version 21.0 (IBM Corp.). A Fisher's exact test was used to compare
GFI-1 antibody staining amongst the BID group and the different
stages of MF. A non-parametric Mann-Whitney U test was used to
compare the difference between GFI-1-knockdown clonal cells and
control cells. P<0.05 was considered to indicate a statistically
significant difference.
Results
GFI-1 protein expression is
significantly higher in patients with CTCL compared with patients
with BID
In order to study the expression levels and
localization of GFI-1 protein in CTCL, paraffin-embedded sections
from 11 cases each of patch, plaque and tumor stage MF were
obtained, and immunohistochemical analysis of GFI-1 protein was
performed and compared with 11 cases of BID. Representative images
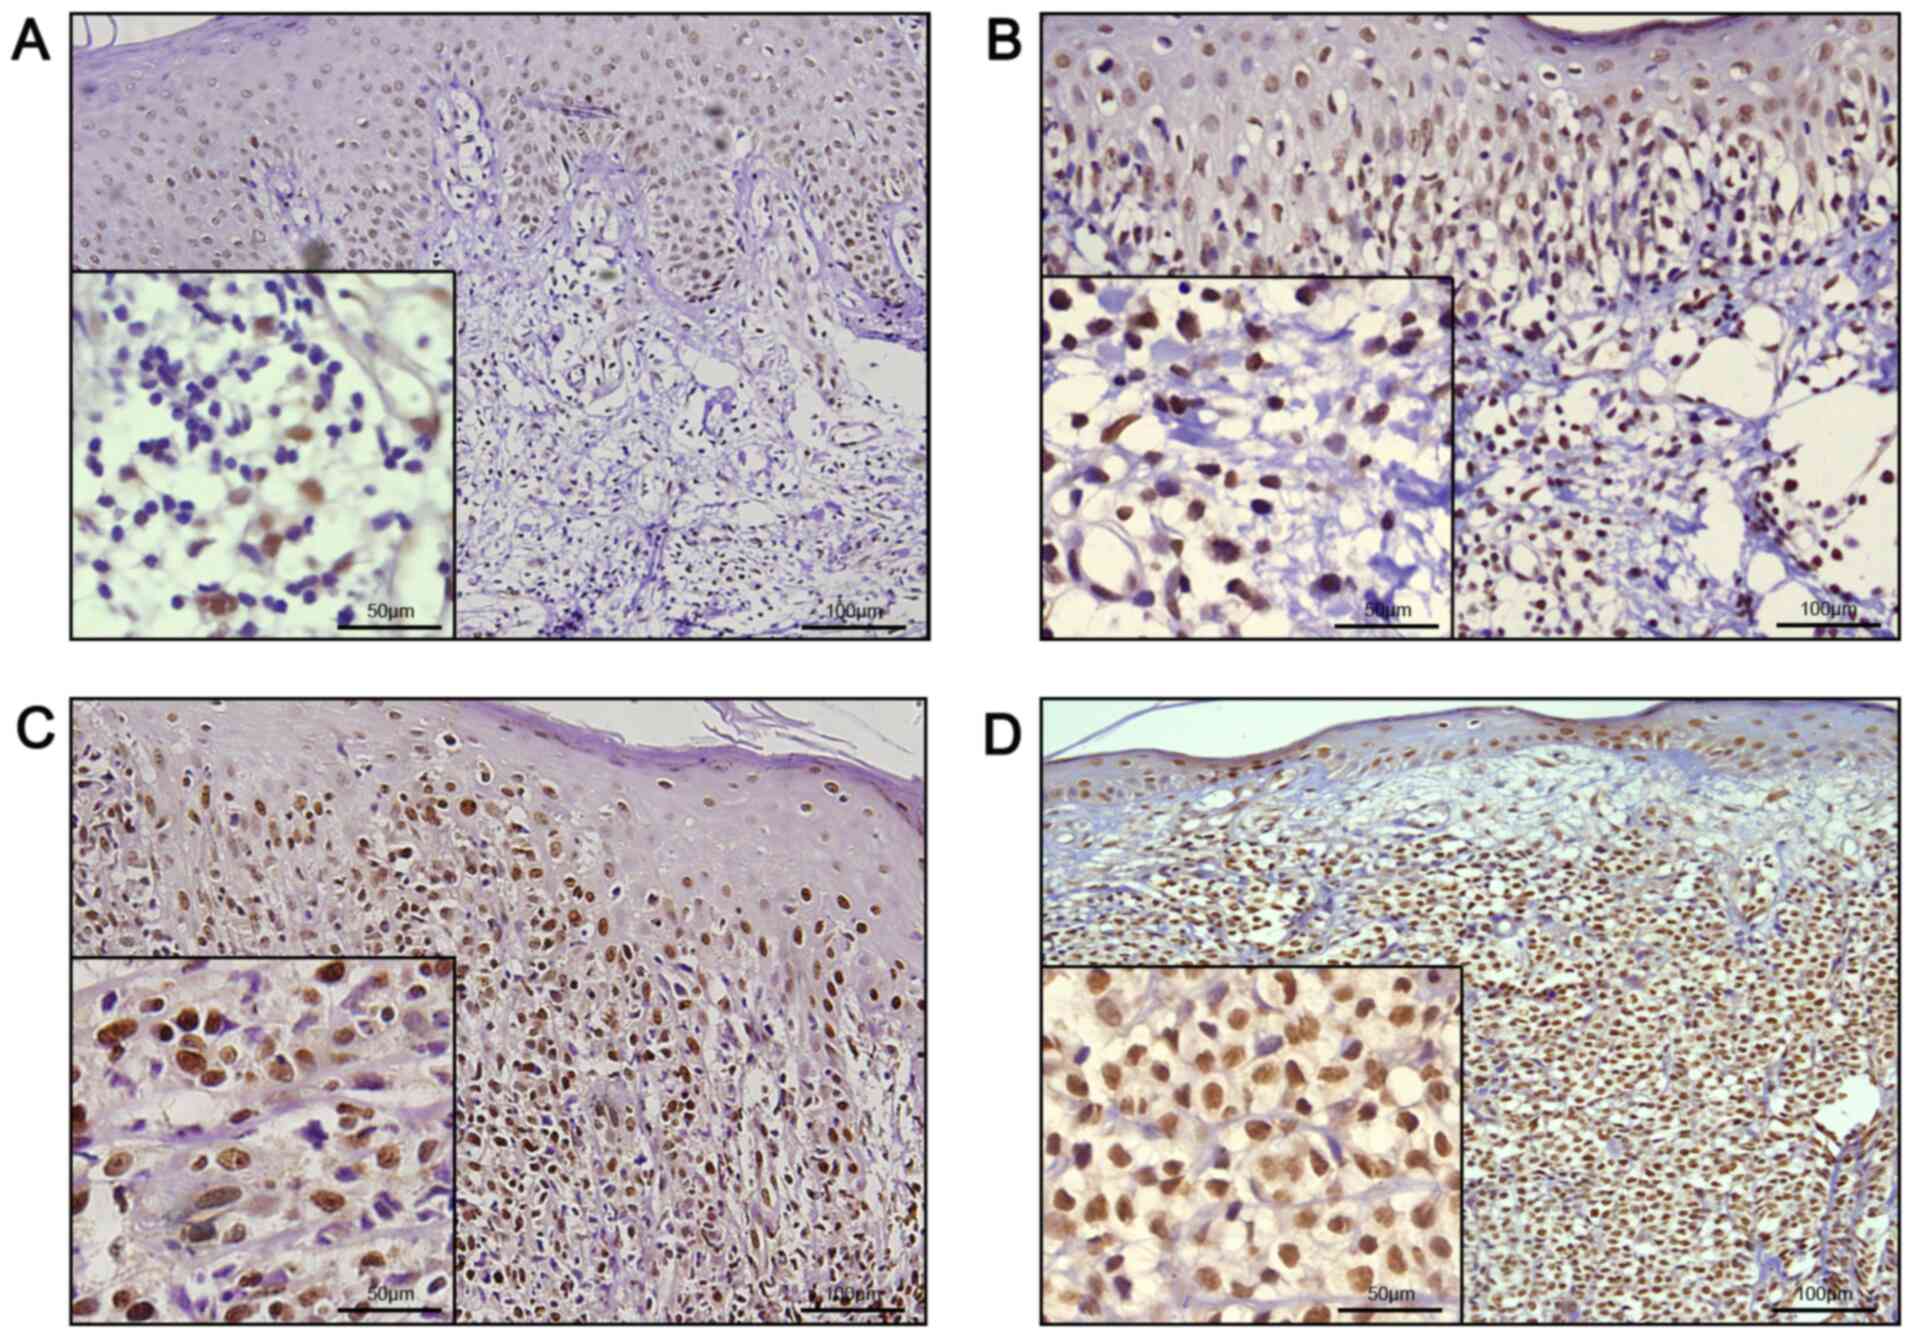
of immunohistochemical analysis are presented in Fig. 1. All MF tissues exhibited nuclear
staining for GFI-1 protein, with different ratios of infiltrating
lymphocytes. The results of the quantitative analysis are presented
in Table II; 7 out of 11 (63.6%)
patch stage MF specimens, and all plaque and tumor stage MF
specimens demonstrated diffuse nuclear staining of GFI-1 protein in
>25% of the lymphocytic nuclei, whereas only 1 of 11 (9.1%) BID
sections exhibited >25% positive staining. There was a
significant difference between all MF tissue specimens and BID
specimens (P<0.05; Fisher's exact test), and there was also a
significant difference between patch stage MF and BID specimens
(P=0.02; Fisher's exact test). Further analysis demonstrated that
in 1 of 11 (9.1%) cases with patch stage MF, 7 of 11 (63.6%) cases
with plaque stage MF, and in all the cases of tumor stage MF, GFI-1
protein expression was positive in >50% of infiltrating
lymphocyte nuclei. There was a significant difference between the
patch stage MF and plaque stage MF specimens (P=0.02; Fisher's
exact test), and between the plaque stage MF and tumor stage MF
specimens (P=0.04; Fisher's exact test), suggesting that the
expression of GFI-1 protein gradually increased with the
progression of the disease.
| Table II.GF1-1 protein expression in different
stages of mycosis fungoides. |
Table II.
GF1-1 protein expression in different
stages of mycosis fungoides.
|
| Percentage of
nuclei expressing GF1-1 |
|---|
|
|
|
|---|
| Diagnosis | 0-25% | 26-50% | 51-90% | >90% |
|---|
| Patch stage
(n=11) | 4a (36.4)b | 6 (54.5) | 1 (9.1) | 0 (0) |
| Plaque stage
(n=11) | 0 (0) | 5 (45.5) | 2 (18.2) | 4 (36.4) |
| Tumor stage
(n=11) | 0 (0) | 0 (0) | 5 (45.5) | 6 (54.5) |
| BID (n=11) | 10 (90.9) | 1 (9.1) | 0 (0) | 0 (0) |
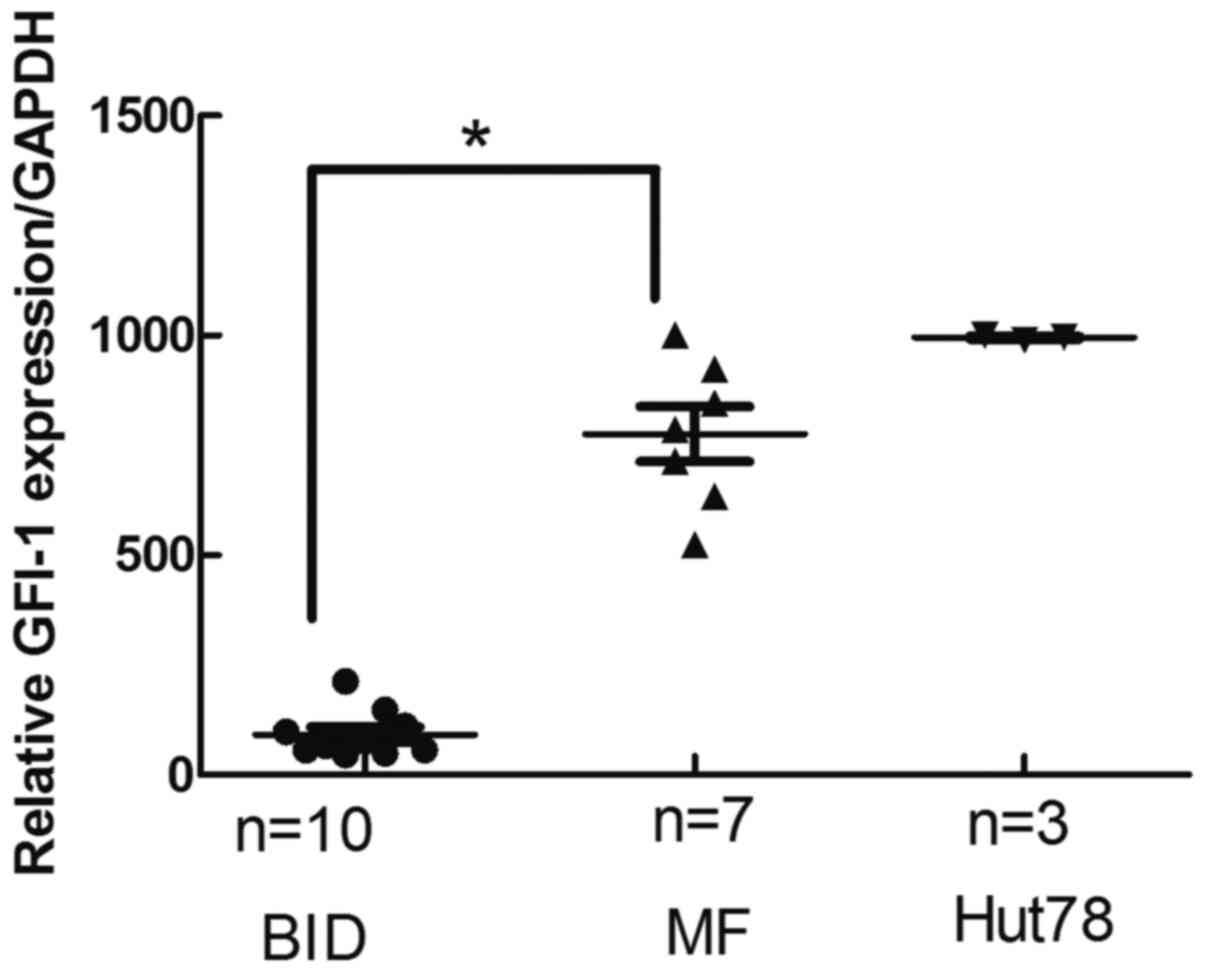
GFI-1 mRNA expression in MF tissues is
significantly higher than that in inflammatory tissues
The GFI-1 mRNA expression levels on fresh
skin lesions biopsies from 7 MF patients and 10 fresh skin lesions
biopsies from patients with BID were analyzed. GFI-1 mRNA
levels in MF were significantly higher than that of BID (Fig. 2). There was a significant difference
between patch stage MF and BID (P<0.05).
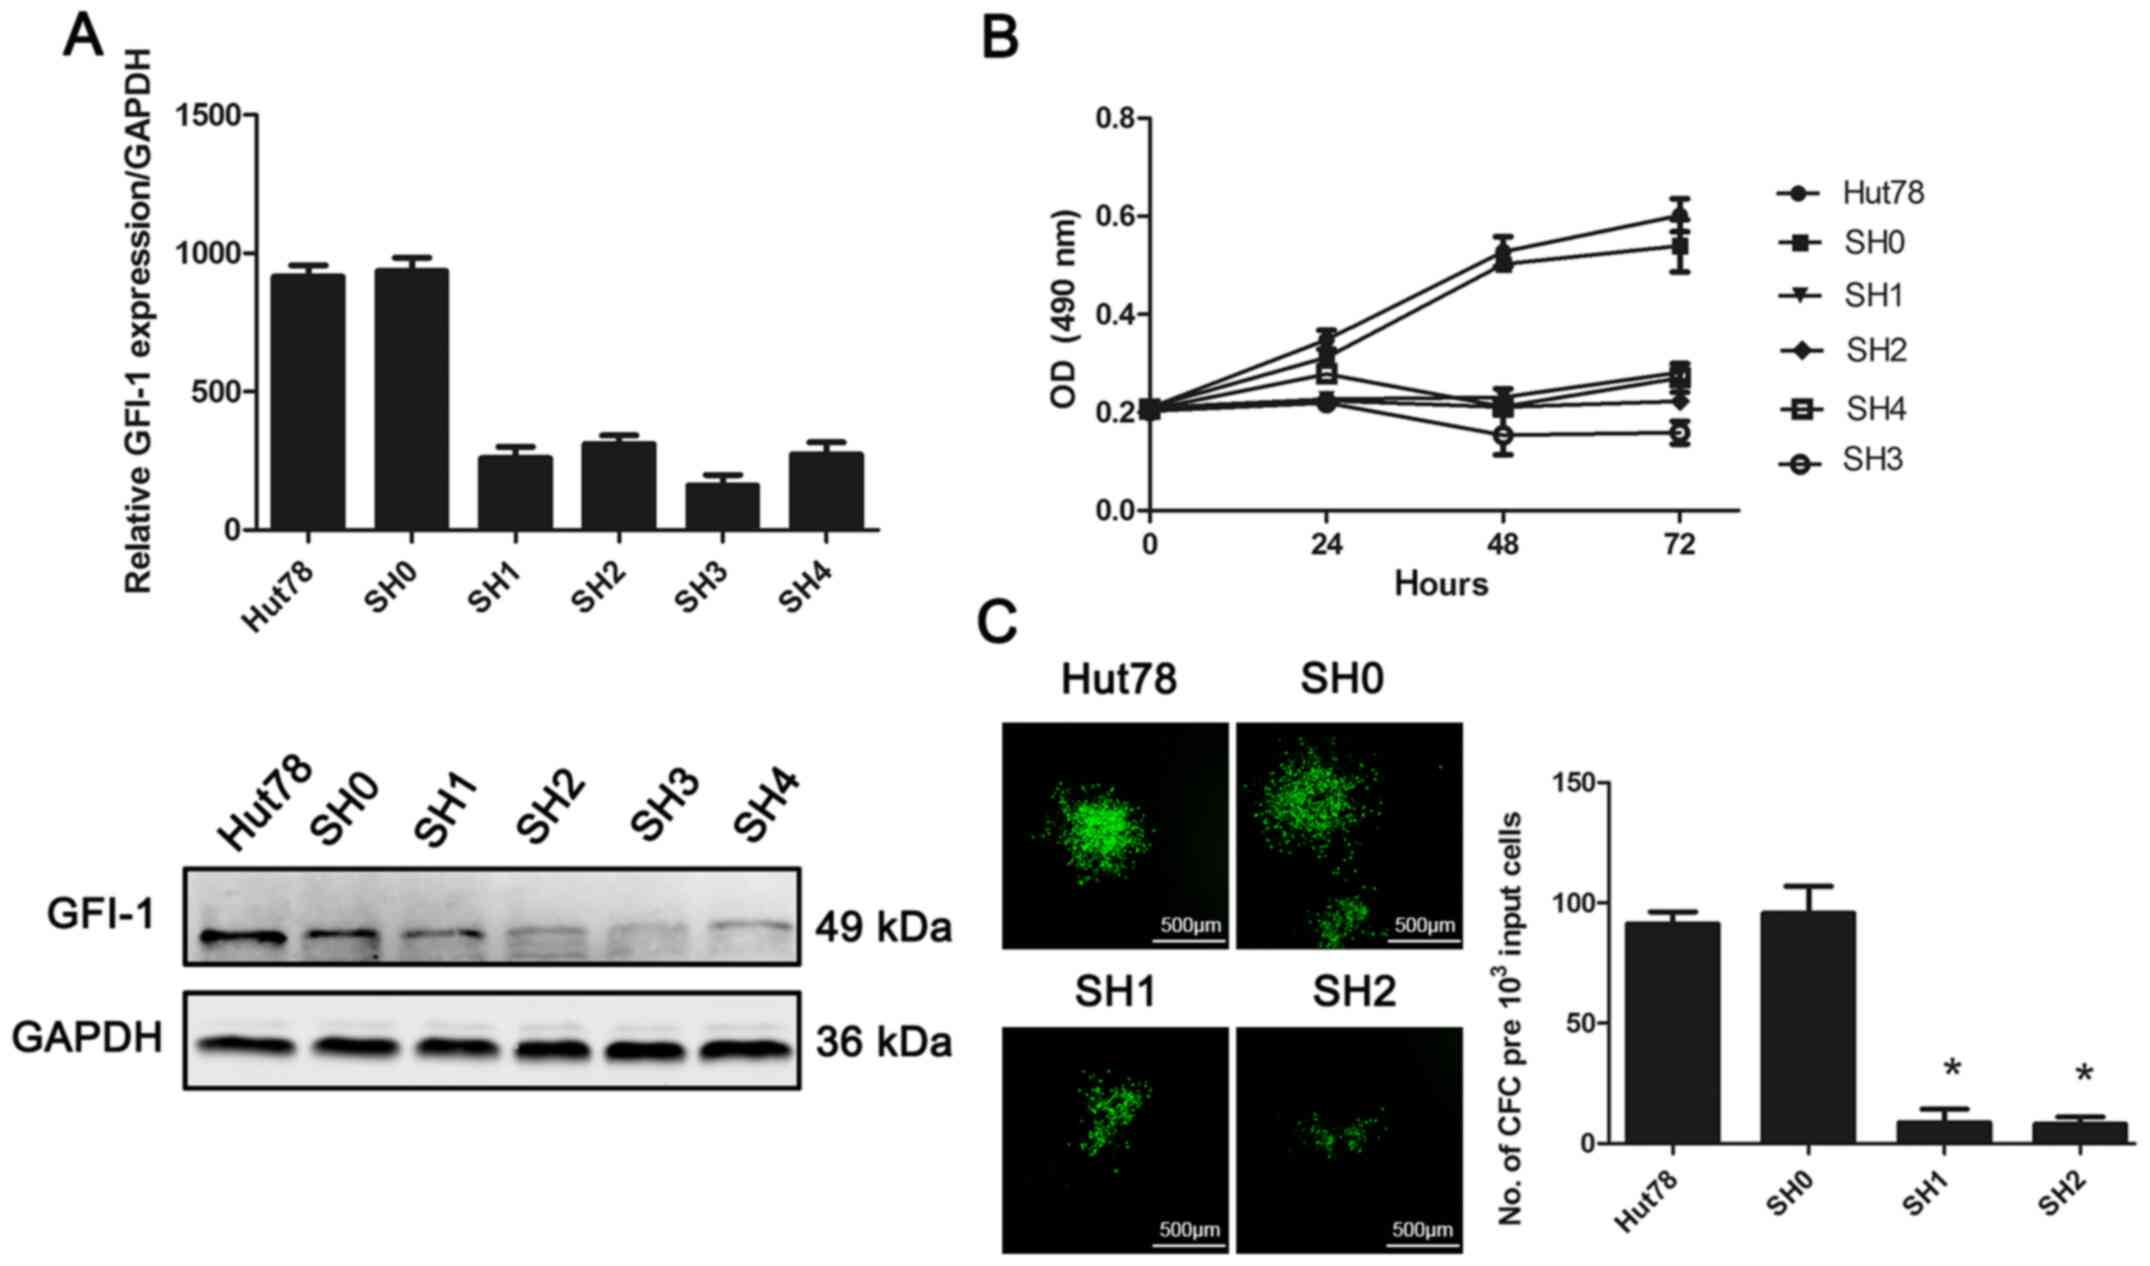
Effect of GFI-1-knockdown on cell
proliferation and colony-forming ability of the CTCL Hut-78 cell
line
In order to study the role of GFI-1 in the
development of MF, lentivirus-mediated RNAi technology was used to
inhibit the expression of GFI-1 in the CTCL-derived cell line,
Hut-78 (Fig. 3). The expression of
GFI-1 in Hut-78 cells transfected with four shRNA sequences (SH1-4)
was significantly decreased, and the difference was statistically
significant compared with the untransfected group and the scramble
transfected shRNA cells (SH0) (P<0.05). An MTS-based cell
viability assay was used to assess the proliferation of Hut-78
cells following GFI-1-knockdown. Knockdown of GFI-1
expression resulted in significant inhibition of cell proliferation
at 48 and 72 h, compared with the control and SH0 groups (Fig. 2; P<0.05). Colony formation assays
were used to determine the in vitro proliferation of cells
following GFI-1-knockdown. With the decrease in GFI-1
gene expression, the ability of cells to form colonies in
vitro was significantly decreased, compared with the control
and SH0 groups (P<0.05).
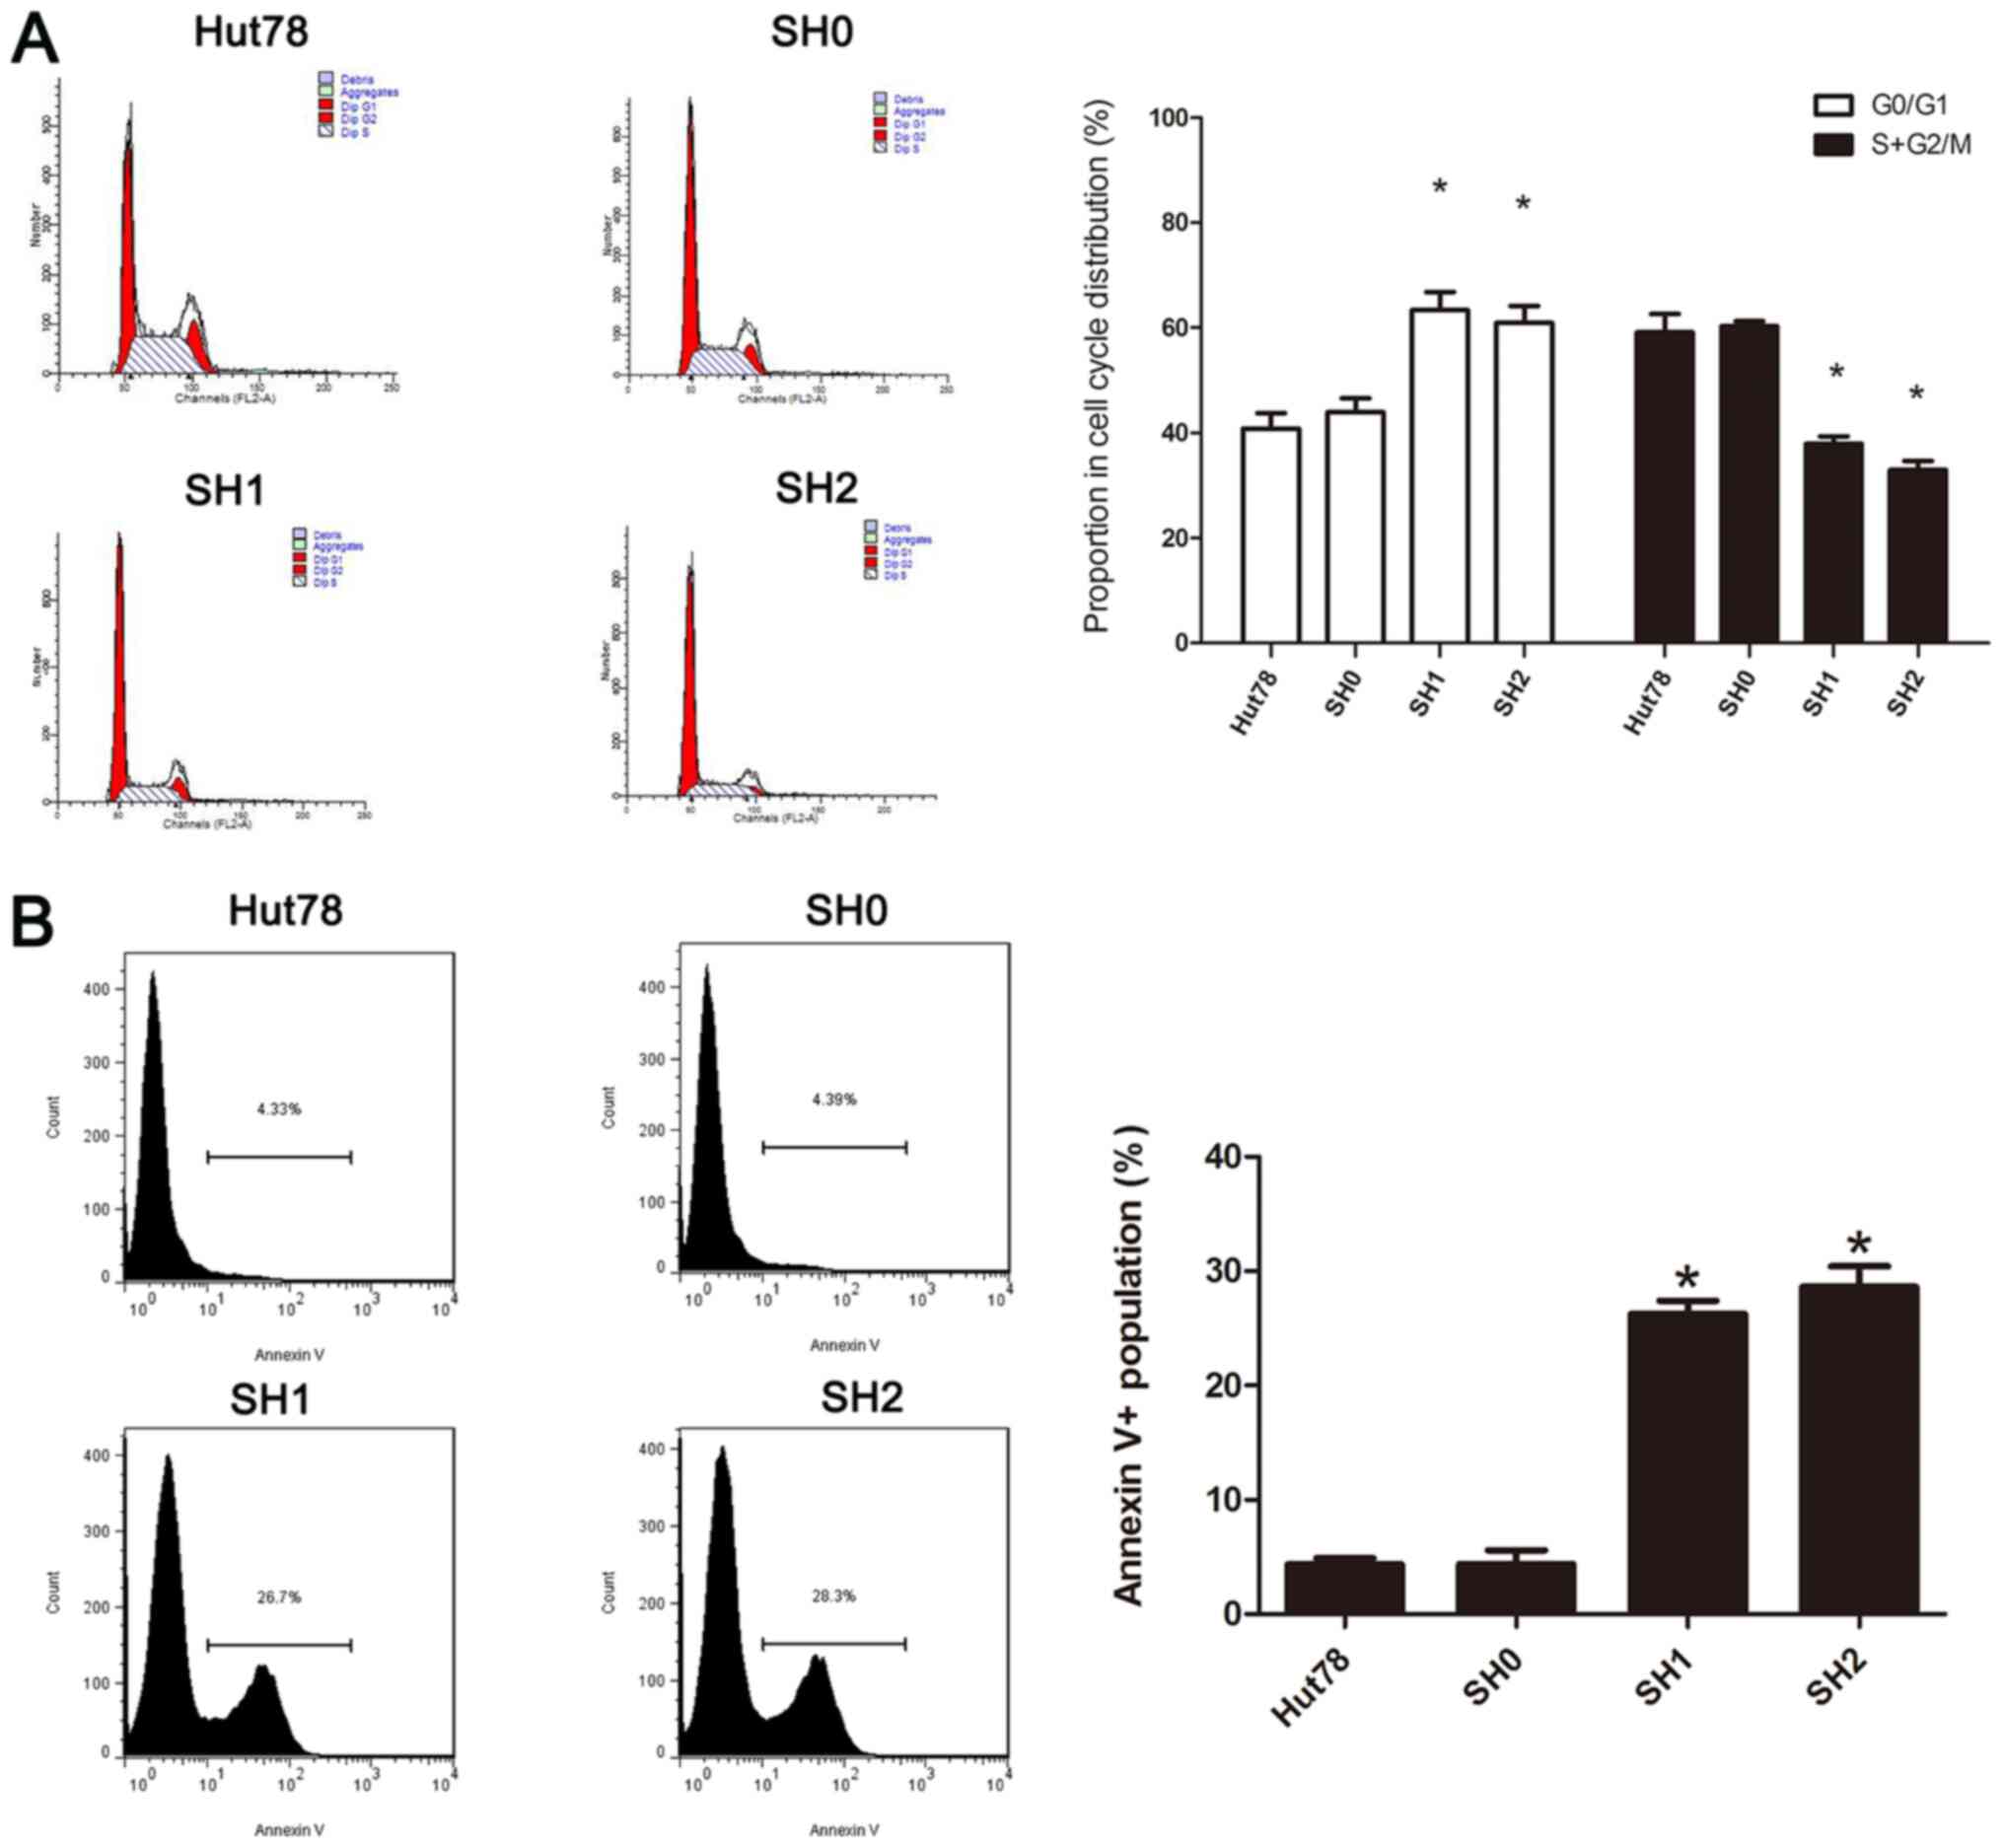
Effects of decreased GFI-1 expression
on cell cycle progression and spontaneous apoptosis
In order to further analyze the possible mechanisms
by which cell proliferation is inhibited following knockdown of
GFI-1, the cell cycle distribution was determined using flow
cytometry and PI staining. The proportion of cells in the
G0/G1 phase increased significantly, and the
proportion of cells in the G2/M phase decreased
significantly compared with the control group (P<0.05), which
demonstrated that knockdown of the GFI-1 gene leads to
G1 cell-cycle arrest. The apoptosis of cells was also
studied using flow cytometry with Annexin V-PE/7AAD staining
(Fig. 4). The proportion of
apoptotic cells was significantly increased following
GFI-1-knockdown, compared with the control group
(P<0.05). These results indicated that GFI-1
knockdown-induced cell growth inhibition was caused by simultaneous
G1 cell-cycle arrest and initiation of apoptosis.
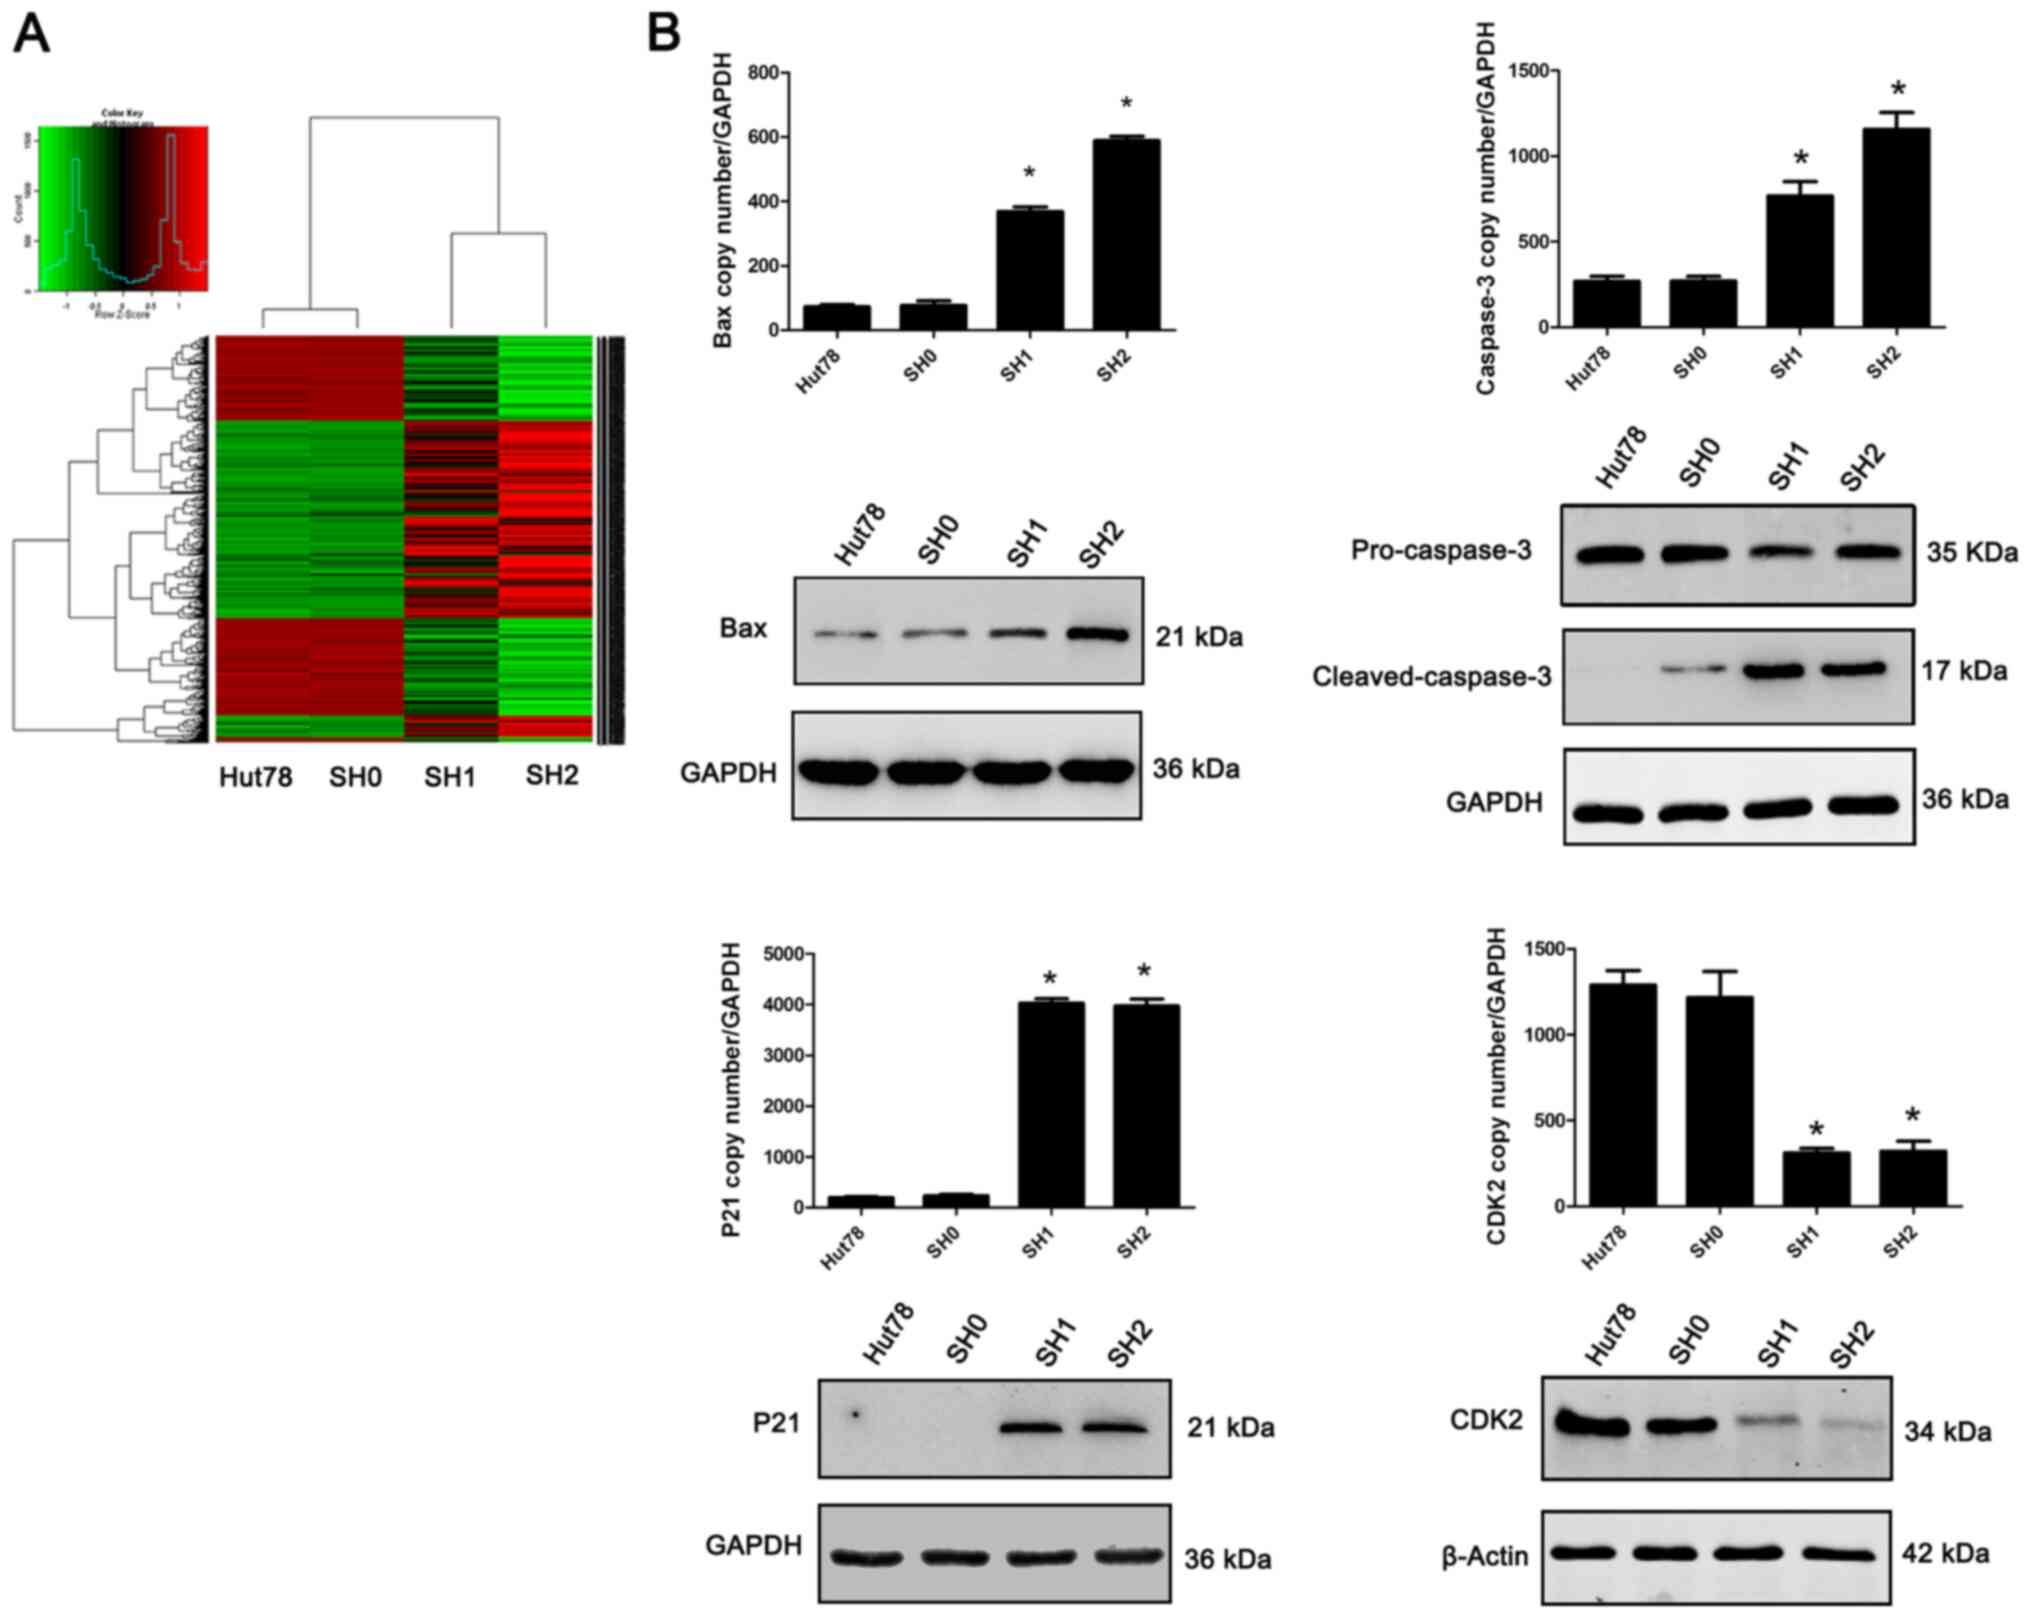
GFI-1 specific-knockdown results in
upregulation of P21, Bax and Caspase-3, as well as downregulation
of CDK2 expression
In order to further study the possible molecular
mechanisms that lead to cell cycle arrest and apoptosis following
GFI-1-knockdown, lentivirus-transfected cells (SH1 and SH2)
were used for transcriptome analysis, with non-transfected cells
(Hut-78) and scramble shRNA-transfected cells (SH0) as the
controls. The results demonstrated that Hut-78 cells with decreased
GFI-1 expression exhibited numerous changes in the
expression of genes (Fig. 5). Based
on the criteria of a fold-change >2 and P<0.05, 39 genes were
found to be differentially expressed in the SH1 and SH2 cells,
compared with the SH0 and Hut-78 cells. Among these, Bax and
Caspase-3 expression levels, both of which are associated
with spontaneous apoptosis, were upregulated, while P21 and
CDK2 expression levels, both of which are associated with
cell cycle inhibition, were upregulated and downregulated,
respectively, and this was further confirmed by RT-qPCR and western
blotting.
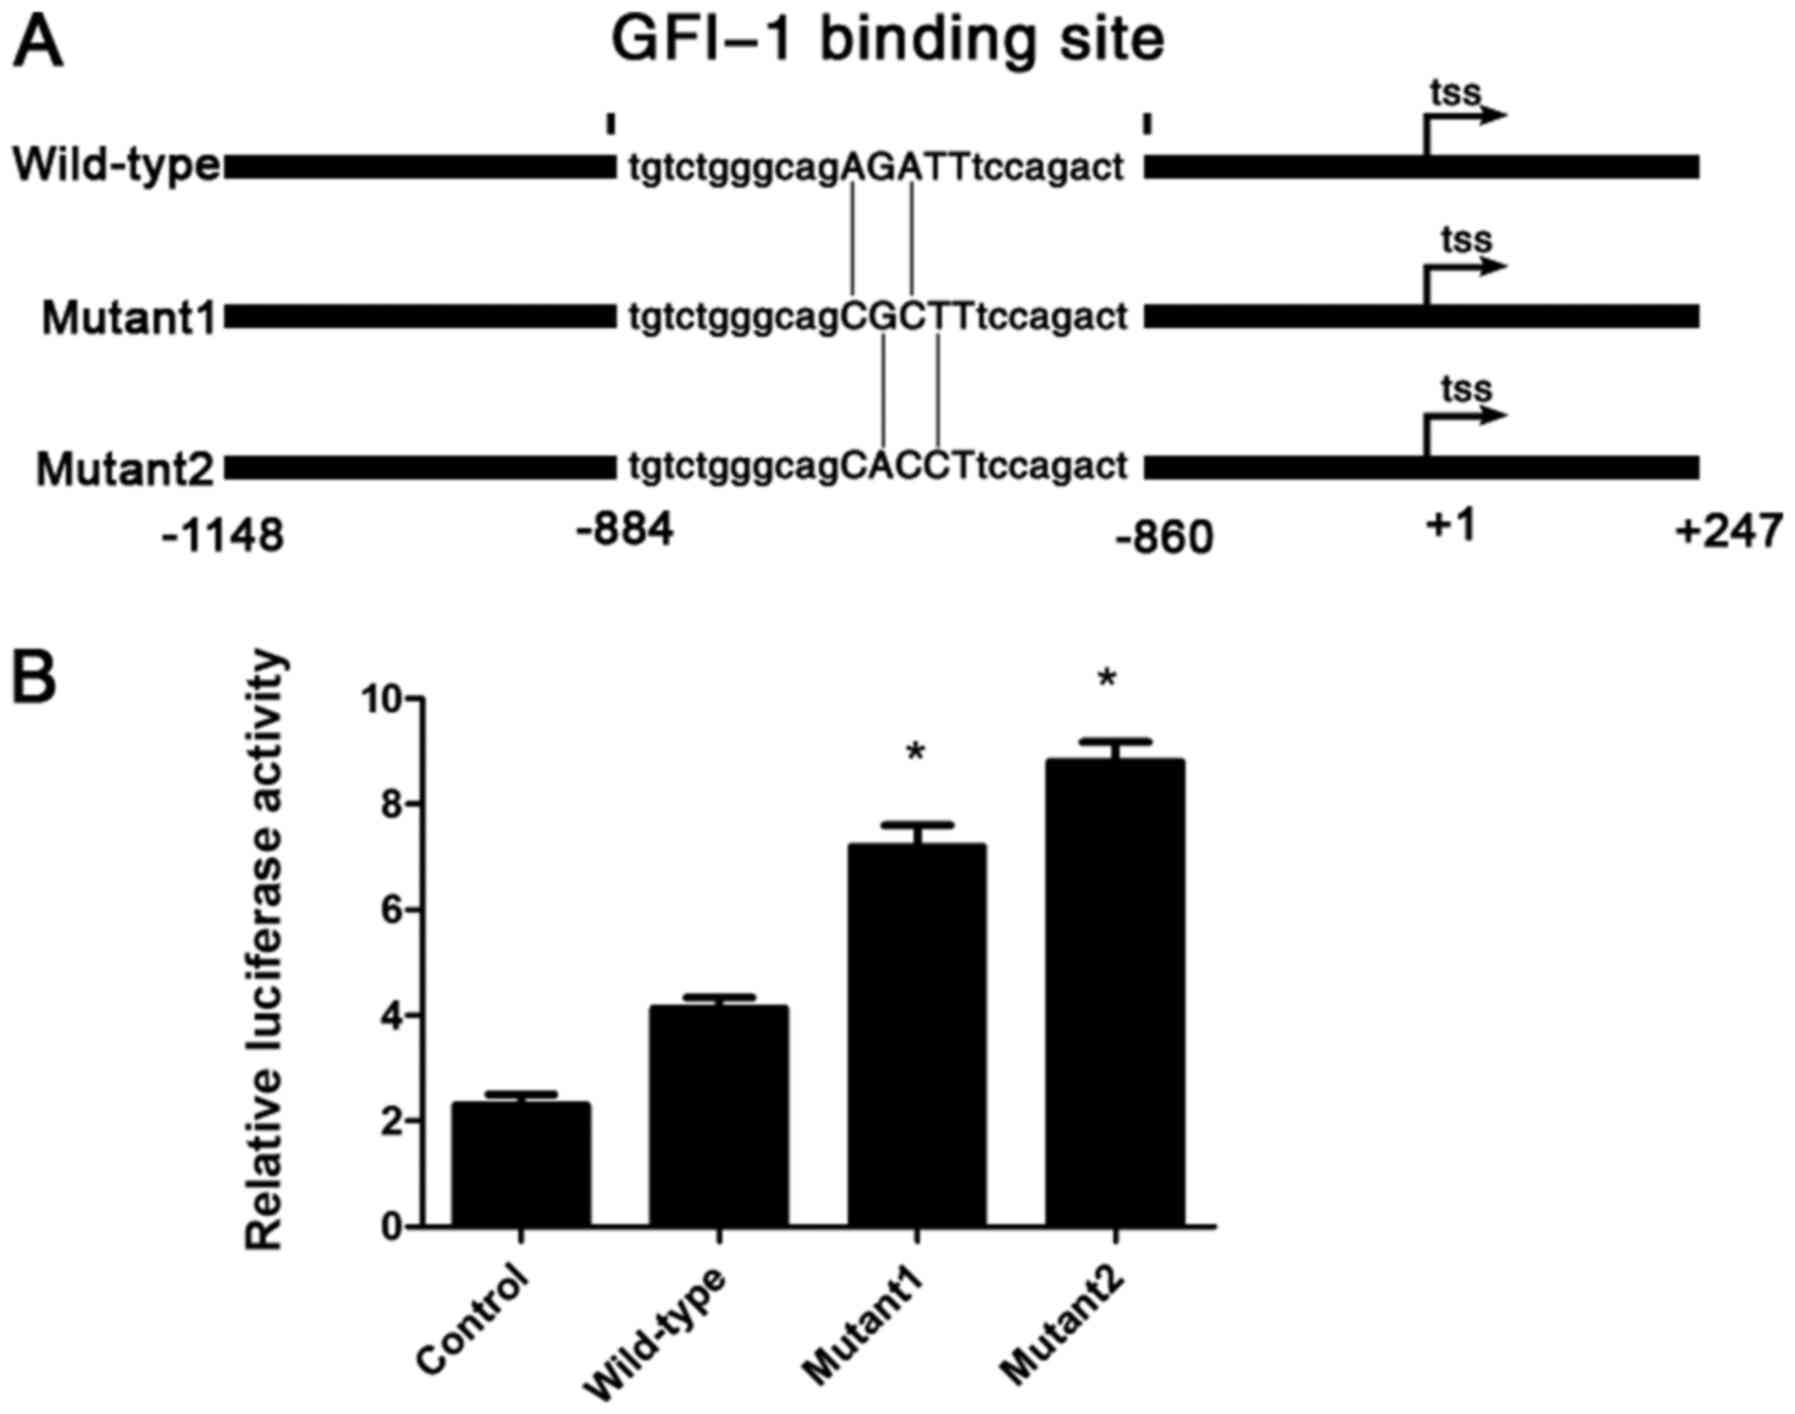
GFI-1 inhibits P21 transcriptional
expression by directly binding to P21 and regulates its
expression
Luciferase reporter assays were used to determine
whether GFI-1 directly regulates the transcription of
P21 in Hut-78 cells. To begin with, it was predicted that
the only GFI-1 binding site on the P21 promoter was
located within the region −884 to −860 (Fig. 5A) using two different transcription
factor binding analysis databases (MatInspector and JASPAR CORE).
The P21 promoter from −1,148 to +247 was cloned and ligated
into a luciferase reporter vector, as well as two different
promoter mutants with the key GFI-1 binding motif AGAT
progressively mutated to CGCT or CACC (Fig. 6A). Dual-luciferase assays in Hut-78
cells revealed a dose-dependent increase in luciferase activity
with the mutated promoters, indicating an inhibitory effect of
GFI-1 binding on P21 transcription (Fig. 6B). These results demonstrated that
GFI-1 inhibits P21 expression by directly binding to
a specific locus in the P21 promoter and negatively
regulating its transcription.
Discussion
The lack of MF treatment options is associated with
the relatively poor understanding of the pathogenesis of the
disease. Previous studies have demonstrated that MF is derived from
skin-homing mature memory T-cells with cerebriform nuclei and with
a CD4+, CD45RO+, CLA+
immunophenotype (18,19). However, the mechanisms underlying the
development and progression of tumor clonal hyperplasia in these
cells remains unknown. Recent studies have reported that the
aggregation of tumor cells in MF primarily depends on their
resistance to induction of apoptosis, and this also explains the
resistance of MF to conventional chemotherapeutic approaches
(20,21). However, the specific mechanism by
which MF evades apoptosis is unclear. At present, due to the
difficulty in obtaining purified MF cells in patients with skin
lesions, research on the pathogenesis of MF is very limited.
However, pathogenesis in vitro has been more extensively
investigated in cultured CTCL cell lines. Upregulation of PAK1 and
TOX (22,23), dysregulated expression of AHI-1 and
BCL11B (24,25), downregulation in SATB1 expression
(15), and lack of Caspase
activation have been associated with defects in apoptosis and the
cell cycle in CTCL cell lines (26).
The present study demonstrated that the expression
of GFI-1 protein in the tissues of patients with MF was
significantly higher than in the tissues of patients with benign
inflammation. Based on this result, it was further demonstrated
that the specific knockdown of GFI-1 expression in the CTCL-derived
Hut-78 cell line, significantly decreased the proliferation and
clonal proliferation of these cells in vitro. Additionally,
the cell cycle was inhibited and apoptosis was increased. Finally,
GFI-1-knockdown resulted in upregulation of the apoptosis-related
genes, Bax and Caspase-3, and simultaneously resulted in
upregulation of the cell cycle-related gene P21, as well as
downregulation of CDK2. The present study also aimed to detect the
proliferation and apoptosis of normal peripheral blood T cells
following GFI-1 gene expression being decreased. However, due to
the relatively small number of cells obtained compared with the
Hut78 cell line, it was challenging to transfect normal T cells.
The majority of the cells died and the experiment was not possible
to be carried out.
Grimes et al (27) demonstrated that in acute T-cell
leukemia cell lines, increased expression of GFI-1 can reverse the
cell cycle arrest caused by IL-2 deficiency, which resulted in
increased clonal proliferation of tumor cells. Furthermore, it was
further demonstrated that the SNAG domain in the GFI-1 protein
possessed suppressor activity, which may lead to a decrease in the
expression of associated genes that inhibit cell proliferation,
leading to T-cell activation and tumor progression. Duan et
al (28) demonstrated that GFI-1
inhibits P21 expression by recruiting the methyltransferase G9a and
histone deacetylase 1 to the promoter of P21, leading to the
progression of the cell cycle. P21 is a very important negative
regulator in the cell cycle. It inhibits the progression of the
cell cycle by inhibiting the activity of CDK1 and CDK2, which leads
to the inhibition of cell growth (29,30).
Previous studies have demonstrated that P21 gene-knockout mice
exhibit significantly increased susceptibility to formation of
spontaneous tumors (31), and thus
the occurrence of most types of tumors, including colon cancer,
cervical cancer and small cell lung cancer, and this was correlated
with the significantly decreased expression of P21 (32). The present study demonstrated that
specific knockdown of GFI-1 expression may lead to inhibition of
Hut-78 cell proliferation and clonal proliferation in vitro.
Additionally, knockdown of GFI-1 resulted in increased expression
of the cell cycle-related gene P21 and decreased expression of
CDK2. Additionally, direct transcriptional repression of P21
by GFI-1 was demonstrated in the luciferase assays. Based on
the previous studies and the results of the present study, it was
hypothesized that the inhibition of proliferation may be achieved
through cell cycle inhibition, and GFI-1 may complete the
inhibition of the Hut-78 cell cycle by regulating the P21-CDK2
pathway, and then inhibiting cell proliferation.
Previously, GFI-1, as a proto-oncoprotein, was
revealed to directly inhibit the expression of pro-apoptotic
regulators Bax and Bak, resulting in increased occurrence of
T-cell-related tumors, and the GFI-1-mediated repression was
direct and dependent on several GFI-1-binding sites in the
p53-inducible Bax promoter (33). The present study demonstrated that
knockdown of GFI-1 resulted in a significant increase in
spontaneous apoptosis of Hut-78 cells in vitro.
Additionally, knockdown led to upregulated expression of the
pro-apoptotic factor Bax and an increase in the expression of the
apoptotic pathway core protein Caspase-3. Therefore, the decreased
expression of GFI-1 resulted in increased spontaneous apoptosis of
cells via activation of the pro-apoptotic gene, Bax.
In conclusion, the results of the present study
demonstrated that the abnormally high expression of GFI-1 in
patients with MF serves an important role in the occurrence and
development of disease. The abnormally high expression of GFI-1 may
cause changes in the P21-CDK2 signaling pathway of epidermal
T-cells, which leads to the uncontrolled proliferation of T-cells,
and which also causes the T-cells to resist spontaneous apoptosis,
through the inhibition of the pro-apoptotic factor Bax, leading to
the formation of malignantly cloned T-cells. These results provided
novel molecular insights into MF and may assist in identifying
novel therapeutic targets for management of this disease.
Acknowledgements
Not applicable.
Funding
The present study was supported by grants from
National Nature Science Foundation of China [grant nos. 81402259
(GXG) and 81972560 (ZCL)] and the Nature Science Foundation of
Beijing [grant nos. 7163234 (GXG) and 7202231 ZCL)].
Availability of data and materials
The datasets used and/or analyzed during the current
study are available from the corresponding author upon reasonable
request.
Authors' contributions
XG conceived the experiments and designed the
experiments. YW prepared the samples. XG performed the experiments.
CZ analyzed the data. XG drafted the initial manuscript with input
from all authors. YL performed the bioinformatics analysis and
article revision. XG and YL confirmed the authenticity of all the
raw data. All authors have read and approved the final
manuscript.
Ethics approval and consent to
participate
Written informed consent was obtained from all
patients involved in the present study, which was performed
according to the guidelines and with the approval of the Medical
Ethics Committee of Aviation General Hospital (Beijing, China;
approval no. 2014-41).
Patient consent for publication
Not applicable.
Competing interests
The authors declare that they have no competing
interests.
References
|
1
|
Wilcox RA: Cutaneous T-cell lymphoma: 2016
update on diagnosis, risk-stratification, and management. Am J
Hematol. 91:151–165. 2016. View Article : Google Scholar : PubMed/NCBI
|
|
2
|
Goyal A, O'Leary D, Goyal K, Rubin N,
Bohjanen K, Hordinsky M, Chen ST, Pongas G, Duncan LM and Lazaryan
A: Increased risk of second primary hematologic and solid
malignancies in patients with mycosis fungoides: A surveillance,
epidemiology, and end results analysis. J Am Acad Dermatol.
83:404–411. 2020. View Article : Google Scholar : PubMed/NCBI
|
|
3
|
Zhang Y, Wang Y, Yu R, Huang Y, Su M, Xiao
C, Martinka M, Dutz JP, Zhang X, Zheng Z and Zhou Y: Molecular
markers of early-stage mycosis fungoides. J Invest Dermatol.
132:1698–1706. 2012. View Article : Google Scholar : PubMed/NCBI
|
|
4
|
Lansigan F, Choi J and Foss FM: Cutaneous
T-cell lymphoma. Hematol Oncol Clin North Am. 22979–996. (x)2008.
View Article : Google Scholar : PubMed/NCBI
|
|
5
|
Prince HM, Whittaker S and Hoppe RT: How I
treat mycosis fungoides and Sezary syndrome. Blood. 114:4337–4353.
2009. View Article : Google Scholar : PubMed/NCBI
|
|
6
|
Zhang C, Richon V, Ni X, Talpur R and
Duvic M: Selective induction of apoptosis by histone deacetylase
inhibitor SAHA in cutaneous T-cell lymphoma cells: Relevance to
mechanism of therapeutic action. J Invest Dermatol. 125:1045–1052.
2005. View Article : Google Scholar : PubMed/NCBI
|
|
7
|
Willemze R, Jaffe ES, Burg G, Cerroni L,
Berti E, Swerdlow SH, Ralfkiaer E, Chimenti S, Diaz-Perez JL,
Duncan LM, et al: WHO-EORTC classification for cutaneous lymphomas.
Blood. 105:3768–3785. 2005. View Article : Google Scholar : PubMed/NCBI
|
|
8
|
Hock H, Hamblen MJ, Rooke HM, Traver D,
Bronson RT, Cameron S and Orkin SH: Intrinsic requirement for zinc
finger transcription factor Gfi-1 in neutrophil differentiation.
Immunity. 18:109–120. 2003. View Article : Google Scholar : PubMed/NCBI
|
|
9
|
Yucel R, Karsunky H, Klein-Hitpass L and
Moroy T: The transcriptional repressor Gfi1 affects development of
early, uncommitted c-Kit+ T cell progenitors and CD4/CD8 lineage
decision in the thymus. J Exp Med. 197:831–844. 2003. View Article : Google Scholar : PubMed/NCBI
|
|
10
|
van der Meer LT, Jansen JH and van der
Reijden BA: Gfi1 and Gfi1b: Key regulators of hematopoiesis.
Leukemia. 24:1834–1843. 2010. View Article : Google Scholar : PubMed/NCBI
|
|
11
|
Zhu J, Jankovic D, Grinberg A, Guo L and
Paul WE: Gfi-1 plays an important role in IL-2-mediated Th2 cell
expansion. Proc Natl Acad Sci USA. 103:18214–18219. 2006.
View Article : Google Scholar : PubMed/NCBI
|
|
12
|
Rodel B, Tavassoli K, Karsunky H, Schmidt
T, Bachmann M, Schaper F, Heinrich P, Shuai K, Elsässer HP and
Möröy T: The zinc finger protein Gfi-1 can enhance STAT3 signaling
by interacting with the STAT3 inhibitor PIAS3. EMBO J.
19:5845–5855. 2000. View Article : Google Scholar : PubMed/NCBI
|
|
13
|
Kazanjian A, Gross EA and Grimes HL: The
growth factor independence-1 transcription factor: New functions
and new insights. Crit Rev Oncol Hematol. 59:85–97. 2006.
View Article : Google Scholar : PubMed/NCBI
|
|
14
|
Zhou LL, Zhao Y, Ringrose A, DeGeer D,
Kennah E, Lin AE, Sheng G, Li XJ, Turhan A and Jiang X: AHI-1
interacts with BCR-ABL and modulates BCR-ABL transforming activity
and imatinib response of CML stem/progenitor cells. J Exp Med.
205:2657–2671. 2008. View Article : Google Scholar : PubMed/NCBI
|
|
15
|
Wang Y, Su M, Zhou LL, Tu P, Zhang X,
Jiang X and Zhou Y: Deficiency of SATB1 expression in Sezary cells
causes apoptosis resistance by regulating FasL/CD95L transcription.
Blood. 117:3826–3835. 2011. View Article : Google Scholar : PubMed/NCBI
|
|
16
|
Su MW, Dorocicz I, Dragowska WH, Ho V, Li
G, Voss N, Gascoyne R and Zhou Y: Aberrant expression of T-plastin
in Sezary cells. Cancer Res. 63:7122–7127. 2003.PubMed/NCBI
|
|
17
|
Gu X, Wang Y, Zhang G, Li W and Tu P:
Aberrant expression of BCL11B in mycosis fungoides and its
potential role in interferon-induced apoptosis. J Dermatol.
40:596–605. 2013. View Article : Google Scholar : PubMed/NCBI
|
|
18
|
Campbell JJ, Clark RA, Watanabe R and
Kupper TS: Sezary syndrome and mycosis fungoides arise from
distinct T-cell subsets: A biologic rationale for their distinct
clinical behaviors. Blood. 116:767–771. 2010. View Article : Google Scholar : PubMed/NCBI
|
|
19
|
van Doorn R, van Kester MS, Dijkman R,
Vermeer MH, Mulder AA, Szuhai K, Knijnenburg J, Boer JM, Willemze R
and Tensen CP: Oncogenomic analysis of mycosis fungoides reveals
major differences with Sezary syndrome. Blood. 113:127–136. 2009.
View Article : Google Scholar : PubMed/NCBI
|
|
20
|
Hwang ST, Janik JE, Jaffe ES and Wilson
WH: Mycosis fungoides and Sezary syndrome. Lancet. 371:945–957.
2008. View Article : Google Scholar : PubMed/NCBI
|
|
21
|
Dummer R, Asagoe K, Cozzio A, Burg G,
Doebbeling U, Golling P, Fujii K and Urosevic M: Recent advances in
cutaneous lymphomas. J Dermatol Sci. 48:157–167. 2007. View Article : Google Scholar : PubMed/NCBI
|
|
22
|
Wang Y, Gu X, Li W, Zhang Q and Zhang C:
PAK1 overexpression promotes cell proliferation in cutaneous T cell
lymphoma via suppression of PUMA and p21. J Dermatol Sci. 90:60–67.
2018. View Article : Google Scholar : PubMed/NCBI
|
|
23
|
Huang Y, Litvinov IV, Wang Y, Su MW, Tu P,
Jiang X, Kupper TS, Dutz JP, Sasseville D and Zhou Y: Thymocyte
selection-associated high mobility group box gene (TOX) is
aberrantly over-expressed in mycosis fungoides and correlates with
poor prognosis. Oncotarget. 5:4418–4425. 2014. View Article : Google Scholar : PubMed/NCBI
|
|
24
|
Ringrose A, Zhou Y, Pang E, Zhou L, Lin
AE, Sheng G, Li XJ, Weng A, Su MW, Pittelkow MR and Jiang X:
Evidence for an oncogenic role of AHI-1 in Sezary syndrome, a
leukemic variant of human cutaneous T-cell lymphomas. Leukemia.
20:1593–1601. 2006. View Article : Google Scholar : PubMed/NCBI
|
|
25
|
Fu W, Yi S, Qiu L, Sun J, Tu P and Wang Y:
BCL11B-Mediated epigenetic repression is a crucial target for
histone deacetylase inhibitors in cutaneous T-Cell lymphoma. J
Invest Dermatol. 137:1523–1532. 2017. View Article : Google Scholar : PubMed/NCBI
|
|
26
|
Frei GM, Kremer M, Hanschmann KM, Krause
S, Albeck M, Sredni B and Schnierle BS: Antitumour effects in
mycosis fungoides of the immunomodulatory, tellurium-based
compound, AS101. Br J Dermatol. 158:578–586. 2008. View Article : Google Scholar : PubMed/NCBI
|
|
27
|
Grimes HL, Chan TO, Zweidler-McKay PA,
Tong B and Tsichlis PN: The Gfi-1 proto-oncoprotein contains a
novel transcriptional repressor domain, SNAG, and inhibits G1
arrest induced by interleukin-2 withdrawal. Mol Cell Biol.
16:6263–6272. 1996. View Article : Google Scholar : PubMed/NCBI
|
|
28
|
Duan Z, Zarebski A, Montoya-Durango D,
Grimes HL and Horwitz M: Gfi1 coordinates epigenetic repression of
p21Cip/WAF1 by recruitment of histone lysine methyltransferase G9a
and histone deacetylase 1. Mol Cell Biol. 25:10338–10351. 2005.
View Article : Google Scholar : PubMed/NCBI
|
|
29
|
Mandal M, Bandyopadhyay D, Goepfert TM and
Kumar R: Interferon-induces expression of cyclin-dependent
kinase-inhibitors p21WAF1 and p27Kip1 that prevent activation of
cyclin-dependent kinase by CDK-activating kinase (CAK). Oncogene.
16:217–225. 1998. View Article : Google Scholar : PubMed/NCBI
|
|
30
|
Abbas T, Jha S, Sherman NE and Dutta A:
Autocatalytic phosphorylation of CDK2 at the activating Thr160.
Cell Cycle. 6:843–852. 2007. View Article : Google Scholar : PubMed/NCBI
|
|
31
|
Martin-Caballero J, Flores JM,
Garcia-Palencia P and Serrano M: Tumor susceptibility of
p21(Waf1/Cip1)-deficient mice. Cancer Res. 61:6234–6238.
2001.PubMed/NCBI
|
|
32
|
Shiohara M, el-Deiry WS, Wada M, Nakamaki
T, Takeuchi S, Yang R, Chen DL, Vogelstein B and Koeffler HP:
Absence of WAF1 mutations in a variety of human malignancies.
Blood. 84:3781–3784. 1994. View Article : Google Scholar : PubMed/NCBI
|
|
33
|
Grimes HL, Gilks CB, Chan TO, Porter S and
Tsichlis PN: The Gfi-1 protooncoprotein represses Bax expression
and inhibits T-cell death. Proc Natl Acad Sci USA. 93:14569–14573.
1996. View Article : Google Scholar : PubMed/NCBI
|