Introduction
Globally, colorectal cancer (CRC) ranks third in
incidence (10.0%) and second in cancer-related mortality (9.4%)
among all types of cancer (1). In
China, CRC is the fifth leading cause of death, with continuing
increases in incidence (12.2%) and mortality (8.6%) (2). In addition, ~20% of patients with CRC
present with distant metastases at the time of initial diagnosis
(3). Despite notable advances in
treatment strategies for CRC, such as surgery, chemotherapy and
radiotherapy, >50% of patients with CRC develop metastasis,
leading to a high mortality rate (4,5).
Therefore, an improved understanding of the mechanisms underlying
CRC pathogenesis is urgently needed to develop effective diagnostic
and prognostic biomarkers and to identify potential therapeutic
targets.
In our previous study, a gene expression profile
microarray (GSE113513) was used to identify a panel of
differentially expressed genes between 14 CRC and adjacent
noncancerous colorectal tissue samples (6). Among these differentially expressed
genes, the expression levels of Fc fragment of IgG binding protein
(FCGBP) were lower in CRC tissue specimens compared with
those in normal tissues. FCGBP, which was originally isolated from
intestinal mucosa, is located on chromosome 19q13 and encodes a
large mucin-like protein (>500 kDa) that binds the Fc region of
IgG (7,8). FCGBP comprises numerous repeated
domains, including 13 von Willebrand factor D, 12 cysteine-rich and
12 trypsin inhibitor-like domains (7–9). FCGBP
is broadly expressed in various tissues, including the intestinal
epithelium, gall bladder, cystic ducts, bronchi, submandibular
glands and uterine cervix, as well as the fluids secreted by cells
in these tissues (10).
Mutations and alternative splicing of FCGBP
have been reported in hepatocholangiocarcinoma (11) and lung cancer (12). Additionally, differential expression
of FCGBP has been demonstrated to occur in various types of
malignancy, including gall bladder (13), prostate (14), thyroid (15), lung (12) and ovarian (16) cancer as well as head and neck
squamous cell carcinoma (17). FCGBP
has been reported to be involved in cancer development and
progression and is associated with patient survival in prostate
(18), thyroid (19) and head and neck squamous cell
(17) carcinoma, gall bladder cancer
(13), ovarian adenocarcinoma
(16) and osteosarcoma (20).
FCGBP was initially identified as a typical
component of the mucus secreted by goblet cells, and low FCGBP
levels have been observed in ulcerative colitis (21,22),
colorectal adenoma (23), colorectal
carcinoma (24–26) and CRC metastatic tissues (27–30). Low
levels of FCGBP expression have also been reported to be associated
with a short survival time in patients with CRC (27,28),
suggesting that FCGBP may serve an important role in the
development of CRC and may be used as a diagnostic and prognostic
biomarker for CRC. In addition, FCGBP is an important component of
immunological mucosal defenses (7).
For example, Toxoplasma Gondii infection downregulates the
expression levels of a number of secretory genes including
FCGBP, which is involved in the transient disruption and
reorganization of splenic architecture (31). However, the association between FCGBP
expression and tumor immunity in CRC has not been reported to date.
A previous study has revealed that goblet cells are not only
secretory cells and that they uptake luminal material and deliver
it to dendritic cells (DCs) in the lamina propria, suggesting a
potential role for FCGBP in the immune response (32). In addition, as components of the
tumor microenvironment, immune cells have been demonstrated to act
as tumor promoters as well as suppressors (33). Considering their roles during tumor
progression and recurrence, including metastasis and therapy
resistance, immune cells are crucial determining factors in
clinical outcomes and response to immunotherapy (34–36).
Therefore, the present study aimed to determine the correlation of
FCGBP expression levels with the numbers of immune cells and to
assess its potential role as a target for immunotherapy in CRC.
Materials and methods
Gene expression profiling interactive
analysis
Gene Expression Profiling Interactive Analysis
(GEPIA; http://gepia.cancer-pku.cn/index.html) (37) is a web-based tool that includes 9,736
tumor and 8,587 normal tissue samples from The Cancer Genome Atlas
(TCGA) and the Genotype-Tissue Expression projects. The
FCGBP expression levels in the colon adenocarcinoma (COAD)
dataset were obtained using matching normal tissue data in TCGA.
The data were log2(TPM+1)-transformed for differential analysis,
and the log2(fold-change) was defined as median (Tumor)-median
(Normal). In the COAD dataset, the association between FCGBP
mRNA expression levels and overall or disease-free survival was
analyzed using the Kaplan-Meier method with the log-rank test.
FCGBP expression levels in various CRC stages were compared
by one-way analysis of variance to calculate differential
FCGBP expression (http://gepia.cancer-pku.cn/detail.php?gene=FCGBP).
cBioPortal database analysis
The online cBioPortal tool (http://www.cbioportal.org), a software for interactive
exploration of multiple cancer genomic datasets, was used to
analyze FCGBP mutations in CRC samples.
Oncomine database analysis
Oncomine (http://www.oncomine.org) is an online platform that
incorporates 264 independent datasets for 35 types of cancer and
supports various analysis methods, including molecular concept,
interactome and meta-analysis (38).
FCGBP mRNA expression levels were compared in multiple datasets
(Table I) (39–43)
using the following filters: i) Gene, FCGBP; ii) analysis type,
differential analysis of cancer vs. normal tissue; and iii) cancer
type, CRC. The following thresholds were used: P-value, 0.05;
fold-change, 2; and gene ranking, all.
 | Table I.Oncomine analysis of Fc fragment of
IgG-binding protein expression in colorectal cancer in seven
colorectal cancer cohorts. |
Table I.
Oncomine analysis of Fc fragment of
IgG-binding protein expression in colorectal cancer in seven
colorectal cancer cohorts.
| Dataset | Samples | Fold-change | P-value | t-value |
|---|
| Kaiser Colon | Colon
adenocarcinoma (n=41) vs. normal (n=5) | −8.454 |
3.78×10⁻¹⁵ | −11.938 |
|
| Cecum
adenocarcinoma (n=17) vs. normal (n=5) | −11.05 |
7.26×10⁻⁹ | −9.516 |
|
| Rectosigmoid
adenocarcinoma (n=10) vs. normal (n=5) | −6.964 |
1.28×10⁻⁴ | −5.559 |
|
| Colon mucinous
adenocarcinoma (n=13) vs. normal (n=5) | −2.574 | 0.001 | −3.604 |
|
| Rectal
adenocarcinoma (n=8) vs. normal (n=5) | −5.854 | 0.006 | −3.346 |
|
| Rectal mucinous
adenocarcinoma (n=4) vs. normal (n=5) | −9.213 | 0.013 | −3.979 |
| TCGA
colorectal | Rectal
adenocarcinoma (n=60) vs. normal (n=22) | −4.576 |
2.45×10⁻²⁷ | −19.081 |
|
| Colon
adenocarcinoma (n=101) vs. normal (n=22) | −4.157 |
9.00×10⁻²⁵ | −20.029 |
|
| Cecum
adenocarcinoma (n=22) vs. normal (n=22) | −4.67 |
1.18×10⁻¹⁵ | −13.628 |
|
| Colon mucinous
adenocarcinoma (n=22) vs. normal (n=22) | −2.849 |
1.63×10⁻⁹ | −8.163 |
|
| Rectosigmoid
adenocarcinoma (n=3) vs. normal (n=22) | −6.682 |
2.92×10⁻⁴ | −14.447 |
|
| Rectal mucinous
adenocarcinoma (n=6) vs. normal (n=22) | −3.279 | 0.008 | −3.520 |
| Skrzypczak
colorectal 2 | Colon adenoma
epithelia (5) vs. normal (10) | −11.298 |
2.57×10⁻⁹ | −13.767 |
|
| Colon carcinoma
epithelia (n=5) vs. normal (n=10) | −42.143 |
1.43×10⁻⁹ | −17.128 |
|
| Colon adenoma (n=5)
vs. normal (n=10) | −13.483 |
2.05×10⁻⁷ | −9.422 |
|
| Colon carcinoma
(n=5) vs. normal (n=10) | −52.679 |
9.50×10⁻⁶ | −9.689 |
| Notterman
colon | Colon
adenocarcinoma (n=18) vs. normal (n=18) | −4.521 |
2.68×10⁻⁵ | −4.631 |
| Hong
colorectal | Colorectal
carcinoma (n=70) vs. normal (n=12) | −17.174 |
1.54×10⁻²¹ | −12.929 |
| Skrzypczak
colorectal | Colorectal
carcinoma (n=36) vs. normal (n=24) | −10.911 |
7.31×10⁻¹⁰ | −7.693 |
| Gaedcke
colorectal | Rectal
adenocarcinoma (n=65) vs. normal (n=65) | −11.899 |
1.00×10⁻¹⁴ | −9.755 |
R2 database analysis
R2 (http://r2.amc.nl), a web-based
genomics analysis and visualization tool that contains gene
microarray and RNA-Seq data (44),
was used to analyze the association between FCGBP mRNA expression
levels and disease-free, relapse-free and event-free survival. The
following datasets were used: Tumor Colon - Smith - 232 MAS5.0 -
u133p2, Tumor Colon - Sieber - 290 MAS5.0 - u133p2, Tumor Colon -
SieberSmith - 355 MAS5.0 - u133p2, Tumor Colon MSI - status
(Core-Transcript) - Sveen - 95 rma sketch - huex10t, Tumor Colon
CIT (Combat) - Marisa - 566rma - u133p2 and Tumor Colon MVRM -
SieberSmith - 345 fRMA(bc) - u133p2.
Tumor IMmune Estimation Resource
(TIMER) database analysis
As a comprehensive resource for systematic analysis
of immune infiltrates in cancer, TIMER (https://cistrome.shinyapps.io/timer/) (45) includes 10,897 samples from 32 types
of cancer in TCGA. Using the COAD dataset, the present study
utilized TIMER to analyze the correlation of FCGBP expression
levels with the extent of immune infiltrates including B cells,
CD4+ and CD8+ T cells, neutrophils,
macrophages and DCs, via gene modules. FCGBP expression levels
based on tumor purity were also analyzed (46,47). The
correlation module generated expression scatter plots between pairs
of user-defined genes in CRC, performed Spearman's correlation
analysis and estimated the statistical significance. Gene
expression levels were displayed as log2[transcripts per million
(TPM)] values. Correlations were analyzed between FCGBP expression
and markers of tumor-infiltrating immune cells, including those for
CD8+ T cells, T cells (general), B cells, monocytes,
tumor-associated macrophages (TAMs), M1 and M2 macrophages,
neutrophils, natural killer cells, DCs, T-helper 1 (Th1), T-helper
2 (Th2), follicular helper T (Tfh), T-helper 17 (Th17) cells,
regulatory T cells (Tregs) and exhausted T cells (48–50).
Immunohistochemistry and image
analysis
The tissue microarrays (TMAs) used in the present
study (cat no. HColAde080CD01, containing 69 pairs of CRC tissues
and adjacent noncancerous colorectal tissues; and HColA180Su15,
containing four normal colorectal tissue, seven colorectal adenoma,
seven primary and 10 metastatic CRC tissue samples) were purchased
from Shanghai Outdo Biotech Co., Ltd. For immunohistochemical
staining, the slides were deparaffinized in xylene and rehydrated
through graded ethanol series (100, 95, 90, 80 and 70%). Antigen
retrieval was performed with 0.1% sodium citrate buffer (pH 6.0)
for 20 min at 95°C. Endogenous peroxidase activity was quenched
with 3% H2O2 in water, and nonspecific
binding was blocked with PBS containing 1% bovine serum albumin
(Beijing Solarbio Science & Technology Co., Ltd.) for 15 min at
room temperature. Subsequently, the slides were sequentially
incubated with an anti-FCGBP antibody (1:200; cat. no. ab217146;
Abcam) at 4°C overnight, a ready-to-use biotinylated secondary
antibody from the UltraSensitive S-P kit (Fuzhou Maixin Biotech
Co., Ltd.) for 10 min at room temperature, and a ready-to-use
horseradish peroxidase-conjugated streptavidin antibody from the
UltraSensitive S-P kit for 10 min at room temperature. The slides
were then incubated with the chromogen diaminobenzidine (Fuzhou
Maixin Biotech Co., Ltd.) for 2 min at room temperature and
counterstained with diluted Harris hematoxylin (Fuzhou Maixin
Biotech Co., Ltd.) for 1 min. Images were captured using a Nano
Zoomer 2.0 HT slide scanner (Hamamatsu Photonics K.K.) and
processed using the Nano Zoomer Digital Pathology View 1.6 software
(Hamamatsu Photonics K.K.). Immunohistochemistry scores in various
tissue types were independently determined by two experienced
pathologists blinded to the clinical and pathological data.
Staining intensity and percentage of positively stained cells were
determined as previously described (6). Scores of 4–12 and 0–3 were considered
to indicate high and low FCGBP protein expression levels,
respectively. All experiments were approved by the Ethics Committee
of Fujian University of Traditional Chinese Medicine (Fujian,
China).
Statistical analysis
Data are presented as the mean ± standard deviation.
FCGBP expression is presented as log2(TPM+1)-transformed expression
data in the plots. Statistical analyses were performed using SPSS
22.0 software (IBM Corp.). One-way ANOVA was performed to analyze
FCGBP expression among pathological stages. Differences between
paired CRC and adjacent or distant normal colorectal tissues were
assessed using the Wilcoxon paired sample test. Differences between
independent samples from two groups were assessed using the
Mann-Whitney U test. Differences among three or more groups were
assessed using Kruskal-Wallis test with the Mann-Whitney test and
the Bonferroni correction for pairwise comparisons. Differences in
FCGBP mRNA expression levels between CRC and unpaired normal
colorectal tissues in the Oncomine database were analyzed by the
unpaired Student's t-test. The associations of FCGBP expression
levels between patient groups were evaluated by the Fisher's exact
test. Survival rates were determined using the Kaplan-Meier method
and compared by the log-rank test. P<0.05 was considered to
indicate a statistically significant difference.
Results
Downregulation and mutations of FCGBP
in CRC
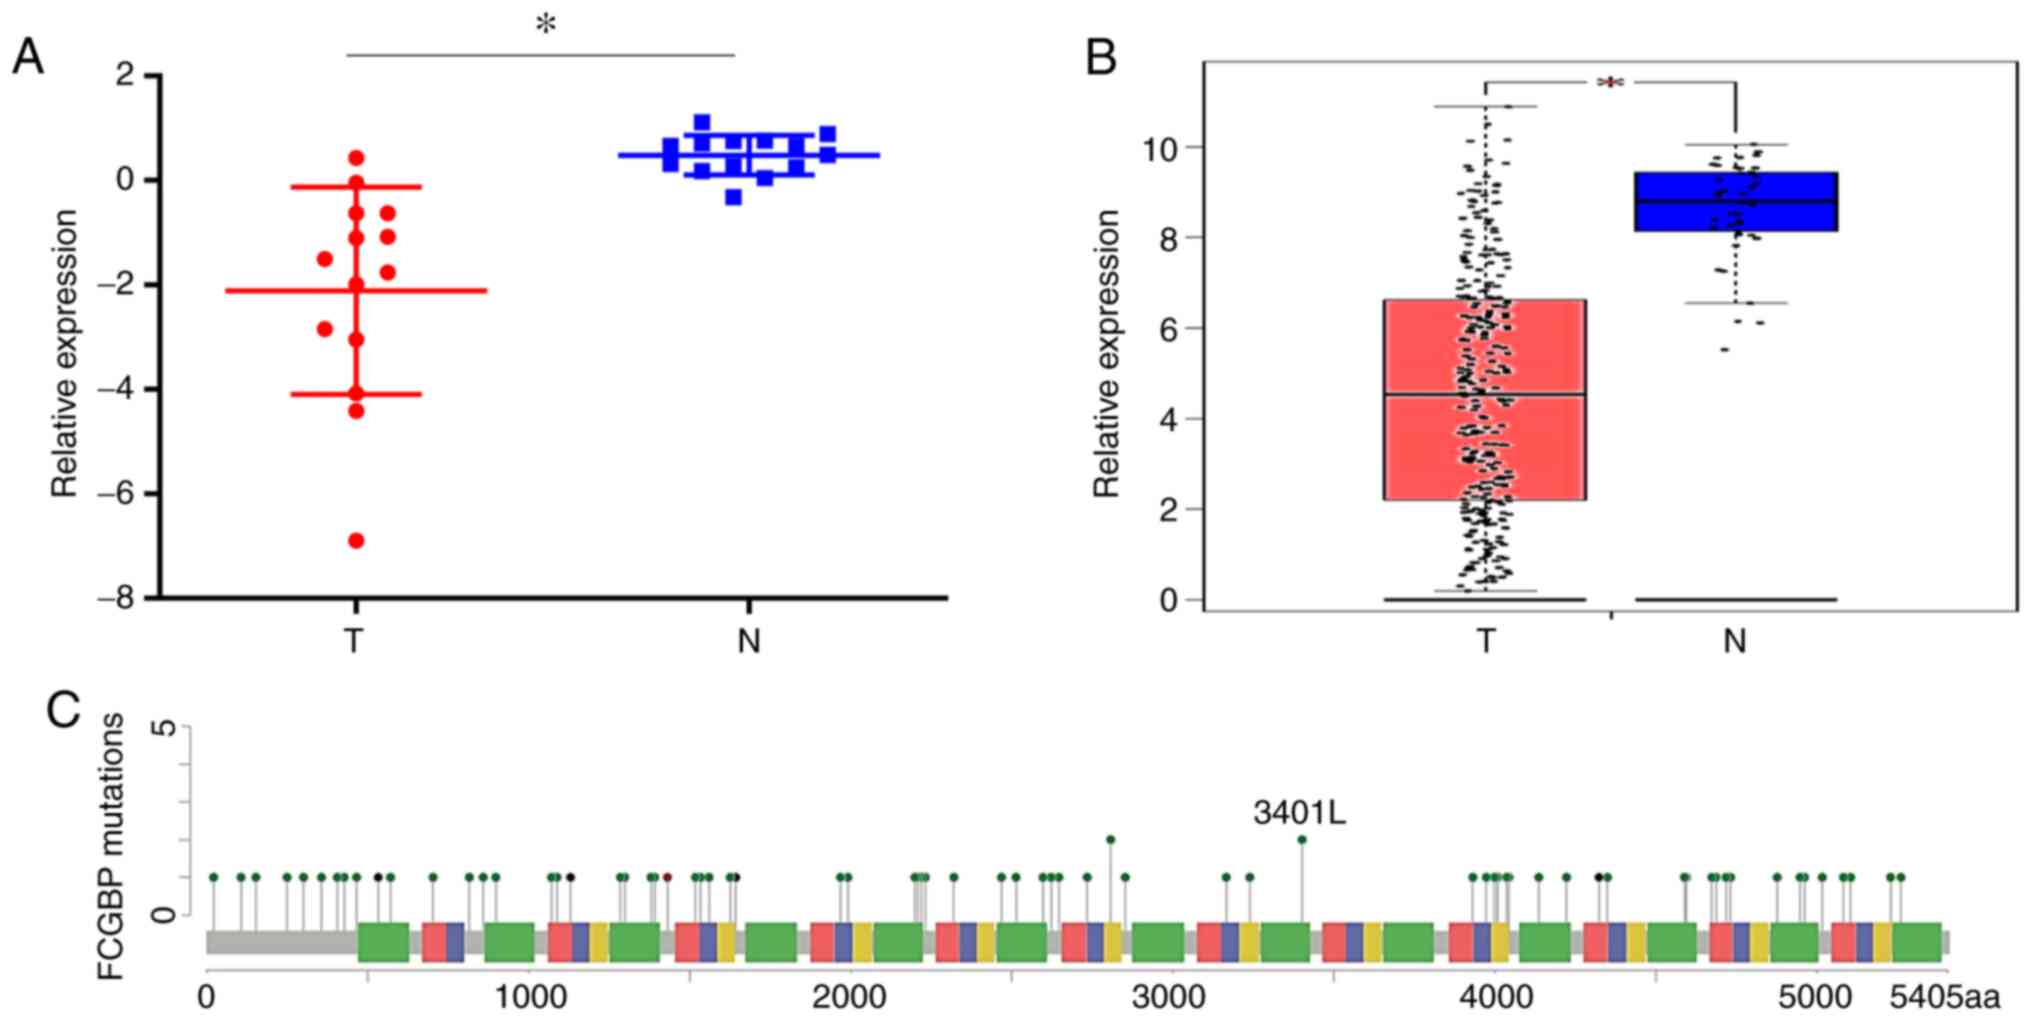
To determine the differences in FCGBP
expression between CRC and adjacent noncancerous tissues,
FCGBP mRNA expression levels were compared in 14 matched
pairs of primary CRC and noncancerous tissues using a cDNA array
from our laboratory (GSE113513) (6).
The results demonstrated a significant decrease in the FCGBP
expression levels in the CRC tissues compared with those in the
adjacent noncancerous colorectal tissues (P<0.05; Fig. 1A). The analysis of publicly available
tumor expression data in GEPIA (P<0.05; Fig. 1B) and Oncomine (Table I) also revealed that the FCGBP
mRNA levels were lower in the CRC tissues compared with those in
the noncancerous tissues. The analysis of FCGBP mutations
using cBioPortal revealed a somatic mutation frequency of 10.5% in
the FCGBP DNA sequence (Fig.
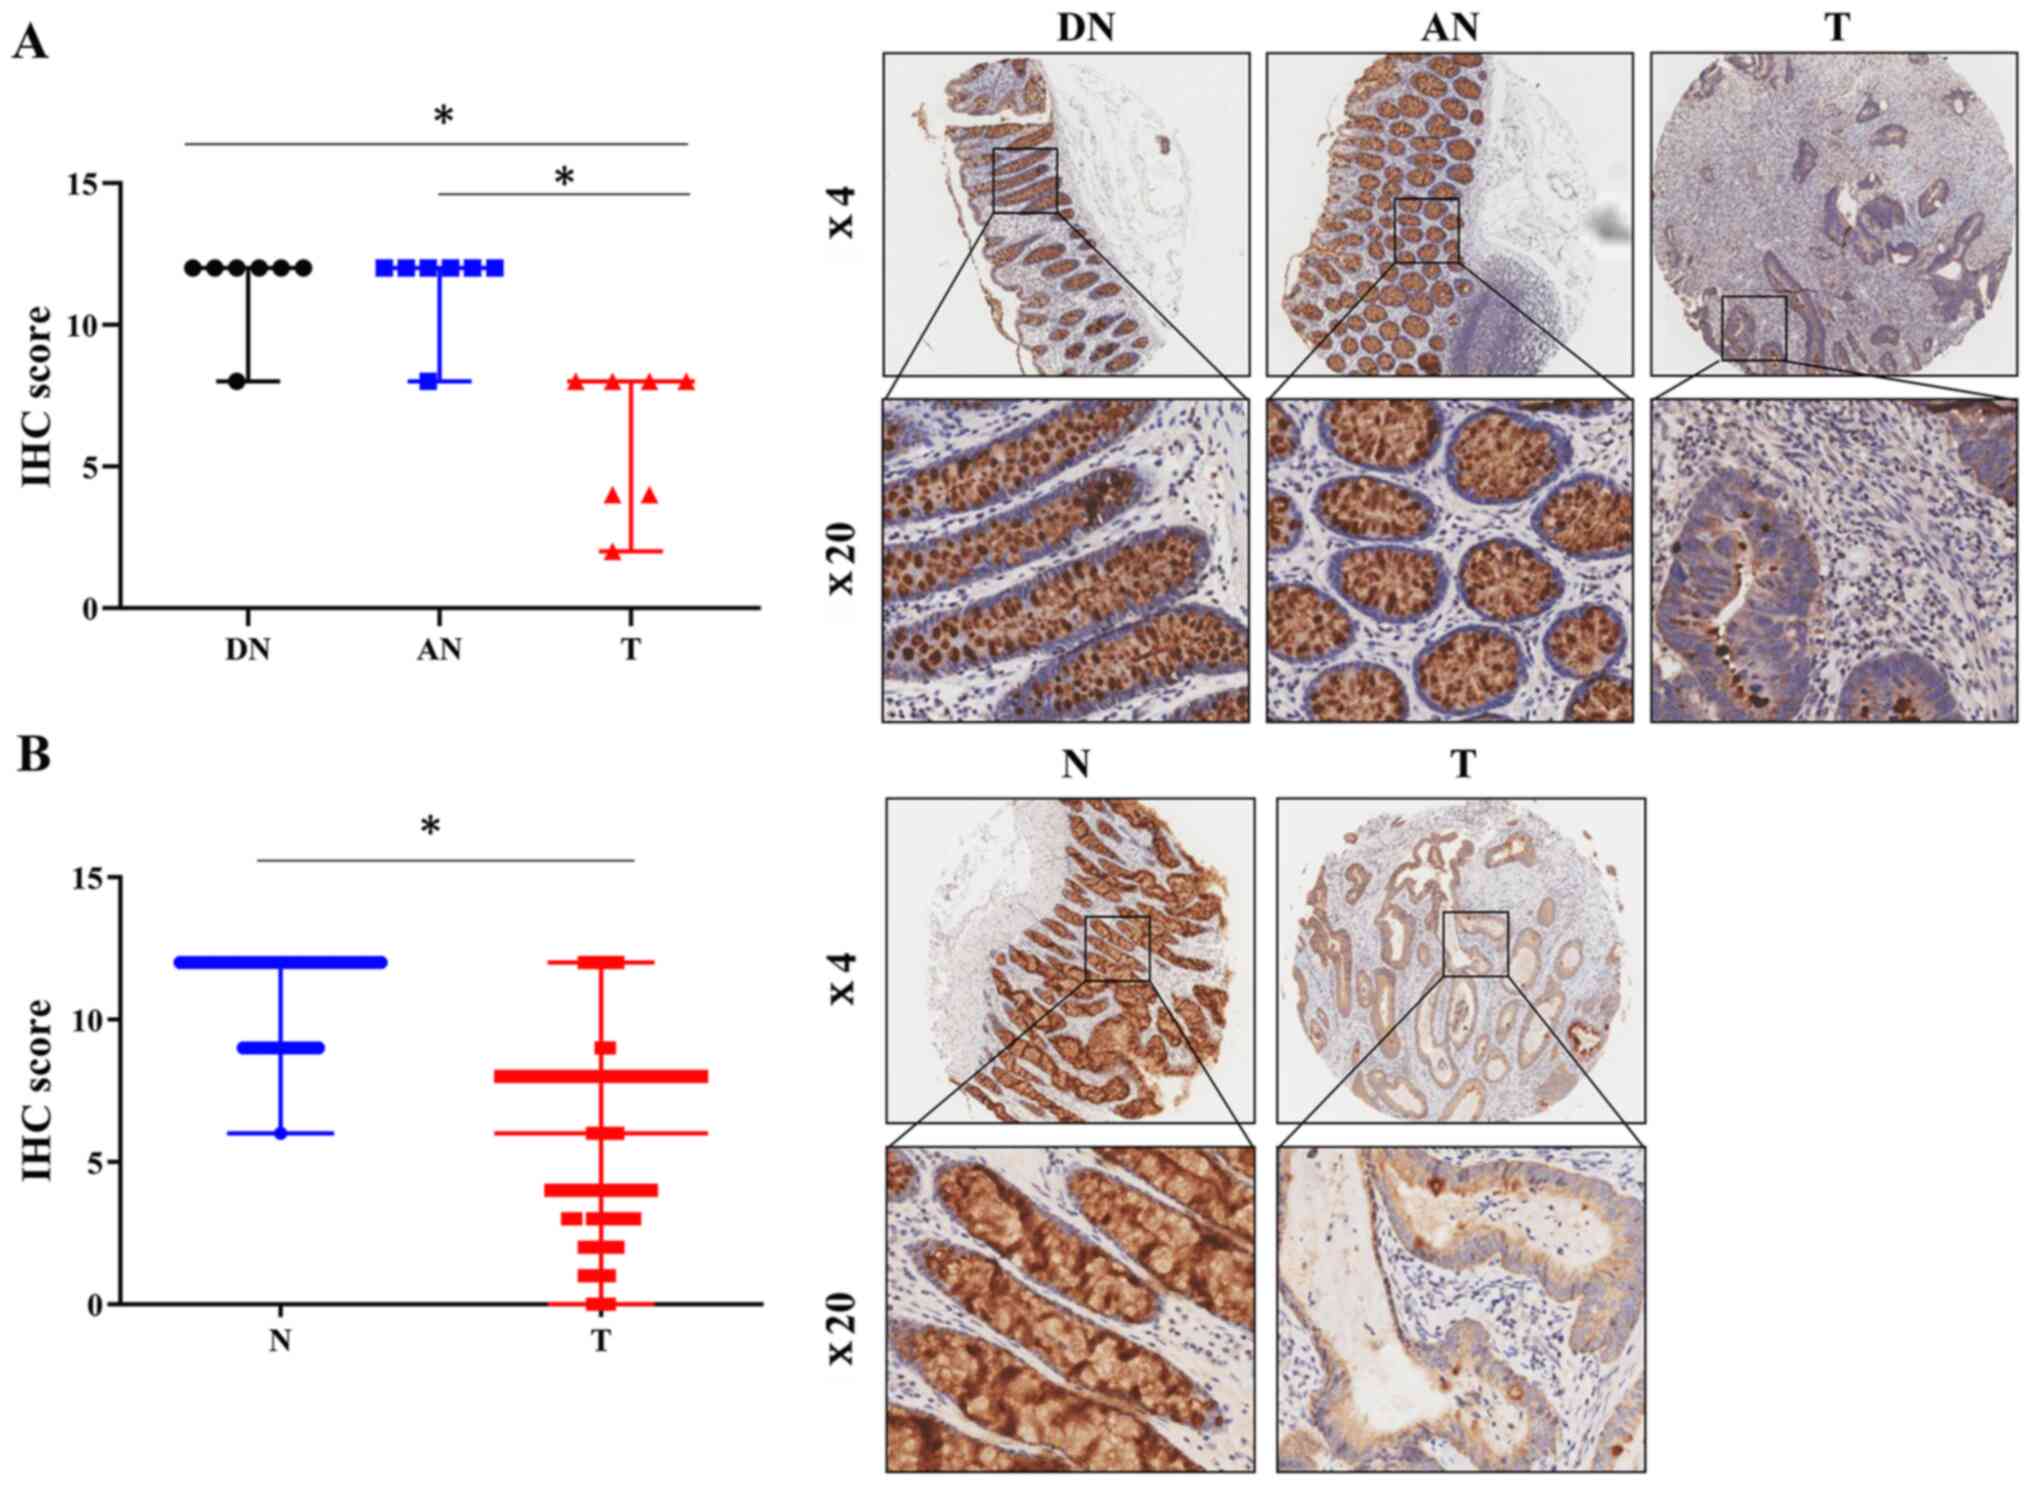
1C). Furthermore, immunohistochemical analysis of a TMA
demonstrated a significant decrease in the protein expression
levels of FCGBP in the CRC tissues compared with the paired distal
and adjacent noncancerous colorectal tissues (n=7 per group;
P<0.05; Fig. 2A), which was
validated in another TMA comprising 69 pairs of CRC and adjacent
noncancerous tissue samples (P<0.05; Fig. 2B). These results demonstrated a
significant downregulation of FCGBP mRNA and protein levels in CRC
tissues compared with those in noncancerous tissues.
Protein expression levels of FCGBP are
decreased in colorectal adenoma and carcinoma tissues
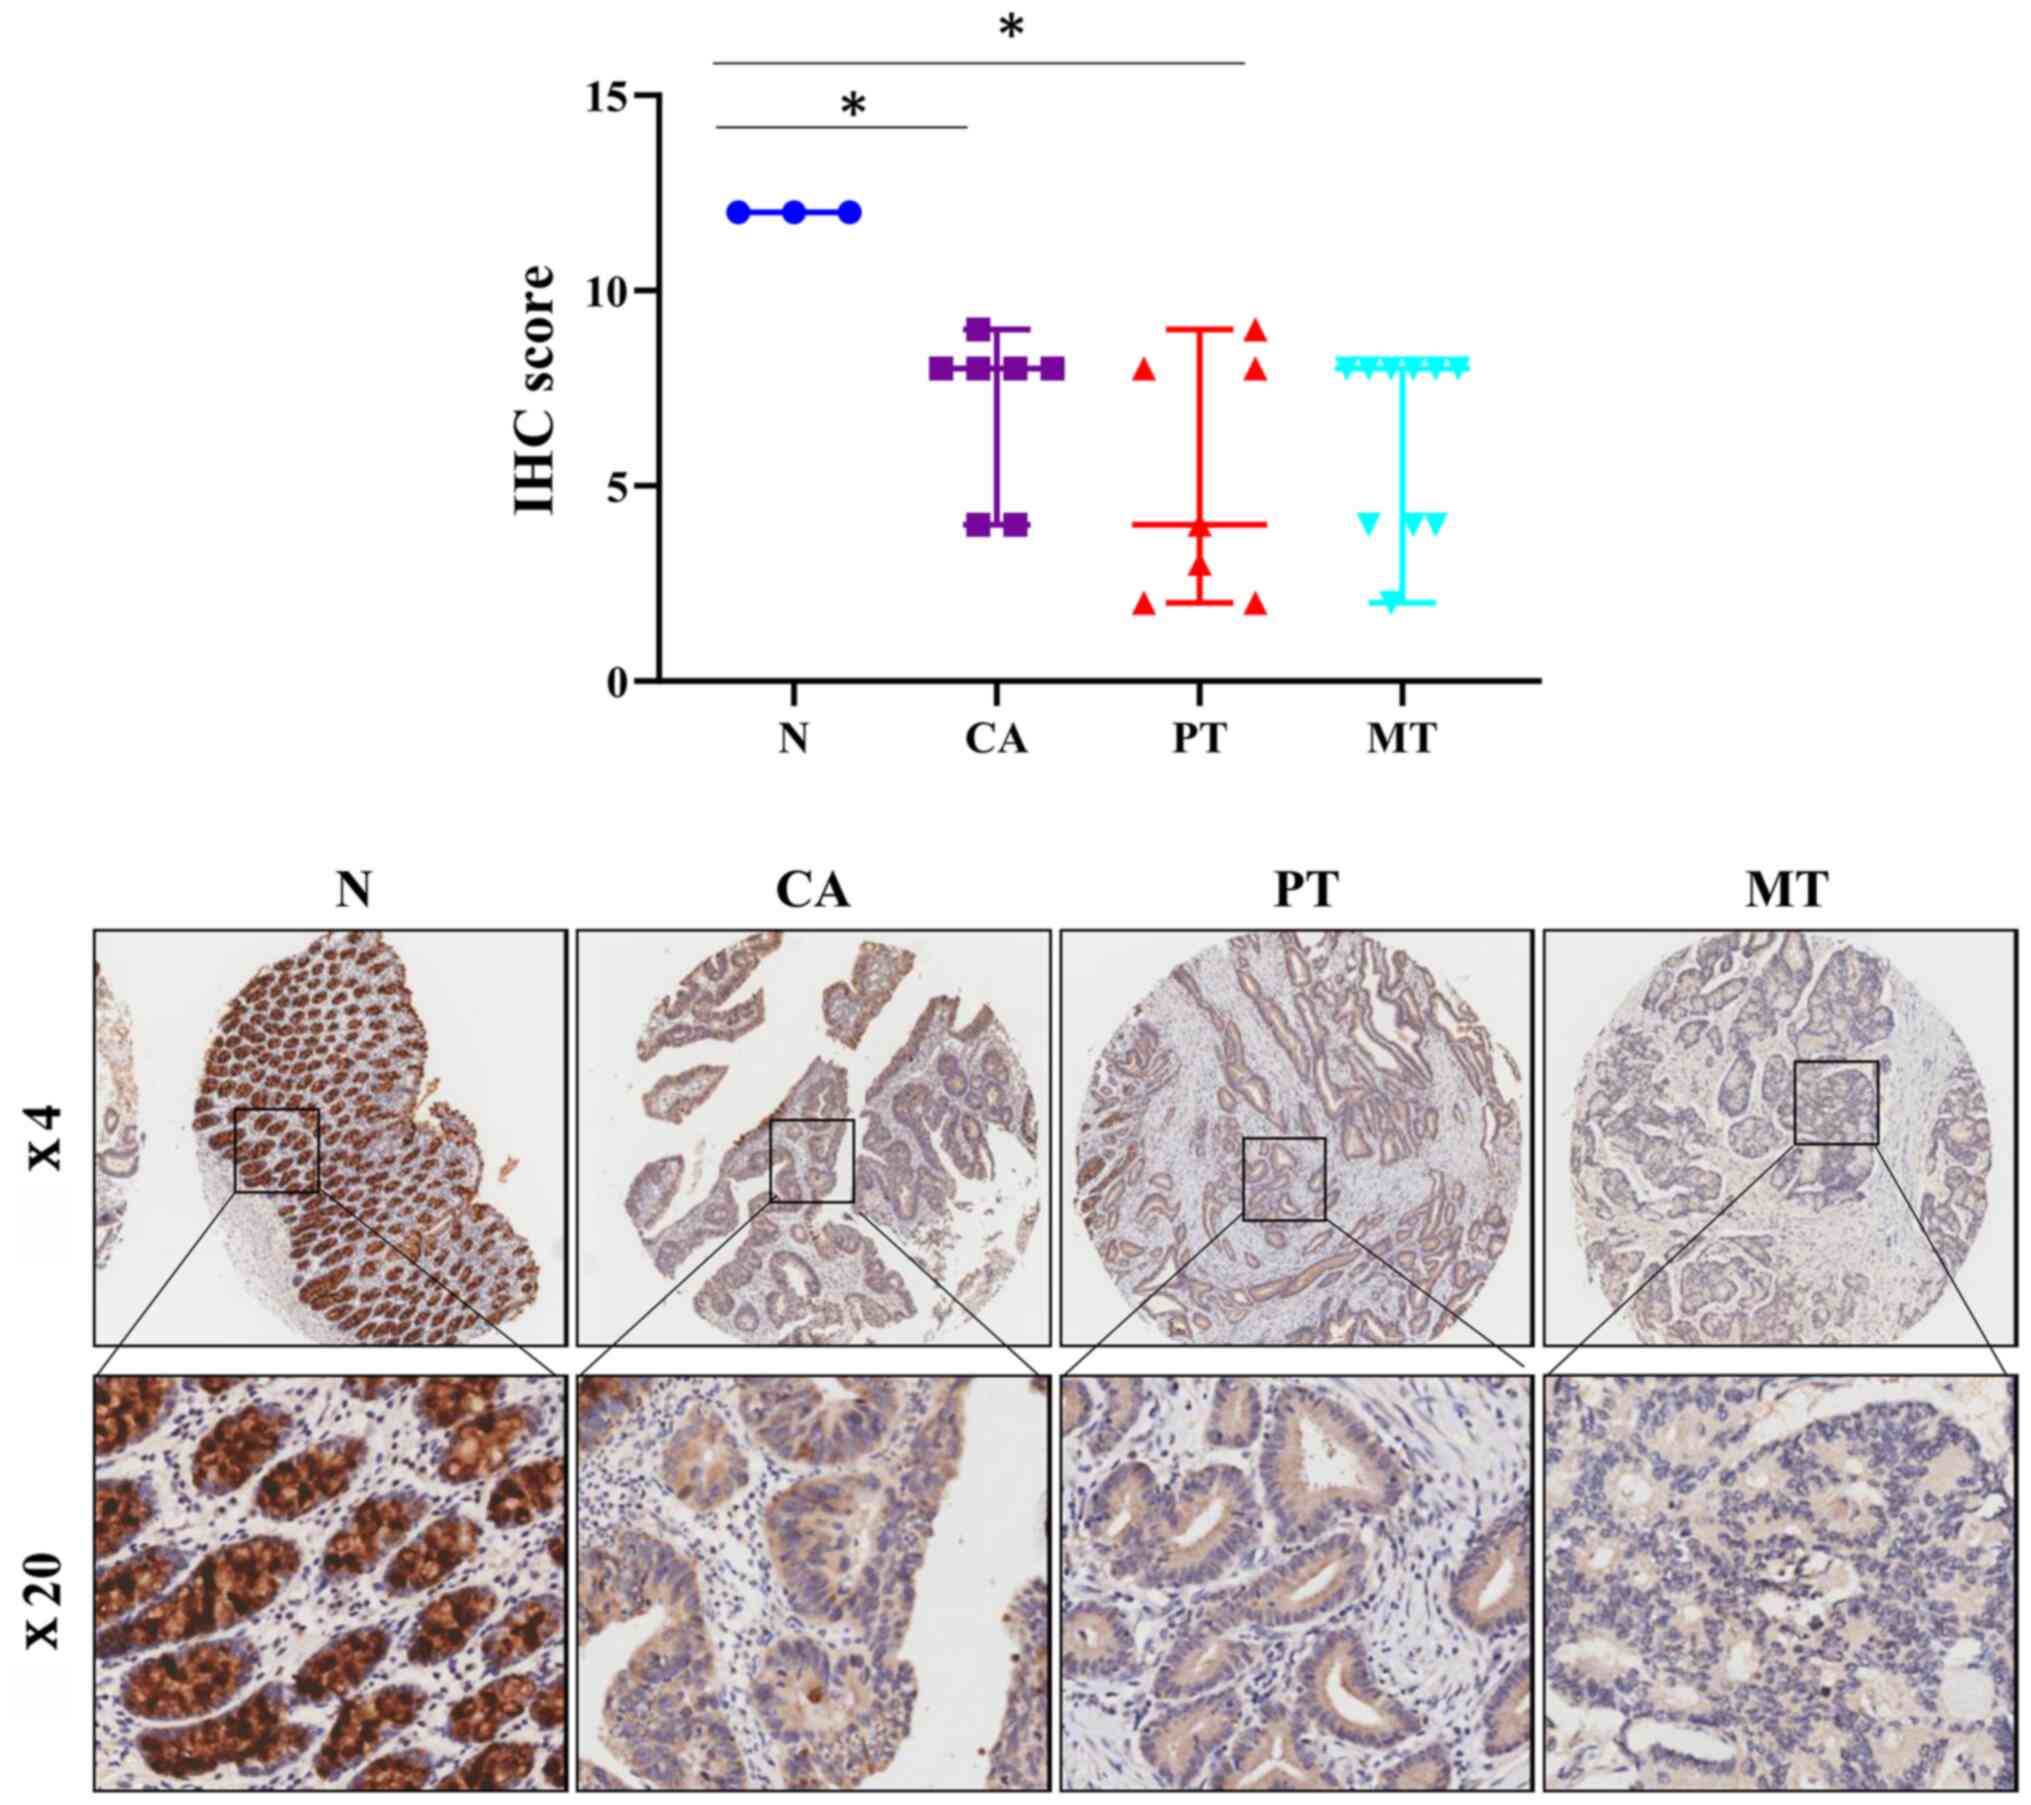
CRC arises in preexisting adenomas, and death
frequently occurs due to metastasis in patients with CRC (51). Therefore, the present study next
determined the protein levels of FCGBP in colorectal adenoma and
primary and metastatic CRC tissues by immunohistochemistry-based
TMA analysis. Notably, the protein expression levels of FCGBP were
significantly decreased in the colorectal adenoma tissues compared
with those in the normal colorectal tissues from healthy controls
(P<0.05; Fig. 3) and were
comparable to those observed in the primary and metastatic CRC
tissues. These results suggested that the decrease in the protein
levels of FCGBP may serve a crucial role in malignant
transformation during CRC development.
Downregulation of FCGBP expression in
advanced-stage CRC tissues
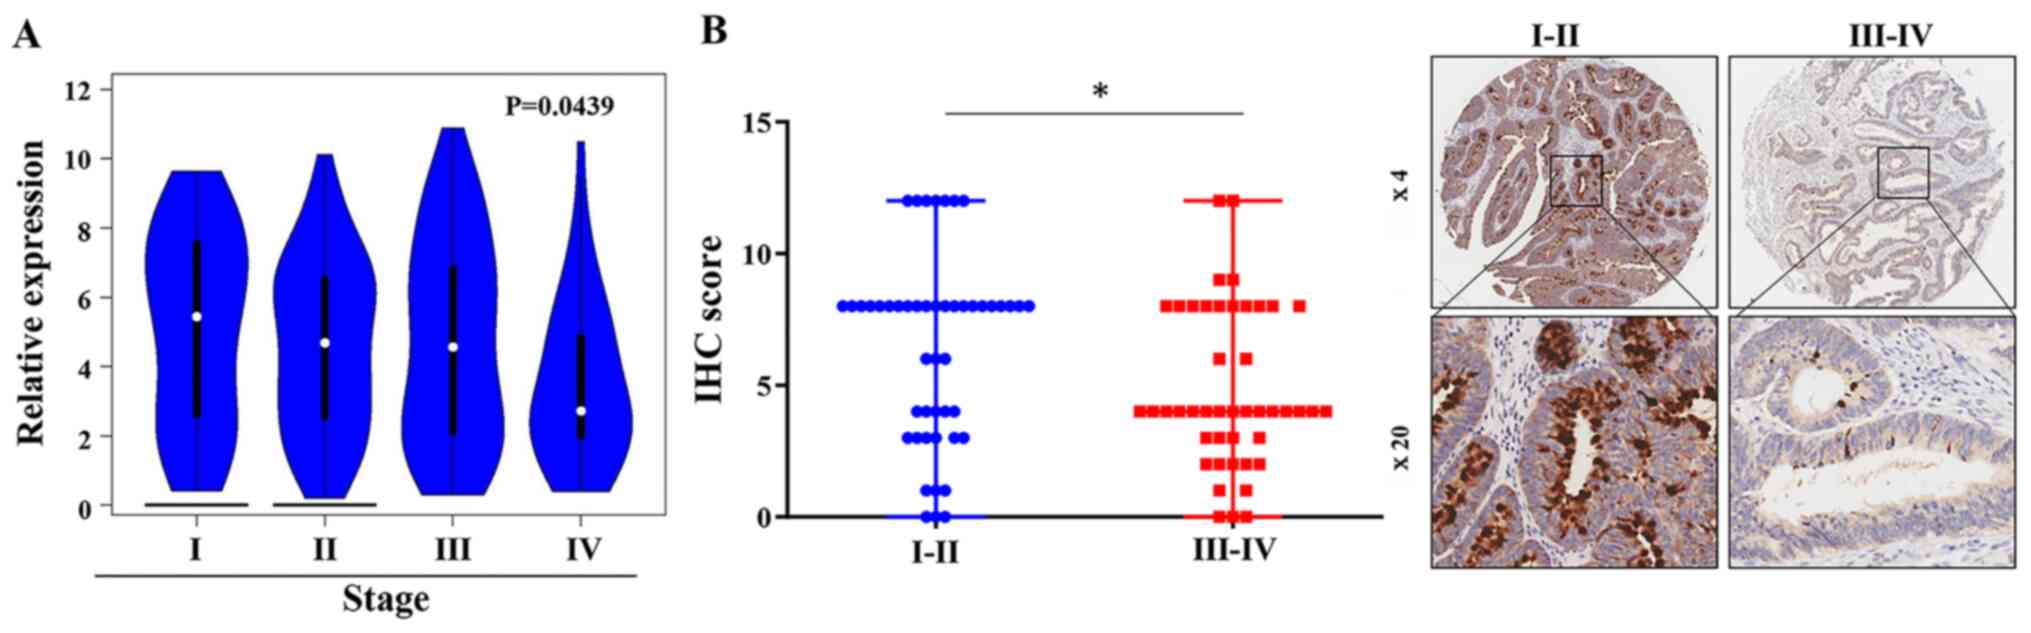
To further assess FCGBP expression in CRC
development, FCGBP mRNA expression levels were compared
among CRC tissues from various pathological stages. The analysis of
the COAD dataset in GEPIA revealed a gradual decrease in
FCGBP mRNA expression levels in CRC tissues with advancing
pathological stage (P<0.05; Fig.
4;). The analysis of the associations of patient
clinicopathological characteristics and the protein levels of FCGBP
in CRC TMAs demonstrated that the protein levels of FCGBP were
lower in advanced-stage CRC tissues compared with those in
early-stage CRC tissues (III+IV vs. I+II, P<0.05; Table II; Fig.
4B); however, a similar association was not observed with other
clinicopathological parameters (Table
II). Collectively, these results suggested that downregulation
of FCGBP expression levels may be associated with advanced-stage
CRC.
| Table II.Associations between FCGBP expression
levels and the clinicopathological characteristics of patients with
colon cancer. |
Table II.
Associations between FCGBP expression
levels and the clinicopathological characteristics of patients with
colon cancer.
|
|
| FCGBP
expression |
|
|---|
|
|
|
|
|
|---|
|
Characteristics | n | Low, n | High, n | Fisher's
P-value |
|---|
| Total | 93 | 46 | 47 |
|
| Sex |
|
|
|
|
|
Male | 51 | 25 | 26 | >0.999 |
|
Female | 42 | 21 | 21 |
|
| Age, years |
|
|
|
|
|
<65 | 36 | 19 | 17 |
0.673 |
|
≥65 | 57 | 27 | 30 |
|
| Clinical stage |
|
|
|
|
|
I+II | 48 | 17 | 31 |
0.007a |
|
III+IV | 45 | 29 | 16 |
|
| T stage |
|
|
|
|
|
T1+T2 | 7 | 2 | 5 |
0.435 |
|
T3+T4 | 86 | 44 | 42 |
|
| N stage |
|
|
|
|
| N0 | 57 | 28 | 29 | >0.999 |
|
N1+N2 | 36 | 18 | 18 |
|
| M stage |
|
|
|
|
| M0 | 90 | 44 | 46 |
0.617 |
| M1 | 3 | 2 | 1 |
|
| Survival
status |
|
|
|
|
|
Alive | 41 | 23 | 18 |
0.300 |
|
Dead | 52 | 23 | 29 |
|
| Tumor size, cm |
|
|
|
|
|
<5 | 39 | 17 | 22 |
0.403 |
| ≥5 | 54 | 29 | 25 |
|
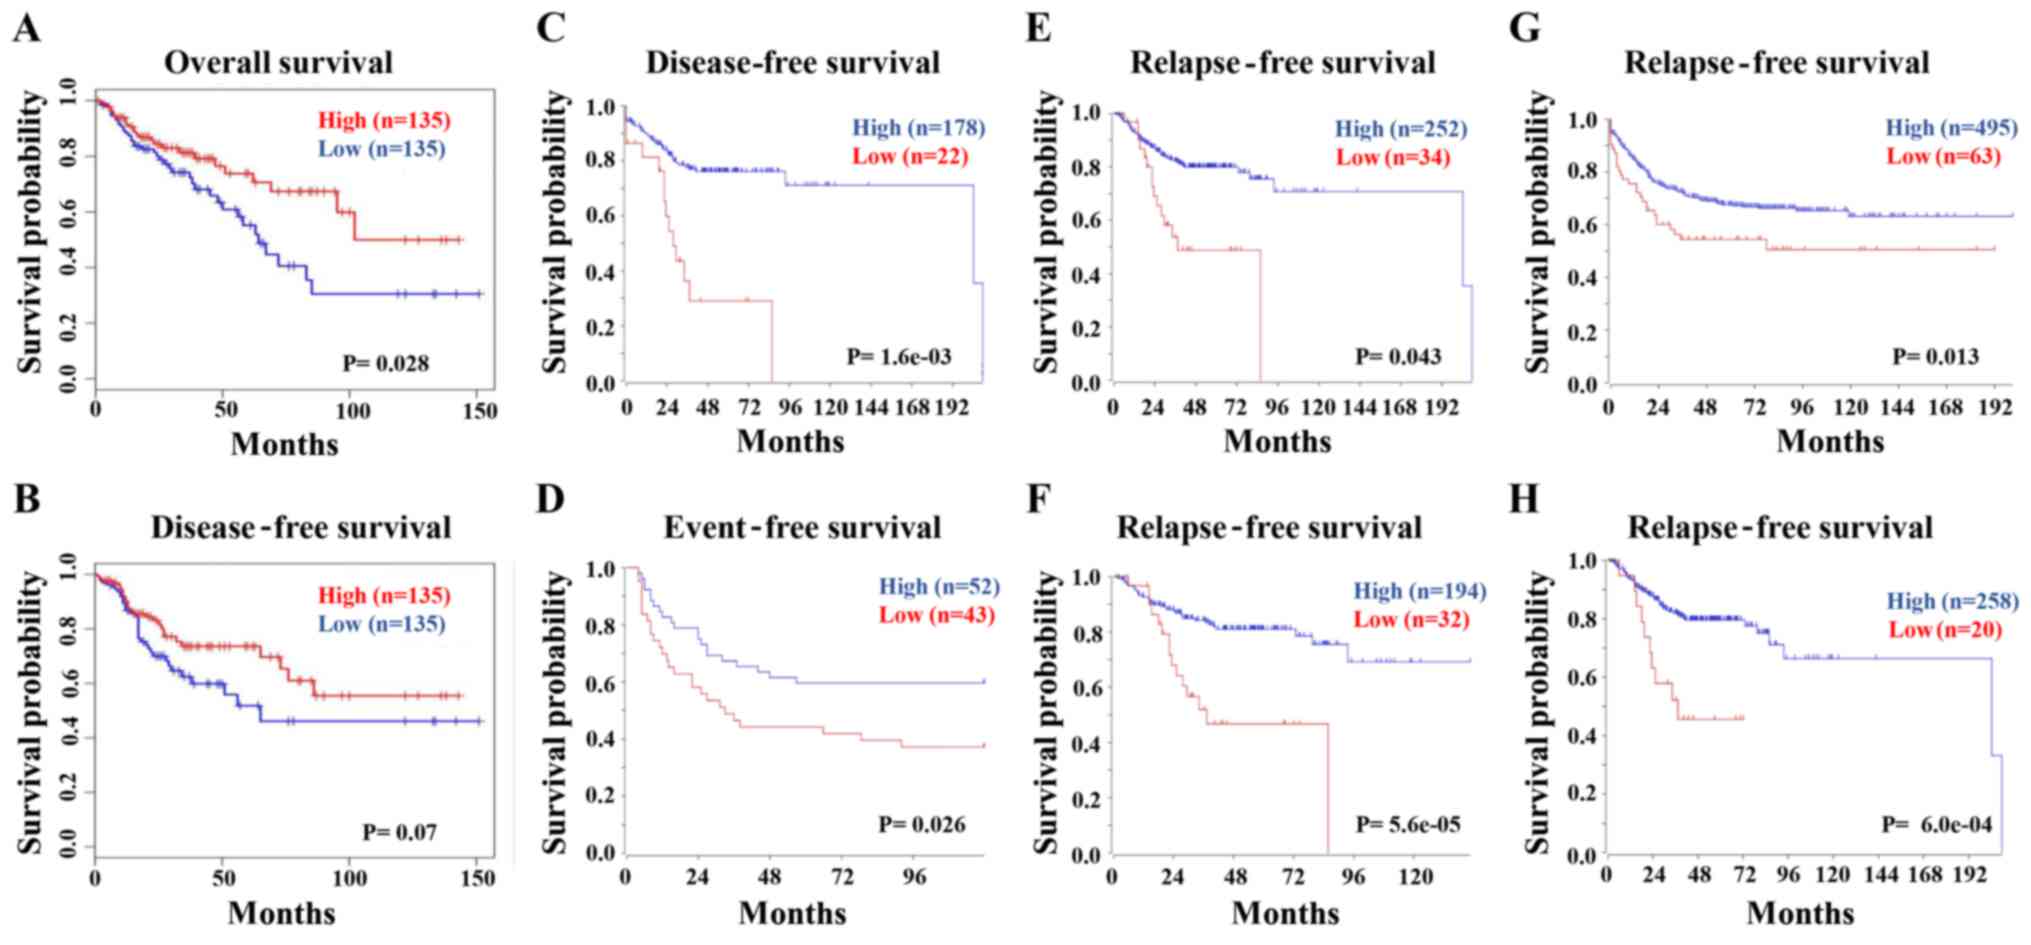
Downregulation of FCGBP predicts a
shorter survival time in patients with CRC
The association between FCGBP expression
levels and the survival times of patients with CRC was next
analyzed in the COAD dataset using GEPIA. The Kaplan-Meier analysis
demonstrated that low FCGBP mRNA levels were associated with
a short overall survival (Fig. 5A),
but not disease-free survival (P=0.07; Fig. 5B) in patients with CRC. Consistently,
the survival analysis from multiple datasets using R2 confirmed the
association between low FCGBP levels and short disease-free
(Fig. 5C), event-free (Fig. 5D) and relapse-free (Fig. 5E-H) survival times in patients with
CRC. These data suggested that low FCGBP mRNA expression
levels may serve as an indicator for the prognosis of CRC.
Correlation between FCGBP expression
levels and markers of immune infiltration in CRC
Considering the roles of tumor-infiltrating
lymphocytes in CRC development (52), the present study investigated the
relationship between FCGBP and immune infiltration in CRC.
Correlation analysis using TIMER revealed that FCGBP
expression levels were negatively correlated with tumor purity
(r=−0.183; P<0.05) and macrophages (r=−0.149; P<0.05) and
partially correlated with the levels of infiltrating B cells
(r=0.192; P<0.05) and DCs (r=0.100; P<0.05); however,
FCGBP expression was not correlated with the levels of
infiltrating CD4+ and CD8+ T cells or
neutrophils in CRC (all P>0.05; Fig.
6). These results suggested that FCGBP may be involved in the
regulation of B cells and DCs, but not T cells, in CRC.
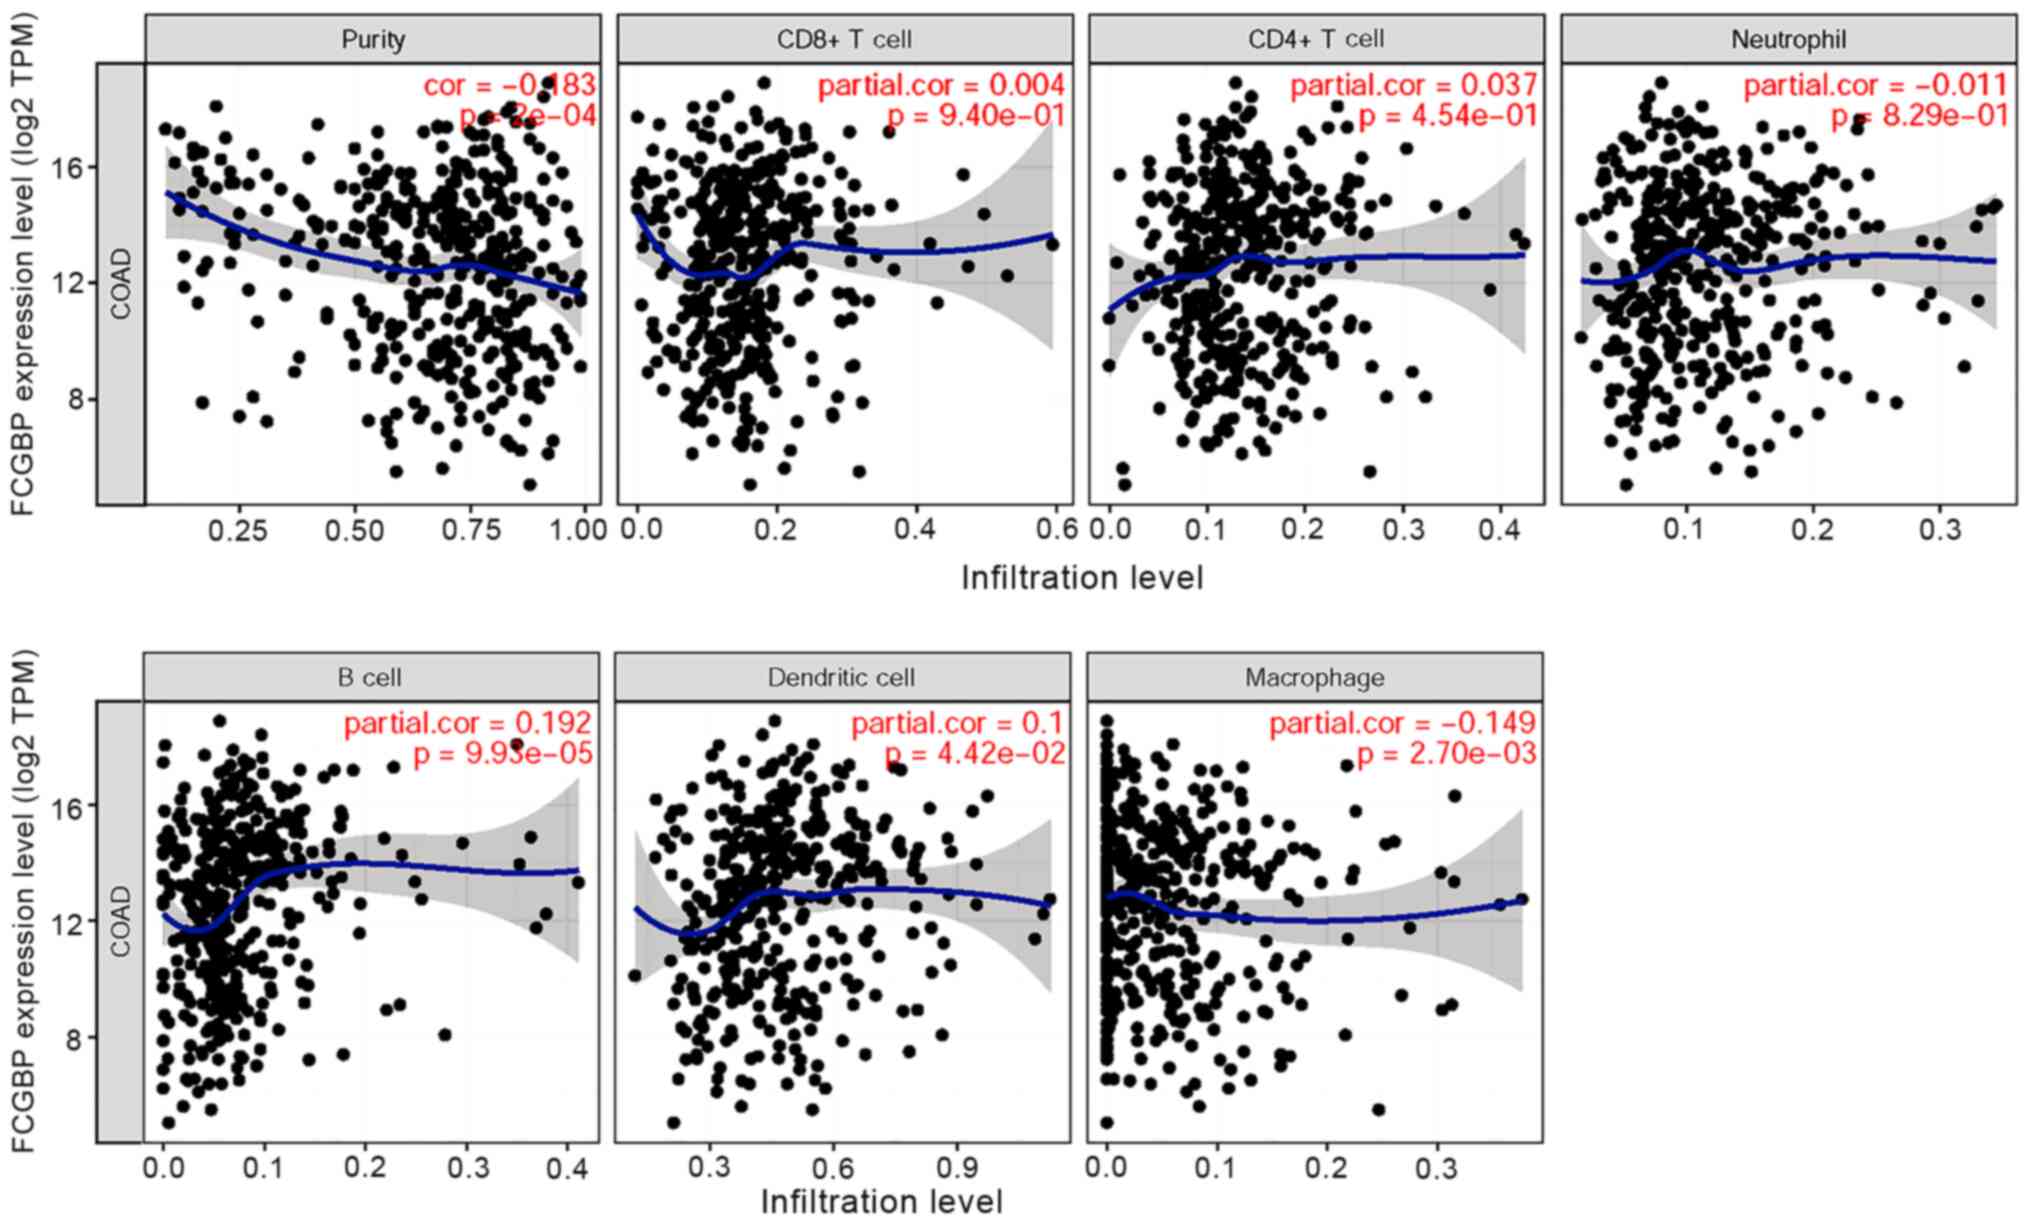 | Figure 6.Correlation between FCGBP expression
levels and the extent of immune cell infiltration. The COAD dataset
was analyzed by the Tumor IMmune Estimation Resource to determine
the correlations between FCGBP expression levels and the extent of
immune cell infiltration, including tumor purity, B cells,
CD8+ T cells, CD4+ T cells, macrophages,
neutrophils and dendritic cells. COAD, colon adenocarcinoma; FCGBP,
Fc fragment of IgG-binding protein; cor, correlation; TPM,
transcripts per million. |
Correlation between FCGBP expression
and immune cell markers in CRC
The present study further explored the potential
relationship between FCGBP expression and infiltrating
immune cells in the COAD dataset. Specific immune cell markers for
CD8+ T and all T cells, B cells, TAMs, M1 and M2
macrophages, neutrophils, natural killer cells, DCs, Th1, Th2, Tfh
and Th17 cells, Tregs and exhausted T cells in CRC were analyzed
using TIMER. As presented in Table
III, following adjustment for tumor purity, FCGBP
expression levels were significantly correlated with 51 of the 57
immune cell markers in CRC. Notably, FCGBP expression levels
were correlated with multiple markers of specific functional T
cells, including the CD8+ T cell marker CD8A, all
markers of all T cells (CD3D, CD3E and CD2), all markers of Th1
(TBX21, STAT4, STAT1, IFNG and TNF), a number of markers of Th2
(GATA3, STAT6, STAT6 and STAT5A), all markers of Tfh (BCL6 and
IL21), Th17 marker STAT3, all markers of Tregs (FOXP3, CCR8, STAT5B
and TGFB1) and all markers of exhausted T cells (PDCD1, CTLA4,
LAG3, HAVCR2 and GZMB) (all P<0.05). In addition, significant
correlation was identified between FCGBP expression levels
and a number of cell type-specific markers, including those for
TAMs (CD68 and IL10), M1 (NOS2, IRF5 and PTGS2) and M2 (CD163 and
VSIG4) macrophages, suggesting that FCGBP may regulate macrophage
polarization in CRC.
| Table III.Correlation analysis between FCGBP
expression and associated immune cell markers using TIMER. |
Table III.
Correlation analysis between FCGBP
expression and associated immune cell markers using TIMER.
|
| No adjustment | Adjusted by tumor
purity |
|---|
|
|
|
|
|---|
| Variables | r-value | P-value | r-value | P-value |
|---|
| CD8+ T
cell |
|
|
|
|
|
CD8A | −0.021 | 0.492 | −0.114 |
3.25×10⁻⁴a |
|
CD8B |
0.035 | 0.248 | −0.046 | 0.146 |
| T cell
(general) |
|
|
|
|
|
CD3D |
0.008 | 0.786 | −0.098 | 0.002a |
|
CD3E |
0.001 | 0.966 | −0.11 |
5.04×10⁻⁴a |
|
CD2 | −0.015 | 0.615 | −0.122 |
1.10×10⁻⁴a |
| B cell |
|
|
|
|
|
CD19 |
0.007 | 0.007 | −0.085 | 0.007a |
|
CD79A | −0.02 | −0.02 | −0.132 |
2.98×10⁻⁵a |
|
CD86 |
0.163 | 0.163 | 0.113 |
3.42×10⁻⁴a |
|
CSF1R |
0.484 |
8.55×10−66 | 0.462 |
1.06×10−53a |
| Tumor-associated
macrophage |
|
|
|
|
|
CCL2 |
0.045 | 0.134 | −0.027 | 0.394 |
|
CD68 |
0.117 |
9.67×10⁻⁵ | 0.072 | 0.023a |
|
IL10 | −0.005 | 0.881 | −0.068 | 0.033a |
| M1 macrophage |
|
|
|
|
|
NOS2 |
0.121 |
5.48×10⁻⁵ | 0.113 |
3.40×10⁻⁴a |
|
IRF5 | 0.11 |
2.45×10⁻⁴ | 0.076 | 0.017a |
|
PTGS2 |
0.141 |
2.72×10⁻⁶ | 0.077 | 0.015a |
| M2 macrophage |
|
|
|
|
|
CD163 |
0.121 |
5.58×10⁻⁵ | 0.069 | 0.030a |
|
VSIG4 | 0.3 |
2.35×10⁻²⁴ | 0.266 |
1.48×10⁻¹⁷a |
|
MS4A4A |
0.024 | 0.421 | −0.044 | 0.162 |
| Neutrophil |
|
|
|
|
|
CEACAM8 |
0.045 | 0.136 | 0.034 | 0.285 |
|
ITGAM |
0.309 |
9.46×10⁻²⁶ | 0.267 |
1.04×10⁻¹⁷a |
|
CCR7 | −0.004 | 0.885 | −0.114 |
3.03×10⁻⁴a |
| Natural killer
cell |
|
|
|
|
|
KIR2DL1 | −0.019 | 0.552 | −0.078 | 0.014a |
|
KIR2DL3 | −0.085 | 0.005 | −0.133 |
2.78×10⁻⁵a |
|
KIR2DL4 | −0.137 |
5.52×10⁻⁶ | −0.199 |
2.71×10⁻¹⁰a |
|
KIR3DL1 | −0.017 | 0.563 | −0.068 | 0.031a |
|
KIR3DL2 | −0.036 | 0.227 | −0.113 |
3.65×10⁻⁴a |
|
KIR3DL3 | −0.022 | 0.459 | −0.068 | 0.033a |
|
KIR2DS4 | −0.053 | 0.082 | −0.086 | 0.006a |
| Dendritic cell |
|
|
|
|
|
HLA-DPB1 |
0.294 |
1.42×10⁻²³ | 0.247 |
2.82×10⁻¹⁵a |
|
HLA-DQB1 |
0.207 |
5.02×10⁻¹² | 0.136 |
1.79×10⁻⁵a |
|
HLA-DRA |
0.214 |
7.76×10⁻¹³ | 0.154 |
1.11×10⁻⁶a |
|
HLA-DPA1 |
0.243 |
4.18×10⁻¹⁶ | 0.187 |
2.02×10⁻⁹a |
|
CD1C |
0.328 |
4.84×10⁻²⁹ | 0.289 |
1.49×10⁻²⁰a |
|
NRP1 |
0.185 |
5.86×10⁻¹⁰ | 0.128 |
5.19×10⁻⁵a |
|
ITGAX |
0.224 |
4.97×10⁻¹⁴ | 0.176 |
2.49×10⁻⁸a |
| T-helper 1
cell |
|
|
|
|
|
TBX21 | −0.001 | 0.965 | −0.102 | 0.001a |
|
STAT4 |
0.031 | 0.304 | −0.067 | 0.035a |
|
STAT1 | −0.122 |
4.87×10⁻⁵ | −0.172 |
5.24×10⁻⁸a |
|
IFNG | −0.086 | 0.004 | −0.151 |
1.66×10⁻⁶a |
|
TNF |
0.191 |
1.68×10⁻¹⁰ | 0.158 |
5.63×10⁻⁷a |
| T-helper 2
cell |
|
|
|
|
|
GATA3 |
0.024 | 0.423 | 0.069 | 0.030a |
|
STAT6 |
0.251 |
3.17×10⁻¹⁷ | 0.218 |
3.33×10⁻¹²a |
|
STAT5A |
0.303 |
9.40×10⁻²⁵ | 0.258 |
1.40×10⁻¹⁶a |
|
IL-13 | −0.015 | 0.624 | −0.032 | 0.312 |
| Follicular helper T
cell |
|
|
|
|
|
BCL6 | 0.294 |
2.45×10⁻²³ | 0.283 |
1.07×10⁻¹⁹a |
|
IL21 | −0.054 | 0.073 | −0.117 |
2.20×10⁻⁴a |
| T-helper 17
cell |
|
|
|
|
|
STAT3 |
0.289 |
1.42×10⁻²² | 0.26 |
9.10×10⁻¹⁷a |
|
IL17A | −0.002 | 0.937 | −0.044 | 0.168 |
| Regulatory T
cell |
|
|
|
|
|
FOXP3 | −0.059 | 0.051 | −0.141 |
7.57×10⁻⁶a |
|
CCR8 | −0.09 | 0.003 | −0.142 |
7.04×10⁻⁶a |
|
STAT5B |
0.239 |
1.04×10⁻¹⁴ | 0.215 |
6.91×10⁻¹²a |
|
TGFB1 |
0.288 |
1.64×10⁻²² | 0.239 |
2.05×10⁻¹⁴a |
| T cell
exhaustion |
|
|
|
|
|
PDCD1 | −0.016 | 0.590 | −0.112 |
3.98×10⁻⁴a |
|
CTLA4 | −0.077 | 0.011 | −0.161 |
3.17×10⁻⁷a |
|
LAG3 | −0.103 |
6.32×10⁻⁴ | −0.151 |
1.61×10⁻⁶a |
|
HAVCR2 |
0.189 |
2.61×10⁻¹⁰ | 0.147 |
3.35×10⁻⁶a |
|
GZMB | −0.122 |
4.87×10⁻⁵ | −0.222 |
1.54×10⁻¹²a |
Consistent with the observed correlation between
FCGBP expression levels and the extent of DC infiltration in
the COAD dataset, all DC markers, including HLA-DPB1, HLA-DQB1,
HLA-DRA, HLA-DPA1, CD1C, NRP1 and ITGAX, were also significantly
correlated with FCGBP expression levels. These results
further confirmed the association between FCGBP and DC
infiltration. Similarly, the correlation between FCGBP levels and B
cells in CRC was also observed based on B cell markers, including
CD19, CD79A, CD86 and CSF1R. In addition, correlations were
identified between FCGBP levels and markers of neutrophils (ITGAM
and CCR7) or natural killer cells (KIR2DL1, KIR2DL3, KIR2DL4,
KIR3DL1, KIR3DL2, KIR3DL3 and KIR2DS4). Therefore, these results
demonstrated that FCGBP was significantly correlated with
infiltrating immune cells in CRC, suggesting a potential role for
FCGBP in immune infiltration in the CRC microenvironment.
Discussion
Studies of the underlying mechanisms of CRC
pathogenesis are urgently needed to provide potential diagnostic
and prognostic biomarkers, as well as therapeutic targets for CRC.
The present study identified that CRC tissues exhibited low
expression levels of FCGBP, which has been reported in various
types of cancer, but its potential diagnostic, prognostic and
immunological roles in CRC remain to be further explored.
Therefore, the aim of current was to determine the potential roles
of FCGBP in CRC. The current study provided evidence supporting the
clinical relevance of FCGBP in CRC. Analytical approaches based on
microarrays, online databases and TMA immunohistochemistry revealed
a significant decrease in FCGBP expression at the mRNA and protein
levels in CRC tissues compared with those in noncancerous
colorectal tissues, with 10.5% mutation frequency in the
FCGBP coding sequence in CRC tissues. Furthermore, the
protein expression levels of FCGBP were significantly decreased in
colorectal adenoma and primary CRC tissues compared with those in
normal colon tissues. In addition, low FCGBP expression
levels, which were observed in advanced-stage CRC tissues, were
significantly associated with a short survival time in patients
with CRC. Notably, the results of the present study revealed that
FCGBP expression levels were positively correlated with the
levels of infiltrating B cells, macrophages and DCs, and negatively
correlated with tumor purity in COAD. These results provided
insights into the potential role of FCGBP in tumor immunology and
suggested its potential use as a CRC biomarker as well as a
therapeutic target.
Due to the relatively high percentage of patients
with CRC and distant metastasis at the time of initial diagnosis
(3), identification of novel and
effective biomarkers for early diagnosis may contribute to the
improvement of early screening for CRC. Omics technologies provide
powerful methods to identify potential biomarkers for early
diagnosis (53). Using microarray
and online database analyses, the present study identified
mutations and lower expression levels of FCGBP in CRC tissues
compared with those in noncancerous colorectal tissues, which was
consistent with previous studies on various malignancies, including
CRC (12–18,20,24–26).
However, other data analysis approaches, including analysis of the
original raw data using R or Python software, may provide
additional information and will be used in our future studies.
Using immunohistochemistry-based TMA analysis, the
present study validated the decreased protein levels of FCGBP in
CRC tissues compared with those in proximal or distal adjacent
noncancerous colorectal tissues and normal colorectal tissues.
Further analysis of the protein levels of FCGBP among normal
colorectal, adenomatous and carcinomatous tissues confirmed the
findings of a previous study in mice (23) by demonstrating that the levels of
FCGBP were decreased in colorectal adenoma and CRC compared with
those in normal colon tissues. These results suggested that the
reduction in FCGBP levels may be a common event during CRC
development, and that FCGBP may be considered as a potential
biomarker for the early diagnosis of CRC. However, in the current
study, no differences were identified in the protein expression of
FCGBP between colorectal adenoma and CRC samples, which may be due
to the limitations of IHC or the limited number of samples. Our
future study will collect a larger number of samples to detect
FCGBP expression levels.
The present study further assessed the associations
between the protein levels of FCGBP and the clinicopathological
characteristics of patients with CRC. Notably, the protein levels
of FCGBP were lower in advanced-stage CRC samples compared with
those in early-stage CRC, which was consistent with the results of
the GEPIA analysis of FCGBP mRNA levels. Pairwise comparisons among
different stages were not available on the GEPIA website, which was
a limitation of the current study. However, these data indicated an
association between low FCGBP expression levels and an advanced
stage in CRC. Consistent with previous analyses of online databases
(27,28), the results of the present study
demonstrated that low FCGBP expression levels in CRC tissues were
significantly associated with a short patient survival time,
highlighting the potential role of FCGBP as a prognostic biomarker
for CRC. However, due to the lack of survival information of
patients with CRC included with the TMAs, the association between
the protein expression levels of FCGBP and patient survival could
not be validated in the present study. Patient samples and survival
information will be collected to verify the results of the database
analyses in our future studies. In addition, the aforementioned
studies (27,28) and the current study have suggested
that the decrease of FCGBP expression levels in tumors function as
a promoting factor rather than being a concomitant phenomenon.
Therefore, the unexplored biological function and underlying
mechanism of the effects of FCGBP in CRC is a limitation of the
current study, which should be further addressed in future
studies.
FCGBP is secreted by various cell types, including
intestinal goblet cells, and is considered to be an important
component of mucosal immunological defenses (7). To analyze the roles of FCGBP in
colorectal tumor immunology, the present study analyzed the
correlation of FCGBP expression levels with the relative
abundance of infiltrating immune cells, including B cells,
CD4+ and CD8+ T cells, neutrophils,
macrophages and DCs, via gene modules. The results of the
systematic analysis of immune infiltrates in CRC using the TIMER
database demonstrated that FCGBP expression levels were
positively correlated with the infiltration levels of B cells,
macrophages and DCs and negatively correlated with tumor purity;
however, FCGBP expression levels were not correlated with
CD4+ and CD8+ T cells or neutrophils in COAD.
Collectively, these results suggested that FCGBP may serve an
essential role in the regulation of infiltrating immune cells in
COAD. Consistently, the results of the present study identified a
significant correlation between FCGBP expression levels and
multiple immune markers expressed in all tested infiltrating immune
cell types in CRC. These results suggested a crucial role of FCGBP
in immune cell infiltration into the CRC microenvironment. Although
no significant correlations were identified between FCGBP levels
and the relative abundance of CD4+ and CD8+ T
cells or neutrophils in COAD, the results revealed correlations
between FCBGP expression levels and the makers expressed by
CD8+ T cells and neutrophils. Therefore, the
correlations of FCGBP expression levels with immune cell
infiltration levels and the expression of immune markers should be
further addressed, and the biological function of FCGBP in the
regulation of immune cell infiltration warrants further
investigation.
In summary, in the present study, microarray and
online database analyses were used to demonstrate that FCGBP
expression levels were downregulated in colorectal adenoma and CRC,
including advanced-stage CRC, compared with those in normal
colorectal tissues from healthy subjects or paired adjacent
noncancerous colorectal tissues, and that CRC tissue specimens
harbored FCGBP mutations. In addition, low FCGBP
expression levels were associated with a short survival time in
patients with CRC. FCGBP expression levels were positively
correlated with various tumor-infiltrating immune cells and immune
markers, suggesting that FCGBP may be involved in the regulation of
immune cell infiltration into the CRC microenvironment. Overall,
these results suggested that FCGBP may be a potential biomarker for
the early diagnosis and prognosis of CRC. The precise role of FCGBP
in immune cell infiltration requires further study.
Acknowledgements
Not applicable.
Funding
This study was supported by the National Natural
Science Foundation of China (grant nos. 81673721 and 81803882) and
the International Cooperative Project of Fujian Department of
Science and Technology (grant no. 2017I0007).
Availability of data and materials
The datasets used and/or analyzed during the current
study are available from the corresponding author on reasonable
request.
Authors' contributions
JP and QC conceived and designed the experiments.
QZ, AS, MW, YC and LL conducted the bioinformatics analyses. AS,
LL, XC, QZ and XL conducted the validation experiments. ZS, XW, JL
and WL conducted data analysis. YH, HL and QZ conducted
immunohistochemistry analysis and produced the figures. LL and MW
confirm the authenticity of all the raw data. AS, QZ, QC and JP
wrote and revised the manuscript. All authors read and approved the
final manuscript.
Ethics approval and consent to
participate
The experiments were approved by the Ethics
Committee of Fujian University of Traditional Chinese Medicine.
Patient consent for publication
Not applicable.
Competing interests
The authors declare that they have no competing
interests.
References
|
1
|
Sung H, Ferlay J, Siegel RL, Laversanne M,
Soerjomataram I, Jemal A and Bray F: Global cancer statistics 2020:
GLOBOCAN estimates of incidence and mortality worldwide for 36
cancers in 185 countries. CA Cancer J Clin. 71:209–249. 2021.
View Article : Google Scholar : PubMed/NCBI
|
|
2
|
Chen W, Zheng R, Baade PD, Zhang S, Zeng
H, Bray F, Jemal A, Yu XQ and He J: Cancer statistics in China,
2015. CA Cancer J Clin. 66:115–132. 2016. View Article : Google Scholar : PubMed/NCBI
|
|
3
|
Wang X and Li T: Development of a 15-gene
signature for predicting prognosis in advanced colorectal cancer.
Bioengineered. 11:165–174. 2020. View Article : Google Scholar : PubMed/NCBI
|
|
4
|
Poturnajova M, Furielova T, Balintova S,
Schmidtova S, Kucerova L and Matuskova M: Molecular features and
gene expression signature of metastatic colorectal cancer (Review).
Oncol Rep. 45:102021. View Article : Google Scholar : PubMed/NCBI
|
|
5
|
Siraj S, Masoodi T, Siraj AK, Azam S,
Qadri Z, Ahmed SO, AlBalawy WN, Al-Obaisi KA, Parvathareddy SK,
AlManea HM, et al: Clonal evolution and timing of metastatic
colorectal cancer. Cancers (Basel). 12:29382020. View Article : Google Scholar : PubMed/NCBI
|
|
6
|
Shen A, Chen Y, Liu L, Huang Y, Chen H, Qi
F, Lin J, Shen Z, Wu X, Wu M, et al: EBF1-mediated upregulation of
ribosome assembly factor PNO1 contributes to cancer progression by
negatively regulating the p53 signaling pathway. Cancer Res.
79:2257–2270. 2019. View Article : Google Scholar : PubMed/NCBI
|
|
7
|
Kobayashi K, Ogata H, Morikawa M, Iijima
S, Harada N, Yoshida T, Brown WR, Inoue N, Hamada Y, Ishii H, et
al: Distribution and partial characterisation of IgG Fc binding
protein in various mucin producing cells and body fluids. Gut.
51:169–176. 2002. View Article : Google Scholar : PubMed/NCBI
|
|
8
|
Stamp LA, Braxton DR, Wu J, Akopian V,
Hasegawa K, Chandrasoma PT, Hawes SM, McLean C, Petrovic LM, Wang
K, et al: The GCTM-5 epitope associated with the mucin-like
glycoprotein FCGBP marks progenitor cells in tissues of endodermal
origin. Stem Cells. 30:1999–2009. 2012. View Article : Google Scholar : PubMed/NCBI
|
|
9
|
Harada N, Iijima S, Kobayashi K, Yoshida
T, Brown WR, Hibi T, Oshima A and Morikawa M: Human IgGFc binding
protein (FcgammaBP) in colonic epithelial cells exhibits mucin-like
structure. J Biol Chem. 272:15232–15241. 1997. View Article : Google Scholar : PubMed/NCBI
|
|
10
|
Selbach M and Mann M: Protein interaction
screening by quantitative immunoprecipitation combined with
knockdown (QUICK). Nat Methods. 3:981–983. 2006. View Article : Google Scholar : PubMed/NCBI
|
|
11
|
Wang A, Wu L, Lin J, Han L, Bian J, Wu Y,
Robson SC, Xue L, Ge Y, Sang X, et al: Whole-exome sequencing
reveals the origin and evolution of hepato-cholangiocarcinoma. Nat
Commun. 9:8942018. View Article : Google Scholar : PubMed/NCBI
|
|
12
|
Zhou C, Chen H, Han L, Xue F, Wang A and
Liang YJ: Screening of genes related to lung cancer caused by
smoking with RNA-Seq. Eur Rev Med Pharmacol Sci. 18:117–125.
2014.PubMed/NCBI
|
|
13
|
Xiong L, Wen Y, Miao X and Yang Z: NT5E
and FcGBP as key regulators of TGF-1-induced epithelial-mesenchymal
transition (EMT) are associated with tumor progression and survival
of patients with gallbladder cancer. Cell Tissue Res. 355:365–374.
2014. View Article : Google Scholar : PubMed/NCBI
|
|
14
|
Gazi MH, He M, Cheville JC and Young CY:
Downregulation of IgG Fc binding protein (Fc gammaBP) in prostate
cancer. Cancer Biol Ther. 7:70–75. 2008. View Article : Google Scholar : PubMed/NCBI
|
|
15
|
O'Donovan N, Fischer A, Abdo EM, Simon F,
Peter HJ, Gerber H, Buergi U and Marti U: Differential expression
of IgG Fc binding protein (FcgammaBP) in human normal thyroid
tissue, thyroid adenomas and thyroid carcinomas. J Endocrinol.
174:517–524. 2002. View Article : Google Scholar
|
|
16
|
Choi CH, Choi JJ, Park YA, Lee YY, Song
SY, Sung CO, Song T, Kim MK, Kim TJ, Lee JW, et al: Identification
of differentially expressed genes according to chemosensitivity in
advanced ovarian serous adenocarcinomas: Expression of GRIA2
predicts better survival. Br J Cancer. 107:91–99. 2012. View Article : Google Scholar : PubMed/NCBI
|
|
17
|
Wang Y, Liu Y, Liu H, Zhang Q, Song H,
Tang J, Fu J and Wang X: FcGBP was upregulated by HPV infection and
correlated to longer survival time of HNSCC patients. Oncotarget.
8:86503–86514. 2017. View Article : Google Scholar : PubMed/NCBI
|
|
18
|
Witzmann FA, Arnold RJ, Bai F, Hrncirova
P, Kimpel MW, Mechref YS, McBride WJ, Novotny MV, Pedrick NM,
Ringham HN, et al: A proteomic survey of rat cerebral cortical
synaptosomes. Proteomics. 5:2177–2201. 2005. View Article : Google Scholar : PubMed/NCBI
|
|
19
|
Grant SG: The synapse proteome and
phosphoproteome: a new paradigm for synapse biology. Biochem Soc
Trans. 34((Pt 1)): 59–63. 2006. View Article : Google Scholar : PubMed/NCBI
|
|
20
|
Dong S, Huo H, Mao Y, Li X and Dong L: A
risk score model for the prediction of osteosarcoma metastasis.
FEBS Open Bio. 9:519–526. 2019. View Article : Google Scholar : PubMed/NCBI
|
|
21
|
Kim M, Lee S, Yang SK, Song K and Lee I:
Differential expression in histologically normal crypts of
ulcerative colitis suggests primary crypt disorder. Oncol Rep.
16:663–670. 2006.PubMed/NCBI
|
|
22
|
Risques RA, Lai LA, Himmetoglu C, Ebaee A,
Li L, Feng Z, Bronner MP, Al-Lahham B, Kowdley KV, Lindor KD, et
al: Ulcerative colitis-associated colorectal cancer arises in a
field of short telomeres, senescence, and inflammation. Cancer Res.
71:1669–1679. 2011. View Article : Google Scholar : PubMed/NCBI
|
|
23
|
Lee S, Bang S, Song K and Lee I:
Differential expression in normal-adenoma-carcinoma sequence
suggests complex molecular carcinogenesis in colon. Oncol Rep.
16:747–754. 2006.PubMed/NCBI
|
|
24
|
Zhu H, Wu TC, Chen WQ, Zhou LJ, Wu Y, Zeng
L and Pei HP: Screening for differentially expressed genes between
left- and right-sided colon carcinoma by microarray analysis. Oncol
Lett. 6:353–358. 2013. View Article : Google Scholar : PubMed/NCBI
|
|
25
|
Yang W, Shi J, Zhou Y, Liu T, Zhan F,
Zhang K and Liu N: Integrating proteomics and transcriptomics for
the identification of potential targets in early colorectal cancer.
Int J Oncol. 55:439–450. 2019.PubMed/NCBI
|
|
26
|
Zhang GL, Pan LL, Huang T and Wang JH: The
transcriptome difference between colorectal tumor and normal
tissues revealed by single-cell sequencing. J Cancer. 10:5883–5890.
2019. View Article : Google Scholar : PubMed/NCBI
|
|
27
|
Ma R, Jing C, Zhang Y, Cao H, Liu S, Wang
Z, Chen D, Zhang J, Wu Y, Wu J, et al: The somatic mutation
landscape of Chinese Colorectal Cancer. J Cancer. 11:1038–1046.
2020. View Article : Google Scholar : PubMed/NCBI
|
|
28
|
Qi C, Hong L, Cheng Z and Yin Q:
Identification of metastasis-associated genes in colorectal cancer
using metaDE and survival analysis. Oncol Lett. 11:568–574. 2016.
View Article : Google Scholar : PubMed/NCBI
|
|
29
|
Bendas G and Borsig L: Cancer cell
adhesion and metastasis: selectins, integrins, and the inhibitory
potential of heparins. Int J Cell Biol. 2012:6767312012. View Article : Google Scholar : PubMed/NCBI
|
|
30
|
Onstenk W, Sieuwerts AM, Mostert B,
Lalmahomed Z, Bolt-de Vries JB, van Galen A, Smid M, Kraan J, Van
M, de Weerd V, et al: Molecular characteristics of circulating
tumor cells resemble the liver metastasis more closely than the
primary tumor in metastatic colorectal cancer. Oncotarget.
7:59058–59069. 2016. View Article : Google Scholar : PubMed/NCBI
|
|
31
|
Znalesniak EB, Fu T, Salm F, Händel U and
Hoffmann W: Transcriptional responses in the murine spleen after
toxoplasma gondii infection: inflammasome and mucus-associated
genes. Int J Mol Sci. 18:12452017. View Article : Google Scholar : PubMed/NCBI
|
|
32
|
Pelaseyed T, Bergström JH, Gustafsson JK,
Ermund A, Birchenough GM, Schütte A, van der Post S, Svensson F,
Rodríguez-Piñeiro AM, Nyström EE, et al: The mucus and mucins of
the goblet cells and enterocytes provide the first defense line of
the gastrointestinal tract and interact with the immune system.
Immunol Rev. 260:8–20. 2014. View Article : Google Scholar : PubMed/NCBI
|
|
33
|
Lei X, Lei Y, Li JK, Du WX, Li RG, Yang J,
Li J, Li F and Tan HB: Immune cells within the tumor
microenvironment: Biological functions and roles in cancer
immunotherapy. Cancer Lett. 470:126–133. 2020. View Article : Google Scholar : PubMed/NCBI
|
|
34
|
Picard E, Verschoor CP, Ma GW and Pawelec
G: Relationships between immune landscapes, genetic subtypes and
responses to immunotherapy in colorectal cancer. Front Immunol.
11:3692020. View Article : Google Scholar : PubMed/NCBI
|
|
35
|
Woolston A, Khan K, Spain G, Barber LJ,
Griffiths B, Gonzalez-Exposito R, Hornsteiner L, Punta M, Patil Y,
Newey A, et al: Genomic and transcriptomic determinants of therapy
resistance and immune landscape evolution during anti-egfr
treatment in colorectal cancer. Cancer Cell. 36:35–50.e9. 2019.
View Article : Google Scholar : PubMed/NCBI
|
|
36
|
Chen J, Zeng Z, Huang L, Luo S, Dong J,
Zhou FH, Zhou K, Wang L and Kang L: Photothermal therapy technology
of metastatic colorectal cancer. Am J Transl Res. 12:3089–3115.
2020.PubMed/NCBI
|
|
37
|
Tang Z, Li C, Kang B, Gao G, Li C and
Zhang Z: GEPIA: a web server for cancer and normal gene expression
profiling and interactive analyses. Nucleic Acids Res. 45((W1)):
W98–W102. 2017. View Article : Google Scholar : PubMed/NCBI
|
|
38
|
Rhodes DR, Kalyana-Sundaram S, Mahavisno
V, Varambally R, Yu J, Briggs BB, Barrette TR, Anstet MJ,
Kincead-Beal C, Kulkarni P, et al: Oncomine 3.0: Genes, pathways,
and networks in a collection of 18,000 cancer gene expression
profiles. Neoplasia. 9:166–180. 2007. View Article : Google Scholar : PubMed/NCBI
|
|
39
|
Kaiser S, Park YK, Franklin JL, Halberg
RB, Yu M, Jessen WJ, Freudenberg J, Chen X, Haigis K, Jegga AG, et
al: Transcriptional recapitulation and subversion of embryonic
colon development by mouse colon tumor models and human colon
cancer. Genome Biol. 8:R1312007. View Article : Google Scholar : PubMed/NCBI
|
|
40
|
Skrzypczak M, Goryca K, Rubel T, Paziewska
A, Mikula M, Jarosz D, Pachlewski J, Oledzki J and Ostrowski J:
Modeling oncogenic signaling in colon tumors by multidirectional
analyses of microarray data directed for maximization of analytical
reliability. PLoS One. 5:e130912010. View Article : Google Scholar : PubMed/NCBI
|
|
41
|
Notterman DA, Alon U, Sierk AJ and Levine
AJ: Transcriptional gene expression profiles of colorectal adenoma,
adenocarcinoma, and normal tissue examined by oligonucleotide
arrays. Cancer Res. 61:3124–3130. 2001.PubMed/NCBI
|
|
42
|
Hong Y, Downey T, Eu KW, Koh PK and Cheah
PY: A ‘metastasis-prone’ signature for early-stage mismatch-repair
proficient sporadic colorectal cancer patients and its implications
for possible therapeutics. Clin Exp Metastasis. 27:83–90. 2010.
View Article : Google Scholar : PubMed/NCBI
|
|
43
|
Gaedcke J, Grade M, Jung K, Camps J, Jo P,
Emons G, Gehoff A, Sax U, Schirmer M, Becker H, et al: Mutated KRAS
results in overexpression of DUSP4, a MAP-kinase phosphatase, and
SMYD3, a histone methyltransferase, in rectal carcinomas. Genes
Chromosomes Cancer. 49:1024–1034. 2010. View Article : Google Scholar : PubMed/NCBI
|
|
44
|
Chatterjee A, Ahn A, Rodger EJ, Stockwell
PA and Eccles MR: A guide for designing and analyzing RNA-Seq data.
Methods Mol Biol. 1783:35–80. 2018. View Article : Google Scholar : PubMed/NCBI
|
|
45
|
Li T, Fan J, Wang B, Traugh N, Chen Q, Liu
JS, Li B and Liu XS: TIMER: A Web Server for Comprehensive Analysis
of Tumor-Infiltrating Immune Cells. Cancer Res. 77:e108–e110. 2017.
View Article : Google Scholar : PubMed/NCBI
|
|
46
|
Li B, Severson E, Pignon JC, Zhao H, Li T,
Novak J, Jiang P, Shen H, Aster JC, Rodig S, et al: Comprehensive
analyses of tumor immunity: Implications for cancer immunotherapy.
Genome Biol. 17:1742016. View Article : Google Scholar : PubMed/NCBI
|
|
47
|
Aran D, Sirota M and Butte AJ: Systematic
pan-cancer analysis of tumour purity. Nat Commun. 6:89712015.
View Article : Google Scholar : PubMed/NCBI
|
|
48
|
Siemers NO, Holloway JL, Chang H, Chasalow
SD, Ross-MacDonald PB, Voliva CF and Szustakowski JD: Genome-wide
association analysis identifies genetic correlates of immune
infiltrates in solid tumors. PLoS One. 12:e01797262017. View Article : Google Scholar : PubMed/NCBI
|
|
49
|
Danaher P, Warren S, Dennis L, D'Amico L,
White A, Disis ML, Geller MA, Odunsi K, Beechem J and Fling SP:
Gene expression markers of tumor infiltrating leukocytes. J
Immunother Cancer. 5:182017. View Article : Google Scholar : PubMed/NCBI
|
|
50
|
Sousa S and Määttä J: The role of
tumour-associated macrophages in bone metastasis. J Bone Oncol.
5:135–138. 2016. View Article : Google Scholar : PubMed/NCBI
|
|
51
|
Siskova A, Cervena K, Kral J, Hucl T,
Vodicka P and Vymetalkova V: Colorectal adenomas-genetics and
searching for new molecular screening biomarkers. Int J Mol Sci.
21:32602020. View Article : Google Scholar : PubMed/NCBI
|
|
52
|
Idos GE, Kwok J, Bonthala N, Kysh L,
Gruber SB and Qu C: The Prognostic implications of tumor
infiltrating lymphocytes in colorectal cancer: a systematic review
and meta-analysis. Sci Rep. 10:33602020. View Article : Google Scholar : PubMed/NCBI
|
|
53
|
Dalal N, Jalandra R, Sharma M, Prakash H,
Makharia GK, Solanki PR, Singh R and Kumar A: Omics technologies
for improved diagnosis and treatment of colorectal cancer:
Technical advancement and major perspectives. Biomed Pharmacother.
131:1106482020. View Article : Google Scholar : PubMed/NCBI
|