Introduction
Colorectal cancer (CRC) is the second most frequent
cancer in women and third most common in men worldwide (1) with more >1.9 million new cases
reported in 2020 (2). CRC mortality
rates are higher in developed countries and it was ranked second
globally in the mortality ratings with >935,000 deaths caused by
it in 2020 (2). CRC is usually
diagnosed in later stages (regional or distant) which complicates
the treatment and results in worse outcomes for patients (3).
Pancreatic ductal adenocarcinoma (PDAC) has a lower
global incidence rate >495,000 compared with CRC (2), but with >466,000 deaths in 2020
worldwide (2) and the projected
dramatic increase in incidence in the USA by 2030 (4), it remains one of the deadliest cancers.
Late diagnosis, due to delayed manifestation of symptoms and
generally very poor long-term response to systemic chemotherapy
have complicated the treatment and resulted in worse outcomes for
patients, hence these are now subject to state-of-the-art studies
in the precision medicine field (5).
Hence, the search for new diagnostic, prognostic and predictive
biomarkers which will facilitate treatment at less advanced stages
when outcomes are more favorable is necessary (6).
Cytokinesis is a key event that occurs at the end of
cell division and is important for successful tissue proliferation
(7). One of its essential components
is the constitution of a central mitotic spindle in which protein
regulating cytokinesis 1 (PRC1), kinesin family member 14 (KIF14)
and citron Rho-interacting serine/threonine kinase (CIT) proteins
serve an important role (8).
Mutations, defects and overall failures in cytokinesis may
influence tumorigenesis in multiple tissues, e.g., breast, gut,
lung, pancreas and ovary (9).
One of the most important components of cell
division is PRC1, a substrate of several cyclin-dependent kinases,
e.g., CDK1, CDK2 and CDK6, which helps to regulate their levels
during the cell cycle (10). During
interphase, PRC1 localizes almost exclusively to the cell nucleus
(10), but when mitosis commences it
redistributes and binds to microtubules maintaining the spindle
midzone in early stages and to the midbody during cell cleavage
(11). Reduction of PRC1 activity in
cells prevents completion of cellular cleavage, but not nuclear
division (11).
Multiple proteins of the kinesin-motor family depend
on PRC1 and amongst others, KIF14, is one of them (12–14).
KIF14 is a member of the kinesin-3 subfamily which exists in the
cell as a dimer (15) and has ATPase
activity (16). KIF14 localizes to
the cytoplasm during interphase, but after the start of mitosis it
accumulates at spindle poles (17).
Later in anaphase, KIF14 becomes concentrated at the spindle
midzone and midbody (17). Cells
with depleted KIF14 fail to complete cytokinesis (17). KIF14 interacts with both PRC1 and the
RhoA kinase regulator CIT (18,19). CIT
is necessary for localization of KIF14 and important for cell
division (7) and orientation of the
mitotic spindle during metaphase (20).
It has been already reported in our earlier studies
that expression levels of PRC1, KIF14 and CIT are
significantly elevated in tumor tissues, such as breast (21) and ovarian (22) carcinomas. In addition, patients with
breast cancer with high PRC1 expression level in tumors had
significantly worse disease-free survival time compared with the
rest of patients (21), and low
CIT level was associated with worse time to progression in
patients with ovarian cancer (22).
In fact, the prognostic role of these regulators of cytokinesis was
recently suggested by others in hepatocellular, prostate and
bladder cancer (23–25).
The present study aimed to assess the prognostic
relevance of the cytokinesis regulators in PRC1, KIF14 and
CIT in patients with CRC and PDAC. PRC1, KIF14 and
CIT were selected based on previous functional evidence and
putative prognostic roles reported in other carcinomas (21–25).
Materials and methods
Experimental subjects
Tissue samples of primary tumors of human colorectal
carcinoma and paired distant unaffected mucosa, where possible at
least 20 cm from the primary tumor site, were collected from 67
patients (age range, 39–79 years old) with CRC diagnosed and
treated at the Department of Surgery, Teaching Hospital in Pilsen
(Pilsen, Czech Republic) during the period February 2008-August
2010 as described before (26). The
following inclusion criteria were applied to the recruitment of
patients into the study: i) Patients who were subject to surgery
for CRC; ii) no prior chemotherapy before surgery (in order to
eliminate its influence on transcript levels); iii) patients who
received only first-line chemotherapy in either a palliative or
adjuvant setting; and iv) patients who received adjuvant regimens
based on 5-fluorouracil, leucovorin (de Gramont or FUFA), ftorafur,
capecitabine and/or oxaliplatin (FOLFOX) or palliative chemotherapy
based on FOLFOX regimen in combination with or without Avastin (n=3
untreated). Native tissue samples were taken during resection
surgery, macrodissected, snap-frozen in liquid nitrogen and stored
at −80°C until total RNA isolation. The control mucosa samples were
taken from the macroscopically unaffected resection margins of
colon tissues. The resection margins were microscopically evaluated
and only samples free of malignant cells were further analyzed.
Corresponding tumor tissue samples were verified by an independent
experienced pathologist (Teaching Hospital in Pilsen, Pilsen, Czech
Republic). Only histologically-verified samples were included in
this study. The following data on patients were retrieved from
medical records during regular hospital-based follow-up: Age, sex,
date of diagnosis, tumor localization, pathological tumor node
metastasis (TNM stage) according to The Union for International
Cancer Control (UICC) 6th Edition (27), histological type and grade of the
tumor, adjuvant (group A) or first line of palliative (group B)
chemotherapy, treatment response in group B patients and
disease-free interval (DFI) and overall survival time (OS) in all
patients (Table I). Patients were
followed by imaging techniques and assessment of circulating tumor
markers (CEA and CA 19-9) every 3 months during the first two years
after adjuvant chemotherapy and then every 6 months for the next 3
years. Response to the treatment was evaluated by the Response
Evaluation Criteria In Solid Tumors (RECIST) criteria version 1.0
(28) based on routinely used
imaging techniques (by computer tomography, with or without
positron emission tomography, magnetic resonance or
ultrasonography) for assessment of tumor mass. Response to the
treatment was defined as a decrease of the number or volume of
metastases or stabilization of the disease. In patients treated
with adjuvant therapy after radical surgical resection R0 (group
A), DFI served as the treatment outcome for analyses. DFI was
defined as the time elapsed between radical surgical R0 resection
and disease recurrence.
 | Table I.Clinical characteristics of patients
with CRC (n=67). |
Table I.
Clinical characteristics of patients
with CRC (n=67).
|
Characteristics | Value |
|---|
| Age at diagnosis
mean ± SD, years | 63.6±8.8 |
| Sex, n (%) |
|
|
Female | 23
(34) |
|
Male | 44
(66) |
| Primary tumor
localization, n (%) |
|
| Colon
or sigma | 42
(73) |
| Rectum
or rectosigmoid junction | 25
(27) |
| Primary tumor size,
location and invasive |
|
| depth (pT), n
(%) |
|
|
pT2 | 5
(7) |
|
pT3 | 53
(79) |
|
pT4 | 9
(13) |
| Lymph node
metastasis (pN), n (%) |
|
|
pN0 | 22
(33) |
|
pN1 | 27
(40) |
|
pN2 | 18
(27) |
| Distant metastasis
(cM), n (%) |
|
|
cM0 | 34
(51) |
|
cM1 | 33
(49) |
| Pathological stage
(S), n (%) |
|
|
SII | 14
(21) |
|
SIII | 20
(30) |
|
SIV | 33
(49) |
| Pathological grade
(G), n (%) |
|
| G1 | 10
(15) |
| G2 | 46
(69) |
| G3 | 11
(16) |
| Response to
palliative chemotherapy in |
|
| SIV
patientsa |
|
|
Regression or
stabilization | 15
(50) |
| Stable
disease or progression | 15
(50) |
| Not
evaluated | 3
(−) |
| Adjuvant
chemotherapy in SII and SIII patients |
|
| De
Gramont or FUFA regimens | 13
(38) |
| FOLFOX
regimen | 12
(35) |
|
Capecitabine | 8
(24) |
|
Ftorafur | 1
(3) |
A cohort of 48 patients (age range, 46–80 years old)
with PDAC who underwent curative intent surgery between August 2009
and January 2012 were recruited from the Institute of Clinical and
Experimental Medicine, Prague and the University Hospital (Brno,
Czech Republic) as described before (29). The following inclusion criteria were
applied to the recruitment of patients into the study: i) Patients
who were subject to surgery for PDAC; ii) had no prior chemotherapy
before surgery (in order to eliminate its influence on transcript
levels); and iii) pathologically confirmed PDAC diagnosis. Patients
treated with preoperative chemo (radio) therapy were excluded from
the study. The resection specimens from these patients were
immediately transferred from the operating theater to the Pathology
Department, macrodissected to differentiate tumor and paired
non-neoplastic (control) tissues and then snap-frozen in liquid
nitrogen. The histologically verified samples of tumors and control
tissues were then stored at −80°C until RNA extraction.
Histological diagnosis of PDAC was performed according to the
standard classification. The clinical data including age, sex, date
of diagnosis, tumor localization, pTNM stage, the histological type
and grade of the tumor, resection margin status, lymphatic,
vascular and perineural invasion, adjuvant chemotherapy based on
gemcitabine or 5-fluorouracil (n=17 untreated) and OS were all
obtained from medical records during regular hospital-based
follow-up (Table II).
| Table II.Clinical characteristics of patients
with PDAC (n=48). |
Table II.
Clinical characteristics of patients
with PDAC (n=48).
|
Characteristics | Value |
|---|
| Age at diagnosis
mean ± SD, years | 62.6±7.5 |
| Sex, n (%) |
|
|
Female | 26
(54) |
|
Male | 22
(46) |
| Primary tumor
localization, n (%) |
|
|
Head | 40
(83) |
| Body or
tail | 8
(17) |
| Primary tumor size,
location, and invasive |
|
| depth (pT), n
(%) |
|
|
pT1 | 1
(2) |
|
pT2 | 5
(10) |
|
pT3 | 41
(86) |
|
pT4 | 1
(2) |
| Lymph node
metastasis (pN), n (%) |
|
|
pN0 | 19
(40) |
|
pN1 | 29
(60) |
| Pathological stage
(S), n (%) |
|
| SI | 3
(6) |
|
SII | 43
(90) |
|
SIII | 2
(4) |
| Pathological grade
(G), n (%) |
|
| G1 | 2
(4) |
| G2 | 29
(61) |
| G3 | 15
(31) |
| G4 | 2
(4) |
| Angioinvasion (pA),
n (%) |
|
|
pA0 | 28
(58) |
|
pA1 | 20
(42) |
| Perineural invasion
(pP), n (%) |
|
|
pP0 | 11
(23) |
|
pP1 | 37
(77) |
| Resection margins
(R), n (%) |
|
| R0 | 44
(92) |
| R1 | 4
(8) |
| Adjuvant
chemotherapy, n (%) |
|
|
None | 17
(35) |
|
Gemcitabine or 5-fluorouracil
based | 31
(65) |
Study protocol was approved by the Ethical
Commission of the Medical Faculty and Teaching Hospital in Pilsen
(Pilsen, Czech Republic) (approval no. IGA 10230-3, 2nd September
2008) and the Institutional Review Boards of the Institute of
Clinical and Experimental Medicine (Prague, Czech Republic) and the
University Hospital Brno (Brno, Czech Republic) (approval received
in the process of application of research project. no. GA CR
P304/10/0338, 4th May 2009). Written informed consent was obtained
from all individual participants included in the study.
RNA isolation and cDNA
preparation
Total RNA was isolated according to the procedure
published elsewhere (30). Briefly,
fresh frozen tumor and control tissues (~2×2×2 mm blocks) were
first homogenized by mechanical disruption using a Precellys
instrument (Bertin Technologies SAS; CNIM Group) at a speed of
6,500 rpm for 15 sec at room temperature. Total RNA was isolated
from all samples using Trizol® (Invitrogen; Thermo
Fisher Scientific Inc.) according to the manufacturer's
instructions and stored in 20 µl aliquots at −80°C. The RNA
quantity was assessed in duplicates by Quant-iT RiboGreen RNA Assay
kit (Invitrogen; Thermo Fisher Scientific Inc.) using the Infinite
M200 multimode reader (Tecan Group, Ltd.). The quality was assessed
by measurement of RNA Integrity Number (RIN) using Agilent 2100
Bioanalyzer and Agilent RNA 6000 Nano Assay Kit (Agilent
Technologies, Inc.) and samples with RIN ≥3 were used for analysis.
For cDNA synthesis, 0.5 µg of the isolated RNA was used with the
RevertAid™ First Strand cDNA Synthesis kit (Thermo Fisher
Scientific Inc.). The reaction was incubated 60 min at 42°C and
terminated by heating at 70°C for 5 min. PCR amplification of
ubiquitin C discriminating between product from cDNA (190 bp) and
from genomic DNA (1,009 bp) was used for the cDNA quality check in
terms of DNA contamination as described before (31). All cDNA samples that were free of DNA
contamination (absence of 1,009 bp band in sample incubated without
reverse transcriptase) were further analyzed.
Reverse transcription-quantitative PCR
(RT-qPCR)
RT-qPCR was performed using the
LightCycler® 96 System (Roche Diagnostics GmbH). The
reaction contained 2.5 µl of cDNA samples (diluted 10-times) and
7.5 µl of kit composed of 0.5 µl of TaqMan™ Gene Expression Assay
(20X), 2 µl of 5X Hot FirePol Probe qPCR Mix Plus (ROX) and 5 µl of
RNAse free water (all Thermo Fisher Scientific Inc.). The
thermocycling conditions used were as follows: 50°C for 2 min,
denaturation at 95°C for 10 min followed by 55 cycles of
denaturation at 95°C for 15 sec and annealing/extension at 60°C for
1 min. Mitochondrial ribosomal protein L19 (MRPL19),
Polymerase II RNA subunit A (POLR2A) and Proteasome 26S
subunit ATPase 4 (PSMC4) were used as reference genes
specific for studies of human CRC and Eukaryotic translation
initiation factor 2B (EIF2B1), Eukaryotic translation
initiation factor 1 (ELF1), MRPL19 and POP4 homolog,
ribonuclease P/MRP subunit (POP4) for PDAC based on our
previously published data (26,30).
Primers and probes for RT-qPCR were part of commercially provided
TaqMan™ Gene Expression Assays (Thermo Fisher Scientific Inc.). The
list of genes and TaqMan™ Gene Expression Assays used in the study
were listed in Table SI. The
non-template control contained water instead of cDNA. Negative cDNA
synthesis controls (RNA transcribed without reverse transcriptase)
were also employed to demonstrate possible carry-over
contamination. Each sample was assayed in duplicate and the mean
value used for calculations. Samples with a variation >0.5 Ct
(cycle threshold) were reanalyzed. The efficiencies of all assays
were between 90 and 100% and calibration curves had
R2≥0.998. Transcript levels were analyzed by Roche
LightCycler® 96 System Software. Ratio of Ct of an
arithmetic mean of Ct of all reference genes to a particular target
gene was calculated for each sample and used for statistical
evaluation (32). The qPCR study
adhered to the MIQE Guidelines (Minimum Information for Publication
of Quantitative Real-Time PCR Experiments) (33).
Statistical analysis
Each sample was assayed in duplicate and the mean
values were used for statistics. Ct ratio which was an arithmetic
mean of Ct for all reference genes to a particular target gene was
calculated for each sample. Gene expression levels are presented as
mean ± SD (standard deviation) of this ratio (Fig. 1). Statistical analysis was performed
using SPSS v.16.0 (SPSS, Inc.) as previously described (21,22).
Briefly, distribution of gene expression data was evaluated by the
Kolmogorov-Smirnov test. Gene expression data did not follow a
normal distribution, and hence, non-parametric tests (the Wilcoxon
signed-rank test, the Mann-Whitney test and the Kruskal-Wallis
test) were used for evaluation of differences between groups of
patients divided by the clinical data. Differences of gene
expression levels in patients divided by sex, tumor localization
and size, lymph node and distant metastasis, pathological stage and
grade, resection margins and response to therapy were evaluated by
Mann-Whitney and Kruskal-Wallis tests. The Spearman's rank
correlation test was used for assessment of correlations between
continuous variables as patient age and gene expression levels.
Differences in gene expression levels between tumor and control
samples were evaluated by the Wilcoxon signed-rank test. Receiver
operator curve (ROC) analysis was performed for evaluation of the
power of expression biomarkers to discriminate the patients with
different survival functions. To divide the patients into low and
high expressing groups, gene expression levels were divided by the
median and cutoff values calculated using the ROC analysis
performed using ROC Plotter (34).
Median cutoff values were the following: 0.990, 1.160 and 1.020 for
PRC1, KIF14 and CIT DFI analysis in CRC tumors,
respectively; 0.990, 1.157 and 1.015 for PRC1, KIF14 and
CIT OS analysis in CRC tumors, respectively and 1.083, 1.221
and 1.052 for PRC1, KIF14 and CIT OS analysis in PDAC
tumors, respectively. Cutoff values based on the ROC analysis were
the following: 1.000, 1.170 and 1.020 for PRC1, KIF14 and
CIT OS analysis in CRC tumors, respectively and 1.084, 1.204
and 1.044 for PRC1, KIF14 and CIT OS analysis in PDAC
tumors, respectively. Survival function was plotted by the
Kaplan-Meier method and the log rank test used for survival
comparisons between groups of patients. To provide better estimates
of survival probabilities and cumulative hazard, multivariate
analysis was performed using Cox regression adjusted to stage. The
correction for false discovery rate (FDR) was applied according to
Benjamini and Hochberg (35). All
P-values are from two-sided tests. P<0.05 was considered to
indicate a statistically significant difference. Basic data about
protein expression of PRC1, KIF14 and CIT in CRC and PDAC were
extracted from The Human Protein Atlas (https://www.proteinatlas.org).
Results
Gene expression levels in tumor and
control tissues of colorectal cancer patients
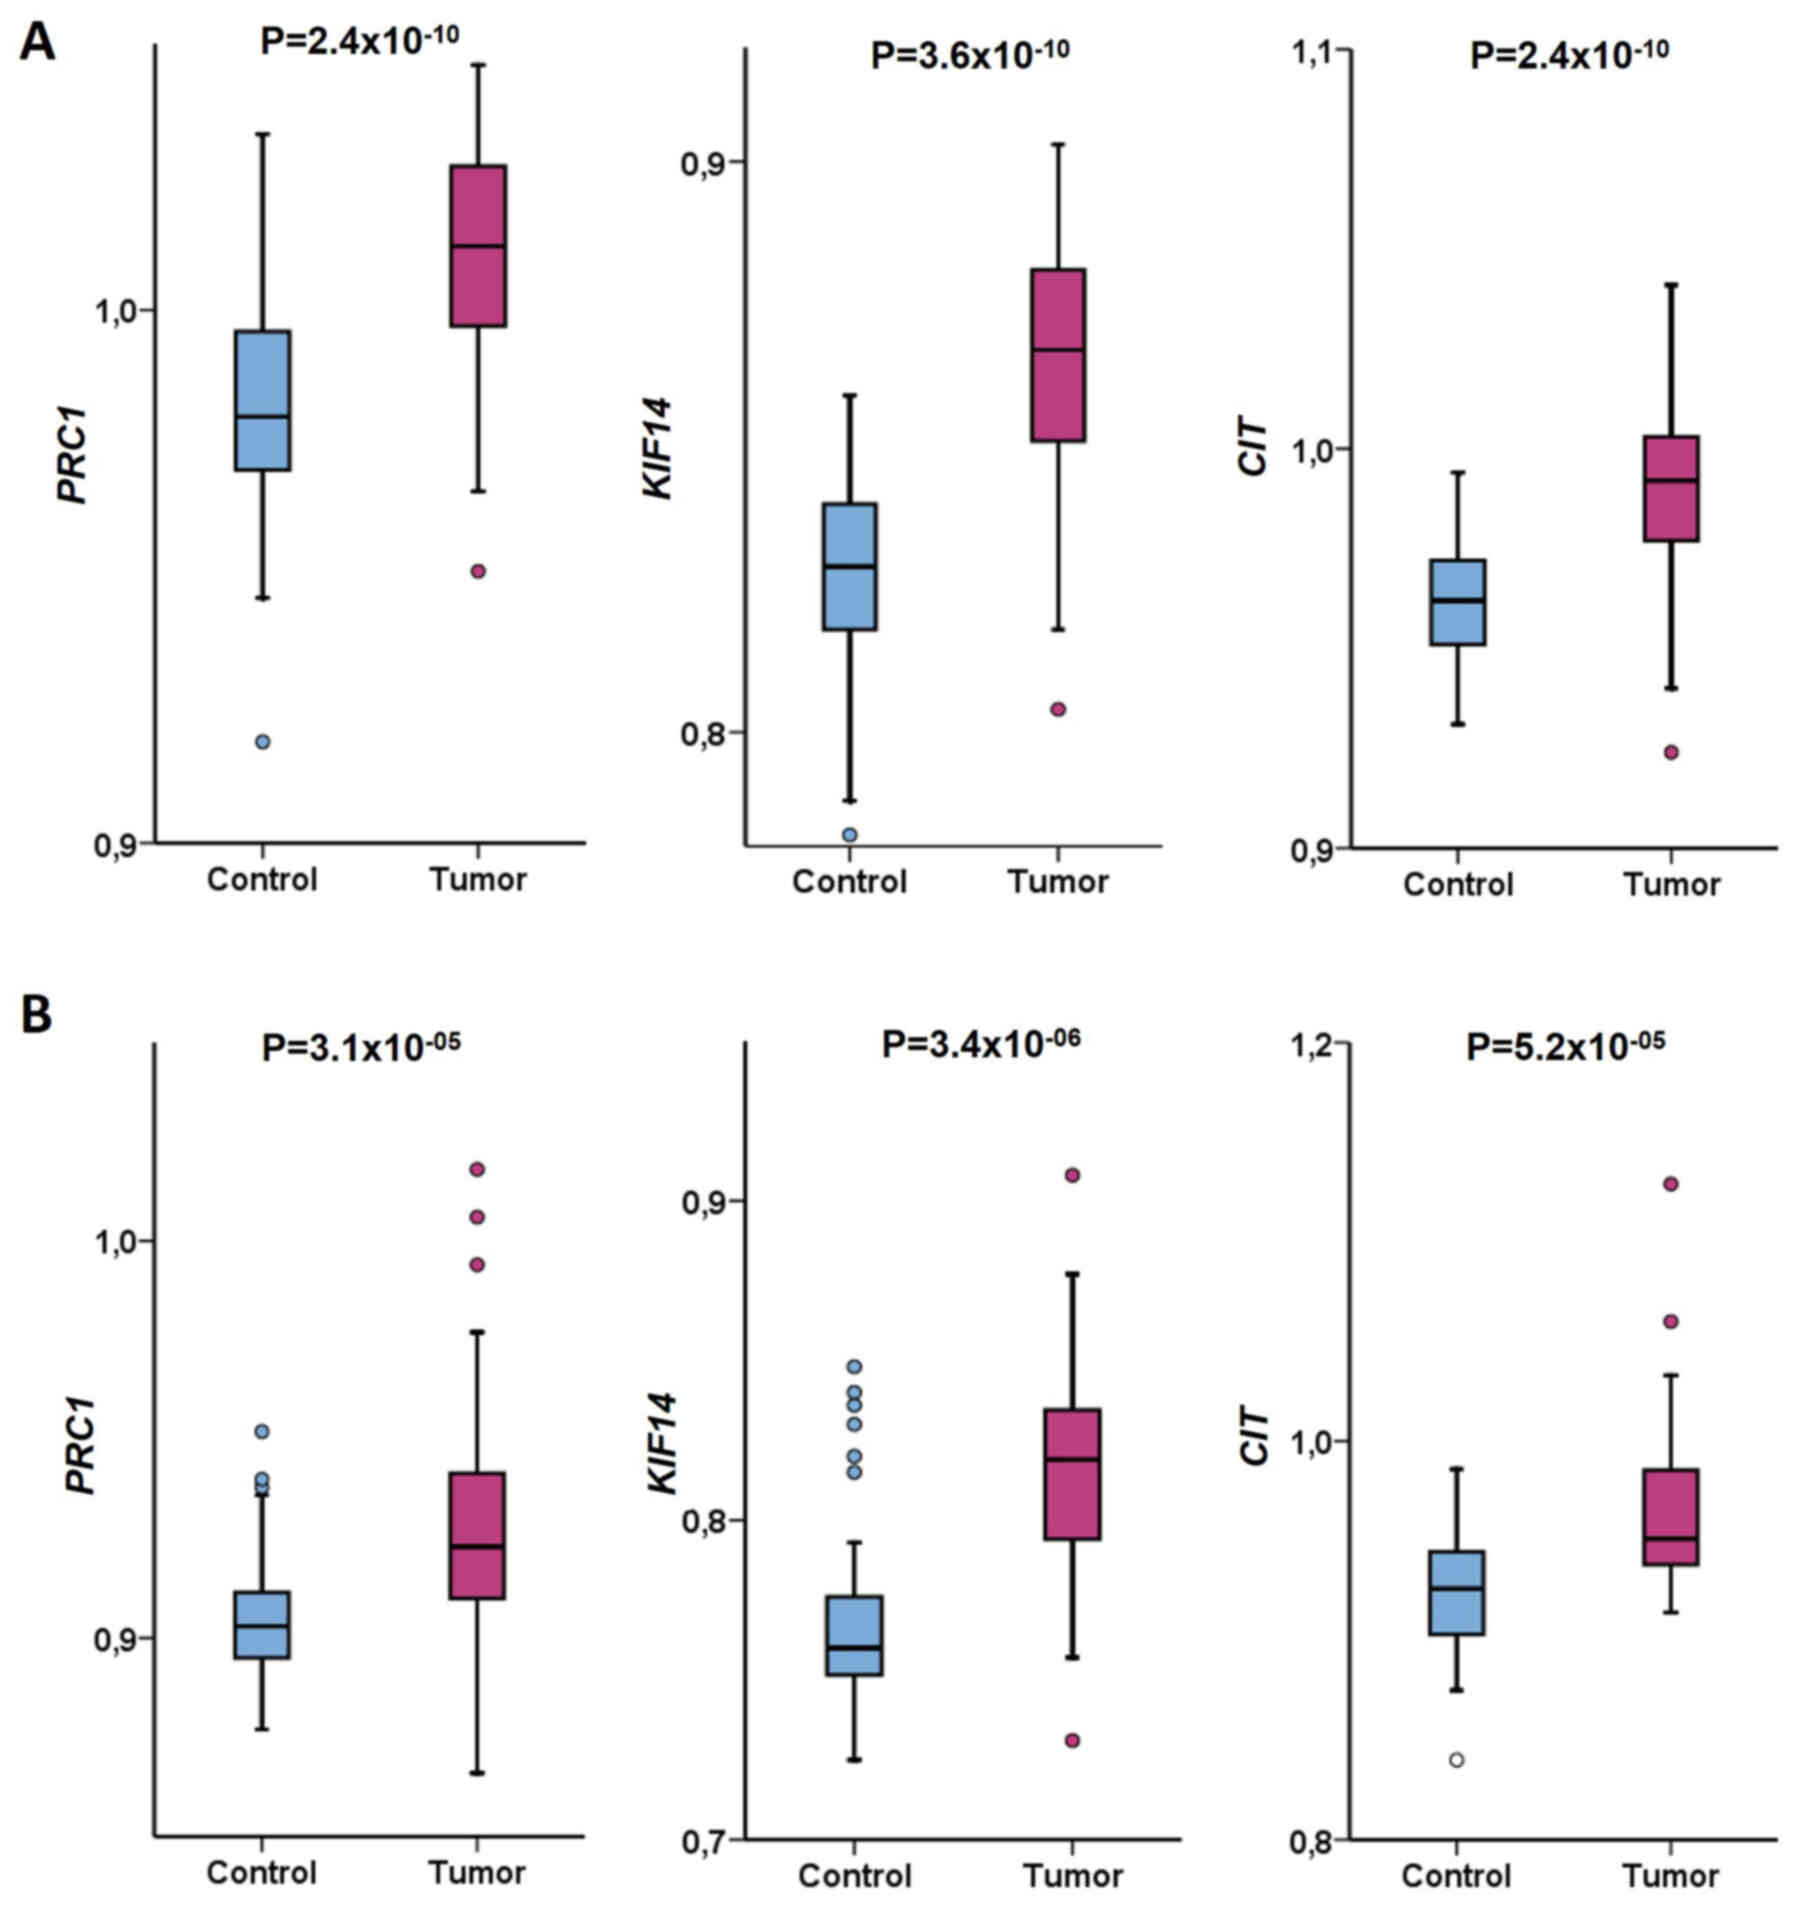
First, transcript expression levels of cytokinesis
genes were assessed in tumor and control tissues from patients with
CRC by RT-qPCR. PRC1, KIF14 and CIT were
significantly upregulated in tumors compared with paired control
tissue samples (PRC1, P=2.4×10⁻¹⁰; KIF14,
P=3.6×10⁻¹⁰; CIT, P=2.4×10⁻¹⁰;
Wilcoxon signed-rank test; Fig. 1A).
KIF14 and CIT expression was highly significantly
correlated in tumor tissues (P=3.0×10−09, correlation
coefficient ρ=0.708; Spearman correlation test) while correlations
between PRC1 and KIF14 and PRC1 and CIT
were weaker (P=4.2×E−05, ρ=0.532 and
P=3.2×E−05, ρ=0.538, respectively; Spearman correlation
test). In control tissues, correlation between PRC1 and
KIF14 was stronger (P=3.7×10−07, ρ=0.633;
Spearman correlation test) compared with the rest of the
correlations (P=0.005, ρ=0.378 for PRC1 with CIT and
P=2.1×E−04; ρ=0.487 for KIF14 with CIT;
Spearman correlation test). All associations passed the FDR test
for multiple testing (q=0.016). Data about protein expression from
The Human Protein Atlas demonstrated that in general, PRC1 and
KIF14 are overexpressed in colon or rectal carcinomas compared to
normal tissues. On the other hand, CIT was downregulated in tumors
(Table SII). The above results
suggested that all cytokinesis genes were significantly upregulated
in colorectal carcinomas compared to control tissues and that their
levels mutually correlated.
Associations between gene expression
levels in tumors and clinical data of patients with colorectal
cancer
Then, PRC1, KIF14 and CIT levels in
tumor samples were compared in groups of patients stratified by
clinical data and survival functions. No significant associations
between intra-tumoral expression of PRC1, KIF14 and
CIT and age, sex, primary tumor size, location and invasive
depth (pT), regional lymph node involvement (pN), distant
metastasis (cM), grade or localization of tumor (colon, sigma, or
rectum) were observed (Table III).
KIF14 expression significantly differed between patients
stratified by the disease stage (P=0.020; Kruskal-Wallis test;
Table III). However, the lack of
trend between all the compared stages suggested that this
association was not clinically relevant (Table III). In addition, it did not pass
the FDR correction for multiple testing (q=0.002). No association
between gene expression and response of patients to palliative
therapy (progressive disease vs partial response or stable disease,
group B, n=30) was found (Table
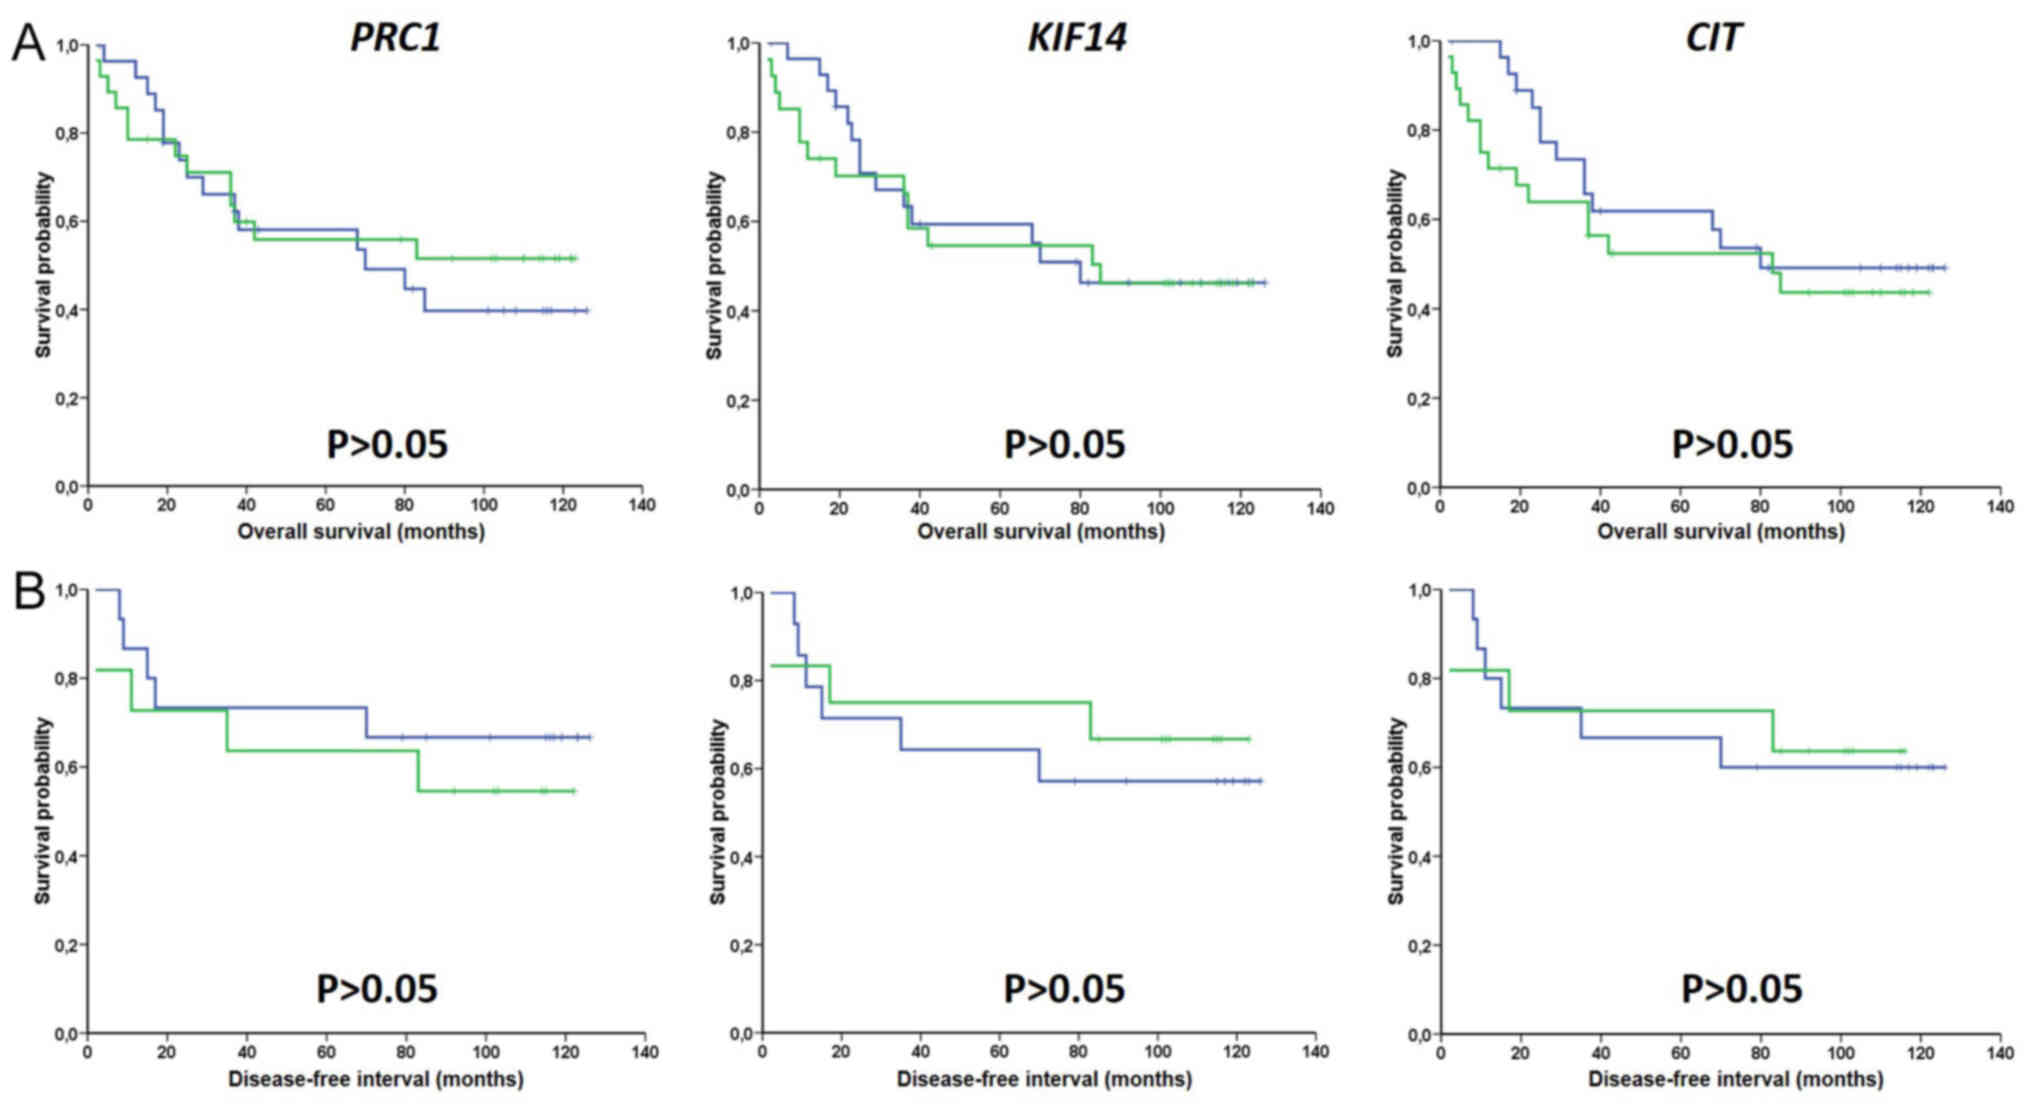
III). Similarly, transcript expression levels of PRC1,
KIF14 and CIT did not associate with DFI of subgroup of
patients treated with adjuvant chemotherapy (group A, n=34) or with
OS of all patients (both groups together) as evaluated by the gene
expression median (Fig. 2) or cutoff
using the ROC analysis (Fig. S1,
for OS only). Multivariate analysis by Cox regression adjusted to
disease stage also failed to show significant associations between
intra-tumoral expression levels of PRC1, KIF14 and
CIT and survival of patients with CRC (Table IV). Hence, gene expression levels
were not associated with survival time in both univariate and
multivariate analyses. Taken together, these analyses suggested a
lack of significant associations between intra-tumoral expression
of cytokinesis genes and clinical data of patients with CRC.
Transcript expression of these genes was not associated with
prognosis of patients assessed by DFI and OS.
| Table III.Clinical characteristics of patients
with CRC (n=67) and expression of target genes (PRC1, KIF14 and
CIT). |
Table III.
Clinical characteristics of patients
with CRC (n=67) and expression of target genes (PRC1, KIF14 and
CIT).
|
|
| PRC1 | KIF14 | CIT |
|---|
|
|
|
|
|---|
|
Characteristics | n |
P-valuea
(ρ value) |
|---|
| Age | 67 | 0.484b (0.095) | 0.125b (−0.207) | 0.711b (0.051) |
| Sex |
| 0.430 | 0.329 | 0.063 |
|
Female | 23 |
|
|
|
|
Male | 44 |
|
|
|
| Primary tumor
localization |
| 0.280 | 0.275 | 0.370 |
|
Colon | 28 |
|
|
|
|
Sigma | 13 |
|
|
|
|
Rectum | 15 |
|
|
|
| Primary tumor size,
location, and invasive depth (pT) |
| 0.554 | 0.273 | 0.308 |
|
pT2 | 5 |
|
|
|
|
pT3 | 53 |
|
|
|
|
pT4 | 9 |
|
|
|
| Lymph node
metastasis (pN) |
| 0.769 | 0.357 | 0.913 |
|
pN0 | 22 |
|
|
|
|
pN1-2 | 45 |
|
|
|
| Distant metastasis
(cM) |
| 0.822 | 0.882 | 0.722 |
|
cM0 | 34 |
|
|
|
|
cM1 | 33 |
|
|
|
| Pathological stage
(S) |
| 0.176 | 0.020c | 0.066 |
|
SII | 14 |
|
|
|
|
SIII | 20 |
|
|
|
|
SIV | 33 |
|
|
|
| Pathological grade
(G) |
| 0.810 | 0.453 | 0.452 |
| G1 | 10 |
|
|
|
| G2 | 46 |
|
|
|
| G3 | 11 |
|
|
|
| Response to
palliative chemotherapy |
| 0.658 | 0.877 | 0.913 |
|
Regression or stable | 15 |
|
|
|
|
Progression | 15 |
|
|
|
| Table IV.Stage adjusted (A) overall survival
and (B) disease-free interval of patients with CRC evaluated by Cox
regression. |
Table IV.
Stage adjusted (A) overall survival
and (B) disease-free interval of patients with CRC evaluated by Cox
regression.
| A, Overall survival
of all patients (n=67) |
|---|
|
|---|
| Transcript | P-value | Hazard
ratioa | 95% confidence
interval |
|---|
| PRC1 | 0.650 | 1.19 | 0.56-2.52 |
| KIF14 | 0.889 | 1.06 | 0.49-2.28 |
| CIT | 0.920 | 0.96 | 0.42-2.17 |
|
| B, Disease-free
interval of patients treated with adjuvant chemotherapy
(n=34) |
|
|
Transcript | P-value | Hazard
ratioa | 95% confidence
interval |
|
| PRC1 | 0.492 | 0.65 | 0.18-2.25 |
| KIF14 | 0.729 | 1.26 | 0.34-4.70 |
| CIT | 0.898 | 0.91 | 0.20-4.03 |
Gene expression levels in tumors and
control tissues of patients with pancreatic cancer
Expression levels of cytokinesis genes were assessed
in tumor and control tissues from patients with PDAC by RT-qPCR.
PRC1, KIF14 and CIT were significantly upregulated in
tumors compared with paired control tissue samples (PRC1,
P=3.1×10−05; KIF14, P=3.4×10−06;
CIT, P=5.2×10−05; Wilcoxon signed-rank test;
Fig. 1B). PRC1 and
KIF14 expression was highly significantly correlated in
tumor tissues (P=1.1×10⁻¹¹, ρ=0.852; Spearman
correlation test) while correlations between KIF14 and
CIT and PRC1 and CIT were weaker (P=0.004,
ρ=0.456 and P=0.001, ρ=0.513, respectively; Spearman correlation
test). All genes correlated together in the same way in control
tissues. However, correlations were of lower significance
(P=8.5×10−04, ρ=0.519 for PRC1 with KIF14;
P=0.004, ρ=0.461, for PRC1 with CIT and P=0.046,
ρ=0.326, for KIF14 with CIT; Spearman correlation
test) compared with tumors. All associations except correlation of
KIF14 with CIT in control tissues passed the FDR test
for multiple testing (q=0.016). Data about protein expression from
The Human Protein Atlas demonstrated that in general, PRC1, KIF14
and CIT were overexpressed in pancreatic carcinomas compared to
normal tissues (Table SII). The
above analyses suggested that all cytokinesis genes were
significantly upregulated in pancreatic carcinomas compared with
control tissues and that their levels mutually correlated.
Associations between gene expression
levels in tumors and clinical data of patients with pancreatic
cancer
PRC1, KIF14 and CIT levels in tumor
samples were compared in groups of patients stratified by clinical
data and survival functions. No significant associations between
intra-tumoral expression of PRC1, KIF14 and CIT and
individual clinical data of patients age, sex, tumor localization
(head versus body or tail), pT, pN, stage, grade, angioinvasion and
perineural invasion or resection margins (R0 versus R1) were
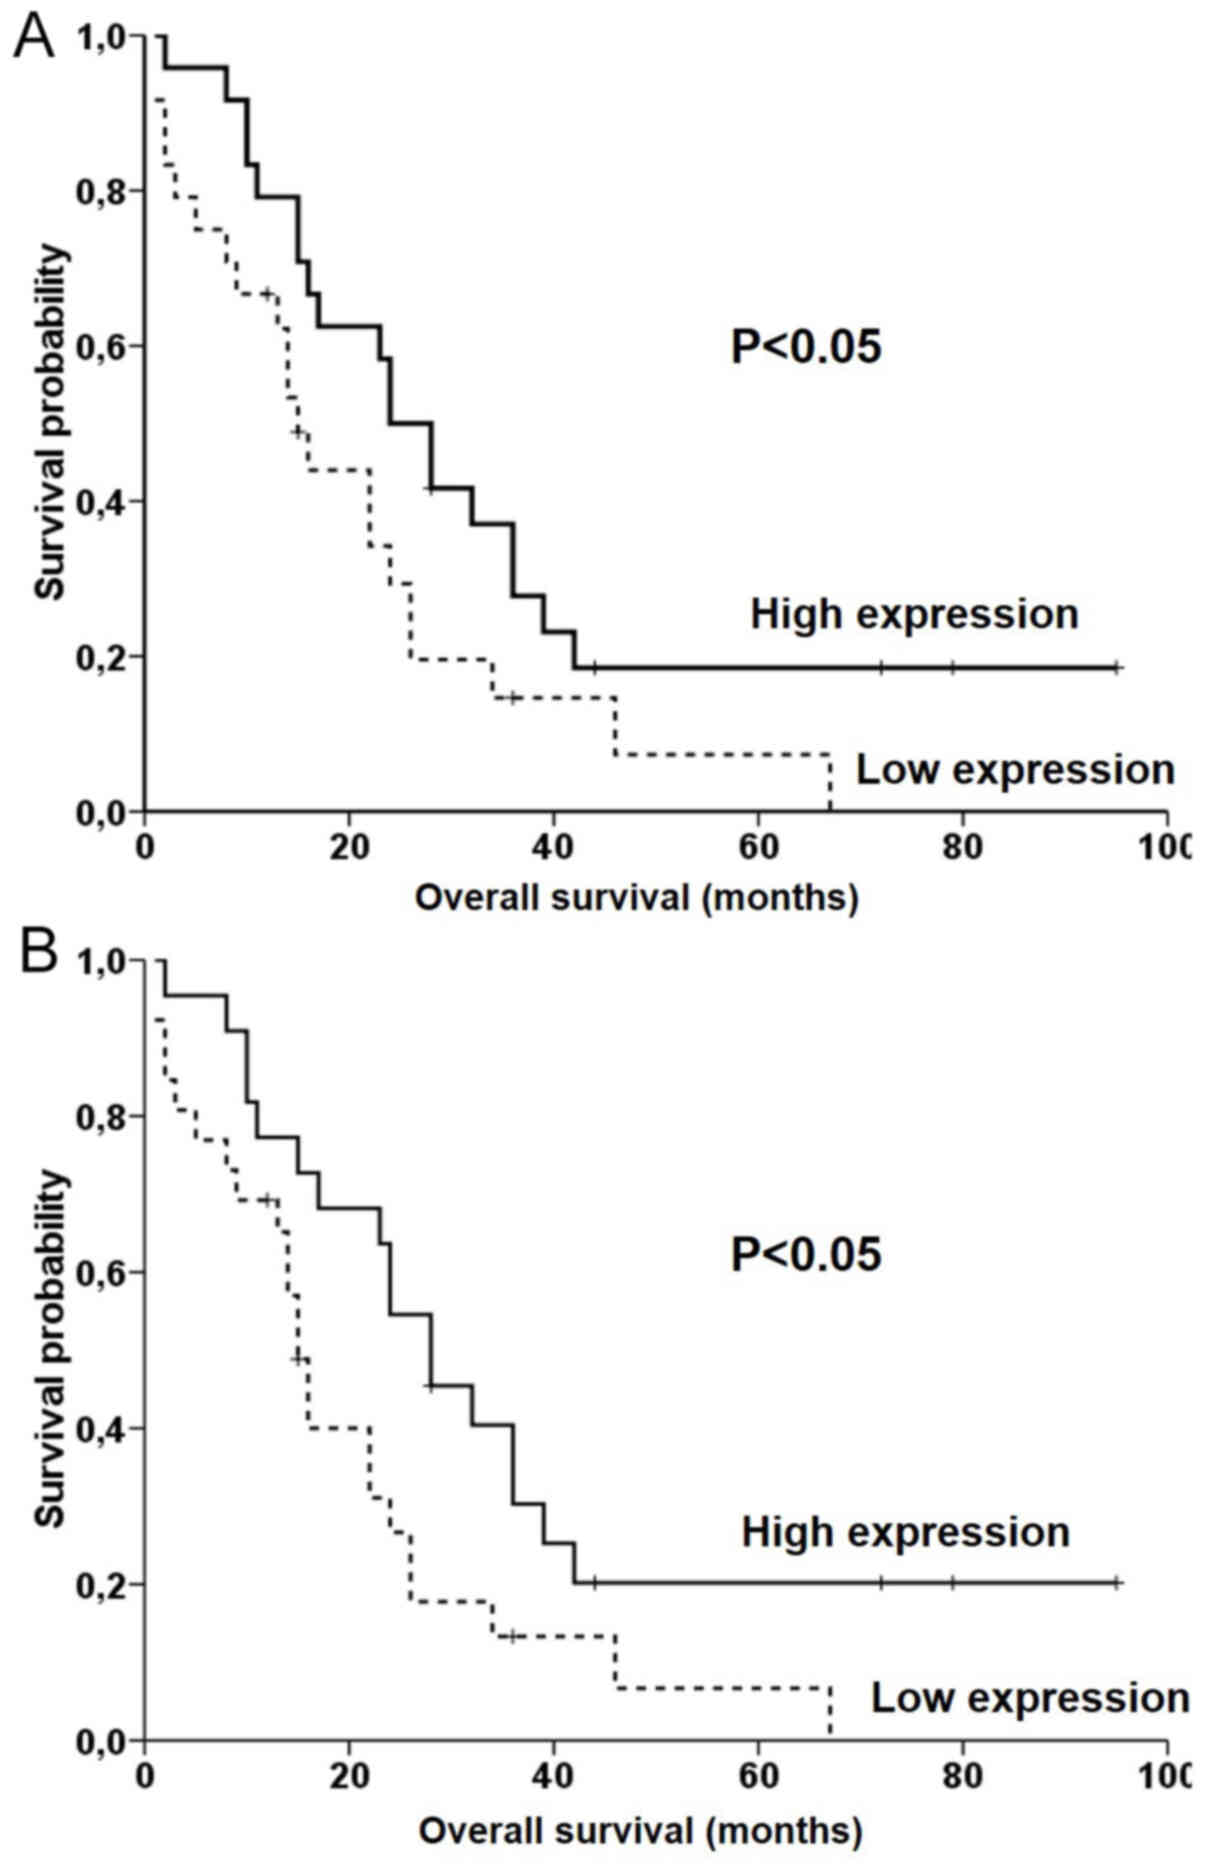
observed (Table V). Expression of
PRC1 or KIF14 did not associate with OS of all
patients as evaluated by the gene expression median (Fig. S2A) or cutoff using the ROC analysis
(Fig. S3). Notably, patients with
lower expression of CIT had significantly worse OS compared
with patients with higher expression level (P<0.05 for median
and P<0.05 for the ROC analysis cut offs; log rank test;
Fig. 3), but this result did not
pass the FDR test (q=0.016). The OS of the subgroup of patients
with PDAC treated with adjuvant chemotherapy (n=31) was not
significantly associated with expression of PRC1, KIF14 and
CIT (Fig. S2B). No
significant association of expression levels with OS was observed
in multivariate analyses using the Cox regression adjusted to stage
(Table VI). Hence, gene expression
levels were not associated with survival time in both univariate
and multivariate analyses. Taken together, these analyses suggested
a lack of significant associations between intra-tumoral expression
of cytokinesis genes and clinical data of patients with PDAC.
Transcript expression of these genes were not associated with
prognosis of patients assessed by OS.
| Table V.Clinical characteristics of patients
with PDAC (n=48) and expression of target genes (PRC1, KIF14 and
CIT). |
Table V.
Clinical characteristics of patients
with PDAC (n=48) and expression of target genes (PRC1, KIF14 and
CIT).
|
|
| PRC1 | KIF14 | CIT |
|---|
|
|
|
|
|---|
|
Characteristics | n |
P-valuea
(ρ value) |
|---|
| Age at
diagnosis | 48 | 0.605b (0.076) | 0.673b (0.063) | 0.282b (0.158) |
| Sex |
| 0.251 | 0.214 | 0.796 |
|
Female | 26 |
|
|
|
|
Male | 22 |
|
|
|
| Primary tumor
localization |
| 0.463 | 0.354 | 0.154 |
|
Head | 40 |
|
|
|
| Body or
tail | 8 |
|
|
|
| Primary tumor size,
location, and invasive depth (pT) |
| 0.852 | 0.743 | 0.105 |
| pT1 or
pT2 | 6 |
|
|
|
| pT3 or
pT4 | 42 |
|
|
|
| Lymph node
metastasis (pN) |
| 0.480 | 0.650 | 0.704 |
|
pN0 | 19 |
|
|
|
|
pN1 | 29 |
|
|
|
| Pathological stage
(S) |
| 0.180 | 0.418 | 0.120 |
| SI | 3 |
|
|
|
| SII or
SIII | 45 |
|
|
|
| Pathological grade
(G) |
| 0.690 | 0.714 | 0.126 |
| G1 or
G2 | 31 |
|
|
|
| G3 or
G4 | 17 |
|
|
|
| Angioinvasion
(pA) |
| 0.917 | 0.842 | 0.975 |
|
pA0 | 28 |
|
|
|
|
pA1 | 20 |
|
|
|
| Perineural invasion
(pP) |
| 0.056 | 0.079 | 0.084 |
|
pP0 | 11 |
|
|
|
|
pP1 | 37 |
|
|
|
| Resection margins
(R) |
| 0.401 | 0.794 | 0.867 |
| R0 | 44 |
|
|
|
| R1 | 4 |
|
|
|
| Table VI.Stage adjusted overall survival of
patients with PDAC (n=48) evaluated by Cox regression. |
Table VI.
Stage adjusted overall survival of
patients with PDAC (n=48) evaluated by Cox regression.
| Transcript | P-value | Hazard
ratioa | 95% confidence
interval |
|---|
| PRC1 | 0.223 | 1.48 | 0.79-2.77 |
| KIF14 | 0.507 | 1.24 | 0.66-2.31 |
| CIT | 0.126 | 1.66 | 0.87-3.15 |
Discussion
The present study focused on exploring whether
transcript expression levels of PRC1, KIF14 and CIT
correlate with prognosis of patients with colorectal and pancreatic
carcinomas. Although significantly increased gene expression levels
of all 3 genes in both types of carcinomas compared with control
tissues was observed in the present study, no association of
PRC1, KIF14 and CIT levels with DFI or OS in any of
the patient groups studied was observed.
PRC1, KIF14 and CIT transcript
expression is dysregulated, mainly upregulated, in several
malignancies, e.g., breast, hepatocellular, bladder, prostate and
ovarian cancers (21–25) and therefore, the relevance of these
cytokinesis regulators for tumor initiation and progression is
being intensively studied currently (36–38).
Transcript levels of all 3 genes strongly correlated together in
the present study further demonstrating their importance for cancer
progression and potential as potential therapeutic targets.
Prognostic significance of PRC1, KIF14 and
CIT has been so far reported in lung, ovarian, breast,
cervical, gastric, hepatocellular, bladder and prostate cancers
(21–25,39–45),
however, the present study demonstrated no prognostic significance
of PRC1, KIF14 and CIT for CRC and PDAC.
Strong upregulation of KIF14 transcript in
tumors compared with control tissues has been previously observed
in CRC in accordance with the results of the present study, however
survival analysis was not investigated (46). Another study on CRC reported that CIT
protein was upregulated in tumors compared with control tissues and
disease-free and overall survival time were significantly poorer in
patients with positive CIT protein staining in tumor tissues
compared with patients with negative staining (47). In contrast, the present study
observed poorer OS in patients with CRC with low intra-tumoral
CIT transcript levels compared with patients with high
levels, although this association did not pass the FDR test.
Similarly, our earlier work demonstrated that low CIT
transcript level is a negative prognostic factor in patients with
ovarian carcinoma (22). According
to in vitro studies, CIT functions in the late phase of cell
division, early stage of mitosis and is responsible for DNA damage
control (36–38). Dysregulation of CIT in several types
of in vitro tumor models, e.g., breast, colorectal or
cervical ones, leads to aneuploidy and chromosomal instability
(CIN) (37). CIN may have various
effects on the prognosis of patients, especially depending on the
type of cancer and treatment, involving, e.g., genomic plasticity,
inflammatory signaling, distant metastasis, immune evasion or
resistance to therapy (48,49). The association of the degree of CIN
and the expression of cytokinesis regulators with the clinical
outcome of patients could be among the reasons for the observed
discrepancies in patients with cancer. The difference between
biological meaning of transcript levels and protein expression
intensity represents other factor potentially explaining
inconsistencies. For comparison the present study provided basic
data about protein expression of PRC1, KIF14 and CIT
in CRC and PDAC extracted from The Human Protein Atlas (https://www.proteinatlas.org). These data demonstrated
that most of the investigated cytokinesis genes (except CIT in CRC)
were upregulated in CRC and PDAC compared with normal tissues also
on the protein level.
Besides a few rather small-scale experimental
studies in various cancer types, e.g., breast (21), ovarian (22,40),
cervical (41) and prostate
(25) carcinomas, Big Data mining,
from the Gene Expression Omnibus (GEO) or the Cancer Genome Atlas
(TCGA) databases, using various in silico bioinformatics
have demonstrated that some cytokinesis regulators may have
prognostic value alone or as a part of a specific gene sets
(50–52). For example, KIF14 is one of 10
genes whose low transcript expression in the GSE62452 microarray
dataset, composed of 69 PDAC tumors predicted significantly poorer
OS time of patients with PDAC and this was also observed in the
TCGA RNASeq dataset (50). More
recently, KIF14 was reported among 7 metastasis-related
genes with prognostic potential based on OS time in PDAC based on
141 patients from the TCGA dataset validated with the GSE62452
dataset (51). Additionally,
PRC1 is among 10 other genes whose signature predicts OS
time and 12 genes predicting disease-free survival time of patients
with PDAC based on in silico analysis of data of 77 patients
with PDAC from 3 GEO datasets (52).
High intra-tumoral CIT transcript level alone was recently
identified as poor prognosis predictor (both OS and disease-free
survival time) in PDAC through analysis of 178 patients from the
TCGA dataset using the Gene Expression Profiling Interactive
Analysis online tool (53). In light
of a recent study that almost 20% of samples in the TCGA dataset
corresponded to normal or other than PDAC tissues and mainly that
vast majority of genes lost prognostic significance after cohort
curation (54), caution in
performing in silico studies and mainly continuous
verification of data in well characterized sample sets is
necessary. The present study provided results acquired by analyzing
cohorts of patients recruited in single center setting, hence
reducing heterogeneity in clinical data reporting. Sample
collection proceeded using long-term established logistics with
minimum time-lapse between surgical specimen removal and processing
including storage at low temperature in the present study. Sample
processing, RT-qPCR analysis and evaluation of results are also
standardized and maintained over long period (26,29,30). The
control of these conditions in multicenter settings is very
difficult if at all possible (55)
suggesting that the exploitation of prognostic information in
future precision medicine will rely on both single center and
multicenter approaches.
The present study had several limitations. Modest
sample size of the present study was a limitation. This was
unavoidable considering 15–20% resection rate of PDAC (56). Additionally, archival formalin fixed
paraffin embedded tissue samples are not suitable for analysis due
to the poor RNA integrity. The study of transcript levels rather
than protein expression is another limitation of the present study.
The clinical relevance of protein analysis is obvious, i.e., it is
routinely used for assessment of receptors or markers of
proliferation. On the other hand, semi-quantitative
immunohistochemistry reflects just protein level and not enzymatic
activity (57). The issue of
availability, specificity and selectivity of antibodies, variations
in normalization of results and complexity of gene expression
regulation frequently cause a lack of association between mRNA and
protein levels and hence, they should be considered as independent
markers (58). Therefore, separate
future studies should investigate the roles of protein levels and
potentially functional aspects of cytokinesis in PDAC and CRC.
In conclusion, the present study demonstrated
upregulation and strong association of transcript levels of major
cytokinesis regulators PRC1, KIF14 and CIT in tumors
from patients with CRC and PDAC without relevant prognostic
significance. Hence according to the results of the present study,
transcript levels of these genes cannot be clinically exploited as
prognostic biomarkers in patients with colorectal or pancreatic
cancer.
Supplementary Material
Supporting Data
Acknowledgements
The authors would like to thank Associate Professor
Eva Honsova from the Department of Clinical and Transplantation
Pathology, Institute for Clinical and Experimental Medicine,
Prague, Czech Republic and Dr Jan Mazanec from the Department of
Pathology, Hospital Brno and Faculty of Medicine, Masaryk
University, Brno, Czech Republic for help with sample preparation
and tumor cell content assessment in pancreatic cancer
specimens.
Funding
This work was supported by the Czech Medical
Council (grant. no. NV19-08-00113 to PS), the Grant Agency of
Charles University (grant. no. UNCE/MED/006 to VL), and by the
Ministry of Education, Youth and Sports of the Czech Republic
(grant. no. CZ.02.1.01/0.0/0.0/16_019/000 787 awarded by the MEYS
CR, financed from EFRR to VB).
Availability of data and materials
The datasets used and/or analyzed during the
current study are available from the corresponding author on
reasonable request.
Authors' contributions
PS, VL, MO and ZK were responsible for the general
supervision of the study. PS and VB were responsible for study
conceptualization. PS, VH, IK, and VB were responsible for
experimental data analysis and interpretation. JR, RP, VL, MO, ZK,
and BD were responsible for acquisition of clinical data. PS and VB
drafted the manuscript. VH, VB, JR, RP, VL, MO, ZK, BD, IK and PS
revised the manuscript for important intellectual content. PS and
VL confirmed the authenticity of all the raw data. All authors have
read and approved the manuscript and agreed to be accountable for
all aspects of the work.
Ethics approval and consent to
participate
The present study conformed with the Code of Ethics
of the World Medical Association (Declaration of Helsinki, 1964).
Study protocol was approved by the Ethical Commission of the
Medical Faculty and Teaching Hospital in Pilsen (Pilsen, Czech
Republic) (approval. no. IGA 10230-3, 2nd September 2008), the
Institutional Review Boards of the Institute of Clinical and
Experimental Medicine (Prague, Czech Republic) and the University
Hospital Brno (Brno, Czech Republic) (approval received in the
process of application of research project. no. GA CR P304/10/0338,
4th May 2009). Written informed consent was obtained from all
individual participants included in the study.
Patient consent for publication
Not applicable.
Competing interests
The authors declare that they have no competing
interests.
References
|
1
|
Dekker E, Tanis PJ, Vleugels JLA, Kasi PM
and Wallace MB: Colorectal cancer. Lancet. 394:1467–1480. 2019.
View Article : Google Scholar : PubMed/NCBI
|
|
2
|
World Health Organization (WHO), . Cancer
fact sheets. WHO; Geneva: 2021, https://gco.iarc.fr/today/fact-sheets-cancersApril
12–2021
|
|
3
|
National Cancer Institute (NCI), . Cancer
Stat Facts: Colorectal Cancer. NCI; Bethesda, MD: 2021, https://seer.cancer.gov/statfacts/html/colorect.htmlOctober
10–2020
|
|
4
|
Rahib L, Smith BD, Aizenberg R, Rosenzweig
AB, Fleshman JM and Matrisian LM: Projecting cancer incidence and
deaths to 2030: The unexpected burden of thyroid, liver, and
pancreas cancers in the United States. Cancer Res. 74:2913–2921.
2014. View Article : Google Scholar : PubMed/NCBI
|
|
5
|
Conroy T, Hammel P, Hebbar M, Ben
Abdelghani M, Wei AC, Raoul JL, Choné L, Francois E, Artru P, Biagi
JJ, et al: FOLFIRINOX or gemcitabine as adjuvant therapy for
pancreatic cancer. N Engl J Med. 379:2395–2406. 2018. View Article : Google Scholar : PubMed/NCBI
|
|
6
|
De Dosso S, Siebenhüner AR, Winder T,
Meisel A, Fritsch R, Astaras C, Szturz P and Borner M: Treatment
landscape of metastatic pancreatic cancer. Cancer Treat Rev.
96:1021802021. View Article : Google Scholar : PubMed/NCBI
|
|
7
|
Fededa JP and Gerlich DW: Molecular
control of animal cell cytokinesis. Nat Cell Biol. 14:440–447.
2012. View Article : Google Scholar : PubMed/NCBI
|
|
8
|
Gruneberg U, Neef R, Li X, Chan EH,
Chalamalasetty RB, Nigg EA and Barr FA: KIF14 and citron kinase act
together to promote efficient cytokinesis. J Cell Biol.
172:363–372. 2006. View Article : Google Scholar : PubMed/NCBI
|
|
9
|
Lens SMA and Medema RH: Cytokinesis
defects and cancer. Nat Rev Cancer. 19:32–45. 2019. View Article : Google Scholar : PubMed/NCBI
|
|
10
|
Jiang W, Jimenez G, Wells NJ, Hope TJ,
Wahl GM, Hunter T and Fukunaga R: PRC1: A human mitotic
spindle-associated CDK substrate protein required for cytokinesis.
Mol Cell. 2:877–885. 1998. View Article : Google Scholar : PubMed/NCBI
|
|
11
|
Mollinari C, Kleman JP, Jiang W, Schoehn
G, Hunter T and Margolis RL: PRC1 is a microtubule binding and
bundling protein essential to maintain the mitotic spindle midzone.
J Cell Biol. 1570:1175–1186. 2002. View Article : Google Scholar : PubMed/NCBI
|
|
12
|
Miki H, Okada Y and Hirokawa N: Analysis
of the kinesin superfamily: Insights into structure and function.
Trends Cell Biol. 15:467–476. 2005. View Article : Google Scholar : PubMed/NCBI
|
|
13
|
Kurasawa Y, Earnshaw WC, Mochizuki Y,
Dohmae N and Todokoro K: Essential roles of KIF4 and its binding
partner PRC1 in organized central spindle midzone formation. EMBO
J. 23:3237–3248. 2004. View Article : Google Scholar : PubMed/NCBI
|
|
14
|
Wordeman L: How kinesin motor proteins
drive mitotic spindle function: Lessons from molecular assays.
Semin Cell Dev Biol. 21:260–268. 2010. View Article : Google Scholar : PubMed/NCBI
|
|
15
|
Hammond JW, Cai D, Blasius TL, Li Z, Jiang
Y, Jih GT, Meyhofer E and Verhey KJ: Mammalian Kinesin-3 motors are
dimeric in vivo and move by processive motility upon release of
autoinhibition. PLoS Biol. 7:e722009. View Article : Google Scholar : PubMed/NCBI
|
|
16
|
Singel SM, Cornelius C, Zaganjor E, Batten
K, Sarode VR, Buckley DL, Peng Y, John GB, Li HC, Sadeghi N, et al:
KIF14 promotes AKT phosphorylation and contributes to
chemoresistance in triple-negative breast cancer. Neoplasia.
16:247–256. 2014. View Article : Google Scholar : PubMed/NCBI
|
|
17
|
Carleton M, Mao M, Biery M, Warrener P,
Kim S, Buser C, Marshall CG, Fernandes C, Annis J and Linsley PS:
RNA interference-mediated silencing of mitotic kinesin KIF14
disrupts cell cycle progression and induces cytokinesis failure.
Mol Cell Biol. 26:3853–3863. 2006. View Article : Google Scholar : PubMed/NCBI
|
|
18
|
Gai M, Camera P, Dema A, Bianchi F, Berto
G, Scarpa E, Germena G and Di Cunto F: Citron kinase controls
abscission through RhoA and anillin. Mol Biol Cell. 22:3768–3778.
2011. View Article : Google Scholar : PubMed/NCBI
|
|
19
|
Bassi ZI, Audusseau M, Riparbelli MG,
Callaini G and D'Avino PP: Citron kinase controls a molecular
network required for midbody formation in cytokinesis. Proc Natl
Acad Sci USA. 110:9782–9787. 2013. View Article : Google Scholar : PubMed/NCBI
|
|
20
|
Gai M, Bianchi FT, Vagnoni C, Vernì F,
Bonaccorsi S, Pasquero S, Berto GE, Sgrò F, Chiotto AA, Annaratone
L, et al: ASPM and CITK regulate spindle orientation by affecting
the dynamics of astral microtubules. EMBO Rep. 18:18702017.
View Article : Google Scholar : PubMed/NCBI
|
|
21
|
Brynychova V, Ehrlichova M, Hlavac V,
Nemcova-Furstova V, Pecha V, Leva J, Trnkova M, Mrhalova M, Kodet
R, Vrana D, et al: Genetic and functional analyses do not explain
the association of high PRC1 expression with poor survival of
breast carcinoma patients. Biomed Pharmacother. 83:857–864. 2016.
View Article : Google Scholar : PubMed/NCBI
|
|
22
|
Ehrlichova M, Mohelnikova-Duchonova B,
Hrdy J, Brynychova V, Mrhalova M, Kodet R, Rob L, Pluta M, Gut I,
Soucek P and Vaclavikova R: The association of taxane resistance
genes with the clinical course of ovarian carcinoma. Genomics.
102:96–101. 2013. View Article : Google Scholar : PubMed/NCBI
|
|
23
|
Li X, Huang W, Huang W, Wei T, Zhu W, Chen
G and Zhang J: Kinesin family members KIF2C/4A/10/11/14/18B/20A/23
predict poor prognosis and promote cell proliferation in
hepatocellular carcinoma. Am J Transl Res. 12:1614–1639.
2020.PubMed/NCBI
|
|
24
|
Shou J, Yu C, Zhang D and Zhang Q:
Overexpression of citron rho-interacting serine/threonine kinase
associated with poor outcome in bladder cancer. J Cancer.
11:4173–4180. 2020. View Article : Google Scholar : PubMed/NCBI
|
|
25
|
Liu J, Dou J, Wang W, Liu H, Qin Y, Yang
Q, Jiang W, Liang Y, Liu Y, He J, et al: High expression of citron
kinase predicts poor prognosis of prostate cancer. Oncol Lett.
19:1815–1823. 2020.PubMed/NCBI
|
|
26
|
Hlavata I, Mohelnikova-Duchonova B,
Vaclavikova R, Liska V, Pitule P, Novak P, Bruha J, Vycital O,
Holubec L, Treska V, et al: The role of ABC transporters in
progression and clinical outcome of colorectal cancer. Mutagenesis.
27:187–196. 2012. View Article : Google Scholar : PubMed/NCBI
|
|
27
|
Sobin LH and Wittekind C: TNM
Classification of Malignant Tumors. 6th edition. Wiley-Liss; New
York, NY: 2002
|
|
28
|
Therasse P, Eisenhauer EA and Verweij J:
RECIST revisited: A review of validation studies on tumour
assessment. Eur J Cancer. 42:1031–1039. 2006. View Article : Google Scholar : PubMed/NCBI
|
|
29
|
Mohelnikova-Duchonova B, Kocik M,
Duchonova B, Brynychova V, Oliverius M, Hlavsa J, Honsova E,
Mazanec J, Kala Z, Ojima I, et al: Hedgehog pathway overexpression
in pancreatic cancer is abrogated by new-generation taxoid
SB-T-1216. Pharmacogenomics J. 17:452–460. 2017. View Article : Google Scholar : PubMed/NCBI
|
|
30
|
Mohelnikova-Duchonova B, Oliverius M,
Honsova E and Soucek P: Evaluation of reference genes and
normalization strategy for quantitative real-time PCR in human
pancreatic carcinoma. Dis Markers. 32:203–210. 2012. View Article : Google Scholar : PubMed/NCBI
|
|
31
|
Soucek P, Anzenbacher P, Skoumalová I and
Dvorák M: Expression of cytochrome P450 genes in CD34+
hematopoietic stem and progenitor cells. Stem Cells. 23:1417–1422.
2005. View Article : Google Scholar : PubMed/NCBI
|
|
32
|
Livak KJ and Schmittgen TD: Analysis of
relative gene expression data using real-time quantitative PCR and
the 2(-Delta Delta C(T)) method. Methods. 25:402–408. 2001.
View Article : Google Scholar : PubMed/NCBI
|
|
33
|
Bustin SA, Benes V, Garson JA, Hellemans
J, Huggett J, Kubista M, Mueller R, Nolan T, Pfaffl MW, Shipley GL,
et al: The MIQE guidelines: minimum information for publication of
quantitative real-time PCR experiments. Clin Chem. 55:611–622.
2009. View Article : Google Scholar : PubMed/NCBI
|
|
34
|
Fekete J and Gyorffy B: ROCplot.org:
Validating predictive biomarkers of chemotherapy/hormonal
therapy/anti-HER2 therapy using transcriptomic data of 3,104 breast
cancer patients. Int J Cancer. 145:3140–3151. 2019. View Article : Google Scholar : PubMed/NCBI
|
|
35
|
Benjamini Y and Hochberg Y: Controlling
the false discovery rate: A practical and powerful approach to
multiple testing. J R Stat Soc Series B Stat Methodol. 57:289–300.
1995.
|
|
36
|
Li J, Dallmayer M, Kirchner T, Musa J and
Grünewald TGP: PRC1: Linking cytokinesis, chromosomal instability,
and cancer evolution. Trends Cancer. 2018:59–73. 2018. View Article : Google Scholar : PubMed/NCBI
|
|
37
|
D'Avino PP: Citron kinase-renaissance of a
neglected mitotic kinase. J Cell Sci. 130:1701–1708. 2017.
|
|
38
|
Bianchi FT, Tocco C, Pallavicini G, Liu Y,
Vernì F, Merigliano C, Bonaccorsi S, El-Assawy N, Priano L, Gai M,
et al: Citron kinase deficiency leads to chromosomal instability
and TP53-sensitive microcephaly. Cell Rep. 18:1674–1686. 2017.
View Article : Google Scholar : PubMed/NCBI
|
|
39
|
Corson TW, Zhu CQ, Lau SK, Shepherd FA,
Tsao MS and Gallie BL: KIF14 messenger RNA expression is
independently prognostic for outcome in lung cancer. Clin Cancer
Res. 13:3229–3234. 2007. View Article : Google Scholar : PubMed/NCBI
|
|
40
|
Thériault BL, Pajovic S, Bernardini MQ,
Shaw PA and Gallie BL: Kinesin family member 14: An independent
prognostic marker and potential therapeutic target for ovarian
cancer. Int J Cancer. 130:1844–1854. 2012. View Article : Google Scholar
|
|
41
|
Wang W, Shi Y, Li J, Cui W and Yang B:
Up-regulation of KIF14 is a predictor of poor survival and a novel
prognostic biomarker of chemoresistance to paclitaxel treatment in
cervical cancer. Biosci Rep. 36:e003152016. View Article : Google Scholar : PubMed/NCBI
|
|
42
|
Yang Z, Li C, Yan C, Li J, Yan M, Liu B,
Zhu Z, Wu Y and Gu Q: KIF14 promotes tumor progression and
metastasis and is an independent predictor of poor prognosis in
human gastric cancer. Biochim Biophys Acta Mol Basis Dis.
1865:181–192. 2019. View Article : Google Scholar : PubMed/NCBI
|
|
43
|
Chen J, Rajasekaran M, Xia H, Zhang X,
Kong SN, Sekar K, Seshachalam VP, Deivasigamani A, Goh BK, Ooi LL,
et al: The microtubule-associated protein PRC1 promotes early
recurrence of hepatocellular carcinoma in association with the
Wnt/β-catenin signalling pathway. Gut. 65:1522–1534. 2016.
View Article : Google Scholar : PubMed/NCBI
|
|
44
|
Wang Y, Shi F, Xing GH, Xie P, Zhao N, Yin
YF, Sun SY, He J, Wang Y and Xuan SY: Protein regulator of
cytokinesis PRC1 confers chemoresistance and predicts an
unfavorable postoperative survival of hepatocellular carcinoma
patients. J Cancer. 8:801–808. 2017. View Article : Google Scholar : PubMed/NCBI
|
|
45
|
Bu H, Li Y, Jin C, Yu H, Wang X, Chen J,
Wang Y, Ma Y, Zhang Y and Kong B: Overexpression of PRC1 indicates
a poor prognosis in ovarian cancer. Int J Oncol. 56:685–696.
2020.PubMed/NCBI
|
|
46
|
Wang ZZ, Yang J, Jiang BH, Di JB, Gao P,
Peng L and Su XQ: KIF14 promotes cell proliferation via activation
of Akt and is directly targeted by miR-200c in colorectal cancer.
Int J Oncol. 53:1939–1952. 2018.PubMed/NCBI
|
|
47
|
Wu Z, Zhu X, Xu W, Zhang Y, Chen L, Qiu F,
Zhang B, Wu L, Peng Z and Tang H: Up-regulation of CIT promotes the
growth of colon cancer cells. Oncotarget. 8:71954–71964. 2017.
View Article : Google Scholar : PubMed/NCBI
|
|
48
|
Birkbak NJ, Eklund AC, Li Q, McClelland
SE, Endesfelder D, Tan P, Tan IB, Richardson AL, Szallasi Z and
Swanton C: Paradoxical relationship between chromosomal instability
and survival outcome in cancer. Cancer Res. 71:3447–3452. 2011.
View Article : Google Scholar : PubMed/NCBI
|
|
49
|
Bakhoum SF and Cantley LC: The
multifaceted role of chromosomal instability in cancer and its
microenvironment. Cell. 174:1347–1360. 2018. View Article : Google Scholar : PubMed/NCBI
|
|
50
|
Zhou Z, Cheng Y, Jiang Y, Liu S, Zhang M,
Liu J and Zhao Q: Ten hub genes associated with progression and
prognosis of pancreatic carcinoma identified by co-expression
analysis. Int J Biol Sci. 14:124–136. 2018. View Article : Google Scholar : PubMed/NCBI
|
|
51
|
Wu M, Li X, Liu R, Yuan H, Liu W and Liu
Z: Development and validation of a metastasis-related gene
signature for predicting the overall survival in patients with
pancreatic ductal adenocarcinoma. J Cancer. 11:6299–6318. 2020.
View Article : Google Scholar : PubMed/NCBI
|
|
52
|
Jin D, Jiao Y, Ji J, Jiang W, Ni W, Wu Y,
Ni R, Lu C, Qu L, Ni H, et al: Identification of prognostic risk
factors for pancreatic cancer using bioinformatics analysis. PeerJ.
8:e93012020. View Article : Google Scholar : PubMed/NCBI
|
|
53
|
Cong L, Bai Z, Du Y and Cheng Y: Citron
rho-interacting serine/threonine kinase promotes HIF1a-CypA
signaling and growth of human pancreatic adenocarcinoma. Biomed Res
Int. 2020:92108912020. View Article : Google Scholar : PubMed/NCBI
|
|
54
|
Nicolle R, Raffenne J, Paradis V,
Couvelard A, de Reynies A, Blum Y and Cros J: Prognostic biomarkers
in pancreatic cancer: Avoiding errata when using the TCGA dataset.
Cancers (Basel). 11:1262019. View Article : Google Scholar : PubMed/NCBI
|
|
55
|
Wittel UA, Lubgan D, Ghadimi M, Belyaev O,
Uhl W, Bechstein WO, Grützmann R, Hohenberger WM, Schmid A,
Jacobasch L, et al: Consensus in determining the resectability of
locally progressed pancreatic ductal adenocarcinoma-results of the
Conko-007 multicenter trial. BMC Cancer. 19:9792019. View Article : Google Scholar : PubMed/NCBI
|
|
56
|
Rush A, Spring K and Byrne JA: A critical
analysis of cancer biobank practices in relation to biospecimen
quality. Biophys Rev. 7:369–378. 2015. View Article : Google Scholar : PubMed/NCBI
|
|
57
|
Wittel UA, Lubgan D, Ghadimi M, Belyaev O,
Uhl W, Bechstein WO, Grützmann R, Hohenberger WM, Schmid A,
Jacobasch L, et al: Consensus in determining the resectability of
locally progressed pancreatic ductal adenocarcinoma-results of the
Conko-007 multicenter trial. BMC Cancer. 19:9792019. View Article : Google Scholar : PubMed/NCBI
|
|
58
|
O'Hurley G, Sjöstedt E, Rahman A, Li B,
Kampf C, Pontén F, Gallagher WM and Lindskog C: Garbage in, garbage
out: A critical evaluation of strategies used for validation of
immunohistochemical biomarkers. Mol Oncol. 8:783–798. 2014.
View Article : Google Scholar
|
|
59
|
Maier T, Guell M and Serrano L:
Correlation of mRNA and protein in complex biological samples. FEBS
Lett. 583:3966–3973. 2009. View Article : Google Scholar : PubMed/NCBI
|