Introduction
Colorectal cancer (CRC) is one of the most common
types of cancer, with >1.8 million new cases diagnosed worldwide
every year, resulting in 881,000 fatalities (1). The occurrence of CRC is driven by
mutations of tumor suppressor genes, oncogenes and genes associated
with DNA repair (2), and it can be
classified as sporadic, hereditary or familial. Colorectal
carcinogenesis is characterized as a multi-step, multi-mechanism
process in which tumor initiation and progression occur via a
progressive accumulation of genetic mutations (3). Understanding tumor progression in CRC
at the molecular level is important for facilitating diagnosis and
therapeutic intervention.
Heat shock protein 60 (HSP60) is a major
ATP-dependent mitochondrial chaperone and is well-conserved from
bacteria to mammals. Previous studies have revealed that HSP60
serves an important role in the pathology of complex diseases, such
as neurodegenerative disorders, atherosclerosis and heart disease,
as well as multiple inflammatory diseases (4–6). The
effects of HSP60 expression on cancer progression have been
extensively studied and suggest that HSP60 is either pro-survival
or pro-apoptotic in different types of tumor (7–12). Our
previous study has indicated that HSP60 expression is downregulated
in clear cell renal cell carcinoma (ccRCC) tissues compared with in
paracancerous tissues (13). HSP60
overexpression in ccRCC cells inhibits proliferation, while
HSP60-knockdown promotes cell proliferation in both cell culture
and nude mouse xenografts. Additionally, HSP60-knockdown activates
the AMPK signaling pathway, which promotes acquisition of the
Warburg phenotype in ccRCC cells (14). In addition, HSP60 promotes tumor cell
proliferation and metastasis (8–10) and is
highly expressed in colorectal, ovarian and prostate cancer
(12,15,16).
However, it is unclear whether HSP60-knockdown activates the AMPK
signaling pathway and inhibits proliferation in CRC cells.
To determine the effects of HSP60 expression on CRC
tumor progression, stable HCT116 cells with HSP60-knockdown were
constructed in the present study. The current study demonstrated
how HSP60-knockdown affected proliferation of HCT116 cells via
proteomic and metabolic analysis, and validated the regulation of
the adenine-AMPK-mTOR signaling pathway in HSP60-knockdown CRC
cells. The current results suggested that HSP60 may be a potential
target for CRC therapy.
Materials and methods
Cell lines and culture
The human colon cancer cell line (HCT116) and 293T
cell line were purchased from the Cell Bank of Type Culture
Collection of the Chinese Academy of Sciences, and the cells were
grown in McCoy's 5A medium (Gibco; Thermo Fisher Scientific, Inc.)
supplemented with 10% FBS (Wisent, Inc.) and 1%
penicillin/streptomycin (Wisent, Inc.). The cells were cultured at
37°C with 5% CO2. Mycoplasma testing was performed for
the cell lines used.
Establishment of a stable cell line
with HSP60-knockdown
The HSP60-knockdown stable cell line was established
based on a previously published protocol (17). Two short hairpin (sh)RNAs (KD1 and
KD2) specifically targeting HSPD1 were chosen (17), and a scramble shRNA was used as
negative control (sequences shown in Table SI). Restriction sites were created
on the double-strand shRNAs and pLL3.7 vector (Addgene, Inc.; cat.
no. 11795) and the shRNAs were inserted into plasmid pLL3.7
lentivirus vectors with T4 DNA ligase (cat. no. EL0011; Thermo
Fisher Scientific, Inc,). pLL3.7-shRNAs (20 µg; 1.33 µg/ml) were
co-transfected with pMD2.G, pMDLg/p RRE and pREV-Rev (preserved in
our laboratory) into 293T cells using polyethyleneimine
(Sigma-Aldrich; Merck KGaA) when cells reached 60–70% confluence.
Cells were incubated at 37°C with 5% CO2. After 72 h,
supernatants were harvested with PEG6000 (Tokyo Chemical Industry
Co., Ltd.) and were used to infect HCT116 cells with 6 µg/ml
polybrene at 37°C for 6 h when cells reached 30–40% confluence.
After 48 h, infected cells were sorted by a flow cytometer
(FACSCalibur; BD Biosciences) to generate the monoclonal stable
cell line. The clones with the uniform GFP expression were selected
in the present study (data not shown).
Detection of cell proliferation by
cell counting Kit-8 (CCK-8) assay
HCT116 cells were seeded in a 96-well plate (2,000
cells/well). The proliferation rate was determined using the CCK-8
assay according to the manufacturer's instructions (Dojindo
Molecular Technologies, Inc.). Briefly, the CCK-8 reagent was added
into each well after 0, 12, 24, 36, 48, 72, 84, 96 and 108 h of
cell culture. Absorbance at 450 nm was measured 2 h after CCK-8
addition.
Xenograft experiments
All animal studies were approved by the Animal
Research Ethics Committee of the Tsinghua University (Beijing,
China). The mice were housed with free access to food and water in
a temperature- and light-regulated pathogen-free room at Tsinghua
University Animal Facilities (temperature, 24±1°C; humidity, 60±5%;
12-h light/dark cycle). The protocols used in the present study
were approved by the Institutional Animal Care and Use Committee
(IACUC) of Tsinghua University and were performed in accordance
with the IACUC guidelines. The humane endpoint was tumor burden
>15 mm at the largest dimension. Carbon Dioxide Euthanasia for
Mice (BU ASC Guidelines) (17) was
used to provide a rapid, painless, stress-free death.
CO2 overdose causes rapid unconsciousness followed by
death. A gradual CO2 fill rate of 10–30% of the chamber
volume per minute was used when euthanizing mice. A total of
5×10⁶ control cells (transfected with the negative
control shRNA) or HSP60-KD1 or HSP60-KD2 cells were resuspended
with PBS and subcutaneously injected into five 5-week-old nude male
mice for each group (15 mice in total; weight, 19.9–23.4 g; Beijing
Vital River Laboratory Animal Technology Co., Ltd.). Tumor size was
quantified by fluorescence imaging using an in vivo imaging
system (PerkinElmer, Inc.) to measure the GFP fluorescence
intensity of tumors in mice. 20 days after injection, The tumor
volume was calculated as π/6 × length (mm) × width (mm) × height
(mm).
Quantitative proteomic analysis and
metabolomic analysis
Quantitative proteomic analysis was performed as
previously described (3). Tandem
Mass Tag (TMT) reagents were purchased from Thermo Fisher
Scientific, Inc., and peptides were labeled according to the
manufacturer's instructions (Thermo Fisher Scientific, Inc.). The
labeled peptides were mixed and desalted on a SEP Pak C18 column
(Waters Corporation) and separated by reverse phase chromatography.
Orbitrap Q-Exactive mass spectrometer (Thermo Fisher Scientific,
Inc.) and Xcalibur 3.0 software (Thermo Fisher Scientific, Inc.)
were applied with data-dependent acquisition mode. Proteomic
analysis of cell lines was performed in four biological replicates.
The MS/MS spectra were searched using the search engine SEQUEST
from Proteome Discoverer Software (version 2.1; Thermo Fisher
Scientific, Inc.) against UniProt human database. Metabolomic
analysis was performed according to a previous study (7). TSQ Quantiva™ Triple Quadrupole Mass
Spectrometer (Thermo Fisher Scientific, Inc.) with
positive/negative ion switching for targeted quantitation with
selective reaction monitoring was used. C18 based reverse phase
chromatography was utilized with 10 mM tributylamine, 15 mM acetate
in water and 100% methanol as mobile phase A and B, respectively.
The source voltage was 3,500 V for positive and 2,500 V for
negative ion mode. The source parameters were as follows: Spray
voltage, 3,000 V; capillary temperature, 320°C; heater temperature,
300°C; sheath gas flow rate, 35 units; auxiliary gas flow rate, 10
units. Metabolite identification was based on TraceFinder software
(Version 3.2; Thermo Fisher Scientific, Inc.) with a home-built
database containing ~300 compounds. Ingenuity Pathway Analysis
(IPA) software (version 2.0; Qiagen, Inc.) was used to perform
pathway analysis.
Western blotting
Cells were lysed with lysis buffer (20 mmol/l
Tris-HCl pH 7.5, 150 mmol/l NaCl, 1% Triton X-100, 1% sodium
pyrophosphate and Protease Inhibitor Cocktail) for 30 min on ice.
The supernatant was collected by centrifugation at 13,800 × g for
20 min at 4°C. Protein concentrations were determined using the BCA
protein assay kit. Proteins (40 µg protein/lane) were separated via
12% SDS-PAGE and transferred onto a PVDF membrane. The membrane was
blocked with 5% skim milk powder in TBST solution at room
temperature for 1 h. Anti-β-actin (cat. no. AC038; 1:5,000),
anti-HSP60 (cat. no. A0564), anti-AMPKα (cat. no. A1229),
anti-phospho (p)-AMPKα (Thr172; cat. no. AP0116), anti-Raptor (cat.
no. A8992), anti-p-Raptor (Ser792; cat. no. AP0928),
anti-eukaryotic translation initiation factor 4E binding protein 1
(4EBP1; cat. no. A19045) and anti-p-4EBP1 (Thr37/46) primary
antibodies were obtained from ABclonal Biotech Co., Ltd. Antibodies
against mTOR (cat. no. 2983), p-mTOR (Ser2448; cat. no. 5536),
Bcl-2/adenovirus E1B 19-kDa interacting protein 3 (BNIP3; cat. no.
44060) and Parkin (cat. no. 2132), as well as HRP-conjugated
anti-rabbit (cat. no. 7074) and anti-mouse IgG (cat. no. 7076)
secondary antibodies were obtained from Cell Signaling Technology,
Inc. Antibodies against p70S6 kinase (p70S6K; cat. no. S4047) and
p-p70S6K (T421/S424; cat. no. S6436) were obtained from
Sigma-Aldrich. Dilution rates for all antibodies, except for the
anti-β-actin antibody, were 1:1,000. Primary antibodies were
incubated at 4°C overnight, while secondary antibodies were
incubated at room temperature for 1 h. The visualization reagent
was part of an enhanced chemiluminescent kit (Beijing Solarbio
Science & Technology Co., Ltd.).
Statistical analysis
At least three biological replicates were performed
for all in vitro assays, and the data were presented as the
mean ± SEM. Statistical analysis was performed using GraphPad Prism
7.0 software (GraphPad Software, Inc.). One-way or two-way ANOVA
was used for the comparison of multiple groups followed by
Bonferroni's correction, Benjamini-Hochberg method or Dunnett's
test. Wilcoxon rank-sum test was used to determine the significance
of the differences in Gene Expression Profiling Interactive
Analysis (GEPIA; http://gepia.cancer-pku.cn/). Fisher's exact test was
used for pathway enrichment analysis. The cut-off values for
downregulated proteins were fold-change ≤0.76 and P<0.05; and
those for upregulated proteins were fold-change ≥1.3 and P<0.05.
P<0.05 was considered to indicate a statistically significant
difference.
Results
HSP60-knockdown inhibits the
proliferation of CRC cells
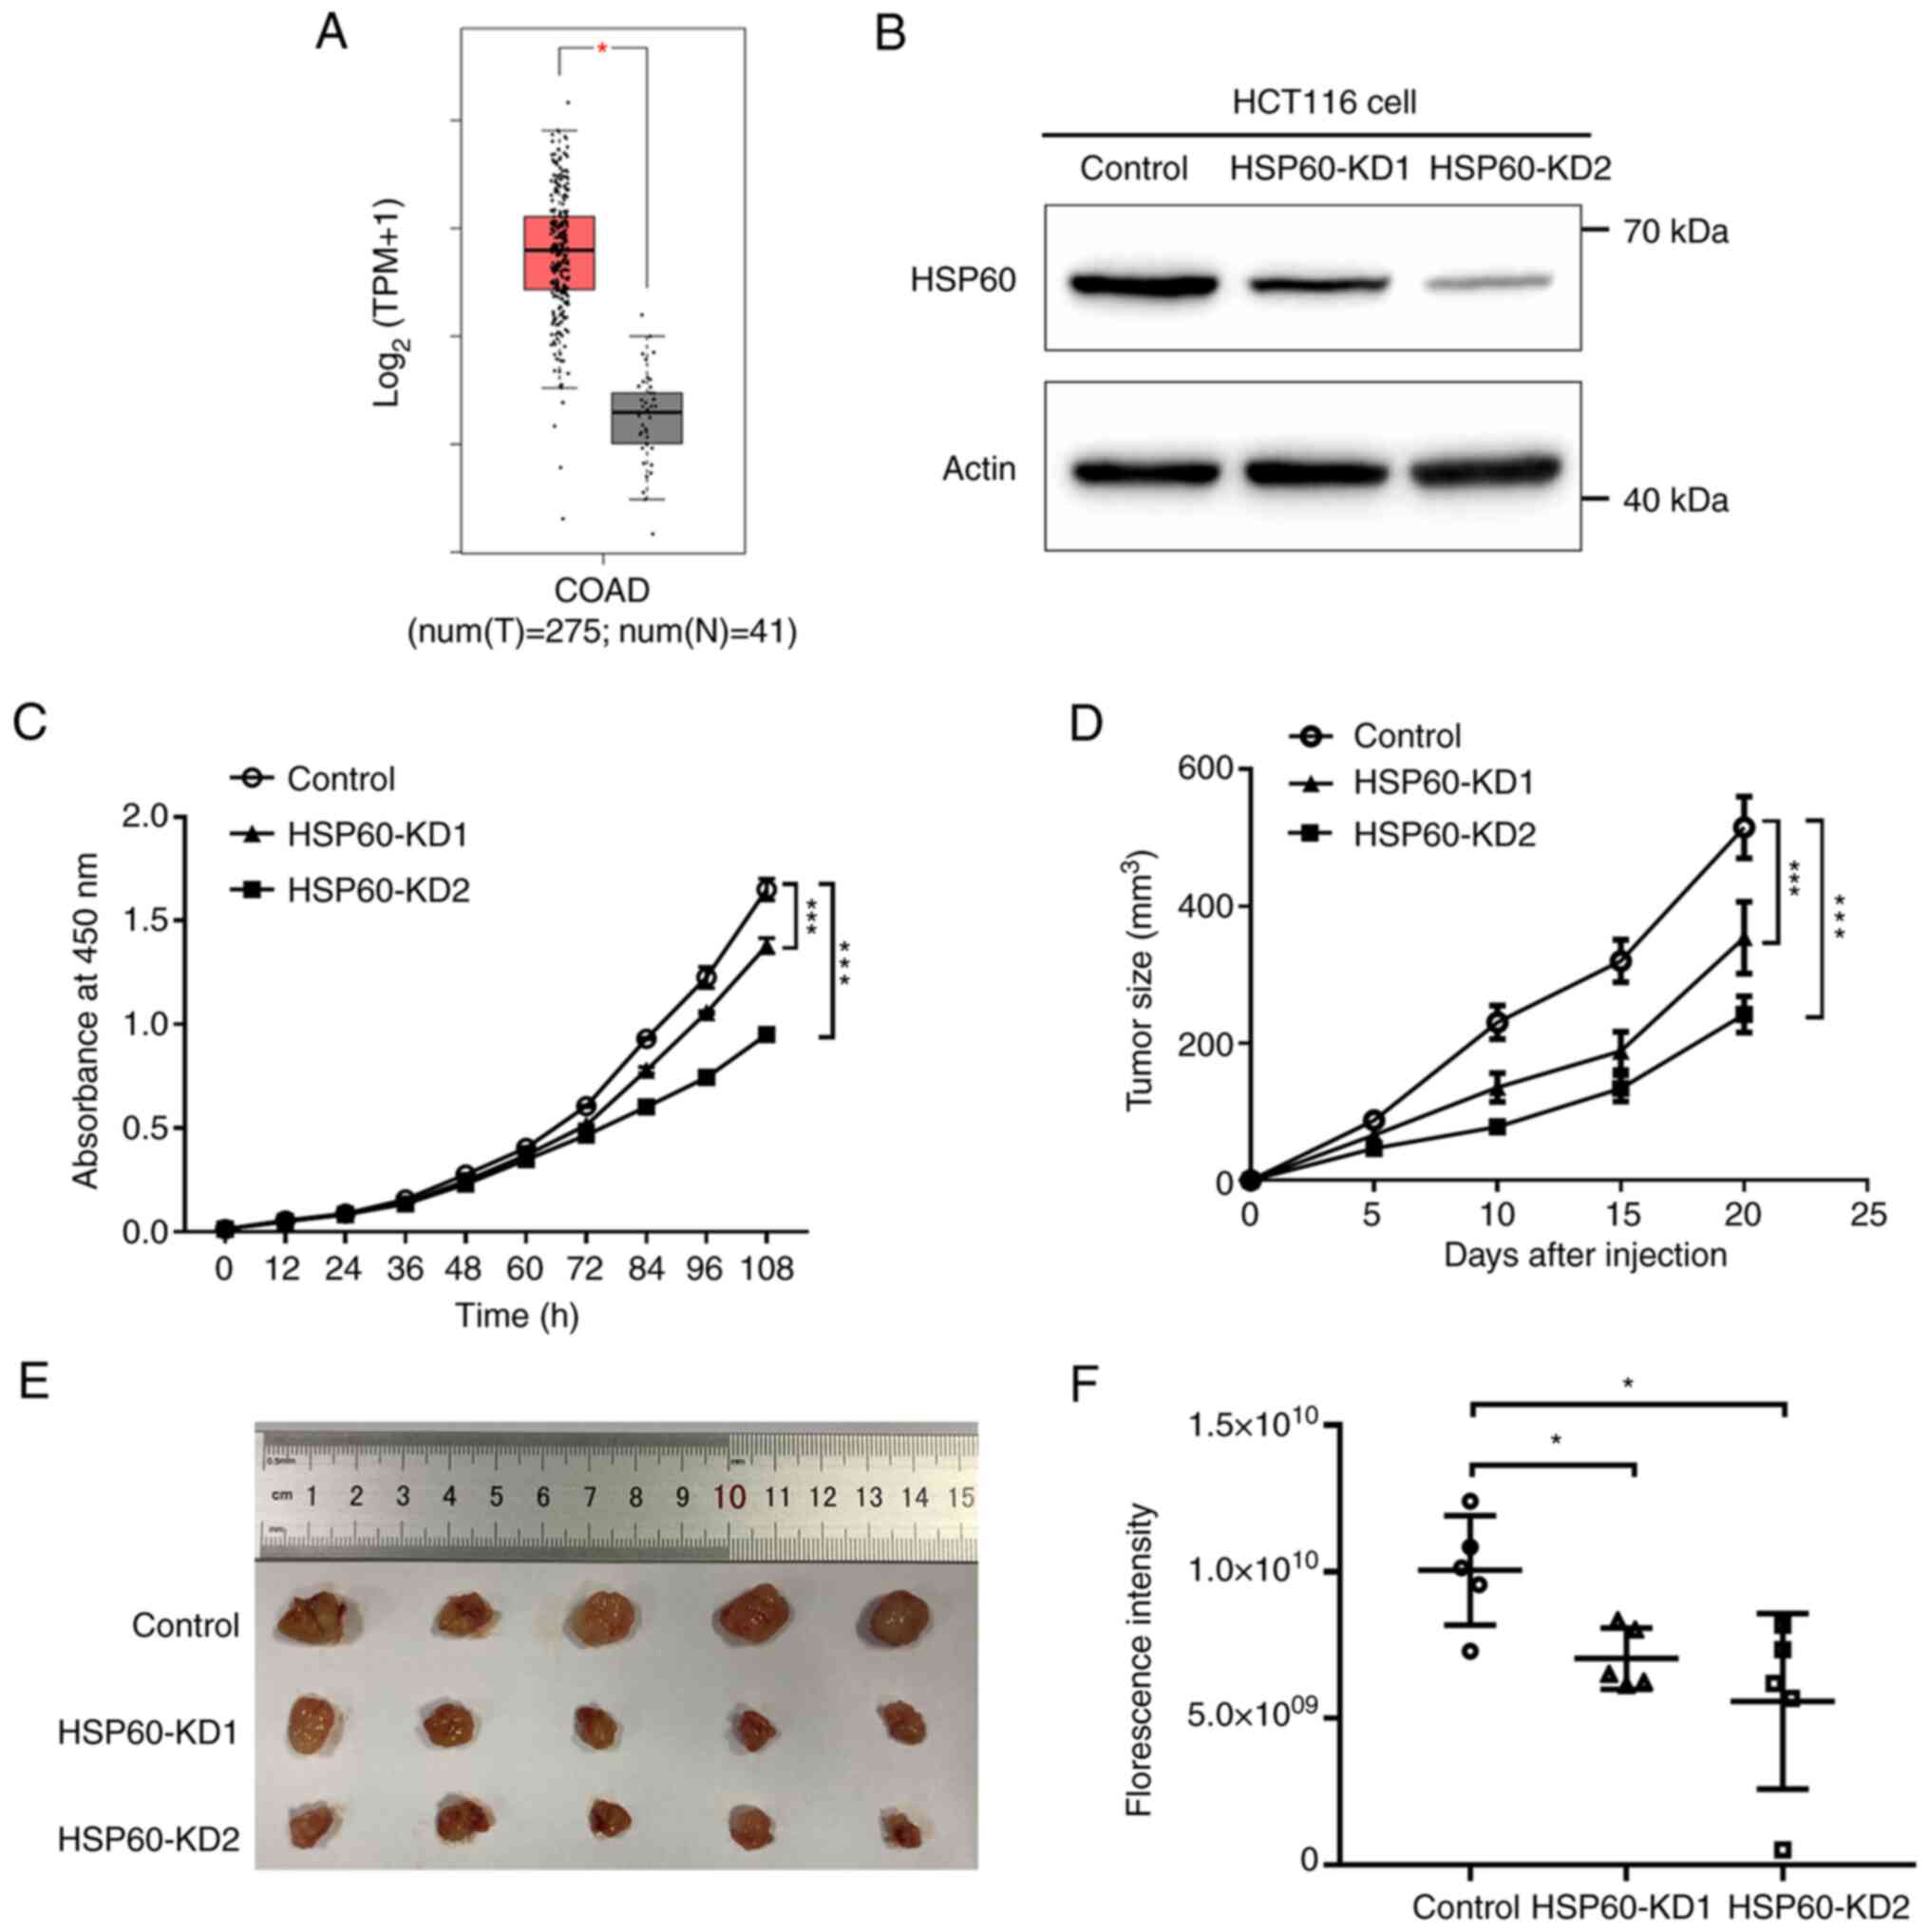
GEPIA (18) revealed
that HSP60 expression in tumor samples was significantly higher
than that in paired normal tissues from patients with CRC,
suggesting that HSP60 may be required for tumor progression
(Fig. 1A). To explore the effects of
HSP60-knockdown on the progression of CRC, stable HSP60-knockdown
cells were established using HSP60-directed shRNAs in human CRC
HCT116 cells. Cells transfected with scrambled shRNA that had no
homology in the human genome were used as the negative control.
HSP60 expression in these cells was examined by western blotting,
confirming that HSP60 expression was significantly silenced in
HSP60-KD1 and HSP60-KD2 cells (Fig.
1B). HSP60 expression in HSP60-KD2 cells was markedly lower
than in HSP60-KD1 cells (Fig.
1B).
The proliferation rates of HSP60-knockdown cells
were then measured using CCK-8 assay. HSP60-knockdown significantly
inhibited the proliferation rate of HCT116 cells (Fig. 1C). Additionally, the proliferation
rate of HSP60-KD2 cells was slower than that in HSP60-KD1 cells,
indicating that HSP60 expression was positively associated with the
proliferation rate. Subsequently, HSP60-KD1 and -KD2 cells were
subcutaneously injected into 5-week-old immunodeficient mice to
verify whether HSP60-knockdown inhibited tumor growth. Vernier
calipers were used to calculate tumor volume 20 days after
injection via measuring the major and minor diameters of tumors.
The results indicated that HSP60-knockdown significantly decreased
tumor size compared with the control cells (Fig. 1D and E). Since HSP60-KD1 and -KD2
cells stably expressed GFP, the tumor volume of subcutaneous mouse
xenografts was measured using fluorescence imaging. The
fluorescence intensity of HSP60-KD1 and -KD2 tumors was
significantly lower than that in control tumors (Figs. 1F and S1). These results indicated that
HSP60-knockdown slowed the proliferation of CRC cells in
vitro and in vivo, and that HSP60 expression was
positively associated with tumor growth.
HSP60-knockdown disrupts mitochondrial
proteostasis
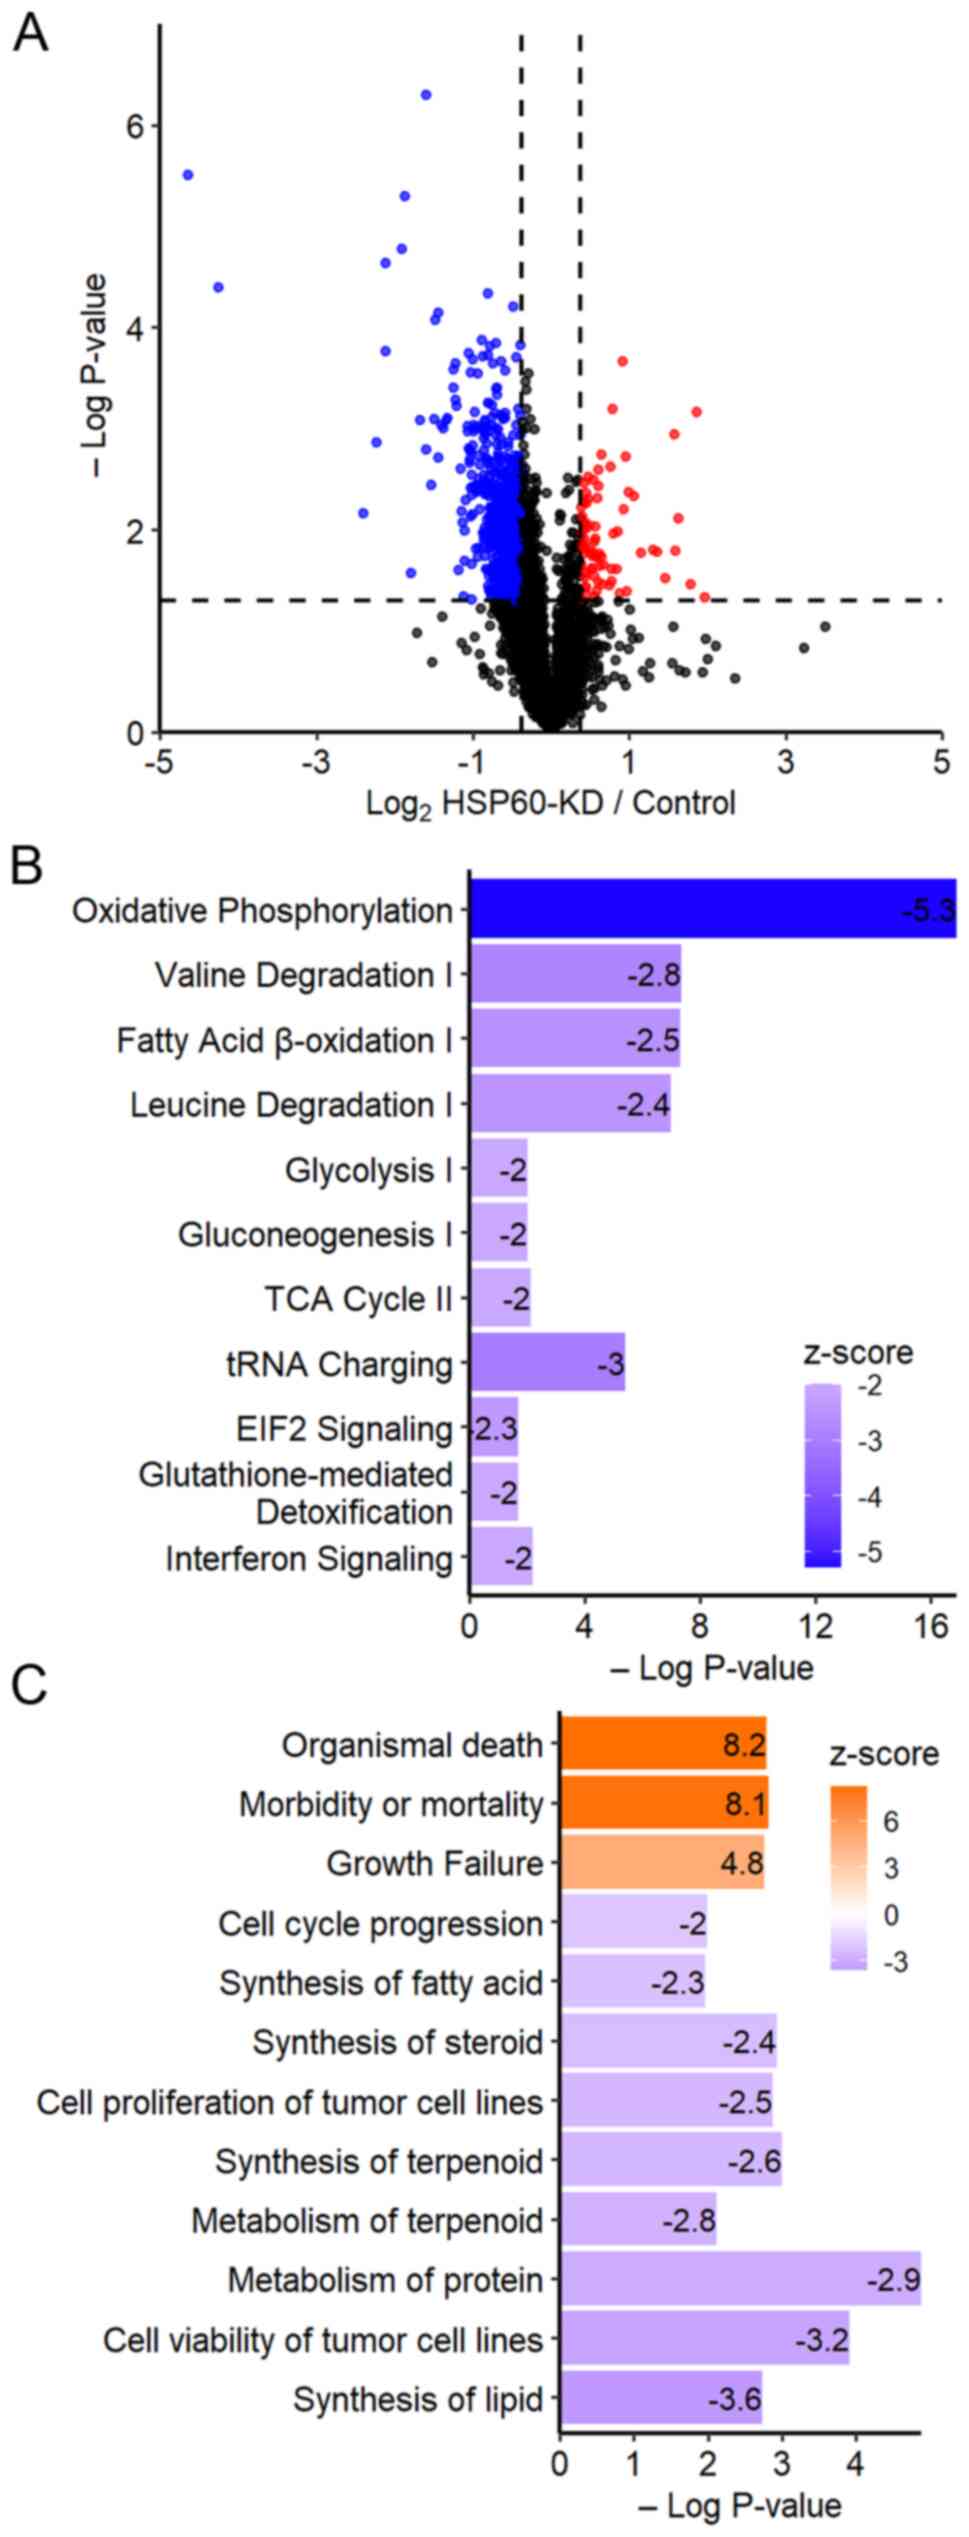
To explore how HSP60-knockdown inhibited the
proliferation of CRC cells, a TMT-based quantitative proteomic
analysis was performed to identify differentially expressed
proteins between HSP60-knockdown and control cells. The analysis
quantified a total of 5,590 proteins. Based on the cut-off
threshold for determining the differentially expressed proteins,
575 proteins were considered to be downregulated (fold change
≤0.76; P<0.05), while 53 proteins were upregulated (fold change
≥1.3; P<0.05) (Fig. 2A).
IPA indicated that 11 cancer-associated pathways
were significantly inhibited in HSP60-knockdown cells (Fig. 2B). Inhibition of ‘oxidative
phosphorylation’ suggested that HSP60-knockdown may cause
mitochondrial dysfunction (19),
while inhibition of ‘tRNA charging’ and ‘EIF2 signaling’ implied
that HSP60-knockdown may inhibit protein synthesis (20). Other signaling pathways inhibited in
HSP60-knockdown cells included ‘valine degradation’, ‘fatty acid
b-oxidation’, ‘leucine degradation’, ‘glycolysis’,
‘gluconeogenesis’, ‘TCA cycle’, ‘glutathione-mediated
detoxification’ and ‘interferon signaling’ (Fig. 2B). From the Disease and Function
Analysis in IPA, it was revealed that the functions associated with
‘organismal death’, ‘morbidity or mortality’, and ‘growth failure’
were activated in HSP60-knockdown cells (z-score >2; P<0.05;
Fig. 2C). Other disease-associated
pathways that were inactivated included ‘synthesis of lipid’ and
‘cell viability of tumor cell lines’, ‘metabolism of protein’,
‘metabolism of terpenoid’, ‘cell proliferation of tumor cell
lines’, ‘synthesis of steroid’, ‘synthesis of fatty acid’ and ‘cell
cycle progression’ (z-score <-2; P<0.05; Fig. 2C).
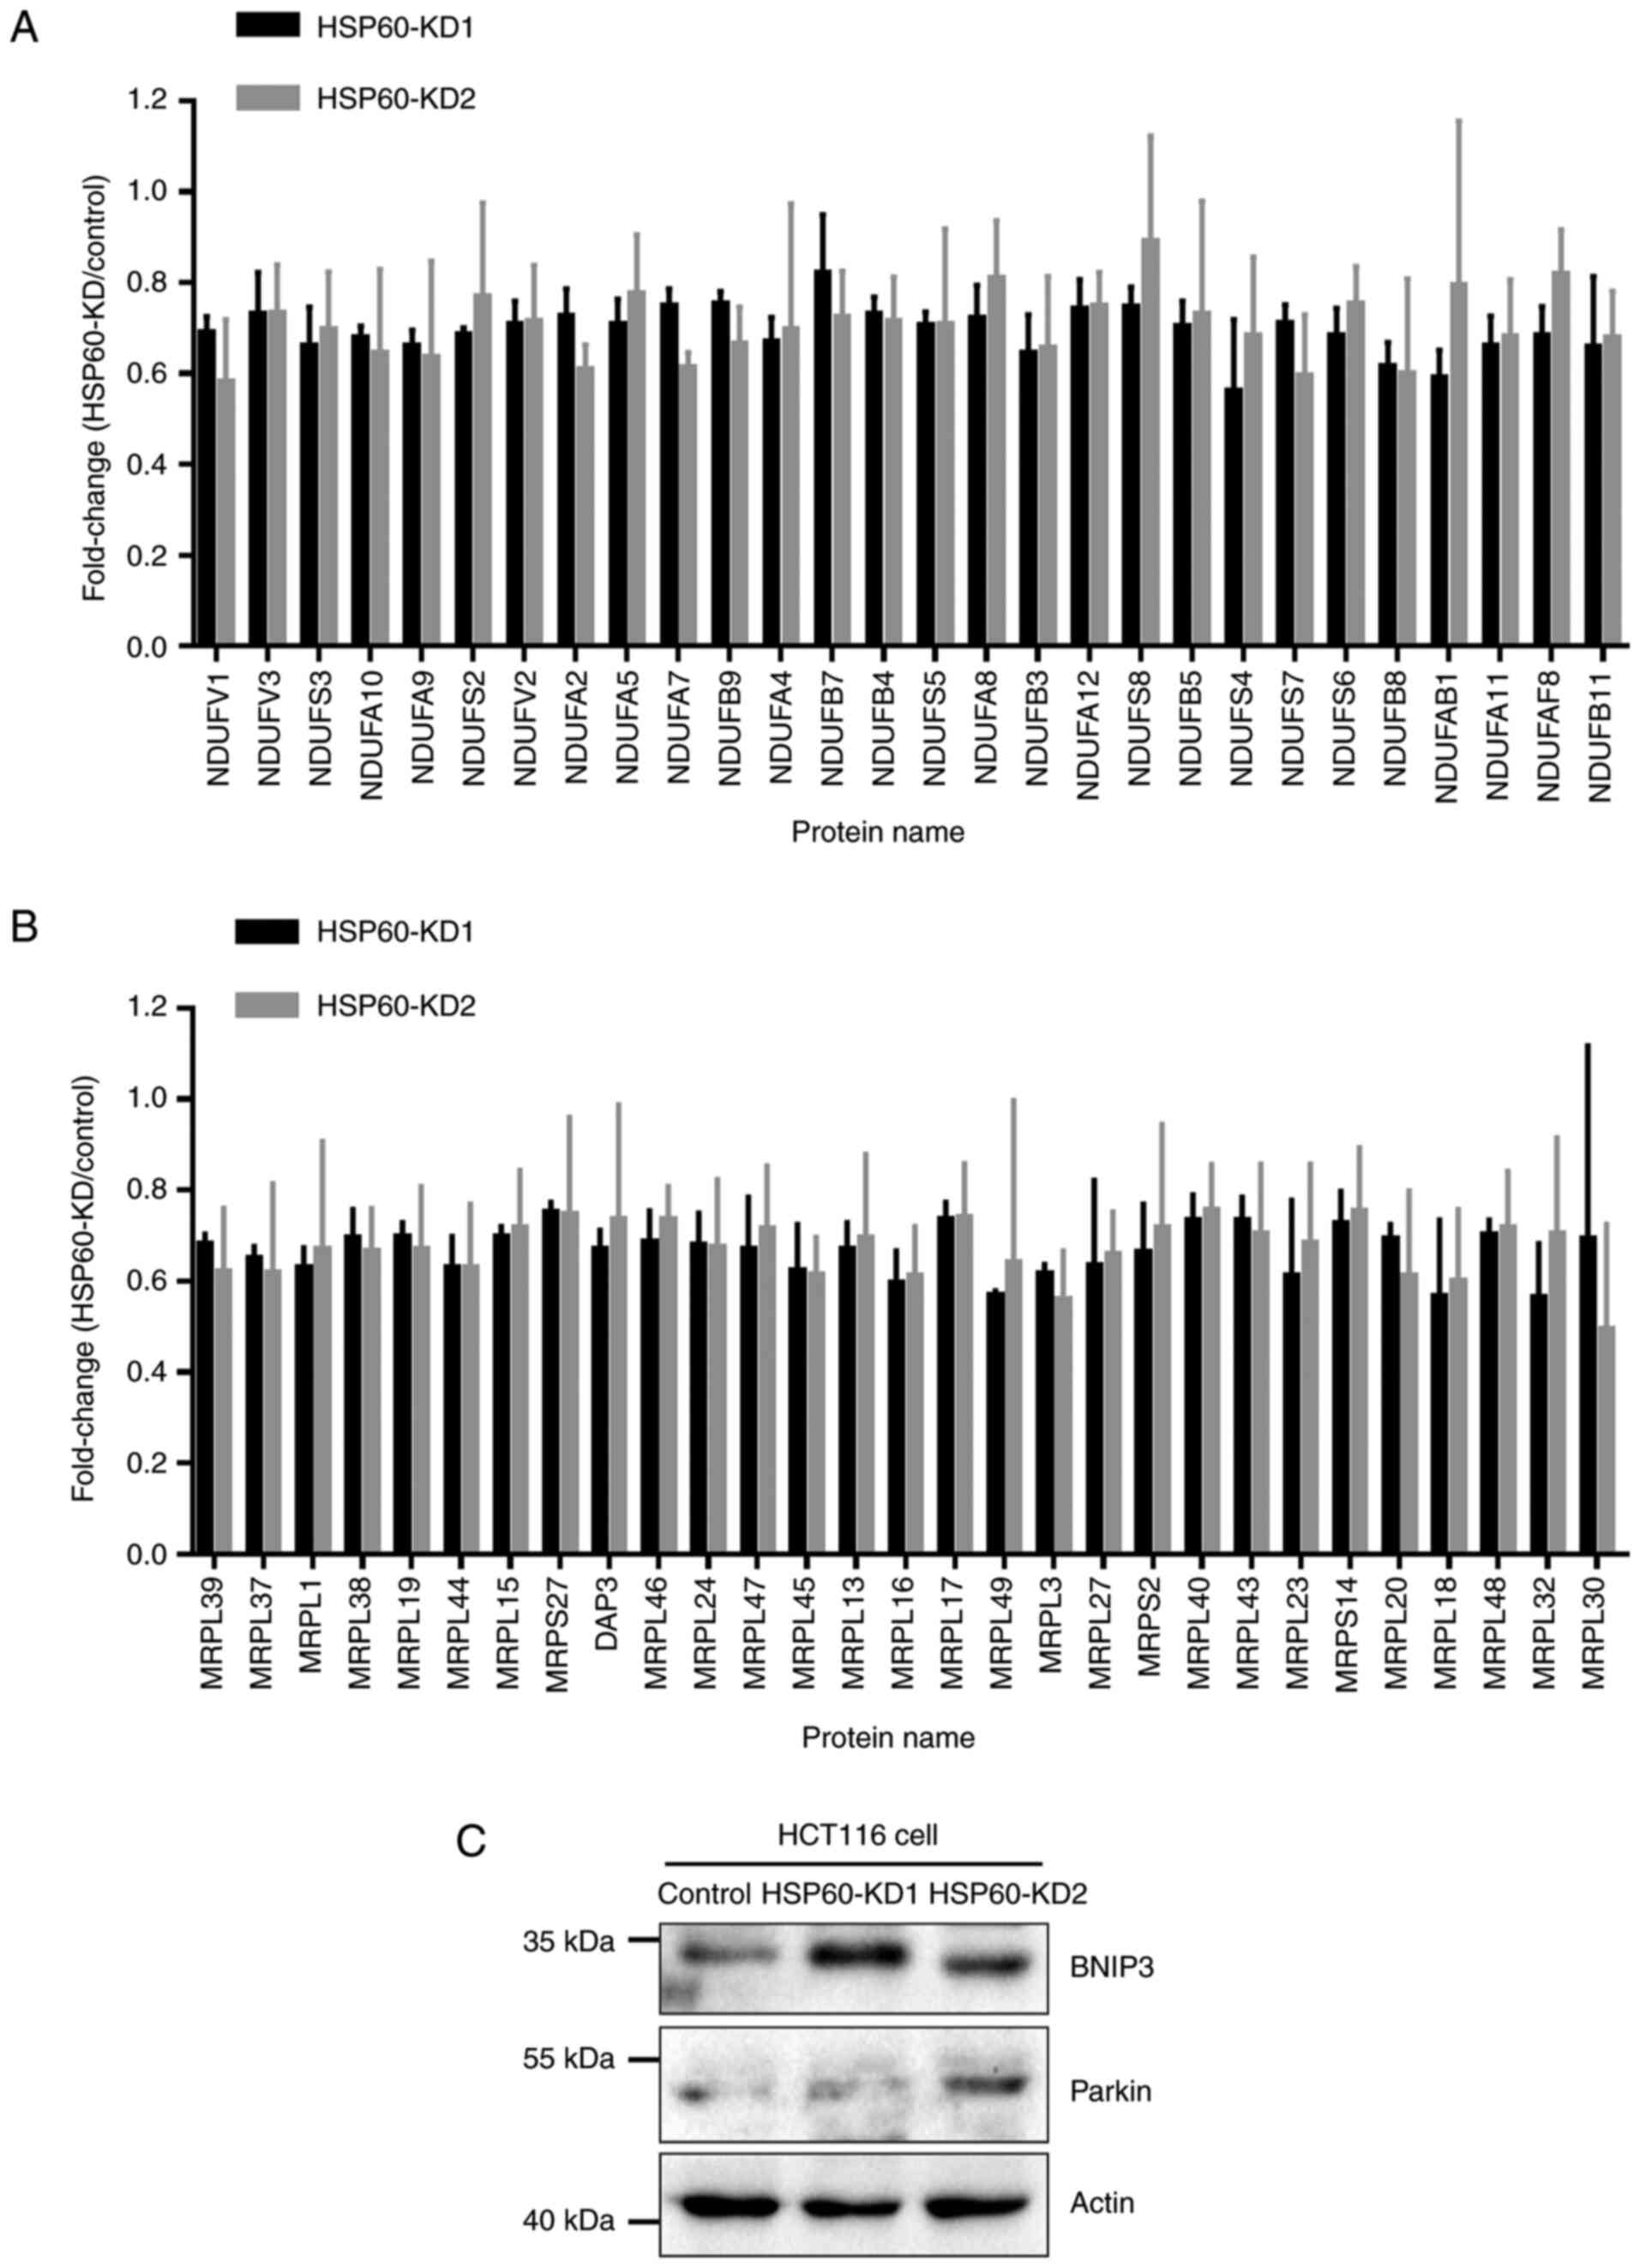
Quantitative proteomic analysis results revealed
that proteins associated with oxidative phosphorylation were
downregulated in HSP60-knockdown cells, in which 28 subunits of
mitochondrial complex I were downregulated in HSP60-KD1 and -KD2
cells compared with in control cells (Fig. 3A). Moreover, quantitative proteomic
analysis results indicated that HSP60-knockdown downregulated 29
mitochondrial ribosomal proteins (MRPs) in HSP60-KD1 and -KD2
HCT116 cells compared with in control cells (Fig. 3B). These results indicated that
HSP60-knockdown disrupted mitochondrial proteostasis and inhibited
oxidative phosphorylation in HCT116 cells. Immunoblotting
experiments confirmed the upregulation of mitochondrial
autophagy-associated proteins, such as BNIP3 and Parkin, following
HSP60-knockdown (Fig. 3C).
HSP60-knockdown in HCT116 cells
inhibits the mTOR signaling pathway through the adenine/AMPK/mTOR
signaling pathway
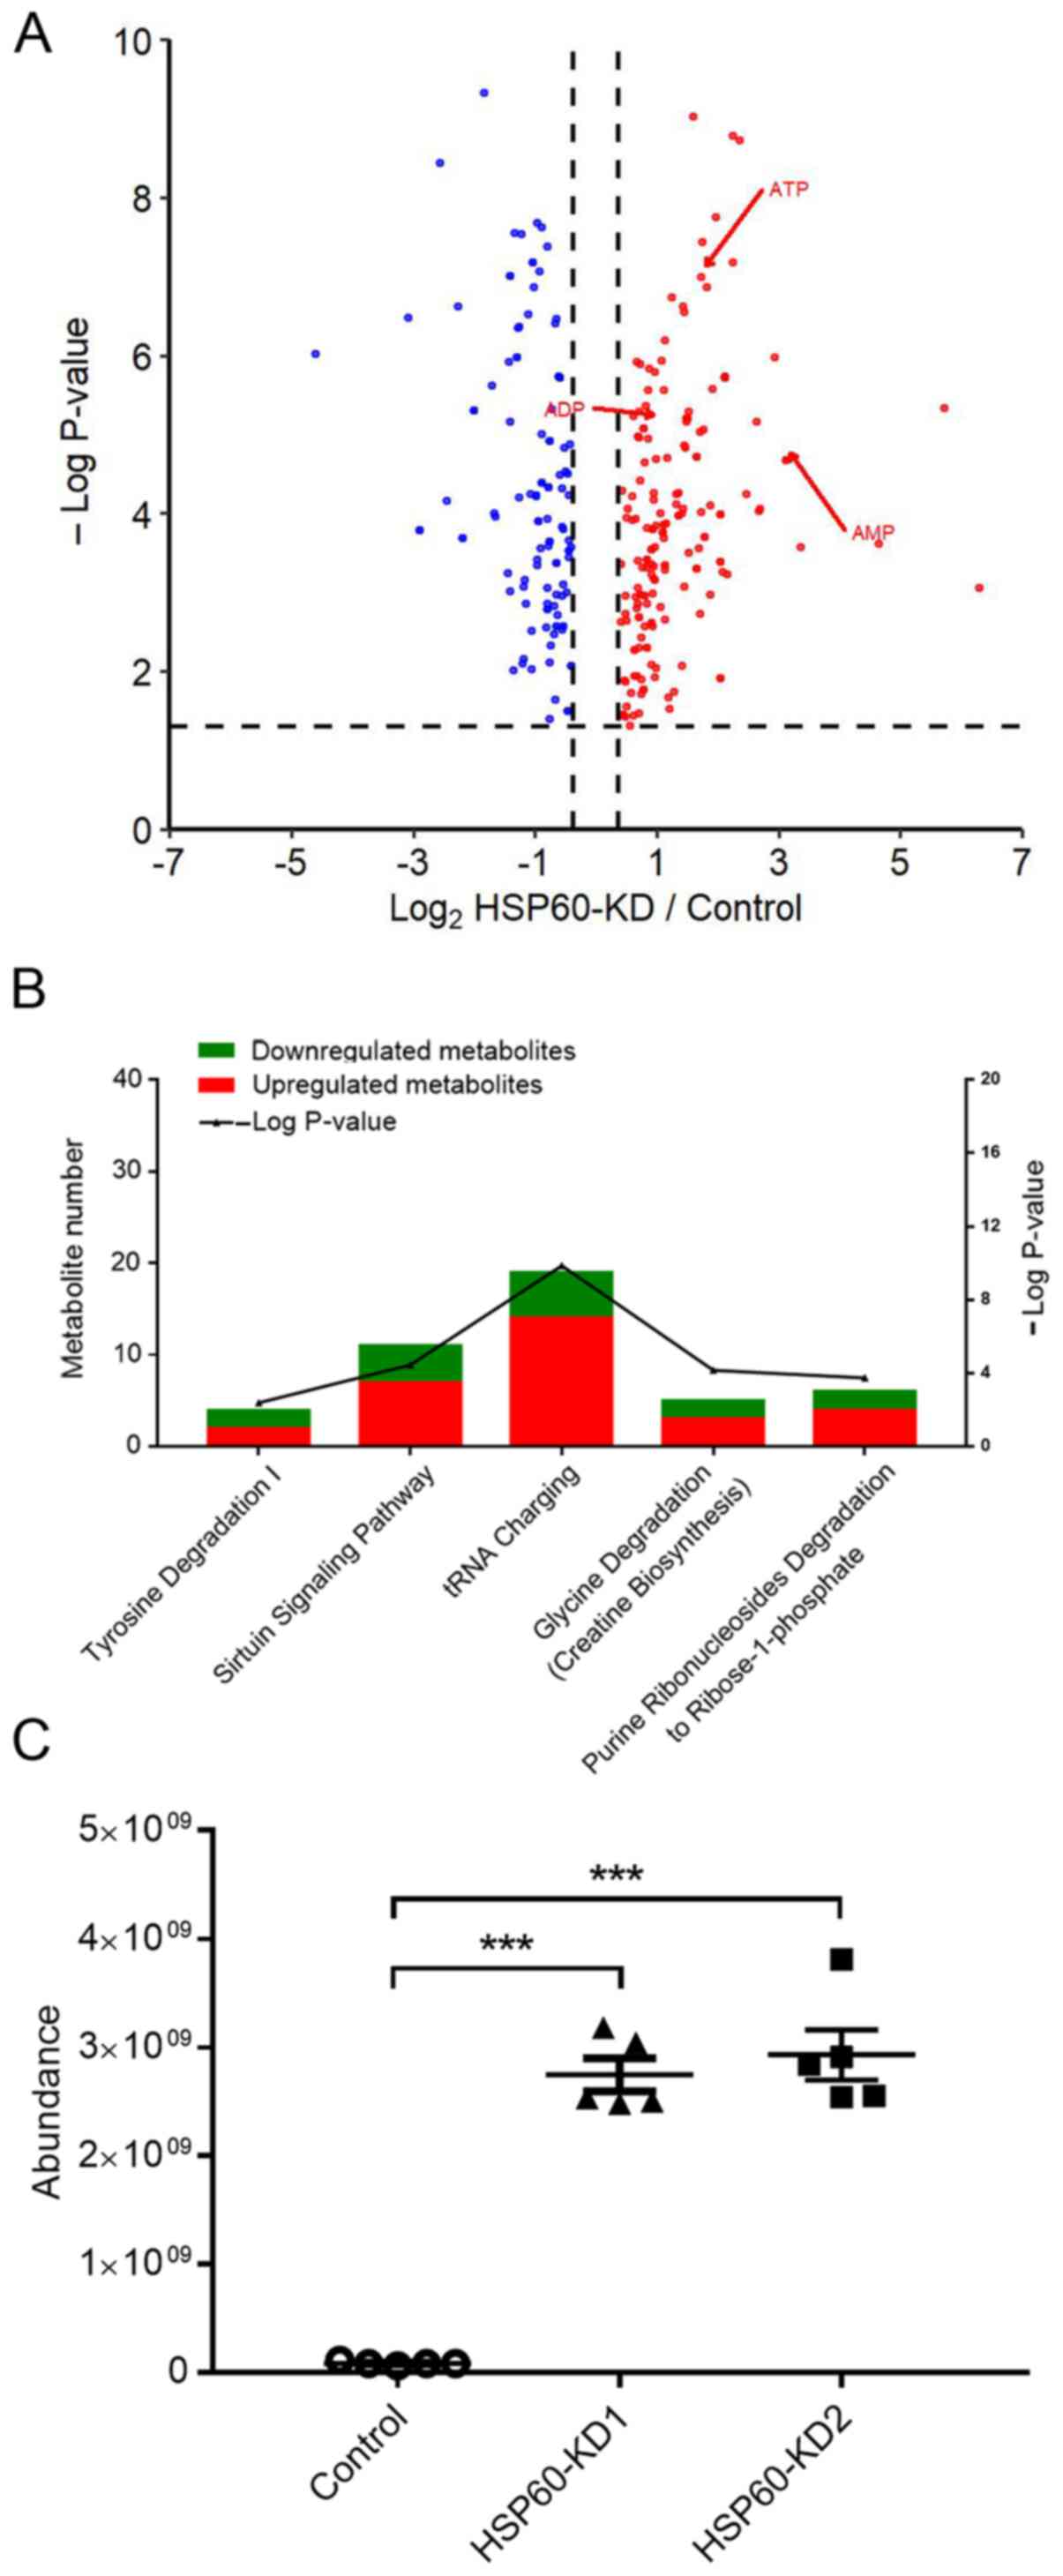
The aforementioned results indicated that
HSP60-knockdown may reprogram cell metabolism. To determine the
metabolic changes in HSP60-knockdown cells and control cells, a
metabolomics analysis was performed in five biological replicates.
Notably, it was revealed that HSP60-knockdown significantly changed
the levels of 297 metabolites in HSP60-KD1 cells (Fig. 4A), supporting the hypothesis that
HSP60-knockdown reprogramed cellular metabolic pathways. IPA
analysis indicated that the following pathways were associated with
the changed metabolites: ‘Tyrosine degradation’, ‘sirtuin signaling
pathway’, ‘tRNA charging’, ‘glycine degradation’ and ‘purine
ribonucleoside degradation to ribose-1-phosphate’ (Fig. 4B). Additionally, the metabolomics
analysis revealed that the adenine level was increased by
>30-fold (Fig. 4C), and cellular
AMP, ADP and ATP were also increased by 6.2-, 2.8- and 2.4-fold,
respectively (Fig. 4A).
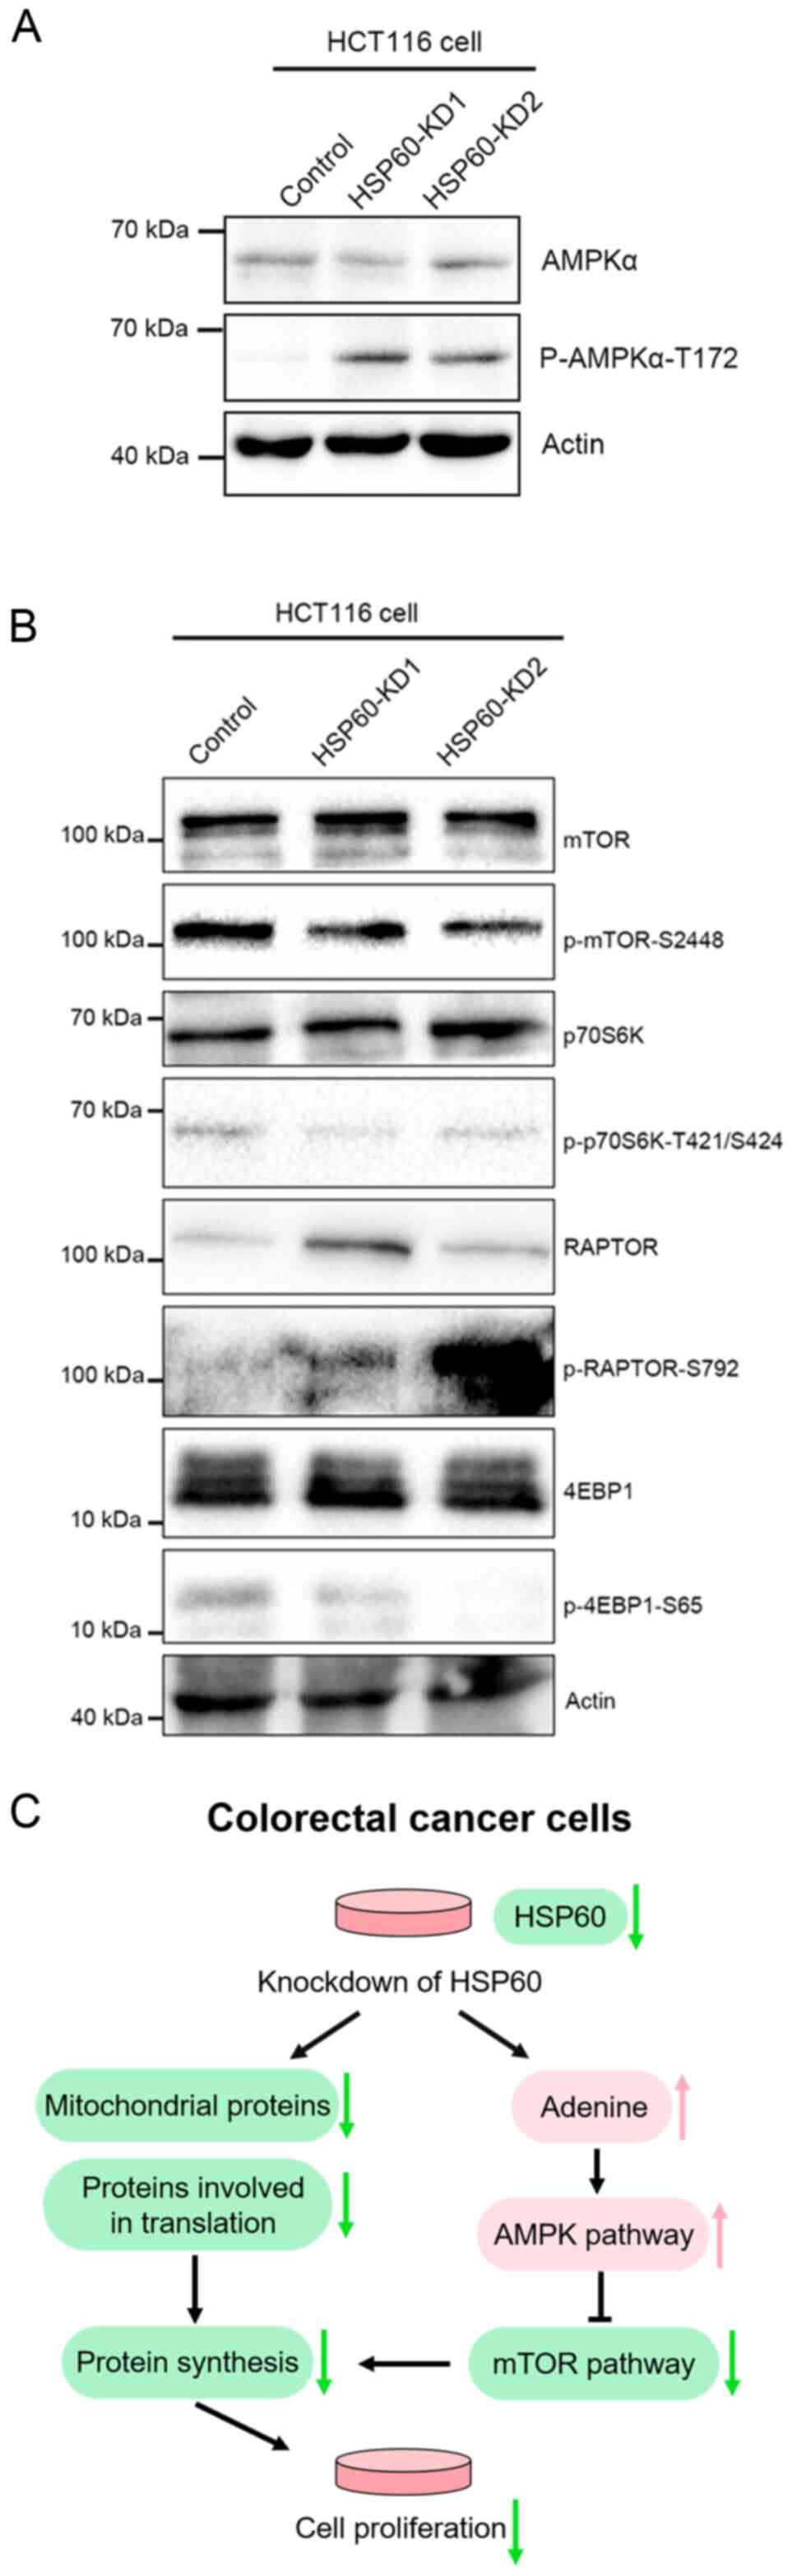
It is known that excess adenine can increase AMP,
which promotes AMPK signaling (21,22). To
confirm that HSP60-knockdown activated the AMPK signaling pathway,
western blotting experiments were performed, revealing that
HSP60-knockdown markedly increased AMPKα phosphorylation at T172
(Fig. 5A), while it decreased
phosphorylation of p70S6k, 4EBP1 and mTOR (Fig. 5B). Additionally, western blotting
revealed an increase in Raptor phosphorylation (Fig. 5B). These results demonstrated that
HSP60-knockdown inactivated the mTOR signaling pathway to inhibit
protein translation.
Discussion
Previous studies have demonstrated that HSP60
suppresses or promotes cell proliferation in a context-dependent
manner. HSP60-knockdown decreases the proliferation rates of
pancreatic cancer cells (23) and
glioblastoma cells (24), while it
increases the proliferation rates of ccRCC cells (13,14).
HSP60-knockdown attenuates pancreatic ductal cancer cell
proliferation and migration/invasion via decreasing Erk1/2
phosphorylation (23), while it
switches the mitochondrial function from ATP production to
biosynthesis in ccRCC cells (14).
Analysis of HSP60 mRNA expression in cancer and normal
tissues in GEPIA revealed that HSP60 was highly expressed in CRC,
suggesting that HSP60 expression may be positively associated with
tumor progression. Consistently, a previous study has demonstrated
that the serum levels of HSP60 protein are significantly higher in
patients with CRC compared with in healthy controls, and serum
HSP60 exhibited the same sensitivity and specificity compared with
carcinoembryonic antigen (25).
Until now, it was unclear whether HSP60-knockdown inhibited the
proliferation of CRC cells. The present study demonstrated that
HSP60-knockdown inhibited the proliferation of CRC cells.
The present study conducted proteomics analysis and
revealed the global effects of HSP60-knockdown on cellular
processes. MRPs and respiratory complex I subunits were identified
to be downregulated following HSP60-knockdown. Metabolomics
analysis indicated that HSP60-knockdown significantly increased
cellular adenine levels and adenine-associated molecules, such as
AMP and ADP, resulting in activation of the AMPK signaling pathway.
The current results revealed that HSP60-knockdown in HCT116 cells
significantly activated AMPKα and inhibited mTOR and its downstream
targets p70S6 kinase and 4EBP1 (Fig.
5C), providing information on the mechanisms underlying
HSP60-knockdown causing adenine accumulation, which requires
further exploration. In our future study, stable cell lines in
which HSP60 is knocked down or overexpressed will be generated from
patient-derived colon cancer cells.
In conclusion, the present results indicated that
high HSP60 expression was important for CRC progression.
HSP60-knockdown inhibited cell proliferation in vitro and in
nude mouse xenografts. Additionally, HSP60-knockdown interrupted
mitochondrial protein homeostasis and caused adenine accumulation,
which activated the AMPK signaling pathway to inhibit protein
translation and cell proliferation. These data provide a valuable
resource for understanding mitochondrial homeostasis in CRC
progression, and HSP60 may be used as a potential therapeutic
target for CRC treatment.
Supplementary Material
Supporting Data
Acknowledgements
Not applicable.
Funding
The present study was supported by Projects of
Shandong Science and Technology Committee (grant no.
2018GSF118159), Natural Science Foundation of Shandong Province
(grant no. ZR2016CL08), Medical and Health Technology Development
Program of Shandong Province (grant no. 2016WS0013) and the Taishan
Scholar Program Foundation of China (grant no. tshw20110515).
Availability of data and materials
The datasets used and/or analyzed during the current
study are available from the corresponding author on reasonable
request.
Authors' contributions
JG, HD and RX conceived and designed the study. JG
performed the experiments. JG, HD and RX wrote the paper. SZ
analyzed the data, reviewed and edited the manuscript. All authors
read and approved the final manuscript and agree to be accountable
for all aspects of the research in ensuring that the accuracy or
integrity of any part of the work are appropriately investigated
and resolved. All authors are responsible for confirming the
authenticity of the raw data.
Ethics approval and consent to
participate
All experimental protocols were approved (approval
no. 17-DHT1) by the Animal Research Ethics Committee of Tsinghua
University (Beijing, China).
Patient consent for publication
Not applicable.
Competing interests
The authors declare that they have no competing
interests.
References
|
1
|
Bray F, Ferlay J, Soerjomataram I, Siegel
RL, Torre LA and Jemal A: Global cancer statistics 2018: GLOBOCAN
estimates of incidence and mortality worldwide for 36 cancers in
185 countries. CA Cancer J Clin. 68:394–424. 2018. View Article : Google Scholar : PubMed/NCBI
|
|
2
|
Fearon ER and Vogelstein B: A genetic
model for colorectal tumorigenesis. Cell. 61:759–767. 1990.
View Article : Google Scholar : PubMed/NCBI
|
|
3
|
de la Chapelle A: Genetic predisposition
to colorectal cancer. Nat Rev Cancer. 4:769–780. 2004. View Article : Google Scholar : PubMed/NCBI
|
|
4
|
Knowlton AA and Srivatsa U: Heat-shock
protein 60 and cardiovascular disease: A paradoxical role. Future
Cardiol. 4:151–161. 2008. View Article : Google Scholar : PubMed/NCBI
|
|
5
|
Hansen JJ, Durr A, Cournu-Rebeix I,
Georgopoulos C, Ang D, Nielsen MN, Davoine CS, Brice A, Fontaine B,
Gregersen N and Bross P: Hereditary spastic paraplegia SPG13 is
associated with a mutation in the gene encoding the mitochondrial
chaperonin Hsp60. Am J Hum Genet. 70:1328–1332. 2002. View Article : Google Scholar : PubMed/NCBI
|
|
6
|
Grundtman C and Wick G: The autoimmune
concept of atherosclerosis. Curr Opin Lipidol. 22:327–334. 2011.
View Article : Google Scholar : PubMed/NCBI
|
|
7
|
Guo J, Li X, Zhang W, Chen Y, Zhu S, Chen
L, Xu R, Lv Y, Wu D, Guo M, et al: HSP60-regulated mitochondrial
proteostasis and protein translation promote tumor growth of
ovarian cancer. Sci Rep. 9:126282019. View Article : Google Scholar : PubMed/NCBI
|
|
8
|
Cappello F, Conway DME, Marasa L, Zummo G
and Macario AJ: Hsp60 expression, new locations, functions and
perspectives for cancer diagnosis and therapy. Cancer Biol Ther.
7:801–809. 2008. View Article : Google Scholar : PubMed/NCBI
|
|
9
|
Ghosh JC, Dohi T, Kang BH and Altieri DC:
Hsp60 regulation of tumor cell apoptosis. J Biol Chem.
283:5188–5194. 2008. View Article : Google Scholar : PubMed/NCBI
|
|
10
|
Tsai YP, Yang MH, Huang CH, Chang SY, Chen
PM, Liu CJ, Teng SC and Wu KJ: Interaction between HSP60 and
beta-catenin promotes metastasis. Carcinogenesis. 30:1049–1057.
2009. View Article : Google Scholar : PubMed/NCBI
|
|
11
|
Ghosh JC, Siegelin MD, Dohi T and Altieri
DC: Heat shock protein 60 regulation of the mitochondrial
permeability transition pore in tumor cells. Cancer Res.
70:8988–8993. 2010. View Article : Google Scholar : PubMed/NCBI
|
|
12
|
Cappello F, Bellafiore M, Palma A, David
S, Marciano V, Bartolotta T, Sciume C, Modica G, Farina F, Zummo G
and Bucchieri F: 60KDa chaperonin (HSP60) is over-expressed during
colorectal carcinogenesis. Eur J Histochem. 47:105–110. 2003.
View Article : Google Scholar : PubMed/NCBI
|
|
13
|
Tang H, Chen Y, Liu X, Wang S, Lv Y, Wu D,
Wang Q, Luo M and Deng H: Downregulation of HSP60 disrupts
mitochondrial proteostasis to promote tumorigenesis and progression
in clear cell renal cell carcinoma. Oncotarget. 7:38822–38834.
2016. View Article : Google Scholar : PubMed/NCBI
|
|
14
|
Teng R, Liu Z, Tang H, Zhang W, Chen Y, Xu
R, Chen L, Song J, Liu X and Deng H: HSP60 silencing promotes
Warburg-like phenotypes and switches the mitochondrial function
from ATP production to biosynthesis in ccRCC cells. Redox Biol.
24:1012182019. View Article : Google Scholar : PubMed/NCBI
|
|
15
|
Hjerpe E, Egyhazi S, Carlson J, Stolt MF,
Schedvins K, Johansson H, Shoshan M and Avall-Lundqvist E: HSP60
predicts survival in advanced serous ovarian cancer. Int J Gynecol
Cancer. 23:448–455. 2013. View Article : Google Scholar : PubMed/NCBI
|
|
16
|
Cappello F, Rappa F, David S, Anzalone R
and Zummo G: Immunohistochemical evaluation of PCNA, p53, HSP60,
HSP10 and MUC-2 presence and expression in prostate carcinogenesis.
Anticancer Res. 23:1325–1331. 2003.PubMed/NCBI
|
|
17
|
Boston University Research Support, .
Carbon Dioxide Euthanasia for Rats and Mice (BU ASC Guidelines).
Boston University Research Support; Boston, MA: 2019, https://www.bu.edu/researchsupport/compliance/animal-care/working-with-animals/euthanasia/carbon-dioxide-euthanasia-for-rats-and-mice/Revised
May 2019.
|
|
18
|
Tang Z, Li C, Kang B, Gao G, Li C and
Zhang Z: GEPIA: A web server for cancer and normal gene expression
profiling and interactive analyses. Nucleic Acids Res. 45:W98–W102.
2017. View Article : Google Scholar : PubMed/NCBI
|
|
19
|
Sánchez-González C, Nuevo-Tapioles C,
Herrero Martín JC, Pereira MP, Serrano Sanz S, Ramírez de Molina A,
Cuezva JM and Formentini L: Dysfunctional oxidative phosphorylation
shunts branched-chain amino acid catabolism onto lipogenesis in
skeletal muscle. EMBO J. 39:e1038122020. View Article : Google Scholar
|
|
20
|
Zaborske JM, Narasimhan J, Jiang L, Wek
SA, Dittmar KA, Freimoser F, Pan T and Wek RC: Genome-wide analysis
of tRNA charging and activation of the eIF2 kinase Gcn2p. J Biol
Chem. 284:25254–25267. 2009. View Article : Google Scholar : PubMed/NCBI
|
|
21
|
Mills GC, Schmalstieg FC, Trimmer KB,
Goldman AS and Goldblum RM: Purine metabolism in adenosine
deaminase deficiency. Proc Natl Acad Sci USA. 73:2867–2871. 1976.
View Article : Google Scholar : PubMed/NCBI
|
|
22
|
Jeon SM: Regulation and function of AMPK
in physiology and diseases. Exp Mol Med. 48:e2452016. View Article : Google Scholar : PubMed/NCBI
|
|
23
|
Zhou C, Sun H, Zheng C, Gao J, Fu Q, Hu N,
Shao X, Zhou Y, Xiong J, Nie K, et al: Oncogenic HSP60 regulates
mitochondrial oxidative phosphorylation to support Erk1/2
activation during pancreatic cancer cell growth. Cell Death Dis.
9:1612018. View Article : Google Scholar : PubMed/NCBI
|
|
24
|
Tang H, Li J, Liu X, Wang G, Luo M and
Deng H: Down-regulation of HSP60 suppresses the proliferation of
Glioblastoma cells via the ROS/AMPK/mTOR pathway. Sci Rep.
6:283882016. View Article : Google Scholar : PubMed/NCBI
|
|
25
|
Vocka M, Langer D, Fryba V, Petrtyl J,
Hanus T, Kalousova M, Zima T and Petruzelka L: Novel serum markers
HSP60, CHI3L1, and IGFBP-2 in metastatic colorectal cancer. Oncol
Lett. 18:6284–6292. 2019.PubMed/NCBI
|