Introduction
Ovarian cancer is the seventh most common cancer
type in women worldwide, with 250,000 new cases diagnosed worldwide
annually, and it lead to 185,000 deaths in 2020 (1). Recent analysis has estimated that the
deaths associated with ovarian cancer would be as high as 13,770 by
2021 in the USA alone (2). The high
mortality rate in ovarian cancer is associated with a late
diagnosis, as well as a lack of an effective targeted therapy
(3,4).
The observation that lysophosphatidic acid (LPA)
synthesized by cancer cells acts as an endogenous growth factor,
and that LPA-mediated signaling pathways serve a tumor-promoting
role across numerous cancer types, including ovarian cancer, is
clinically significant (5,6). LPA was initially identified as a
platelet derived bioactive phospholipid that stimulated the
proliferation of fibroblasts involved in wound healing (7). Subsequent studies have shown that LPA
stimulates multiple signaling pathways underlying cell
proliferation, migration, and survival via specific G-protein
coupled receptors and the associated heterotrimeric G proteins
(8,9). Of the different G proteins that could
be activated by LPA-receptors (LPARs), G protein 12 (G12) has been
identified as the major conduit involved in LPA-mediated mitogenic
signaling (10–12). In ovarian cancer, cancer cells
synthesize and release LPA into the tumor microenvironment (TME).
LPA present in the TME promotes cancer progression and metastasis
via the activation of specific LPA-receptors (LPARs) that are
present in multicellular components of the TME (13,14). In
cancer cells, LPA stimulates an autocrine signaling loop via the
activation of cancer cell-bound G-protein coupled LPARs. Although G
protein coupled receptors, such as LPARs, have proven to be highly
amenable for drug development, targeting LPARs in ovarian cancer
has been challenging. High concentrations of LPA in the
intraperitoneal ascites surrounding the ovarian cancer tissue and
the close proximity of the LPA-synthetic machinery to LPARs on the
surface of ovarian cancer cells have impeded LPAR-targeted
therapeutic strategies in ovarian cancer. Recent studies from
several laboratories, including ours, have reported that the
α-subunit of the oncogene G-protein G12, encoded by the gene G
protein subunit α 12 (GNA12), is the major conduit involved
in transmitting oncogenic signals in numerous cancer types,
including ovarian cancer (15–20). It
has been revealed that either LPAR-stimulated activation or
mutational activation of GNA12, referred to as the
gep oncogene, induces the oncogenic proliferation of ovarian
cancer cells (15,16).
Tumorigenesis and tumor progression often involve
the deregulation of multiple pathways, impacting a cell-wide
signaling network rather than an alteration in a single gene or
pathway (21). Therefore, we
hypothesized that the transcriptomic analysis based on the
aggregated expression of genes associated with multiple pathways
co-regulated by GNA12 could provide additional insights into
the LPA/LPAR/GNA12-induced oncogenic signaling network in
ovarian cancer. Based on this rationale, the present study aimed to
investigated GNA12-orchestrated effects in ovarian cancer
pathobiology using micro-array based transcriptomic analysis.
Herein, the results from pathway-based bioinformatics analyses are
shown in order to define the co-regulatory signaling circuits
regulated by GNA12 in ovarian cancer. Using SKOV3 cells in
which GNA12 had been silenced, transcriptomic profiling was
conducted to identify the differentially expressed genes (DEGs).
Moreover, array results were validated by monitoring the expression
levels of representative DEGs via reverse
transcription-quantitative (RT-q) PCR analysis in
GNA12-silenced-Kuramochi cells. Further Gene Ontology (GO)
enrichment and protein-protein interaction (PPI) network analyses
were performed using web-based Database for Annotation,
Visualization and Integrated Discovery (DAVID) and Search Tool for
Retrieval of Interacting Genes (STRING), as well as Cytoscape
software applications. In addition to providing a novel insight
into the organizational structure of LPA/LPAR/GNA12-driven
transcriptomic network in ovarian cancer, the present study has
identified specific hub and bottleneck nodes that can be targeted
individually or collectively for effective targeted adjuvant
therapy for ovarian cancer.
Materials and methods
Cell lines and culture
High grade serous carcinoma cell line Kuramochi and
non-serous ovarian carcinoma cell line SKOV3 were obtained from
American Type Culture Collection (Manassas, VA) and the cells were
authenticated by short tandem repeat analysis as described
(13). Kuramochi cells were
maintained in Roswell Park Memorial Institute (RPMI)-1640 medium
(Cellgro) and SKOV3 cells were maintained in Dulbecco's modified
Eagle's medium (DMEM) (Cellgro), both at 37°C in a 5%
CO2 incubator. In both cases, the media were
supplemented with 10% FBS (Gemini Bio-Products), 50 U/ml
penicillin, 50 µg/ml streptomycin (Cellgro). For LPA-stimulation
studies, 18.1 LPA (1-oleoyl-2-hydroxy-sn-glycero-3-phosphate; cat.
no. 85730), was obtained from Avanti Polar Lipids (Alabaster, AL).
LPA was dissolved in 10 mM stock solutions in phosphate buffered
saline containing 1% BSA and stored at −80°C until use.
Human cell lines and methods used in this study were
approved by the Institutional Review Board for the protection of
the Human Subjects of the University of Oklahoma (approval no.
9599).
Transfection methods
Silencing of GNA12 in SKOV3 cells was carried
out as described in our previously publication (16). Briefly, non-target scrambled control
shRNA pLKO.1 vector construct (Sigma-Aldrich; Merck KGaA (SHC002)
and pLKO.1 vector construct targeting GNA12/Gα12
(RHS3979-98491914; Open Biosystems) were stably transfected into
SKOV3 cells using Amaxa Biosystems Nucleofector II, according to
the instructions of the manufacturer. The stably transfected NS
control and Gα-silenced clones were selected with puromycin (2
µg/ml; MP Biomedicals) and single clones were picked, expanded to
obtain stable cell lines. Prior to the array analysis, the
silencing of GNA12-expression was ascertained by immunoblot
analysis. Silencing of GNA12 in Kuramochi cells were carried out
using siRNAs targeting GNA12 (siGENOME Human GNA12
siRNA SMARTpool; cat. no. M-008435-00-0005) and non-targeting
scrambled control siRNAs control (siGENOME Non-Targeting siRNA
Pool; cat. no. D-001206-13-05) were obtained from Dharmacon/Horizon
Discovery. Kuramochi cells were transfected with siRNA using
Lipofectamine RNAiMAX reagent (Invitrogen, Life Technologies) as
recommended by the manufacturer. Kuramochi cells were seeded in
6-well plates at a density of 1×10⁵ cells per well and
incubated for 24 h. Lipofectamine RNAiMAX reagent (9 µl) in 300 µl
of Opti-MEM (Invitrogen, Life Technologies) was incubated for 5 min
at room temperature. siRNA was added to the Opti-MEM-lipofectamine
RNAiMAX solution to a final concentration of 100 nM. The mixture
was added to the cell culture, and after 48 h incubation for gene
silencing, the cells were collected for RT-qPCR studies. Expression
of GNA12 in the transfectants was monitored by RT-qPCR
analysis.
Transcriptomic analysis
Transcriptome profiles were obtained using Agilent
SurePrint G3 Human Comparative Genomic Hybridization 8×60
microarray platform. SKOV3-shScr (non-specific scrambled shRNA
control) and SKOV3-shGNA12 cells were cultured for 24 h,
followed by 16 h of serum starvation. These cells were stimulated
with LPA (10 µM) for 16 h and total RNA was extracted using Qiagen
RNeasy mini kit (Qiagen) following the manufacturer's protocol.
Agilent QuickAmp labeling kit was used to label RNA samples with
Cy3-CTP and hybridized to the array slides following the
manufacturer's protocol. The hybridized array slides were scanned
using Agilent SureScan scanner at 2 microns resolution. The spot
intensity was extracted using Agilent Feature Extraction version
11.0 software. Further, gene expression analysis was carried out
using Agilent GeneSpring GX version 13.0. Differentially expressed
genes (DEGs), with a cut-off value of ≥5-fold change compared to
control cells, were used for further bioinformatic analyses.
Bioinformatics analysis
Gene ontology Enrichment analysis of the DEGs was
carried out using the web-based annotation tool DAVID (https://david.ncifcrf.gov/home.jsp) (22). Protein-Protein Interaction Networks
Functional Enrichment Analysis was carried out using web-based
(https://string-db.org/) STRING database (23). The upregulated genes and
downregulated genes were analyzed separately with the highest
confidence interaction score (0.9) and <10 degree of
interaction. Significant modules in the PPI network was analyzed
further using Cytoscape software application (24). The hub and bottle neck nodes of the
PPI network were identified using the cytoHubba plugin in Cytoscape
(25). Multiple algorithms of
cytoHubba including Degree, Maximal Clique Centrality and (MCC),
maximum neighbourhood component (MNC), Edge Percolated Component
(EPC), EcCentricity, Closeness, Betweenness, and Clustering
Coefficient were used to identify the hub nodes of the PPI networks
(26). BottleNeck algorithm of
cytoHubba was used to identify the bottleneck nodes of the
network.
RT-qPCR analysis
Total RNA was extracted using Qiagen RNeasy kit
(Qiagen) following the manufacturer's instructions. cDNA synthesis
was carried out using an iScript™ cDNA Synthesis Kit (Bio-Rad).
Real-time quantitative PCR (RT-qPCR) was carried out using the cDNA
from the above step using appropriate primers (Table SI) and SoAdvanced Universal SYBR
Green Supermix (Bio-Rad) in a BioRad CFX96 Real time PCR detection
system. The raw Cq values were normalized against GAPDH,
housekeeping gene.
Immunoblot analysis
Antibodies to GNA12 (sc-409), GAPDH (CB1001),
peroxidase-conjugated anti-rabbit IgG (W401B) were obtained from
Santa Cruz Biotechnology Inc., Abcam and Promega Corporation,
respectively. Immunoblot analysis was carried out according to our
previously published methods (12)
and developed with a Kodak Image Station 4000 MM.
Statistics
All required statistical analyses were performed
using GraphPad Prism by two-tailed unpaired Student's t-test with
Welch's correction. Statistics used in bioinformatics such as
P-values and False Discovery Rates were calculated using the
built-in statistical programs of the respective analytical
tools.
Results
Identification of DEGs
Our previous studies have shown that LPA/LPAR
stimulates ovarian cancer growth and cell proliferation via the
activation of GNA12, encoded by the gene GNA12 or its
mutationally activated configuration known as the gep
oncogene (15,16). To obtain an understanding of the
transcriptomic network regulated by GNA12, the expression of
GNA12 was silenced in SKOV3 cells using shRNAs targeting
GNA12. These cells were stimulated with LPA and the DEGs in
GNA12-silenced cells compared with those in the scrambled
shRNA control group were identified using an Agilent array. With a
cut-off value of ≥5-fold change, compared with control cells,
GNA12-silenced cells had 313 downregulated genes and 293
upregulated genes (Fig. 1A and B).
Of the 313 downregulated genes, 145 genes were found to be
protein-encoding genes (Table SII).
Similarly, among the 293 upregulated genes, 186 genes were found to
be protein-encoding genes (Table
SIII). Other genes were represented by either long non-coding
RNAs or pseudogene transcripts (Tables
SIV).
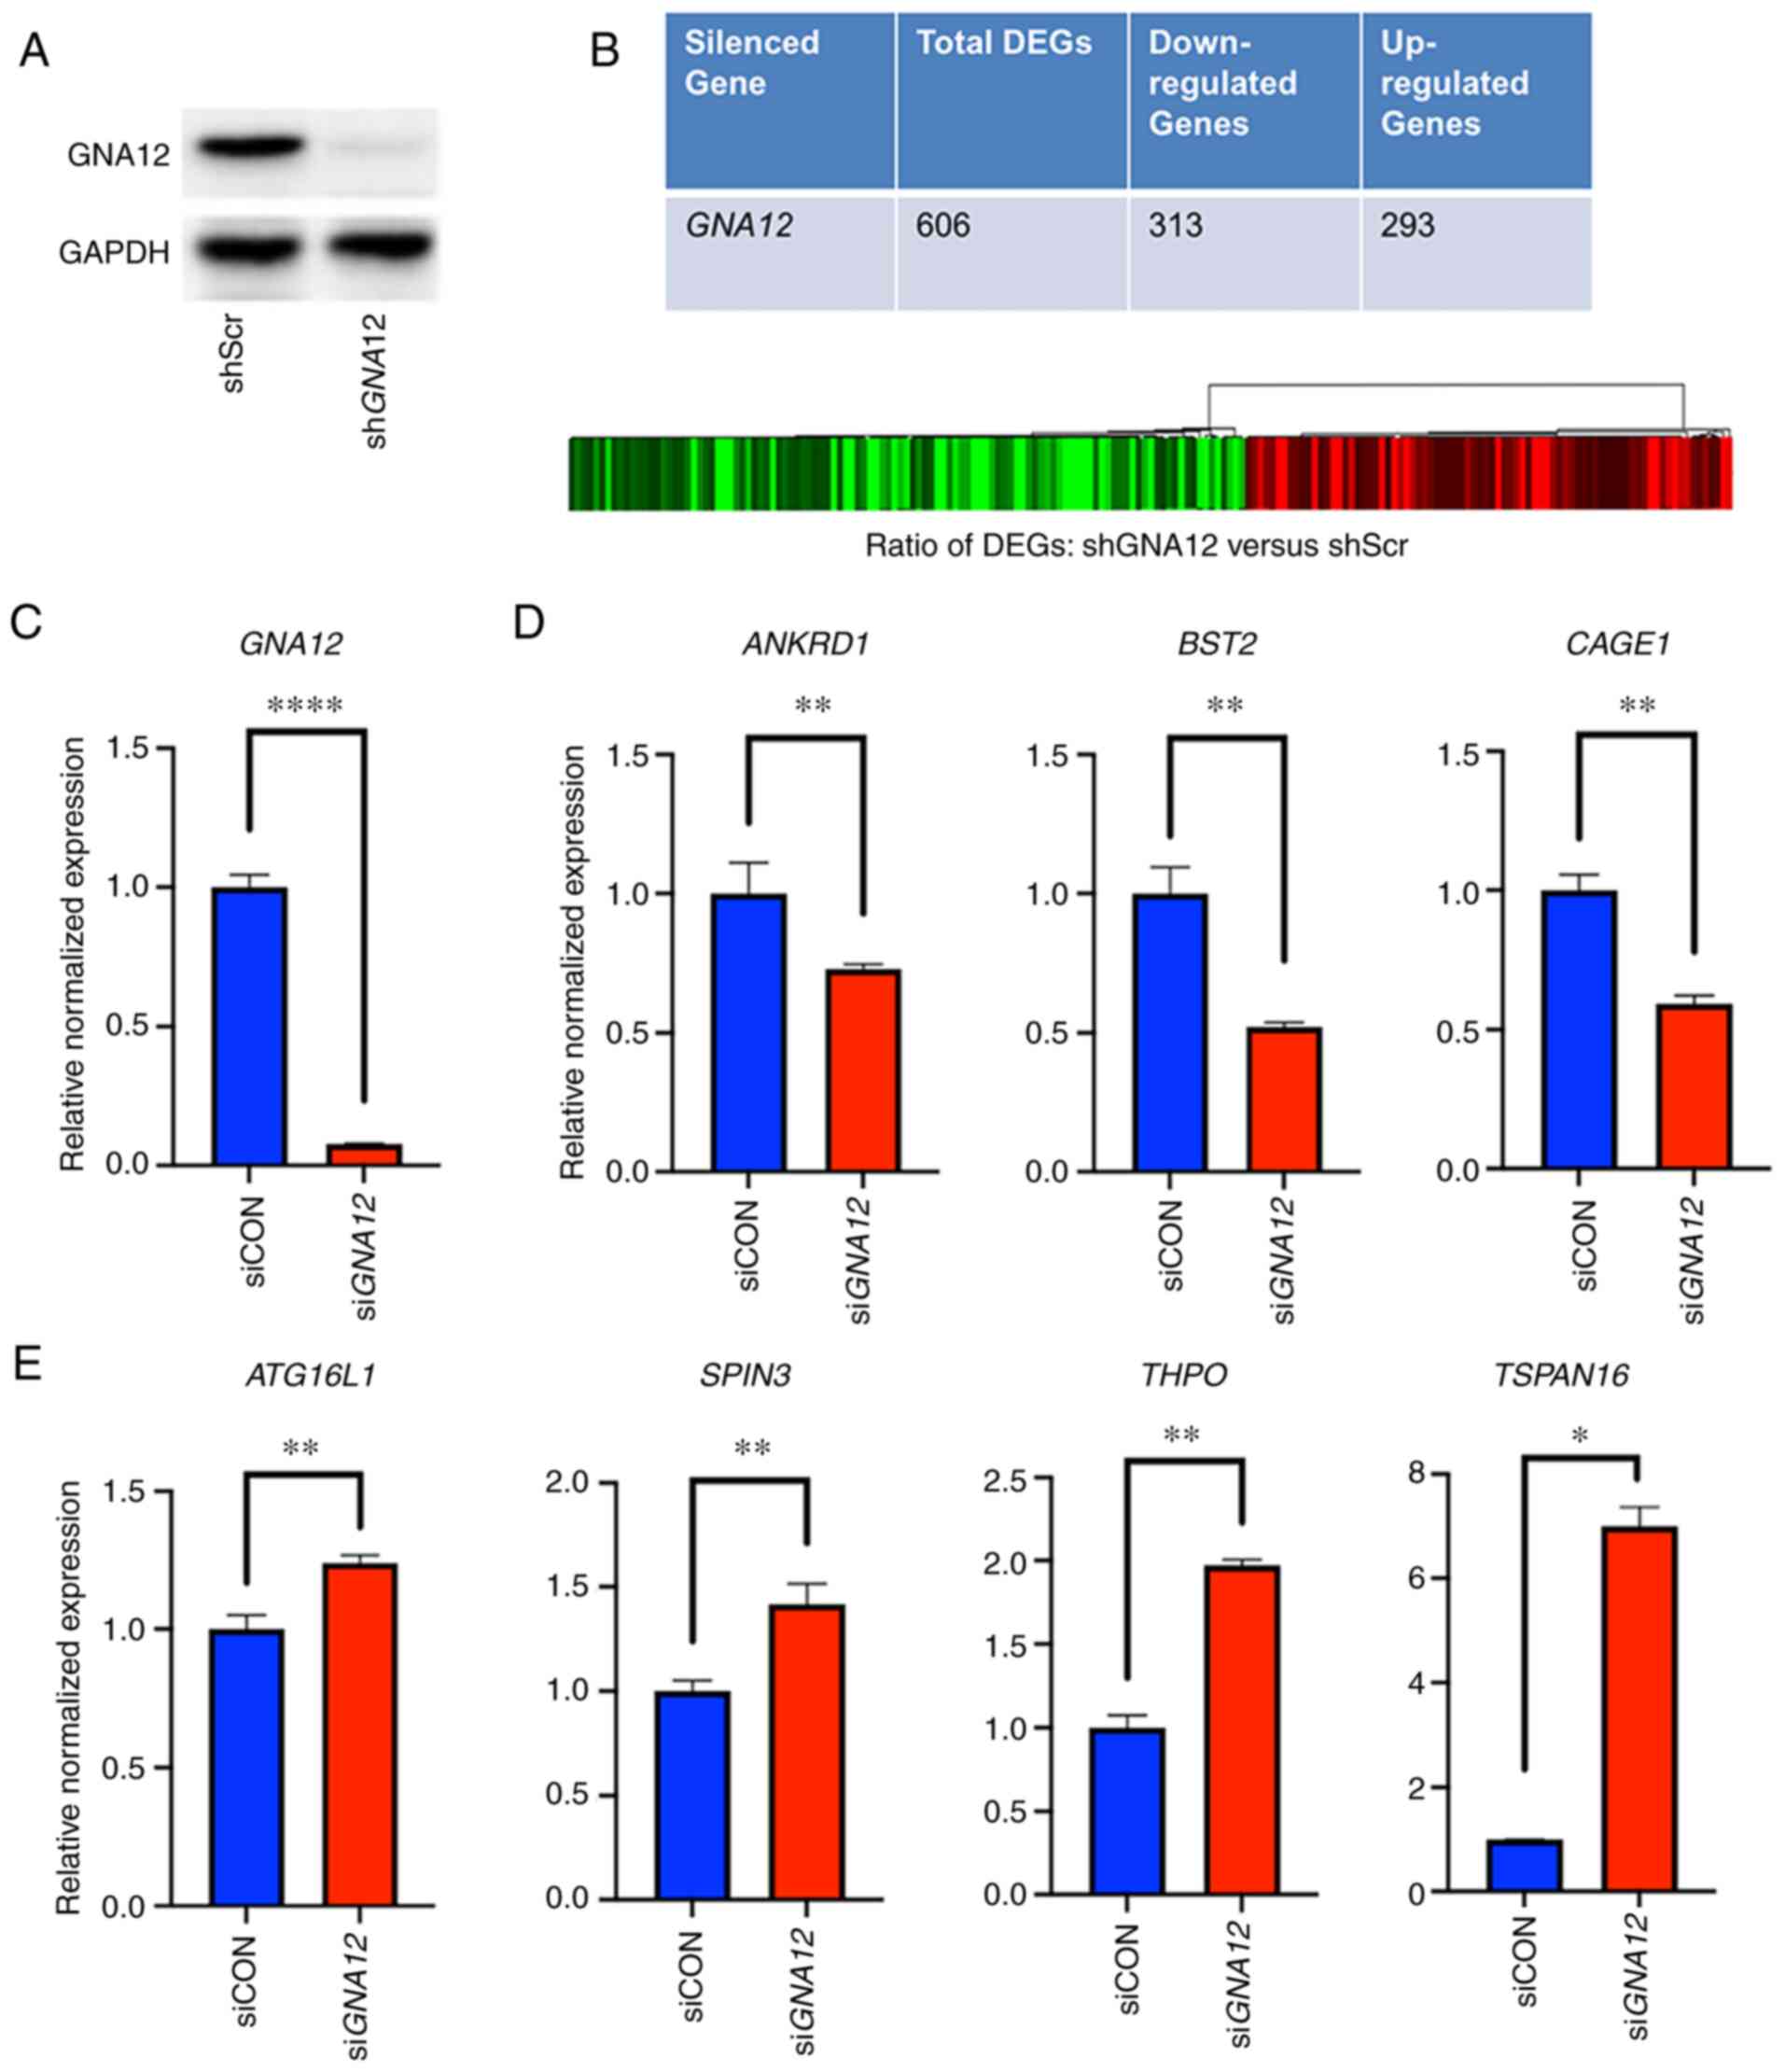 | Figure 1.Heatmap of the DEGs and validation.
(A) Validation of shRNA-mediated GNA12-silencing in SKOV3
cells. Expression of GNA12 was stably silenced in SKOV3
cells using shGNA12 compared with control cells stably
expressing non-targeting scrambled shRNAs. (B) Heatmap of the DEGs;
the ratio comparing control cells (scrambled shRNA) and
GNA12-silenced cells is presented as a heat map. Red, black and
green colors represent upregulated, unchanged and downregulated
expression, respectively. Total number of DEGs with
>5-fold-change compared with control values and the number of
downregulated and upregulated DEGs are presented as a table. (C)
Array results were validated by RT-qPCR using siRNA-mediated
GNA12-silenced Kuramochi cells compared with non-targeting
scrambled siRNA controls. (D) Downregulated DEGs were validated by
monitoring the expression of the representative genes ANKRD1,
BST2 and CAGE1 by RT-qPCR. (E) Expression of the
upregulated DEEGs was validated by monitoring the expression of the
representative upregulated genes ATG16L1, SPIN3, THPO, and
TSPAN16 by RT-qPCR. *P<0.05, **P<0.005,
****P<0.0005. DEGs, differentially expressed genes; sh, short
hairpin; GNA12, G protein subunit α 12; Scr, scrambled; RT-qPCR,
CON, control; ANKRD1, ankyrin repeat domain 1; BST2, bone marrow
stromal cell antigen 2; CAGE1, cancer antigen 1; RT-qPCR, reverse
transcription-quantitative PCR; ATG16L1, autophagy-related 16-like
1; SPIN3, spindlin family member 3; THPO, thrombopoietin; TSPAN16,
tetraspanin 16. |
Next, the current study aimed to validate the array
results in a cell lines that represent high grade ovarian serous
ovarian carcinoma (HGSOC). The expression of GNA12 was
silenced in Kuramochi cells, a HGSOC cell line, using specific
siRNAs targeting GNA12. After determining the efficacy of
GNA12 silencing in these cells (Fig. 1C), RT-qPCR analysis was conducted to
validate the expression levels of the DEGs. Downregulated genes
were validated by monitoring the expression levels of the
representative growth-promoting genes ankyrin repeat domain 1
(ANKRD1), bone marrow stromal cell antigen 2 (BST2)
and cancer antigen 1 (CAGE1), whereas the upregulated genes
were validated by monitoring the expression levels of
growth-repressive representative genes, namely autophagy-related
16-like 1 (ATG16L1), spindlin family member 3
(SPIN3), thrombopoietin (THPO) and tetraspanin 16
(TSPAN16). It was found that silencing of GNA12 led
to the decreased expression of ANKRD1, BST2 and CAGE1
(Fig. 1D), along with the increased
expression of ATG16L1, SPIN3, THPO and TSPAN16,
thereby validating the array results (Fig. 1E).
GO enrichment analysis of DEGs
It should be noted that the genes downregulated
after silencing of GNA12 represent the genes whose
expression was induced by GNA12, whereas the upregulated
genes represent the genes whose expression was repressed by
GNA12 in situ. Therefore, defining the functional
relationships among the downregulated as well as the upregulated
DEGs could provide insights into the mechanism via which
GNA12 promotes ovarian cancer progression. Since GO
enrichment analysis can provide information on the functional
relationship among a large set of genes, GO analysis under the
three sub-ontologies, namely biological processes (GO:BP),
molecular functions (GO:MF) and cellular components (GO:CC), was
conducted. GO enrichment analyses of the DEGs were performed using
the web-based DAVID analytical tool (22). In GO:BP, the upregulated genes were
significantly enriched in BP involving ‘cell adhesion’,
‘proliferation’ and ‘cell motility’ (Table I). These BP were associated with the
known oncogenic functions of GNA12 in oncogenic cell
proliferation and migration. In GO:CC, CC including ‘plasma
membrane’ and ‘actin-based cellular projections’ formed the major
categories, which was consistent with the role of GNA12 in
actin cytoskeletal reorganization underlying cell invasion
(20). In GO:MF, the topmost
enriched categories were ‘macromolecular interaction’, ‘chromatin
and nucleic acid interaction’ and ‘transcriptional activation’
(Table I), thus validating the role
of GNA12-mediated network in molecular interactions leading to
oncogenic transcriptional events.
 | Table I.GO enrichment analysis of
downregulated genes in GNA12-silenced cells. |
Table I.
GO enrichment analysis of
downregulated genes in GNA12-silenced cells.
| A, GO: Biological
process |
|---|
|
|---|
| Term | Description | Gene count | P-value |
|---|
| GO:0048518 | Positive regulation
of Biological Process | 45 |
6.3×10² |
| GO:0048583 | Regulation of
response to Stimulus | 24 |
8.7×10² |
| GO:0007155 | Cell adhesion | 21 |
2.1×10² |
| GO:0008283 | Cell
proliferation | 19 |
4.9×101 |
| GO:0048870 | Cell motility | 15 |
4.9×101 |
|
| B, GO: Cellular
component |
|
| Term |
Description | Gene
count | P-value |
|
| GO:0005886 | Plasma
membrane | 45 |
6.7×10² |
| GO:0071944 | Cell periphery | 45 |
9.0×10² |
| GO:0005576 | Extracellular
region | 42 |
4.8×10² |
| GO:0042995 | Cell
projection | 18 |
9.3×10² |
| GO:0098862 | Cluster of
actin-based cell projections | 4 |
7.8×10² |
|
| C, GO: Molecular
function |
|
| Term |
Description | Gene
count | P-value |
|
| GO:0044877 | Macromolecular
complex binding | 15 |
6.0×10² |
| GO:0001067 | Regulatory region
nucleic acid binding | 10 |
9.4×10² |
| GO:0000981 | Transcription
factor activity | 9 |
8.5×10² |
| GO:0003982 | Chromatin
binding | 8 |
5.7×10² |
| GO:0001228 | Transcriptional
activator activity | 6 |
7.2×10² |
With regards to genes that were downregulated in
GNA12-silenced cells, GO:BP showed enrichment of categories
associated with the overall negative regulation of cellular and BP
including different aspects of ‘cell death’ and ‘proteolytic
processes’ that can be linked with growth-inhibition (Table II). In GO:CC, the enriched
categories included ‘membrane components of the cells’ and
components associated with ‘autophagosome membrane’ and
‘extracellular matrix’. This finding was in agreement with the
notion that the primary site of action of GNA12 is closer to cell
surface membrane (27). In GO:MF,
the enriched categories were associated with ‘protein binding’ and
peptidase functions including ‘exopeptidase’, ‘metallopeptidase’
and ‘metalloexopeptidase’ (Table
II), which are often associated with programmed cell death
(28).
| Table II.GO enrichment analysis of upregulated
genes in GNA12-silenced cells. |
Table II.
GO enrichment analysis of upregulated
genes in GNA12-silenced cells.
| A, GO: Biological
process |
|---|
|
|---|
| Term | Description | Gene count | P-value |
|---|
| GO:0048519 | Negative regulation
of biological process | 46 |
6.4×10² |
| GO:0048523 | Negative regulation
of cellular process | 45 |
3.2×10² |
| GO:0006508 | Proteolysis | 20 |
7.5×10² |
| GO:0010941 | Regulation of cell
death | 18 |
8.8×101 |
| GO:0042981 | Regulation of
apoptotic process | 17 |
8.7×101 |
|
| B, GO: Cellular
component |
|
| Term |
Description | Gene
count | P-value |
|
| GO:0016020 | Membrane | 85 |
4.9×10² |
| GO:0071944 | Cell periphery | 51 |
5.8×10² |
| GO:0005886 | Plasma
membrane | 50 |
5.9×10² |
| GO:0031012 | Extracellular
matrix | 10 |
2.3×10² |
| GO:0000421 | Autophagosome
membrane | 3 |
2.0×10² |
|
| C, GO: Molecular
function |
|
| Term |
Description | Gene
count | P-value |
|
| GO:0005488 | Binding | 122 |
9.6×10² |
| GO:0008233 | Peptidase | 10 |
9.8×10² |
| GO:0008237 |
Metallopeptidase | 5 |
6.1×10² |
| GO:0008238 | Exopeptidase | 4 |
5.5×10² |
| GO:0008235 |
Metalloexopeptidase | 3 |
8.9×10² |
Analysis of PPI networks and
pathways
To further investigate the functional interactions
among the proteins encoded by the DEGs, PPI network functional
enrichment analysis was conducted using the STRING database
(23). The upregulated and
downregulated genes were analyzed separately, with the highest
confidence interaction score (0.9) and <10 degrees of
interaction. The PPI network downregulated in GNA12-silenced
cells was constructed by screening 186 nodes and 306 edges
(Fig. 2). The most significant
module in the PPI network was determined using Cytoscape software
(24). Kyoto Encyclopedia of Genes
and Genomes (KEGG) analyses indicated that the major pathways
defined by GNA12-dependent genes were pathways involved in
‘cancer’, ‘PI3K/AKT signaling’, ‘chemotherapy resistance’ and ‘FoxO
signaling’ (Table III). Reactome
analysis expanded this further into pathways associated with
signaling involving ‘tyrosine kinases’, ‘VEGF signaling’, ‘PI3K/AKT
signaling’, ‘cell surface interactions at the vascular wall’,
‘cancer associated aberrant signaling by PI3K’ and ‘signaling by
receptor tyrosine kinases’ (Table
III).
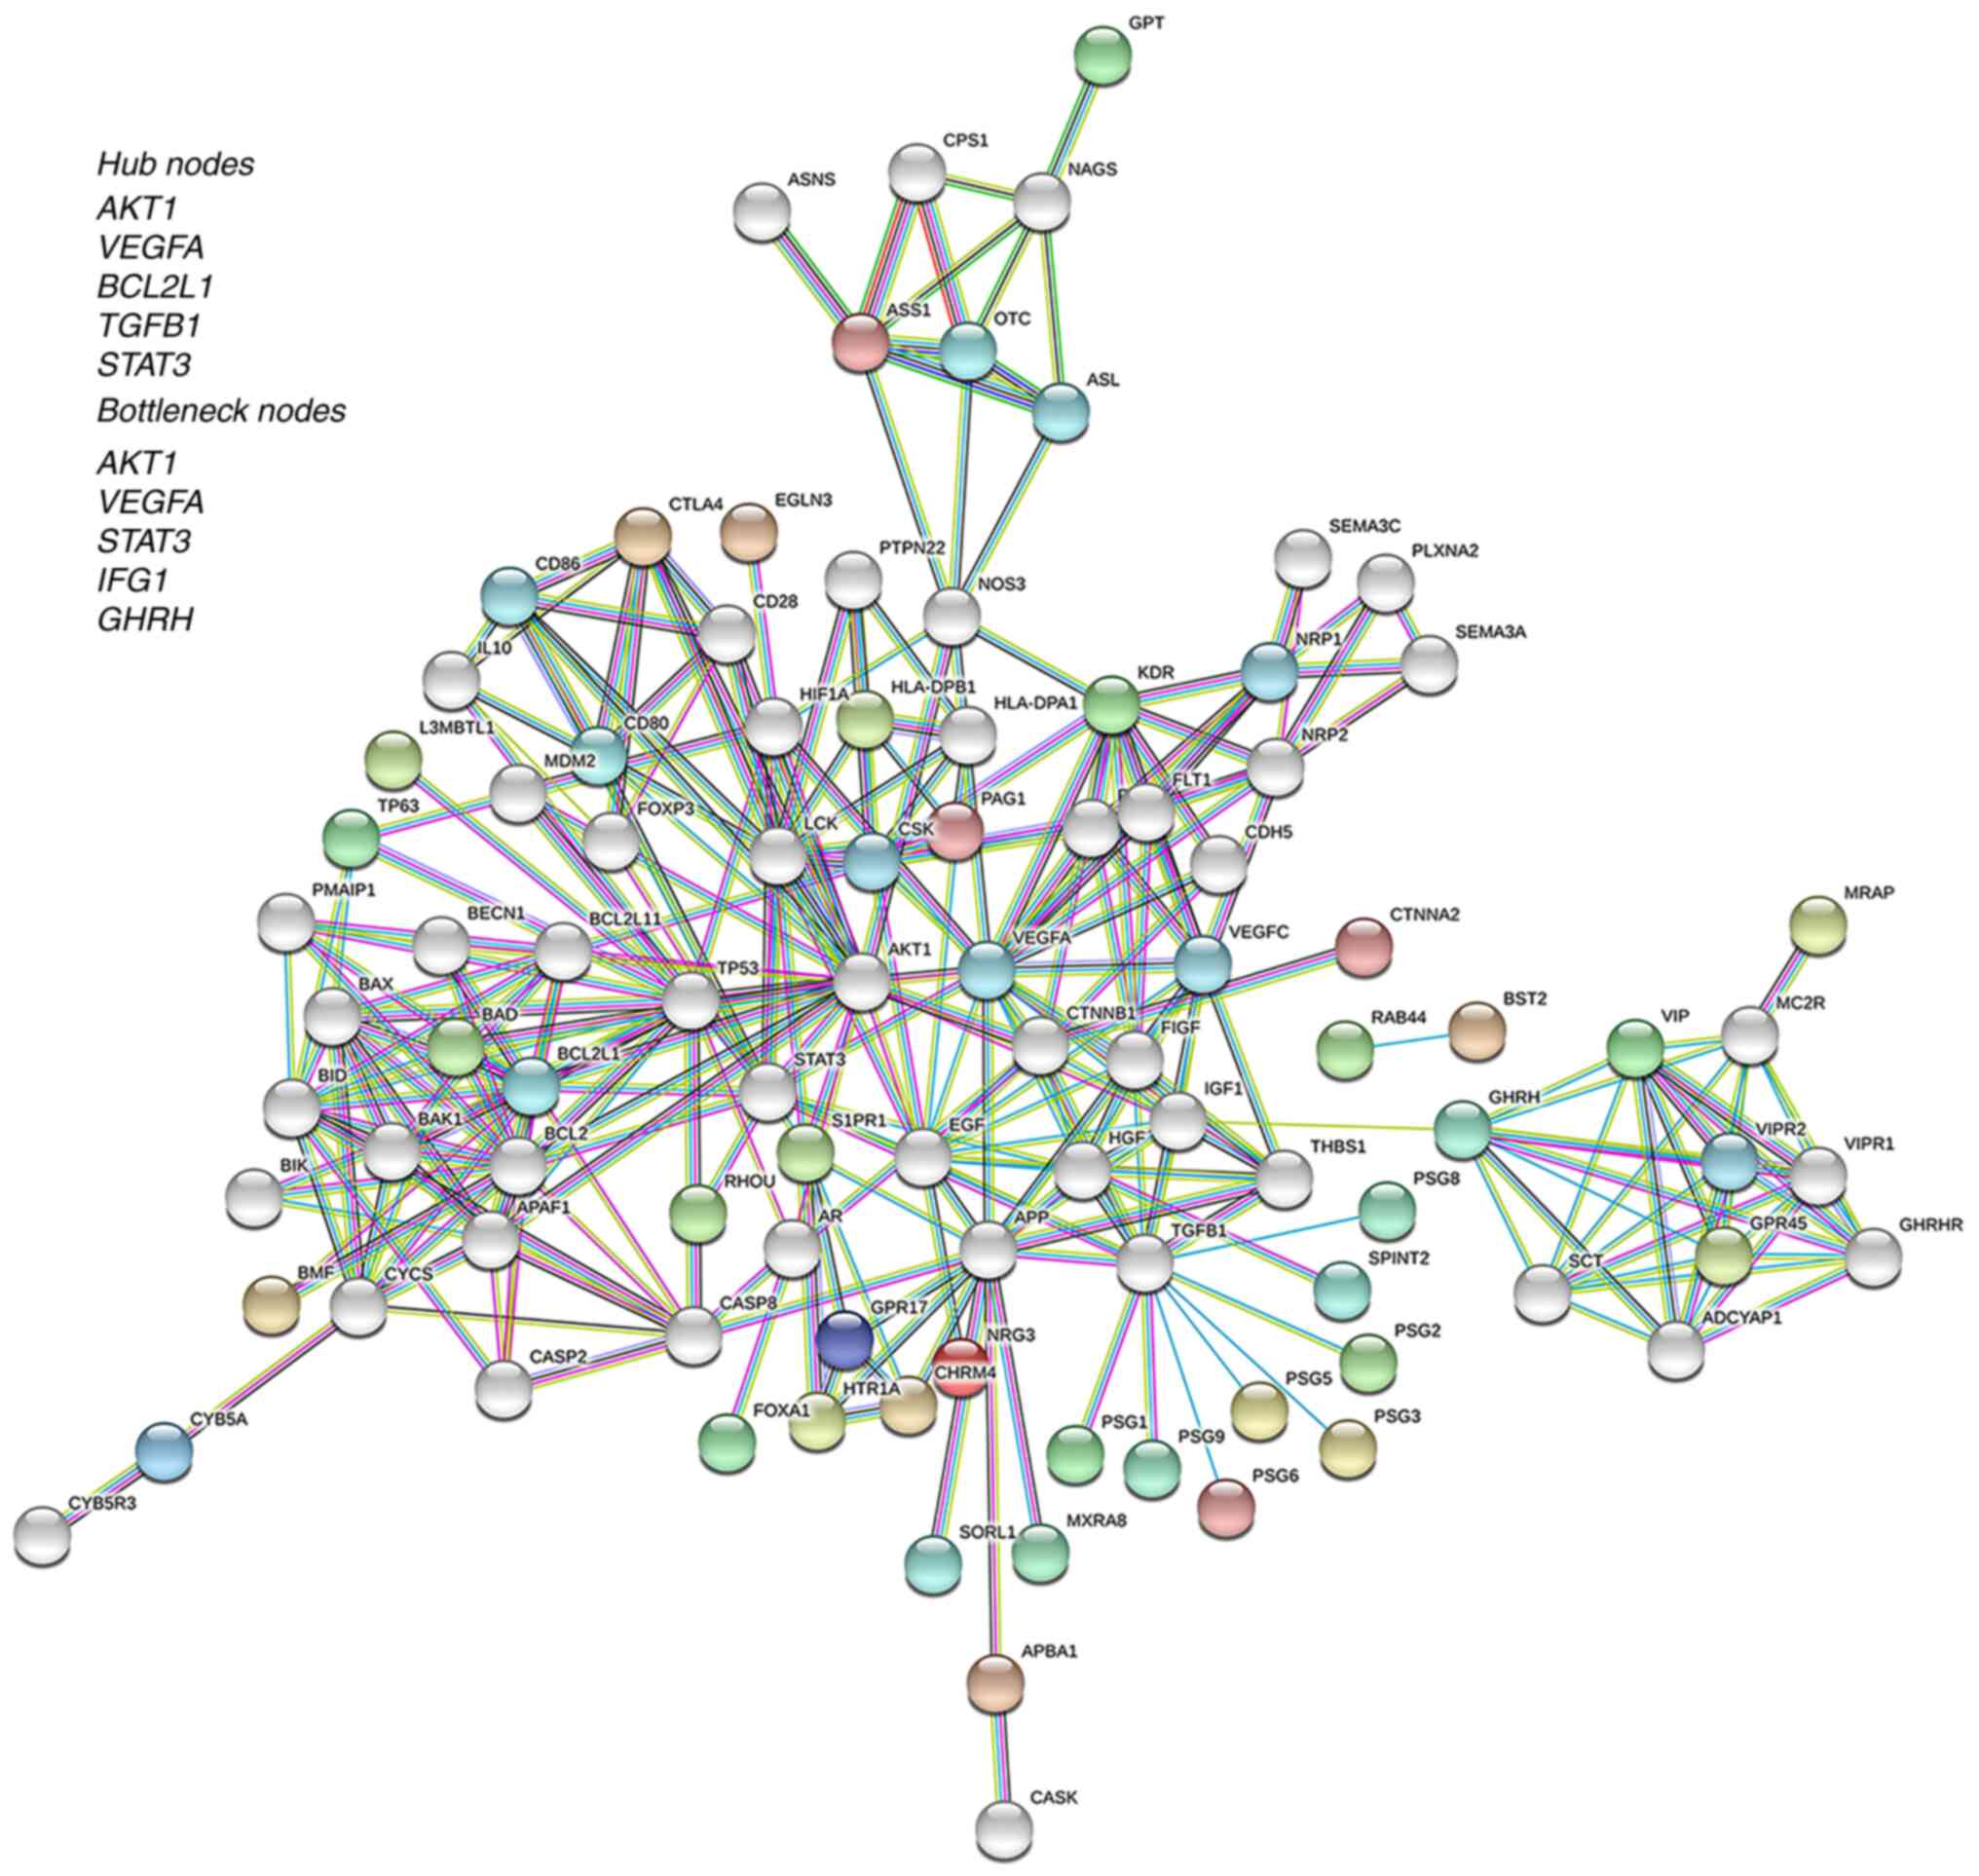 | Figure 2.PPI network of downregulated genes.
Using the web-based Search Tool for Retrieval of Interacting Genes
tool, a PPI network of the genes downregulated in GNA12-silenced
cells was constructed. Query proteins and their first shell
interactions are denoted by colored nodes. Second shell
interactions are in grey. Nodes of similar color identifies the
specific cluster of interacting nodes. Predicted functional
interactions are indicated by the connecting lines. The colors of
the lines represent the types of evidence that were used to predict
the PPI associations as follows: Red, known gene fusions; green,
gene neighborhood; blue, gene co-occurrence; purple, experimental
data; yellow, text-mining; light blue, protein homology; aqua
marine, curated database; and black, co-expression. Hub and
bottleneck nodes identified by the cytoHubba plugin in Cytoscape
application are presented as the inset. PPI, protein-protein
interaction; GNA12, G protein subunit α 12; IGF1, insulin-like
growth factor 1; GHRH, growth hormone-releasing hormone. |
| Table III.Pathway analysis of downregulated
genes in GNA12-silenced cells. |
Table III.
Pathway analysis of downregulated
genes in GNA12-silenced cells.
| A, Kyoto
Encyclopedia of Genes and Genomes pathway |
|---|
|
|---|
| Term | Description | Gene count | False discovery
rate |
|---|
| hsa05200 | Pathways in
cancer | 28 |
2.43×10¹¹ |
| hsa04151 | PI3K-AKT signaling
pathway | 18 |
2.34×10⁷ |
| hsa01524 | Platinum drug
resistance | 13 |
5.69×10¹¹ |
| hsa01521 | EGFR tyrosine
kinase inhibitor resistance | 13 |
2.35×10⁹ |
| hsa04068 | FoxO signaling
pathway | 9 |
3.60×10⁵ |
|
| B, Reactome
pathway |
|
| Term |
Description | Gene
count | False discovery
rate |
|
| HSA-9006934 | Signaling by
receptor tyrosine kinases | 24 |
1.29×10⁹ |
| HSA-194138 | Signaling by
VEGF | 12 |
7.95×10⁸ |
| HSA-2219528 | PI3K/AKT signaling
in cancer | 10 |
9.32×10⁷ |
| HSA-202733 | Cell surface
interactions at the vascular wall | 9 |
1.70×10⁴ |
| HSA-2219530 | Constitutive
signaling by aberrant PI3K in cancer | 7 |
7.17×10⁵ |
A similar PPI network construction was performed
with the genes upregulated after silencing of GNA12 by
screening a total of 202 nodes and 964 edges from the STRING portal
(Fig. 3). KEGG pathway analyses
indicated that the network, which was repressed by GNA12,
was primarily involved in ‘metabolism’, ‘oxidative
phosphorylation’, ‘proteasomal proteolysis’, ‘cell cycle arrest’
and ‘transcriptional misregulation in cancer’ (Table IV). Reactome pathways analysis
revealed that pathways regulated in this network included
‘metabolism of proteins’, ‘cell cycle checkpoints’, ‘cellular
stress response’, ‘anaphase-prophase complex (APC/C) mediated
degradation of mitotic proteins’ and ‘ubiquitin-dependent
degradation of cyclin D’, all of which could be associated with
growth-inhibition (Table IV).
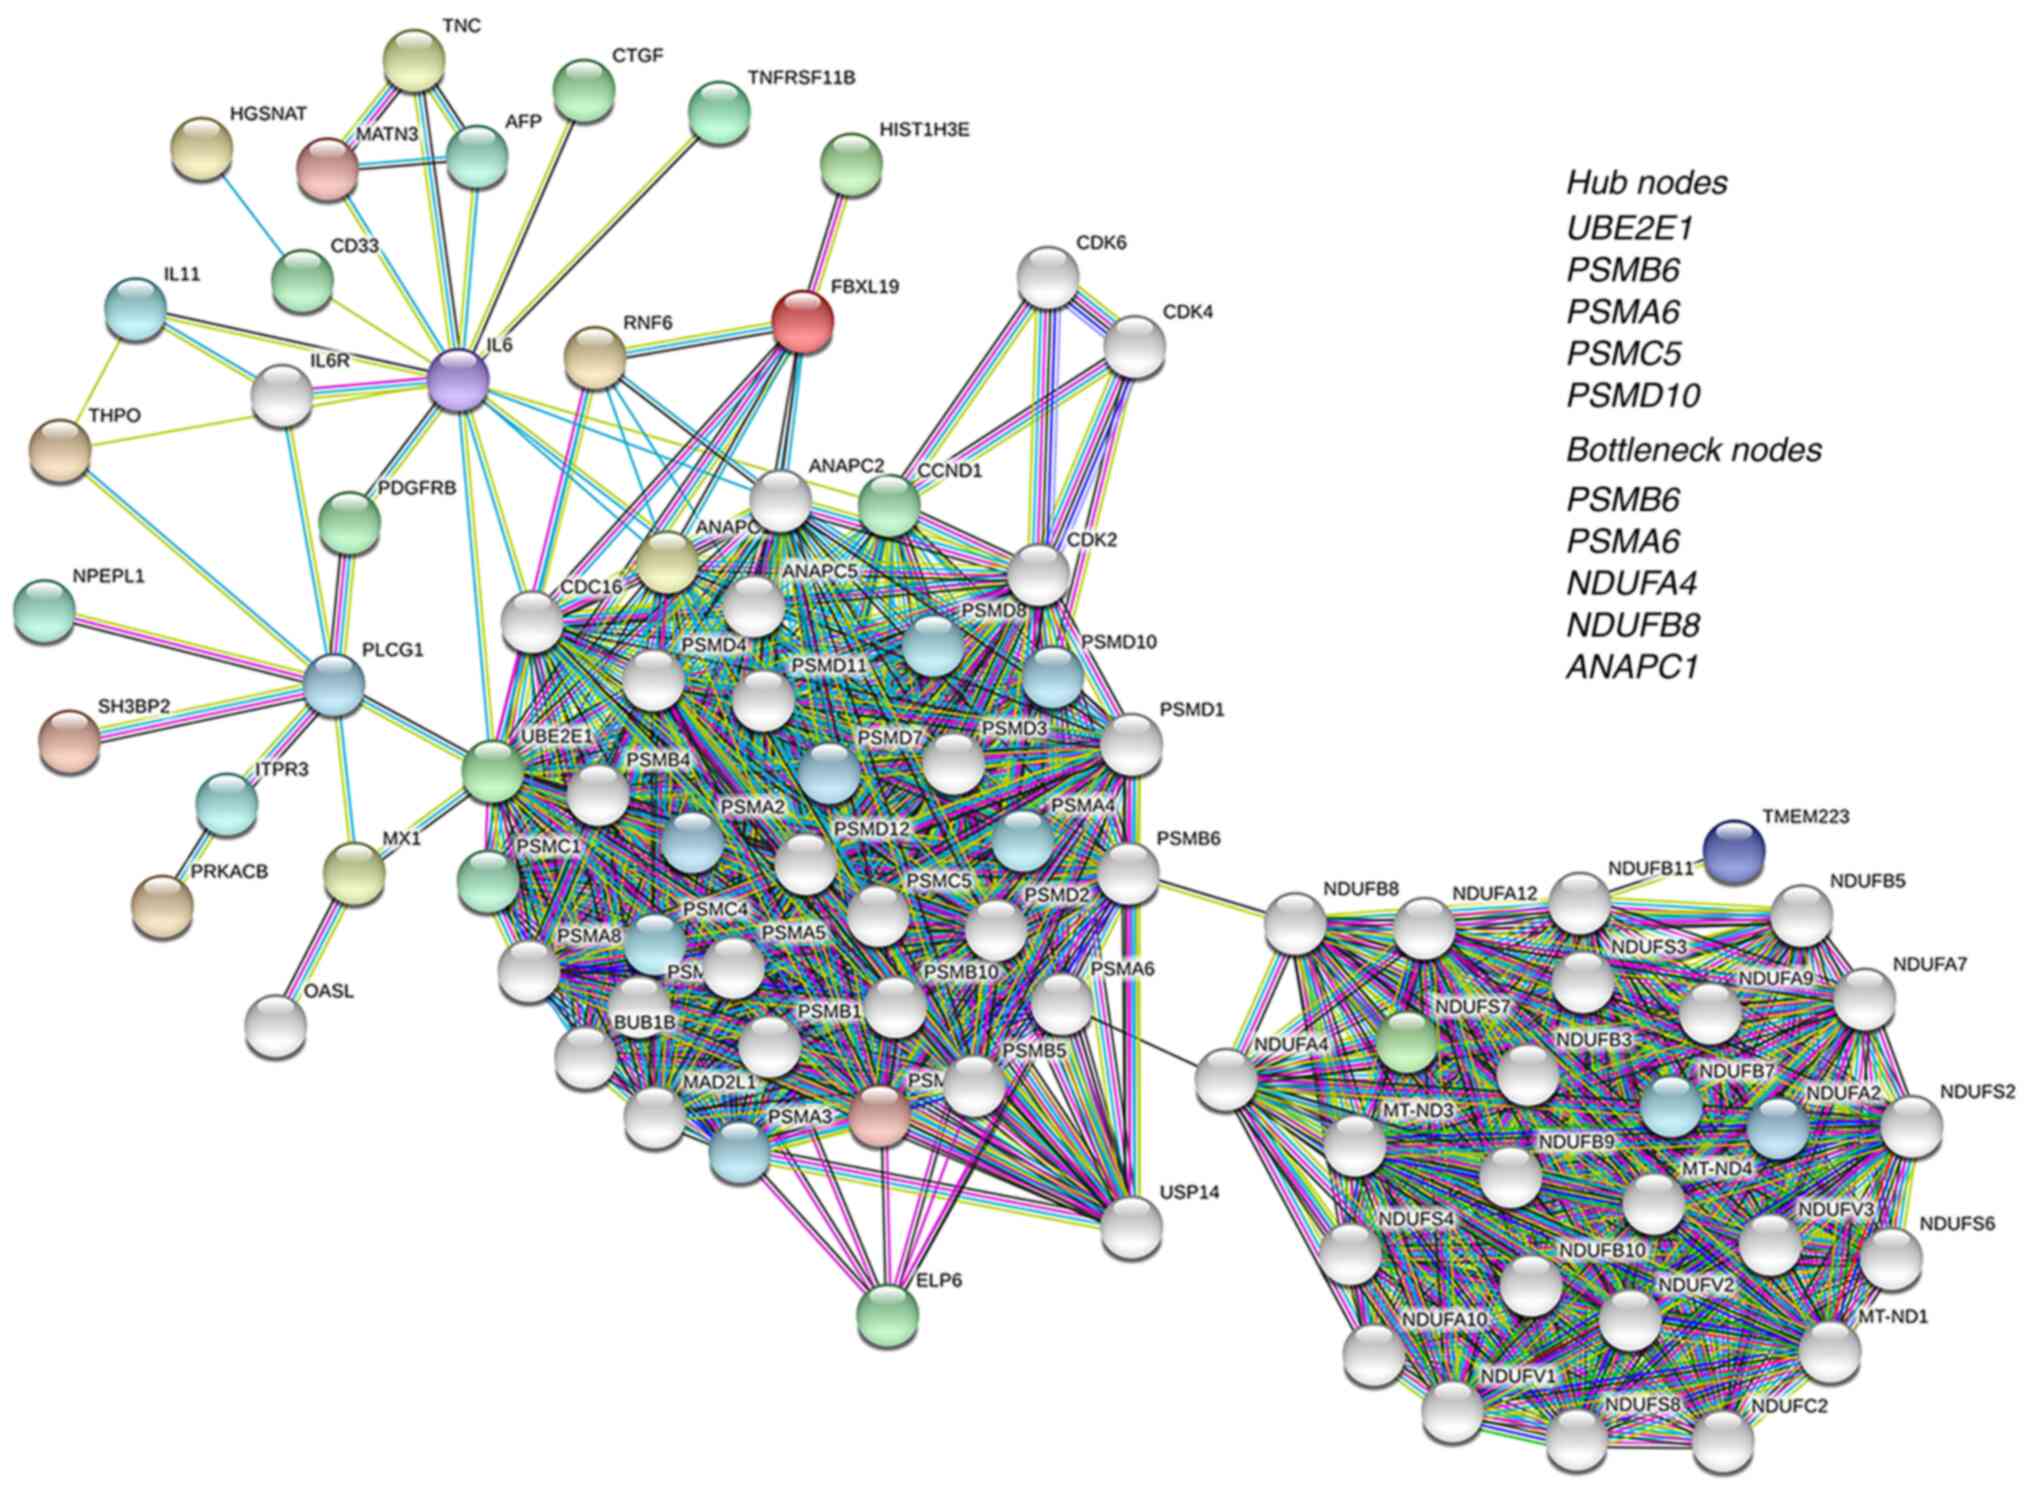 | Figure 3.PPI network of upregulated genes. A
PPI network of the genes upregulated in GNA12-silenced cells is
presented. Colored nodes represent the query proteins and first
shell interaction and white nodes denote second shell interactions.
Nodes of similar color identifies the specific cluster of
interacting nodes. Predicted functional interactions are indicated
by the connecting lines. The colors of the lines represent the
types of evidence that were used to predict the PPI associations as
follows: Red, known gene fusions; green, gene neighborhood; blue,
gene co-occurrence; purple, experimental data; yellow, text-mining;
light blue, protein homology; aqua marine, curated database; and
black, co-expression. Hub and bottleneck nodes of the PPI network
derived from the use of cytoHubba plugin in Cytoscape application
are presented as the inset. PPI, protein-protein interaction;
GNA12, G protein subunit α 12; UBE2E1, ubiquitin conjugating enzyme
E2 E1; PSM, proteasome 20S subunit; NDUFA4, NDUFA4 mitochondrial
complex-associated; NDUFB8, NADH:ubiquinone oxidoreductase subunit
B8; ANAPC1, anaphase promoting complex subunit 1. |
| Table IV.Pathway analysis of upregulated genes
in GNA12-silenced cells. |
Table IV.
Pathway analysis of upregulated genes
in GNA12-silenced cells.
| A, Kyoto
Encyclopedia of Genes and Genomes pathway |
|---|
|
|---|
| Term | Description | Gene count | False discovery
rate |
|---|
| hsa-0110 | Metabolic
pathways | 34 |
5.57×10⁶ |
| hsa00190 | Oxidative
phosphorylation | 26 |
1.79×10²² |
| hsa03050 | Proteasome | 24 |
5.40×1029 |
| hsa04218 | Cell cycle | 12 |
2.25×10⁵ |
| hsa05202 | Transcriptional
misregulation in cancer | 7 |
2.32×10⁴ |
|
| B, Reactome
pathway |
|
| Term |
Description | Gene
count | False discovery
rate |
|
| HSA-392499 | Metabolism of
proteins | 40 |
7.46×10⁵ |
| HSA-69620 | Cell cycle
checkpoints | 33 |
6.55×1024 |
| HSA-5668541 | Cellular responses
to stress | 35 |
2.69×10²¹ |
| HSA-174178 | APC/C:Cdh1 mediated
degradation of Cdc20 and other APC/C:Cdh1 targeted proteins in
late/early mitosis | 30 |
8.83×1035 |
| HSA-75815 | Ubiquitin mediated
degradation of cyclin D | 27 |
2.49×1033 |
Identification of the hub and
bottleneck nodes
The network was further analyzed to identify the
critical genes that define the hub nodes of the PPI network using
the cytoHubba plugin in Cytoscape (25). The multiple algorithms of the
cytoHubba, including Degree, MCC, MNC, EPC, EcCentricity,
Closeness, Betweenness and Clustering Coefficient, were used to
identify the hub nodes of the PPI networks (26). The intersecting genes identified by
the different algorithms were tabulated (Table V). Results from this analysis
identified AKT1, VEGFA, BCL2L1, TGFB1 and STAT3 as
the top five hub nodes (Fig. 2,
Insert; Table V). In addition to hub
nodes, the identification of bottleneck nodes has equal or more
importance in PPI networks due to their role as the key ‘connector
proteins’ (29,30). Therefore, the bottleneck nodes of the
network were extracted using the BottleNeck algorithm in cytoHubba
application of Cytoscape. The results demonstrated that
VEGFA, AKT1 and STAT3 were defined the bottleneck
nodes, in addition to IGF1 and GHRH (Fig. 2, Insert).
| Table V.Hub and bottleneck genes
downregulated in GNA12-silenced cells. |
Table V.
Hub and bottleneck genes
downregulated in GNA12-silenced cells.
| Genes | Nodes | Function | (Refs.) |
|---|
| AKT | Hub and
bottleneck | Amplified in
ovarian cancer patients; confers resistance to paclitaxel. | (33) |
| VEGFA | Hub and
bottleneck | Overexpression in
ovarian cancer patients; tumor angiogenesis, associated with
distant metastasis and resistance to chemotherapy. | (34–36) |
| STAT3 | Hub and
bottleneck | Tumor cell growth;
survival, growth, stemness and tumor angiogenesis. | (41) |
| BCL2L1 | Hub | Anti-apoptosis;
confers platinum resistance. | (39,40) |
| TGFB1 | Hub | Tumor growth,
epithelial-mesenchymal transition and metastasis. | (37,38) |
| IGF1 | Bottleneck | Overexpressed in
ovarian cancer; tumor cell proliferation; immunosuppressive
role. | (42,43) |
| GHRH | Bottleneck | Endogenous
synthesis in ovarian cancer cells; ovarian cancer growth; tumor
vascularization. | (44,45) |
A similar analysis was conducted to extract the hub
nodes and the bottleneck nodes of the upregulated genes. The
results identified proteasome 20S subunit (PSM) β 6 (PSMB6),
PSM α 6 (PSMA6), PSM ATPase 5
(PSMC5), ubiquitin conjugating enzyme E2 E1 (UBE2E1)
and PSM non-ATPase 10 (PSMD10), the genes involved in
proteasomal proteolysis, as the hub nodes (Fig. 3, Insert; Table VI). PSMA6 and PSMB6
were also identified as bottleneck nodes, along with NDUFA4
mitochondrial complex associated (NDUFA4), NADH:ubiquinone
oxidoreductase subunit B8 (NDUFB8) and anaphase promoting
complex subunit 1 (ANAPC1) genes (Fig. 3, Insert; Table VI).
| Table VI.Hub and bottleneck genes upregulated
in GNA12-silenced cells. |
Table VI.
Hub and bottleneck genes upregulated
in GNA12-silenced cells.
| Genes | Nodes | Function | (Refs.) |
|---|
| PSMB6 | Hub and
bottleneck | 20S proteasome
subunit; context specific apoptosis. | (47,48) |
| PSMA6 | Hub and
bottleneck | 20S proteasome
subunit; context specific apoptosis; confers chemosensitivity. | (49) |
| PSMC5 | Hub | 26S proteasome
regulatory subunit; confers radiosensitivity. | (50) |
| PSMD10 | Hub | 26S proteasome
regulatory subunit; oncogene, but involved in context specific
apoptosis. | (47,48) |
| UBE2E1 | Hub | PRC1 mediated gene
silencing. | (46) |
| NDUFA4 | Bottleneck | Subunit of complex
IV of the mitochondrial electron transport chain; reduced
expression associated with metabolic reprograming in renal cell
carcinoma. | (84) |
| NDUFB8 | Bottleneck | Accessory subunit
of NADH dehydrogenase complex I of the mitochondrial electron
transport chain; reduced expression associated with metabolic
reprograming in breast cancer cells. | (91) |
| ANAPC1 | Bottleneck | Cell cycle arrest;
mitotic checkpoint regulator. | (53,54) |
Biological significance of the hub and
bottleneck nodes
The biological significance of the hub and
bottleneck node genes in relation to ovarian cancer was determined
via cBioPortal analysis (31,32).
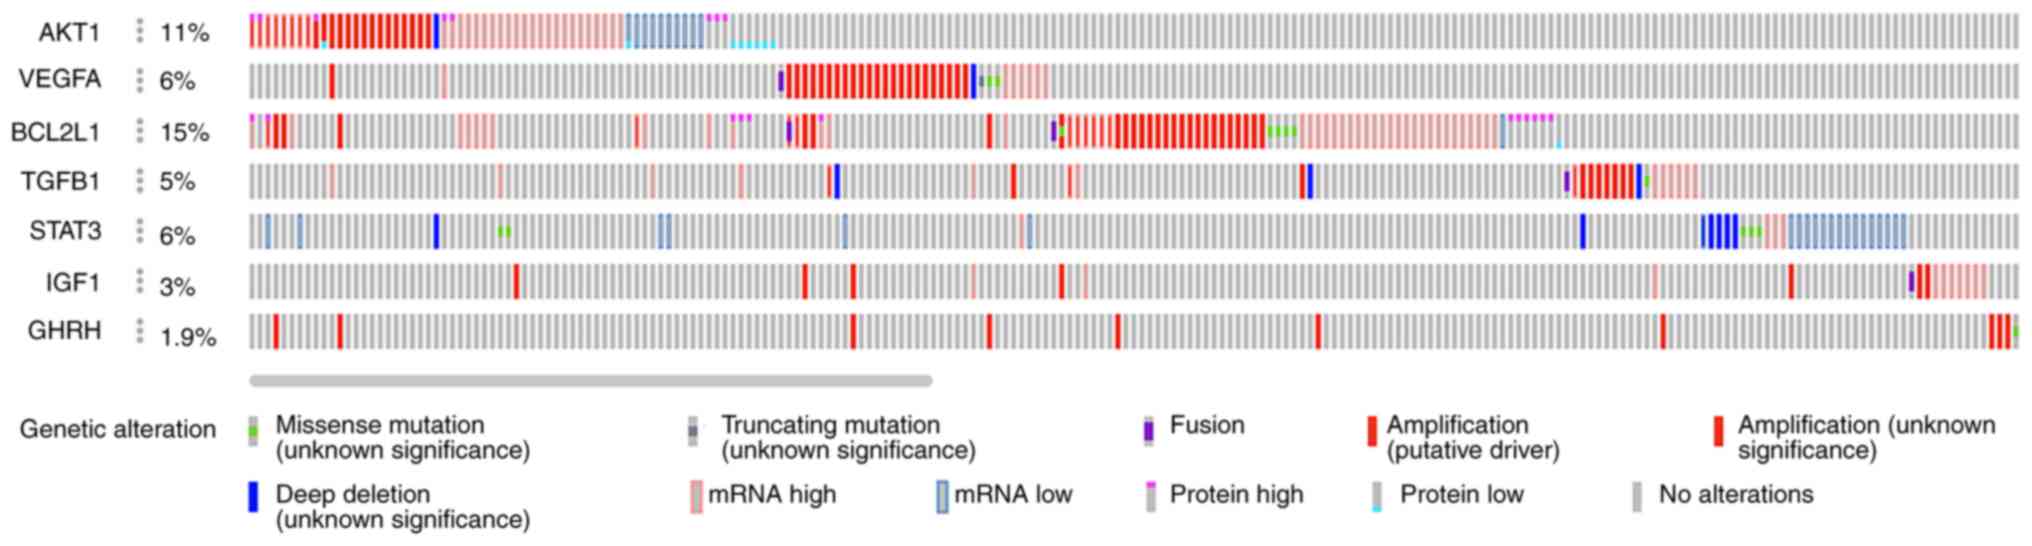
First, the hub and bottleneck genes downregulated in
GNA12-silenced cells were examined (Table V). The oncoprint profile of these
genes indicated that they were either amplified or upregulated in
at least 4–10% of the patients with ovarian cancer (Fig. 4). Functional annotation of these
genes, as shown in Table V,
indicated that the aberrant increased expression of these genes was
associated with cancer growth, progression, metastasis and therapy
resistance in ovarian cancer (33–45).
Next, the hub and bottleneck genes upregulated in
GNA12-silenced cells were examined (Table VI). These nodes, representing the
genes that would have been suppressed by GNA12, were found
to be associated with proteasome-mediated context-specific
apoptotic pathways and therapy resistance in numerous cancer types
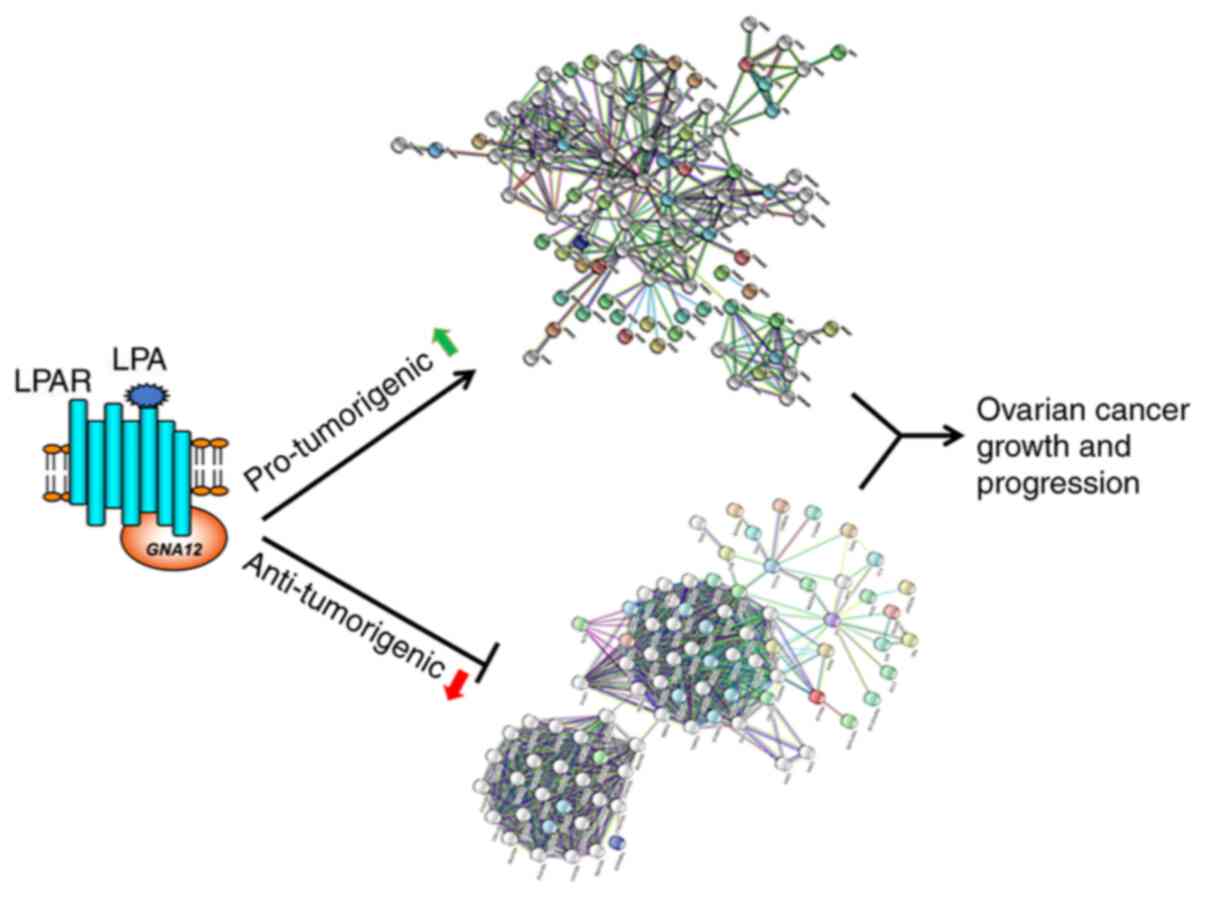
(46–57). Taken together, the functional
analyses of the hub and bottleneck genes indicated that the genes
downregulated in GNA12-silenced cells coded for
pro-tumorigenic proteins, while the genes upregulated upon
silencing of GNA12 encoded anti-tumorigenic proteins
(Fig. 5).
Discussion
Autocrine and paracrine signaling by LPA serve a
determinant role in cancer development and progression, and this is
evident in the context of ovarian cancer (15,16). Our
previous studies have reported that activation of GNA12 by LPA/LPAR
signaling or mutational activation of GNA12 into the
gep oncogene serve a critical role in the oncogenic
proliferation of ovarian cancer cells (15,16). In
the present study, the key signaling pathways and critical genetic
nodes that are aberrantly regulated by LPA/LPAR/GNA12
signaling in ovarian cancer were identified. In the cellular model
used, the genes that were downregulated upon silencing of
GNA12 represent the genes that would be upregulated by an
intact LPA/LPAR/GNA12 signaling pathway, whereas the genes
that were upregulated upon silencing GNA12 represent the genes that
would be suppressed by this signaling pathway. The array analyses
results indicated that genes that were upregulated by GNA12
(downregulated in GNA12-silenced cells) were mostly
pro-tumorigenic, while genes that were downregulated by GNA12
(upregulated in GNA12-silenced cells) were
growth-inhibitory. These array results were corroborated by the
findings demonstrating that GNA12 silencing decreased the
expression of pro-tumorigenic genes, along with a coincident
increase in the expression of growth-suppressive genes. ANKRD1,
BST1 and CAGE1 have been previously shown to have
oncogenic role in different cancer types, including ovarian cancer.
ANKRD1 has been revealed to promote drug-resistance and
epithelial-mesenchymal transition (EMT) in multiple cancer cells,
including ovarian cancer cells (58,59).
Moreover, BST1 has been observed to induce EMT in ovarian
cancer cells (59,60), while CAGE1 is known to promote
both proliferation and migration in different cancer cells
(61). By contrast, the genes
upregulated upon silencing of GNA12, have been shown to
exert a tumor suppressive role in different cancer types. For
example, SPIN3 has been identified as a tumor suppressor
gene that induces apoptosis in human seminoma cancer cells
(62). Furthermore, ATG16L1
has been reported to be involved in promoting autophagic cell death
in ovarian cancer cells (63). THPO,
encoded by THPO, has also been observed to induce apoptosis
in a context specific manner (64).
While the cellular function of TSPAN16 remains to be fully
defined, its weak expression profile in cancer cells has been
considered to be indicative of its tumor suppressing potential
(65). Collectively, GNA12
appears to stimulate a pro-tumorigenic network, along with the
simultaneous suppression of a growth-inhibitory network.
The synergistic network organization was further
clarified by the current results from the GO enrichment analyses.
While GO enrichment in CC was in accordance with the known role of
GNA12 in transmitting the plasma membrane-located LPA/LPAR
signaling from the cell periphery, novel insights could be gained
via the analyses of GO BP and MF. The GO:BP enrichment indicated
that the pathways upregulated by GNA12, thus downregulated in
GNA12-silenced cells, were associated with critical BP and
MF associated with cancer progression, metastasis and therapy
resistance. In fact, GO:BP, such as ‘positive regulation of
biological process’ (GO:0048518), has already been shown to be
associated with chemoresistance in HGSOC (55). Other GO:BPs, such as ‘cellular
response to stimulus’ (GO:0048583), ‘cell adhesion’ (GO:0007155),
‘cell proliferation’ (GO:0008283) and ‘cell motility’ (GO:0048870),
have been associated with cancer growth, recurrence and therapy
resistance in numerous cancer types (56,57,66,67).
Together with the indicated functions in GO:MF enrichments, the
current novel findings emphasize the oncogenic role of GNA12 in
transmitting signals from the LPA/LPAR signaling pathway located in
the cellular periphery to a set of highly consequential nuclear
events. Another significant analytical suggestion from the results
was that genes suppressed by GNA12, as evidenced by their
upregulation in GNA12-silenced cells, show GO enrichments in
BP and MF associated with ‘negative regulation of cell growth
processes’. The GO:MF enrichment also suggested the potential role
of GNA12 in suppressing proteolysis associated with negative
cell proliferative.
Ovarian cancer is characterized by a heterogeneous
histopathology with the manifestation of dissimilar genetic and
pathway alterations. Major pathways that are aberrantly altered in
a range of subtypes include TP53 (68,69),
PI3K/AKT (70–72), VEGF (73,74),
EGFR (75,76) and FoxO signaling (77). It was significant that KEGG and
Reactome pathway analyses of the DEGs upregulated in
GNA12-silenced cells directly linked GNA12 to these
multiple tumor-promoting pathways. KEGG and Reactome pathways
upregulated in GNA12-silenced cells involved pathways
associated with cell cycle check points, including ‘APC/C mediated
proteasomal degradation of mitotic proteins’. Thus, the pathway
analyses present an oncogenic paradigm orchestrated by GNA12 in
which mutational or LPA/LPAR activation of GNA12 leads to
the stimulation of a pro-tumorigenic network, while concurrently
suppressing an anti-tumorigenic network involving anti-mitotic,
anti-proliferative and cellular stress pathways. This was further
substantiated by the analysis of the hub and bottleneck signaling
nodes derived from the PPI networks of the DEGs, especially the
ones that were downregulated in GNA12-silenced cells. In
line with the oncogenic role of GNA12, these genes were
upregulated in distinct subsets of patients with ovarian cancer and
were critically involved in ovarian cancer pathobiology.
AKT1 gene is frequently upregulated in ovarian cancer and is
associated with paclitaxel resistance in patients with ovarian
cancer (33). Furthermore, the
upregulation of VEGFA has been shown to be associated with
distant metastasis and resistance to chemotherapy in patients with
ovarian cancer (34–36). Increased expression of TGB1
has been correlated with EMT, tumor growth and metastasis in
ovarian cancer (37,38), while overexpression of BCL2L1
is associated with anti-apoptosis effects and platinum resistance
(39,40). In addition, STAT3 signaling in
ovarian cancer has been reported to be associated with tumor cell
proliferation, survival, stemness and angiogenesis (41), while the overexpression of
IGF1 has been revealed to stimulate the proliferation of
ovarian cancer cells, along with its immunosuppressive role in
ovarian cancer (42,43). In a similar manner, GHRH,
which is endogenously produced in ovarian cancer cells, is involved
in ovarian cancer growth and tumor vascularization (44,45). The
oncogenic role for these genes has also been shown by the oncoprint
profiles of these genes generated using the CBioPortal. In fact,
in silico data-mining indicated that all of the
GNA12-regulated hub and bottleneck nodes identified her such
as AKT, VEGFA, BCL2L1, TGFb1, IGF1, and GHRH are
associated with poor prognosis in ovarian cancer (78–83).
A new paradigm emerging from the current analysis
showed the potential role of GNA12 in suppressing the
proteasome pathway. It is of interest to note that the proteasomal
proteolytic machinery has been reported to be required for the
rapid onset of death receptor-induced apoptosis in a
context-specific manner (47,48). In
fact, it has been documented that the overexpression of PSMA6 and
PSMC5 was associated with chemoresistance in prostate cancer and
radiation-therapy resistance in lung cancer, respectively (49,50).
Moreover, ANAPC1, a hub/pathway gene in this network, is
part of the APC/C, which is involved in cell cycle arrest at
G1 phase. APC/C is an E3-ubiquitin ligase that regulates
cell cycle arrest by marking cell cycle proteins, such as cyclins,
for degradation by proteasomes during cell cycle exit (53,54).
UBE2E1, which was identified here as the hub and pathway
gene, encodes an E2-ubiquitin conjugating enzyme. It has been
revealed that UBE2E1 can complex with polycomb repressive complex 1
(PRC1), the E3 ligase complex responsible for histone H2A
ubiquitination and gene silencing (46). With the established role of PRC1
complex in the silencing of tumor suppressor genes (84), it can be considered that
UBE2E1 serves an active role in PRC1-mediated silencing of
tumor suppressor genes.
One of the hallmarks of cancer involves metabolic
reprogramming in cancer cells, with a shift towards aerobic
glycolysis. It is known that along with the glycolytic shift,
cancer cells concomitantly suppress mitochondrial oxidative
phosphorylation (85). While the
mechanism via which cancer cells proactively resort to glycolytic
shift is beginning to be understood, the role of an active
signaling mechanism involved in suppressing oxidative
phosphorylation has thus far remained uncharacterized. In this
regard, NDUFA4 and NDUFB8, which have been identified
as bottleneck genes in the GNA12-suppressed network, are
highly relevant. NDUFA4 and NDUFB8 are subunits of complex IV and
complex I of the mitochondrial electron transport chain, and are
essential components involved in mitochondrial oxidative
phosphorylation (86–88). The decreased expression of NDUFA4 has
been correlated with the suppression of oxidative phosphorylation
and stimulation of glycolysis in renal cell carcinoma (89,90).
Similarly, low expression of NDUFB8 has been associated with
impaired oxidative phosphorylation, along with a shift towards
aerobic glycolysis in breast cancer cells (91). These findings, along with the current
results that NDUFA4 and NDUFB8 were identified as bottleneck nodes,
revealed the previously uncharacterized signaling node via which
the LPA/LPAR/GNA12 signaling network could suppress
oxidative phosphorylation to promote glycolytic shift in ovarian
cancer cells. Thus, taken together, GNA12 appears to promote
ovarian cell proliferation by suppressing multi-faceted
anti-tumorigenic signaling nodes.
In summary, the present results provided novel
insights into the mechanism via which GNA12, stimulated by LPA/LPAR
or mutational activation, could coordinate the upregulation of a
growth promoting signaling network, while simultaneously regulating
the downregulation of a growth-suppressive signaling network, to
promote ovarian cancer growth. While the dysregulation of numerous
different pathways is known in ovarian cancer, the core signal
processing unit that connects the signaling nodes into a
coordinated oncogenic network remains unknown. The current study
demonstrated such a role for the LPA/LPAR/GNA12 signaling
unit in ovarian cancer. The present study identified the duplex
signaling mode of GNA12 via which the pro-tumorigenic signaling
network was upregulated, along with the simultaneous downregulation
of growth-suppressive signaling network in ovarian cancer. It has
been realized that the therapeutic targeting of a single pathway
may not be an effective treatment strategy for multiple type of
cancer. This is especially true in the case of ovarian cancer, due
to its subtype and pathway heterogeneity. In this context, the
current finding that the LPA/LPAR/GNA12 signaling nexus
regulated multiple hub and bottleneck nodes of an extensive
oncogenic network suggested that this axis may be a potential
target for the development of network-targeted combination
therapeutic strategies for treating ovarian cancer.
Supplementary Material
Supporting Data
Acknowledgements
Not applicable.
Funding
The present research was supported by a pilot grant
from the Stephenson Cancer Center, The Department of Defense
Ovarian Cancer Research Program Award (grant no. W81XWH-18-1-0066)
and The National Institutes of Health grant (grant no. GM103639).
Computational services were supported by The National Institute of
General Medical Sciences P20 (grant no. GM103639) and The National
Cancer Institute of the National Institutes of Health (grant no.
P30CA225520).
Availability of data and materials
The microarray data presented in the present study
are deposited at the Gene Expression Omnibus (https://www.ncbi.nlm.nih.gov/geo/; accession no.
GSE173214. Oncoprint data supporting the reported results used the
Ovarian Serous Cystadenocarcinoma (TCGA, Firehose Legacy) dataset
available https://www.cbioportal.org.
Authors' contributions
CI, YSS, JHH, MJ and DND conceptualized the study.
MY, JHH and MJ developed the methodology. JHH and PD validated the
experiments. MY, JHH and PD performed the formal analysis. DND
procured resources. MY, MJ, PD and JHH curated and analyzed the
data. DND wrote and prepared the original draft. DND, YSS and CI
were responsible for writing, revising and editing the manuscript.
DND supervised, acquired funds and was project administrator. All
authors have read and approved the final version of the manuscript.
DND, YSS, MJ, JHH and CI confirm the authenticity of all the raw
data.
Ethics approval and consent to
participate
Approved by the Institutional Review Board of the
University of Oklahoma (approval no. #9599).
Patient consent for publication
Not applicable.
Competing interests
The authors declare that they have no competing
interests.
Glossary
Abbreviations
Abbreviations:
|
LPA
|
lysophospatidic acid
|
|
LPAR
|
lysophosphatidic acid receptor
|
References
|
1
|
Sung H, Ferlay J, Siegel RL, Laversanne M,
Soerjomataram I, Jemal A and Bray F: Global cancer statistics 2020:
GLOBOCAN estimates of incidence and mortality worldwide for 36
cancers in 185 countries. CA Cancer J Clin. 71:209–249. 2021.
View Article : Google Scholar : PubMed/NCBI
|
|
2
|
Siegel RL, Miller KD, Fuchs HE and Jemal
A: Cancer Statistics, 2021. CA Cancer J Clin. 71:7–33. 2021.
View Article : Google Scholar : PubMed/NCBI
|
|
3
|
Bast RC Jr, Lu Z, Han CY, Lu KH, Anderson
KS, Drescher CW and Skates SJ: Biomarkers and strategies for early
detection of ovarian cancer. Cancer Epidemiol Biomarkers Prev.
29:2504–2512. 2020. View Article : Google Scholar : PubMed/NCBI
|
|
4
|
Wang Q, Peng H, Qi X, Wu M and Zhao X:
Targeted therapies in gynecological cancers: A comprehensive review
of clinical evidence. Signal Transduct Target Ther. 5:1372020.
View Article : Google Scholar : PubMed/NCBI
|
|
5
|
Mills GB and Moolenaar WH: The emerging
role of lysophosphatidic acid in cancer. Nat Rev Cancer. 3:582–591.
2003. View Article : Google Scholar : PubMed/NCBI
|
|
6
|
Cui R, Bai H, Cao G and Zhang Z: The role
of lysophosphatidic acid receptors in ovarian cancer: A minireview.
Crit Rev Eukaryot Gene Expr. 30:265–272. 2020. View Article : Google Scholar : PubMed/NCBI
|
|
7
|
Moolenaar WH: LPA: A novel lipid mediator
with diverse biological actions. Trends Cell Biol. 4:213–219. 1994.
View Article : Google Scholar : PubMed/NCBI
|
|
8
|
Moolenaar WH, van Meeteren LA and Giepmans
BN: The ins and outs of lysophosphatidic acid signaling. Bioessays.
26:870–881. 2004. View Article : Google Scholar : PubMed/NCBI
|
|
9
|
Noguchi K, Herr D, Mutoh T and Chun J:
Lysophosphatidic acid (LPA) and its receptors. Curr Opin Pharmacol.
9:15–23. 2009. View Article : Google Scholar : PubMed/NCBI
|
|
10
|
Radhika V and Dhanasekaran N: Transforming
G proteins. Oncogene. 20:1607–1614. 2001. View Article : Google Scholar : PubMed/NCBI
|
|
11
|
Goldsmith ZG and Dhanasekaran DN: G
protein regulation of MAPK networks. Oncogene. 26:3122–3142. 2007.
View Article : Google Scholar : PubMed/NCBI
|
|
12
|
Radhakrishnan R, Ha JH and Dhanasekaran
DN: Mitogenic signaling by the gep oncogene involves the
upregulation of S-phase kinase-associated protein 2. Genes Cancer.
1:1033–1043. 2010. View Article : Google Scholar : PubMed/NCBI
|
|
13
|
Ha JH, Radhakrishnan R, Jayaraman M, Yan
M, Ward JD, Fung KM, Moxley K, Sood AK, Isidoro C, Mukherjee P, et
al: LPA induces metabolic reprogramming in ovarian cancer via a
pseudohypoxic response. Cancer Res. 78:1923–1934. 2018. View Article : Google Scholar : PubMed/NCBI
|
|
14
|
Radhakrishnan R, Ha JH, Jayaraman M, Liu
J, Moxley KM, Isidoro C, Sood AK, Song YS and Dhanasekaran DN:
Ovarian cancer cell-derived lysophosphatidic acid induces
glycolytic shift and cancer-associated fibroblast-phenotype in
normal and peritumoral fibroblasts. Cancer Lett. 442:464–474. 2019.
View Article : Google Scholar : PubMed/NCBI
|
|
15
|
Goldsmith ZG, Ha JH, Jayaraman M and
Dhanasekaran DN: Lysophosphatidic acid stimulates the proliferation
of ovarian cancer cells via the gep proto-oncogene Galpha(12).
Genes Cancer. 2:563–575. 2011. View Article : Google Scholar : PubMed/NCBI
|
|
16
|
Ha JH, Gomathinayagam R, Yan M, Jayaraman
M, Ramesh R and Dhanasekaran DN: Determinant role for the gep
oncogenes, Galpha12/13, in ovarian cancer cell proliferation and
xenograft tumor growth. Genes Cancer. 6:356–364. 2015. View Article : Google Scholar : PubMed/NCBI
|
|
17
|
Juneja J and Casey PJ: Role of G12
proteins in oncogenesis and metastasis. Br J Pharmacol. 158:32–40.
2009. View Article : Google Scholar : PubMed/NCBI
|
|
18
|
Kelly P, Stemmle LN, Madden JF, Fields TA,
Daaka Y and Casey PJ: A role for the G12 family of heterotrimeric G
proteins in prostate cancer invasion. J Biol Chem. 281:26483–24490.
2006. View Article : Google Scholar : PubMed/NCBI
|
|
19
|
Kelly P, Moeller BJ, Juneja J, Booden MA,
Der CJ, Daaka Y, Dewhirst MW, Fields TA and Casey PJ: The G12
family of heterotrimeric G proteins promotes breast cancer invasion
and metastasis. Proc Natl Acad Sci USA. 103:8173–8178. 2006.
View Article : Google Scholar : PubMed/NCBI
|
|
20
|
Liu SC, Jen YM, Jiang SS, Chang JL, Hsiung
CA, Wang CH and Juang JL: G(alpha)12-mediated pathway promotes
invasiveness of nasopharyngeal carcinoma by modulating actin
cytoskeleton reorganization. Cancer Res. 69:6122–6130. 2009.
View Article : Google Scholar : PubMed/NCBI
|
|
21
|
Wuchty S, Zhang A, Walling J, Ahn S, Li A,
Quezado M, Oberholtzer C, Zenklusen JC and Fine HA: Gene pathways
and subnetworks distinguish between major glioma subtypes and
elucidate potential underlying biology. J Biomed Inform.
43:945–952. 2010. View Article : Google Scholar : PubMed/NCBI
|
|
22
|
Huang DW, Sherman BT, Tan Q, Kir J, Liu D,
Bryant D, Guo Y, Stephens R, Baseler MW, Lane HC and Lempicki RA:
DAVID Bioinformatics Resources: Expanded annotation database and
novel algorithms to better extract biology from large gene lists.
Nucleic Acids Res. 35:W169–W175. 2007. View Article : Google Scholar : PubMed/NCBI
|
|
23
|
Szklarczyk D, Gable AL, Lyon D, Junge A,
Wyder S, Huerta-Cepas J, Simonovic M, Doncheva NT, Morris JH, Bork
P, et al: STRING v11: Protein-protein association networks with
increased coverage, supporting functional discovery in genome-wide
experimental datasets. Nucleic Acids Res. 47:D607–D613. 2019.
View Article : Google Scholar : PubMed/NCBI
|
|
24
|
Shannon P, Markiel A, Ozier O, Baliga NS,
Wang JT, Ramage D, Amin N, Schwikowski B and Ideker T: Cytoscape: A
software environment for integrated models of biomolecular
interaction networks. Genome Res. 13:2498–2504. 2003. View Article : Google Scholar : PubMed/NCBI
|
|
25
|
Chin CH, Chen SH, Wu HH, Ho CW, Ko MT and
Lin CY: cytoHubba: Identifying hub objects and sub-networks from
complex interactome. BMC Syst Biol. 8 (Suppl 4):S112014. View Article : Google Scholar : PubMed/NCBI
|
|
26
|
Liu Z, Meng J, Li X, Zhu F, Liu T, Wu G
and Zhang L: Identification of hub genes and key pathways
associated with two subtypes of diffuse large B-cell lymphoma based
on gene expression profiling via integrated bioinformatics. Biomed
Res Int. 2018:35745342018.PubMed/NCBI
|
|
27
|
Vogler O, Barcelo JM, Ribas C and Escriba
PV: Membrane interactions of G proteins and other related proteins.
Biochim Biophys Acta. 1778:1640–10652. 2008. View Article : Google Scholar : PubMed/NCBI
|
|
28
|
Solary E, Eymin B, Droin N and Haugg M:
Proteases, proteolysis, and apoptosis. Cell Biol Toxicol.
14:121–132. 1998. View Article : Google Scholar : PubMed/NCBI
|
|
29
|
Yu H, Kim PM, Sprecher E, Trifonov V and
Gerstein M: The importance of bottlenecks in protein networks:
Correlation with gene essentiality and expression dynamics. PLoS
Comput Biol. 3:e592007. View Article : Google Scholar : PubMed/NCBI
|
|
30
|
Charitou T, Bryan K and Lynn DJ: Using
biological networks to integrate, visualize and analyze genomics
data. Genet Sel Evol. 48:272016. View Article : Google Scholar : PubMed/NCBI
|
|
31
|
Cerami E, Gao J, Dogrusoz U, Gross BE,
Sumer SO, Aksoy BA, Jacobsen A, Byrne CJ, Heuer ML, Larsson E, et
al: The cBio cancer genomics portal: An open platform for exploring
multidimensional cancer genomics data. Cancer Discov. 2:401–404.
2012. View Article : Google Scholar : PubMed/NCBI
|
|
32
|
Gao J, Aksoy BA, Dogrusoz U, Dresdner G,
Gross B, Sumer SO, Sun Y, Jacobsen A, Sinha R, Larsson E, et al:
Integrative analysis of complex cancer genomics and clinical
profiles using the cBioPortal. Sci Signal. 6:pl12013. View Article : Google Scholar : PubMed/NCBI
|
|
33
|
Despierre E, Lambrechts D, Neven P, Amant
F, Lambrechts S and Vergote I: The molecular genetic basis of
ovarian cancer and its roadmap towards a better treatment. Gynecol
Oncol. 117:358–365. 2010. View Article : Google Scholar : PubMed/NCBI
|
|
34
|
Guan J, Darb-Esfahani S, Richter R, Taube
ET, Ruscito I, Mahner S, Woelber L, Prieske K, Concin N, Vergote I,
et al: Vascular endothelial growth factor receptor 2 (VEGFR2)
correlates with long-term survival in patients with advanced
high-grade serous ovarian cancer (HGSOC): A study from the Tumor
Bank Ovarian Cancer (TOC) Consortium. J Cancer Res Clin Oncol.
145:1063–1073. 2019. View Article : Google Scholar : PubMed/NCBI
|
|
35
|
Sopo M, Anttila M, Hamalainen K, Kivela A,
Yla-Herttuala S, Kosma VM, Keski-Nisula L and Sallinen H:
Expression profiles of VEGF-A, VEGF-D and VEGFR1 are higher in
distant metastases than in matched primary high grade epithelial
ovarian cancer. BMC Cancer. 19:5842019. View Article : Google Scholar : PubMed/NCBI
|
|
36
|
Li X, Hu Z, Shi H, Wang C, Lei J and Cheng
Y: Inhibition of VEGFA increases the sensitivity of ovarian cancer
cells to chemotherapy by suppressing VEGFA-Mediated Autophagy. Onco
Targets Ther. 13:8161–8171. 2020. View Article : Google Scholar : PubMed/NCBI
|
|
37
|
Bai Y, Li LD, Li J, Chen RF, Yu HL, Sun
HF, Wang JY and Lu X: A FXYD5/TGFβ/SMAD positive feedback loop
drives epithelialtomesenchymal transition and promotes tumor growth
and metastasis in ovarian cancer. Int J Oncol. 56:301–314.
2020.PubMed/NCBI
|
|
38
|
Liang S, Yao Q, Wei D, Liu M, Geng F, Wang
Q and Wang YS: KDM6B promotes ovarian cancer cell migration and
invasion by induced transforming growth factor-β1 expression. J
Cell Biochem. 120:493–506. 2019. View Article : Google Scholar : PubMed/NCBI
|
|
39
|
Beale PJ, Rogers P, Boxall F, Sharp SY and
Kelland LR: BCL-2 family protein expression and platinum drug
resistance in ovarian carcinoma. Br J Cancer. 82:436–440. 2000.
View Article : Google Scholar : PubMed/NCBI
|
|
40
|
Yuan J, Lan H, Jiang X, Zeng D and Xiao S:
Bcl2 family: Novel insight into individualized therapy for ovarian
cancer (Review). Int J Mol Med. 46:1255–1265. 2020.PubMed/NCBI
|
|
41
|
Liang R, Chen X, Chen L, Wan F, Chen K,
Sun Y and Zhu X: STAT3 signaling in ovarian cancer: A potential
therapeutic target. J Cancer. 11:837–848. 2020. View Article : Google Scholar : PubMed/NCBI
|
|
42
|
Diener A and Rohrmann S: Associations of
serum carotenoid concentrations and fruit or vegetable consumption
with serum insulin-like growth factor (IGF)-1 and IGF binding
protein-3 concentrations in the Third National Health and Nutrition
Examination survey (NHANES III). J Nutr Sci. 5:e132016. View Article : Google Scholar : PubMed/NCBI
|
|
43
|
Yahya MA, Sharon SM, Hantisteanu S, Hallak
M and Bruchim I: The role of the insulin-like growth factor 1
pathway in immune tumor microenvironment and its clinical
ramifications in gynecologic malignancies. Front Endocrinol
(Lausanne). 9:2972018. View Article : Google Scholar : PubMed/NCBI
|
|
44
|
Khorram O, Garthwaite M, Grosen E and
Golos T: Human uterine and ovarian expression of growth
hormone-releasing hormone messenger RNA in benign and malignant
gynecologic conditions. Fertil Steril. 75:174–179. 2001. View Article : Google Scholar : PubMed/NCBI
|
|
45
|
Klukovits A, Schally AV, Szalontay L,
Vidaurre I, Papadia A, Zarandi M, Varga JL, Block NL and Halmos G:
Novel antagonists of growth hormone-releasing hormone inhibit
growth and vascularization of human experimental ovarian cancers.
Cancer. 118:670–680. 2012. View Article : Google Scholar : PubMed/NCBI
|
|
46
|
Wheaton K, Sarkari F, Stanly Johns B,
Davarinejad H, Egorova O, Kaustov L, Raught B, Saridakis V and
Sheng Y: UbE2E1/UBCH6 is a critical in vivo E2 for the
PRC1-catalyzed ubiquitination of H2A at lys-119. J Biol Chem.
292:2893–2902. 2017. View Article : Google Scholar : PubMed/NCBI
|
|
47
|
Sohn D, Totzke G, Schulze-Osthoff K and
Janicke RU: Friend or foe? The proteasome in combined cancer
therapy. Cell Cycle. 5:841–845. 2006. View Article : Google Scholar : PubMed/NCBI
|
|
48
|
Sohn D, Totzke G, Essmann F,
Schulze-Osthoff K, Levkau B and Janicke RU: The proteasome is
required for rapid initiation of death receptor-induced apoptosis.
Mol Cell Biol. 26:1967–1978. 2006. View Article : Google Scholar : PubMed/NCBI
|
|
49
|
Milone MR, Pucci B, Bifulco K, Iannelli F,
Lombardi R, Ciardiello C, Bruzzese F, Carriero MV and Budillon A:
Proteomic analysis of zoledronic-acid resistant prostate cancer
cells unveils novel pathways characterizing an invasive phenotype.
Oncotarget. 6:5324–5341. 2015. View Article : Google Scholar : PubMed/NCBI
|
|
50
|
Yim JH, Yun HS, Lee SJ, Baek JH, Lee CW,
Song JY, Um HD, Park JK, Kim JS, Park IC and Hwang SG:
Radiosensitizing effect of PSMC5, a 19S proteasome ATPase, in H460
lung cancer cells. Biochem Biophys Res Commun. 469:94–100. 2016.
View Article : Google Scholar : PubMed/NCBI
|
|
51
|
Kim J, Yu L, Chen W, Xu Y, Wu M, Todorova
D, Tang Q, Feng B, Jiang L, He J, et al: Wild-type p53 promotes
cancer metabolic switch by inducing PUMA-dependent suppression of
oxidative phosphorylation. Cancer Cell. 35:191–203 e8. 2019.
View Article : Google Scholar : PubMed/NCBI
|
|
52
|
Ajeawung NF, Nguyen TTM, Lu L, Kucharski
TJ, Rousseau J, Molidperee S, Atienza J, Gamache I, Jin W, Plon SE,
et al: Mutations in ANAPC1, encoding a scaffold subunit of the
anaphase-promoting complex, cause rothmund-thomson syndrome type 1.
Am J Hum Genet. 105:625–630. 2019. View Article : Google Scholar : PubMed/NCBI
|
|
53
|
Ping Z, Lim R, Bashir T, Pagano M and
Guardavaccaro D: APC/C (Cdh1) controls the proteasome-mediated
degradation of E2F3 during cell cycle exit. Cell Cycle.
11:1999–2005. 2012. View Article : Google Scholar : PubMed/NCBI
|
|
54
|
Kernan J, Bonacci T and Emanuele MJ: Who
guards the guardian? Mechanisms that restrain APC/C during the cell
cycle. Biochim Biophys Acta Mol Cell Res. 1865:1924–1933. 2018.
View Article : Google Scholar : PubMed/NCBI
|
|
55
|
Wu Y, Xia L, Guo Q, Zhu J, Deng Y and Wu
X: Identification of chemoresistance-associated key genes and
pathways in high-grade serous ovarian cancer by bioinformatics
analyses. Cancer Manag Res. 12:5213–5223. 2020. View Article : Google Scholar : PubMed/NCBI
|
|
56
|
Chen L, Zhang J, Li H, Niu J, Xue H, Liu
B, Wang Q, Luo X, Zhang F, Zhao D and Cao S: Transcriptomic
analysis reveals candidate genes for female sterility in
pomegranate flowers. Front Plant Sci. 8:14302017. View Article : Google Scholar : PubMed/NCBI
|
|
57
|
Hou DL, Chen L, Liu B, Song LN and Fang T:
Identification of common gene networks responsive to radiotherapy
in human cancer cells. Cancer Gene Ther. 21:542–548. 2014.
View Article : Google Scholar : PubMed/NCBI
|
|
58
|
Lei Y, Henderson BR, Emmanuel C, Harnett
PR and deFazio A: Inhibition of ANKRD1 sensitizes human ovarian
cancer cells to endoplasmic reticulum stress-induced apoptosis.
Oncogene. 34:485–495. 2015. View Article : Google Scholar : PubMed/NCBI
|
|
59
|
Takahashi A, Seike M, Chiba M, Takahashi
S, Nakamichi S, Matsumoto M, Takeuchi S, Minegishi Y, Noro R,
Kunugi S, et al: Ankyrin repeat domain 1 overexpression is
associated with common resistance to afatinib and osimertinib in
EGFR-mutant lung cancer. Sci Rep. 8:148962018. View Article : Google Scholar : PubMed/NCBI
|
|
60
|
Morone S, Lo-Buono N, Parrotta R,
Giacomino A, Nacci G, Brusco A, Larionov A, Ostano P, Mello-Grand
M, Chiorino G, et al: Overexpression of CD157 contributes to
epithelial ovarian cancer progression by promoting mesenchymal
differentiation. PLoS One. 7:e436492012. View Article : Google Scholar : PubMed/NCBI
|
|
61
|
Shim E, Shim H, Bae J, Lee H and Jeoung D:
CAGE displays oncogenic potential and induces cytolytic T
lymphocyte activity. Biotechnol Lett. 28:515–522. 2006. View Article : Google Scholar : PubMed/NCBI
|
|
62
|
Janecki DM, Sajek M, Smialek MJ, Kotecki
M, Ginter-Matuszewska B, Kuczynska B, Spik A, Kolanowski T,
Kitazawa R, Kurpisz M and Jaruzelska J: SPIN1 is a proto-oncogene
and SPIN3 is a tumor suppressor in human seminoma. Oncotarget.
9:32466–32477. 2018. View Article : Google Scholar : PubMed/NCBI
|
|
63
|
Satyavarapu EM, Nath S and Mandal C:
Desialylation of Atg5 by sialidase (Neu2) enhances autophagosome
formation to induce anchorage-dependent cell death in ovarian
cancer cells. Cell Death Discov. 7:262021. View Article : Google Scholar : PubMed/NCBI
|
|
64
|
Ehrenreich H, Hasselblatt M, Knerlich F,
von Ahsen N, Jacob S, Sperling S, Woldt H, Vehmeyer K, Nave KA and
Sirén AL: A hematopoietic growth factor, thrombopoietin, has a
proapoptotic role in the brain. Proc Natl Acad Sci USA.
102:862–867. 2005. View Article : Google Scholar : PubMed/NCBI
|
|
65
|
Puls KL, Ni J, Liu D, Morahan G and Wright
MD: The molecular characterisation of a novel tetraspanin protein,
TM4-B(1). Biochim Biophys Acta. 1447:93–99. 1999. View Article : Google Scholar : PubMed/NCBI
|
|
66
|
Lascorz J, Chen B, Hemminki K and Forsti
A: Consensus pathways implicated in prognosis of colorectal cancer
identified through systematic enrichment analysis of gene
expression profiling studies. PLoS One. 6:e188672011. View Article : Google Scholar : PubMed/NCBI
|
|
67
|
Chang IW, Liu KW, Ragunanan M, He HL,
Shiue YL and Yu SC: SERPINB5 expression: Association with CCRT
response and prognostic value in rectal cancer. Int J Med Sci.
15:376–84. 2018. View Article : Google Scholar : PubMed/NCBI
|
|
68
|
Zhang Y, Cao L, Nguyen D and Lu H: TP53
mutations in epithelial ovarian cancer. Transl Cancer Res.
5:650–663. 2016. View Article : Google Scholar : PubMed/NCBI
|
|
69
|
Ren YA, Mullany LK, Liu Z, Herron AJ, Wong
KK and Richards JS: Mutant p53 promotes epithelial ovarian cancer
by regulating tumor differentiation, metastasis, and responsiveness
to steroid hormones. Cancer Res. 76:2206–2218. 2016. View Article : Google Scholar : PubMed/NCBI
|
|
70
|
Cheng JQ, Godwin AK, Bellacosa A, Taguchi
T, Franke TF, Hamilton TC, Tsichlis PN and Testa JR: AKT2, a
putative oncogene encoding a member of a subfamily of
protein-serine/threonine kinases, is amplified in human ovarian
carcinomas. Proc Natl Acad Sci USA. 89:9267–9271. 1992. View Article : Google Scholar : PubMed/NCBI
|
|
71
|
Altomare DA, Wang HQ, Skele KL, De Rienzo
A, Klein-Szanto AJ, Godwin AK and Testa JR: AKT and mTOR
phosphorylation is frequently detected in ovarian cancer and can be
targeted to disrupt ovarian tumor cell growth. Oncogene.
23:5853–5857. 2004. View Article : Google Scholar : PubMed/NCBI
|
|
72
|
Ghoneum A and Said N: PI3K-AKT-mTOR and
NFkappaB pathways in ovarian cancer: Implications for targeted
therapeutics. Cancers (Basel). 11:9492019. View Article : Google Scholar : PubMed/NCBI
|
|
73
|
Masoumi Moghaddam S, Amini A, Morris DL
and Pourgholami MH: Significance of vascular endothelial growth
factor in growth and peritoneal dissemination of ovarian cancer.
Cancer Metastasis Rev. 31:143–162. 2012. View Article : Google Scholar : PubMed/NCBI
|
|
74
|
Yin X, Wang X, Shen B, Jing Y, Li Q, Cai
MC, Gu Z, Yang Q, Zhang Z, Liu J, et al: A VEGF-dependent gene
signature enriched in mesenchymal ovarian cancer predicts patient
prognosis. Sci Rep. 6:310792016. View Article : Google Scholar : PubMed/NCBI
|
|
75
|
Glaysher S, Bolton LM, Johnson P, Atkey N,
Dyson M, Torrance C and Cree IA: Targeting EGFR and PI3K pathways
in ovarian cancer. Br J Cancer. 109:1786–1794. 2013. View Article : Google Scholar : PubMed/NCBI
|
|
76
|
Wilken JA, Badri T, Cross S, Raji R,
Santin AD, Schwartz P, Branscum AJ, Baron AT, Sakhitab AI and
Maihle NJ: EGFR/HER-targeted therapeutics in ovarian cancer. Future
Med Chem. 4:447–469. 2012. View Article : Google Scholar : PubMed/NCBI
|
|
77
|
Han GH, Chay DB, Nam S, Cho H, Chung JY
and Kim JH: Prognostic implications of forkhead box protein O1
(FOXO1) and paired box 3 (PAX3) in epithelial ovarian cancer. BMC
Cancer. 19:12022019. View Article : Google Scholar : PubMed/NCBI
|
|
78
|
Cai J, Xu L, Tang H, Yang Q, Yi X, Fang Y,
Zhu Y and Wang Z: The role of the PTEN/PI3K/Akt pathway on
prognosis in epithelial ovarian cancer: A meta-analysis.
Oncologist. 19:528–335. 2014. View Article : Google Scholar : PubMed/NCBI
|
|
79
|
Duncan TJ, Al-Attar A, Rolland P, Scott
IV, Deen S, Liu DT, Spendlove I and Durrant LG: Vascular
endothelial growth factor expression in ovarian cancer: A model for
targeted use of novel therapies? Clin Cancer Res. 14:3030–3035.
2008. View Article : Google Scholar : PubMed/NCBI
|
|
80
|
Hu Q, Hisamatsu T, Haemmerle M, Cho MS,
Pradeep S, Rupaimoole R, Rodriguez-Aguayo C, Lopez-Berestein G,
Wong STC, Sood AK and Afshar-Kharghan V: Role of platelet-derived
Tgfβ1 in the progression of ovarian cancer. Clin Cancer Res.
23:5611–5621. 2017. View Article : Google Scholar : PubMed/NCBI
|
|
81
|
Bruchim I and Werner H: Targeting IGF-1
signaling pathways in gynecologic malignancies. Expert Opin Ther
Targets. 17:307–320. 2013. View Article : Google Scholar : PubMed/NCBI
|
|
82
|
Kahan Z, Arencibia JM, Csernus VJ, Groot
K, Kineman RD, Robinson WR and Schally AV: Expression of growth
hormone-releasing hormone (GHRH) messenger ribonucleic acid and the
presence of biologically active GHRH in human breast, endometrial,
and ovarian cancers. J Clin Endocrinol Metab. 84:582–589. 1999.
View Article : Google Scholar : PubMed/NCBI
|
|
83
|
Yokoyama T, Kohn EC, Brill E and Lee JM:
Apoptosis is augmented in high-grade serous ovarian cancer by the
combined inhibition of Bcl-2/Bcl-xL and PARP. Int J Oncol.
50:1064–1074. 2017. View Article : Google Scholar : PubMed/NCBI
|
|
84
|
Wang H, Liu C, Cheng J, Liu J, Zhang L, He
C, Shen WH, Jin H, Xu L and Zhang Y: Arabidopsis flower and embryo
developmental genes are repressed in seedlings by different
combinations of polycomb group proteins in association with
distinct sets of cis-regulatory elements. PLoS Genet.
12:e10057712016. View Article : Google Scholar : PubMed/NCBI
|
|
85
|
Diaz-Ruiz R, Rigoulet M and Devin A: The
Warburg and Crabtree effects: On the origin of cancer cell energy
metabolism and of yeast glucose repression. Biochim Biophys Acta.
1807:568–576. 2011. View Article : Google Scholar : PubMed/NCBI
|
|
86
|
Balsa E, Marco R, Perales-Clemente E,
Szklarczyk R, Calvo E, Landazuri MO and Enríquez JA: NDUFA4 is a
subunit of complex IV of the mammalian electron transport chain.
Cell Metab. 16:378–386. 2012. View Article : Google Scholar : PubMed/NCBI
|
|
87
|
Guerrero-Castillo S, Baertling F,
Kownatzki D, Wessels HJ, Arnold S, Brandt U and Nijtmans L: The
assembly pathway of mitochondrial respiratory chain complex i. Cell
Metab. 25:128–139. 2017. View Article : Google Scholar : PubMed/NCBI
|
|
88
|
Tang JX, Thompson K, Taylor RW and Olahova
M: Mitochondrial OXPHOS Biogenesis: Co-regulation of protein
synthesis, import, and assembly pathways. Int J Mol Sci.
21:38202020. View Article : Google Scholar : PubMed/NCBI
|
|
89
|
Deng M, Blondeau JJ, Schmidt D, Perner S,
Muller SC and Ellinger J: Identification of novel differentially
expressed lncRNA and mRNA transcripts in clear cell renal cell
carcinoma by expression profiling. Genom Data. 5:173–175. 2015.
View Article : Google Scholar : PubMed/NCBI
|
|
90
|
Muller FE, Braun M, Syring I, Klumper N,
Schmidt D, Perner S, Hauser S, Müller SC and Ellinger J: NDUFA4
expression in clear cell renal cell carcinoma is predictive for
cancer-specific survival. Am J Cancer Res. 5:2816–2822.
2015.PubMed/NCBI
|
|
91
|
Lunetti P, Di Giacomo M, Vergara D, De
Domenico S, Maffia M, Zara V, Capobianco L and Ferramosca A:
Metabolic reprogramming in breast cancer results in distinct
mitochondrial bioenergetics between luminal and basal subtypes.
FEBS J. 286:688–709. 2019. View Article : Google Scholar : PubMed/NCBI
|