Introduction
Liver cancer ranks sixth among the most frequently
diagnosed types of cancer and fourth among the leading causes of
cancer-associated deaths globally, with ~841,000 newly diagnosed
cases and 782,000 deaths reported annually (1). Hepatocellular carcinoma (HCC) is the
most prevalent primary liver cancer, accounting for 85–90% of all
liver cancer cases (2). HCC has a
poor prognosis, with an average 5-year survival rate of 19.6%, that
can be as low as 2.5% in patients with advanced stages in the
United States (3). These low
survival rates are attributed to the late diagnosis and limited
effectiveness of the current treatment options. Screening of
high-risk patients involves the use of non-specific and
less-sensitive tools, such as determination of a-fetoprotein serum
levels, ultrasound (4,5), expensive imaging techniques, such as
computed tomography and magnetic resonance imaging (6,7), and
invasive techniques including guided biopsies (8).
Risk factors predisposing individuals to HCC include
hepatitis B virus (HBV) infection, hepatitis C virus infection,
aflatoxin and alcohol consumption, which mediate the pathogenesis
of HCC through different mechanisms (9). Several molecular alterations have been
identified in HCC; these include genetic and epigenetic
alterations, which make it a complex and heterogeneous disease
(10). The current knowledge of
molecular biomarkers that would aid the diagnosis, prognosis and
therapy monitoring is insufficient. Therefore, investigations on
the mechanisms underlying the development of HCC should provide
improved diagnostic and prognostic markers, and should promote the
development of targeted therapy.
Cofactor of BRCA1 (COBRA1) was first identified
through yeast two-hybrid screening as a novel BRCA1-interacting
protein (11). It was later found to
be the same protein identified as negative elongation factor-B
(NELF-B), which is one of the four subunits of the NELF complex
(12). The NELF complex interacts
with other factors to negatively regulate the elongation step in
transcription by pausing RNA polymerase II (RNAPII) (13,14). The
NELF complex consists of four subunits, namely NELF-A, NELF-B,
NELF-C/D and NELF-E (15). NELF-C is
similar to NELF-D in structure; both are believed to be
translational variants of the same mRNA transcript, and either of
them can be involved in the formation of the complex at a given
point (12). The complex core is
composed of NELF-B and NELF-C/D, which brings the other two
subunits together (12). NELF-A
includes an RNAPII-binding domain, and NELF-E has an RNA-binding
domain (15,16). Along with the NELF-B subunit, all the
subunits are required for the assembly of a functional NELF complex
(12). In fact, the interdependent
manner in which the NELF subunits are regulated has been identified
in several studies, revealing that depletion of one of these
subunits results in dampening of the protein levels of the
remaining subunits (17).
Lacking a DNA-binding domain, NELF-B interacts with
other transcription complexes, such as steroid hormone receptors
and activator protein-1, to mediate their regulatory functions on
gene expression (18,19). Some of these interactions occur
through the NELF complex, whereas the mechanisms of others remain
unclear.
The involvement of NELF-B in the essential
transcription regulation machinery governing several cellular
processes suggests its potential role in a disease like cancer.
Nonetheless, the role of NELF-B in cancer has been studied only in
a few types of cancer. NELF-B was first studied in breast cancer;
its tumor suppressor role was demonstrated through in vitro
experiments (20–22) and was further confirmed by the low
levels observed in breast carcinoma tissues (17). Conversely, NELF-B was found to act as
an oncogene in upper gastrointestinal adenocarcinoma, as well as
prostate and liver cancer (23–25). The
diverse effects of NELF-B among different types of cancer are
suggestive of the tissue/context-dependent roles of NELF-B. We have
previously demonstrated the upregulation of NELF-B in HCC tissue
samples compared with its expression in adjacent non-cancerous
liver tissues, which is consistent with the in silico
analysis of the Oncomine HCC microarray database (25). Subsequent experiments have
demonstrated the role of NELF-B in cell proliferation and migration
through loss-of-function analyses in HepG2 cells (25), which represents an early stage of
liver cancer.
In continuation of our previous work, and to gain
further insights into the mechanism underlying the role of NELF-B,
the present study involved a gain-of-function analysis in HepG2
cells. To further elucidate the involvement of NELF-B in HCC
progression, a loss-of-function analysis was also performed in an
intermediate-stage HCC cell line (SNU449) to elucidate the
involvement of NELF-B in the progression of HCC.
Materials and methods
Cell culture
HepG2 and SNU449 cells were generously provided by
Dr Mehmet Ozturk, Department of Molecular Biology and Genetics,
Bilkent University, Ankara, Turkey. HepG2 cells represent an early
stage of liver cancer and are derived from a well-differentiated
tumor from a 15-year-old Caucasian male. HepG2 is classically
described as an HCC cell line, but has also been suggested to have
originated from hepatoblastoma (26). SNU449 represents an intermediate
stage of HCC and is derived from a grade II–III/IV HCC from a
52-year-old Asian male, positive for HBV DNA. The cells were
cultured in RPMI-1640 basal medium (Lonza Group, Ltd.) supplemented
with 10% FBS (Invitrogen; Thermo Fisher Scientific, Inc.), 100 U/ml
penicillin and 100 mg/ml streptomycin (Invitrogen; Thermo Fisher
Scientific, Inc.). The cells were incubated in a humidified
incubator at 37°C with 5% CO2. Images were captured
using an inverted fluorescence phase contrast microscope at ×100,
×200 or ×400 magnifications (Olympus IX70; Olympus Corporation);
some images were converted to grey-scale and were adjusted for
brightness.
Plasmid constructs
The NELF-B overexpression plasmid, pCMV5-HCOBRA1,
was a generous gift from Dr Rong Li, University of Texas Health
Science Center, San Antonio TX, USA. An empty pCMV5 plasmid was
used as a negative control. Briefly, pCMV5-HCOBRA1 was digested
with EcoRI and SalI (New England Biolabs, Inc.). The
empty vector (4.7 Kb) was purified using the QIAquick Gel
Extraction kit (Qiagen Sciences, Inc.), following the
manufacturer's protocol. The blunting of the 5-overhangs resulting
from the digestion was performed by filling the ends with the
Klenow fragment of DNA polymerase I (New England BioLabs, Inc.).
For each µg of DNA, 1 unit of Klenow was added, followed by
incubation at 25°C for 15 min and heating at 67°C for 20 min. T4
DNA ligase (Promega Corporation) was used to re-ligate the blunted
vector. The pEGFP-N1 expression plasmid was used to assess the
transfection efficiency. The plasmid was provided by Dr Ahmed
Osman, Ain Shams University, Cairo, Egypt, and was initially
purchased from Clontech Laboratories, Inc.
NELF-B overexpression
HepG2 cells were transfected using
Lipofectamine® 3000 (Thermo Fisher Scientific, Inc.)
according to the manufacturer's protocol. Briefly, HepG2 cells were
cultured in 6-well plates and incubated for 24 h until they were
70–90% confluent. Before transfection, 3.75 µl Lipofectamine 3000
was added to 125 µl Opti-MEM reduced serum medium (Gibco; Thermo
Fisher Scientific, Inc.) and the mixture was incubated for 5 min at
room temperature. Meanwhile, 2.5 µg of either the NELF-B
overexpression plasmid pCMV5-HCOBRA1 or pCMV5 empty plasmid was
diluted in a mixture of 125 µl Opti-MEM and 5 µl Lipofectamine
3000. The two dilutions were mixed and incubated for 20 min to
allow for complex formation. The DNA-Lipofectamine complex (250 µl)
was then added dropwise to each well containing cells in 2 ml of
antibiotic-free medium (RPMI + 10% FBS). Overexpression efficiency
was assessed based on the percentage of green fluorescent cells, as
well as the protein and mRNA expression levels of NELF-B following
transfection. Transfection efficiency was measured 24 and 48 h
post-transfection, and was found to be 45 and 60%, respectively
using an inverted fluorescence phase contrast microscope at ×100
magnification (Fig. S1). At 48 h,
NELF-B expression in HepG2 cells transfected with the NELF-B
overexpression plasmid (pCMV5-HCOBRA1) was increased 4-fold
compared with that in cells transfected with pCMV5 empty plasmid
(P≤0.0001; Fig. 1A). The cells were
collected 48 h post-transfection for downstream analysis.
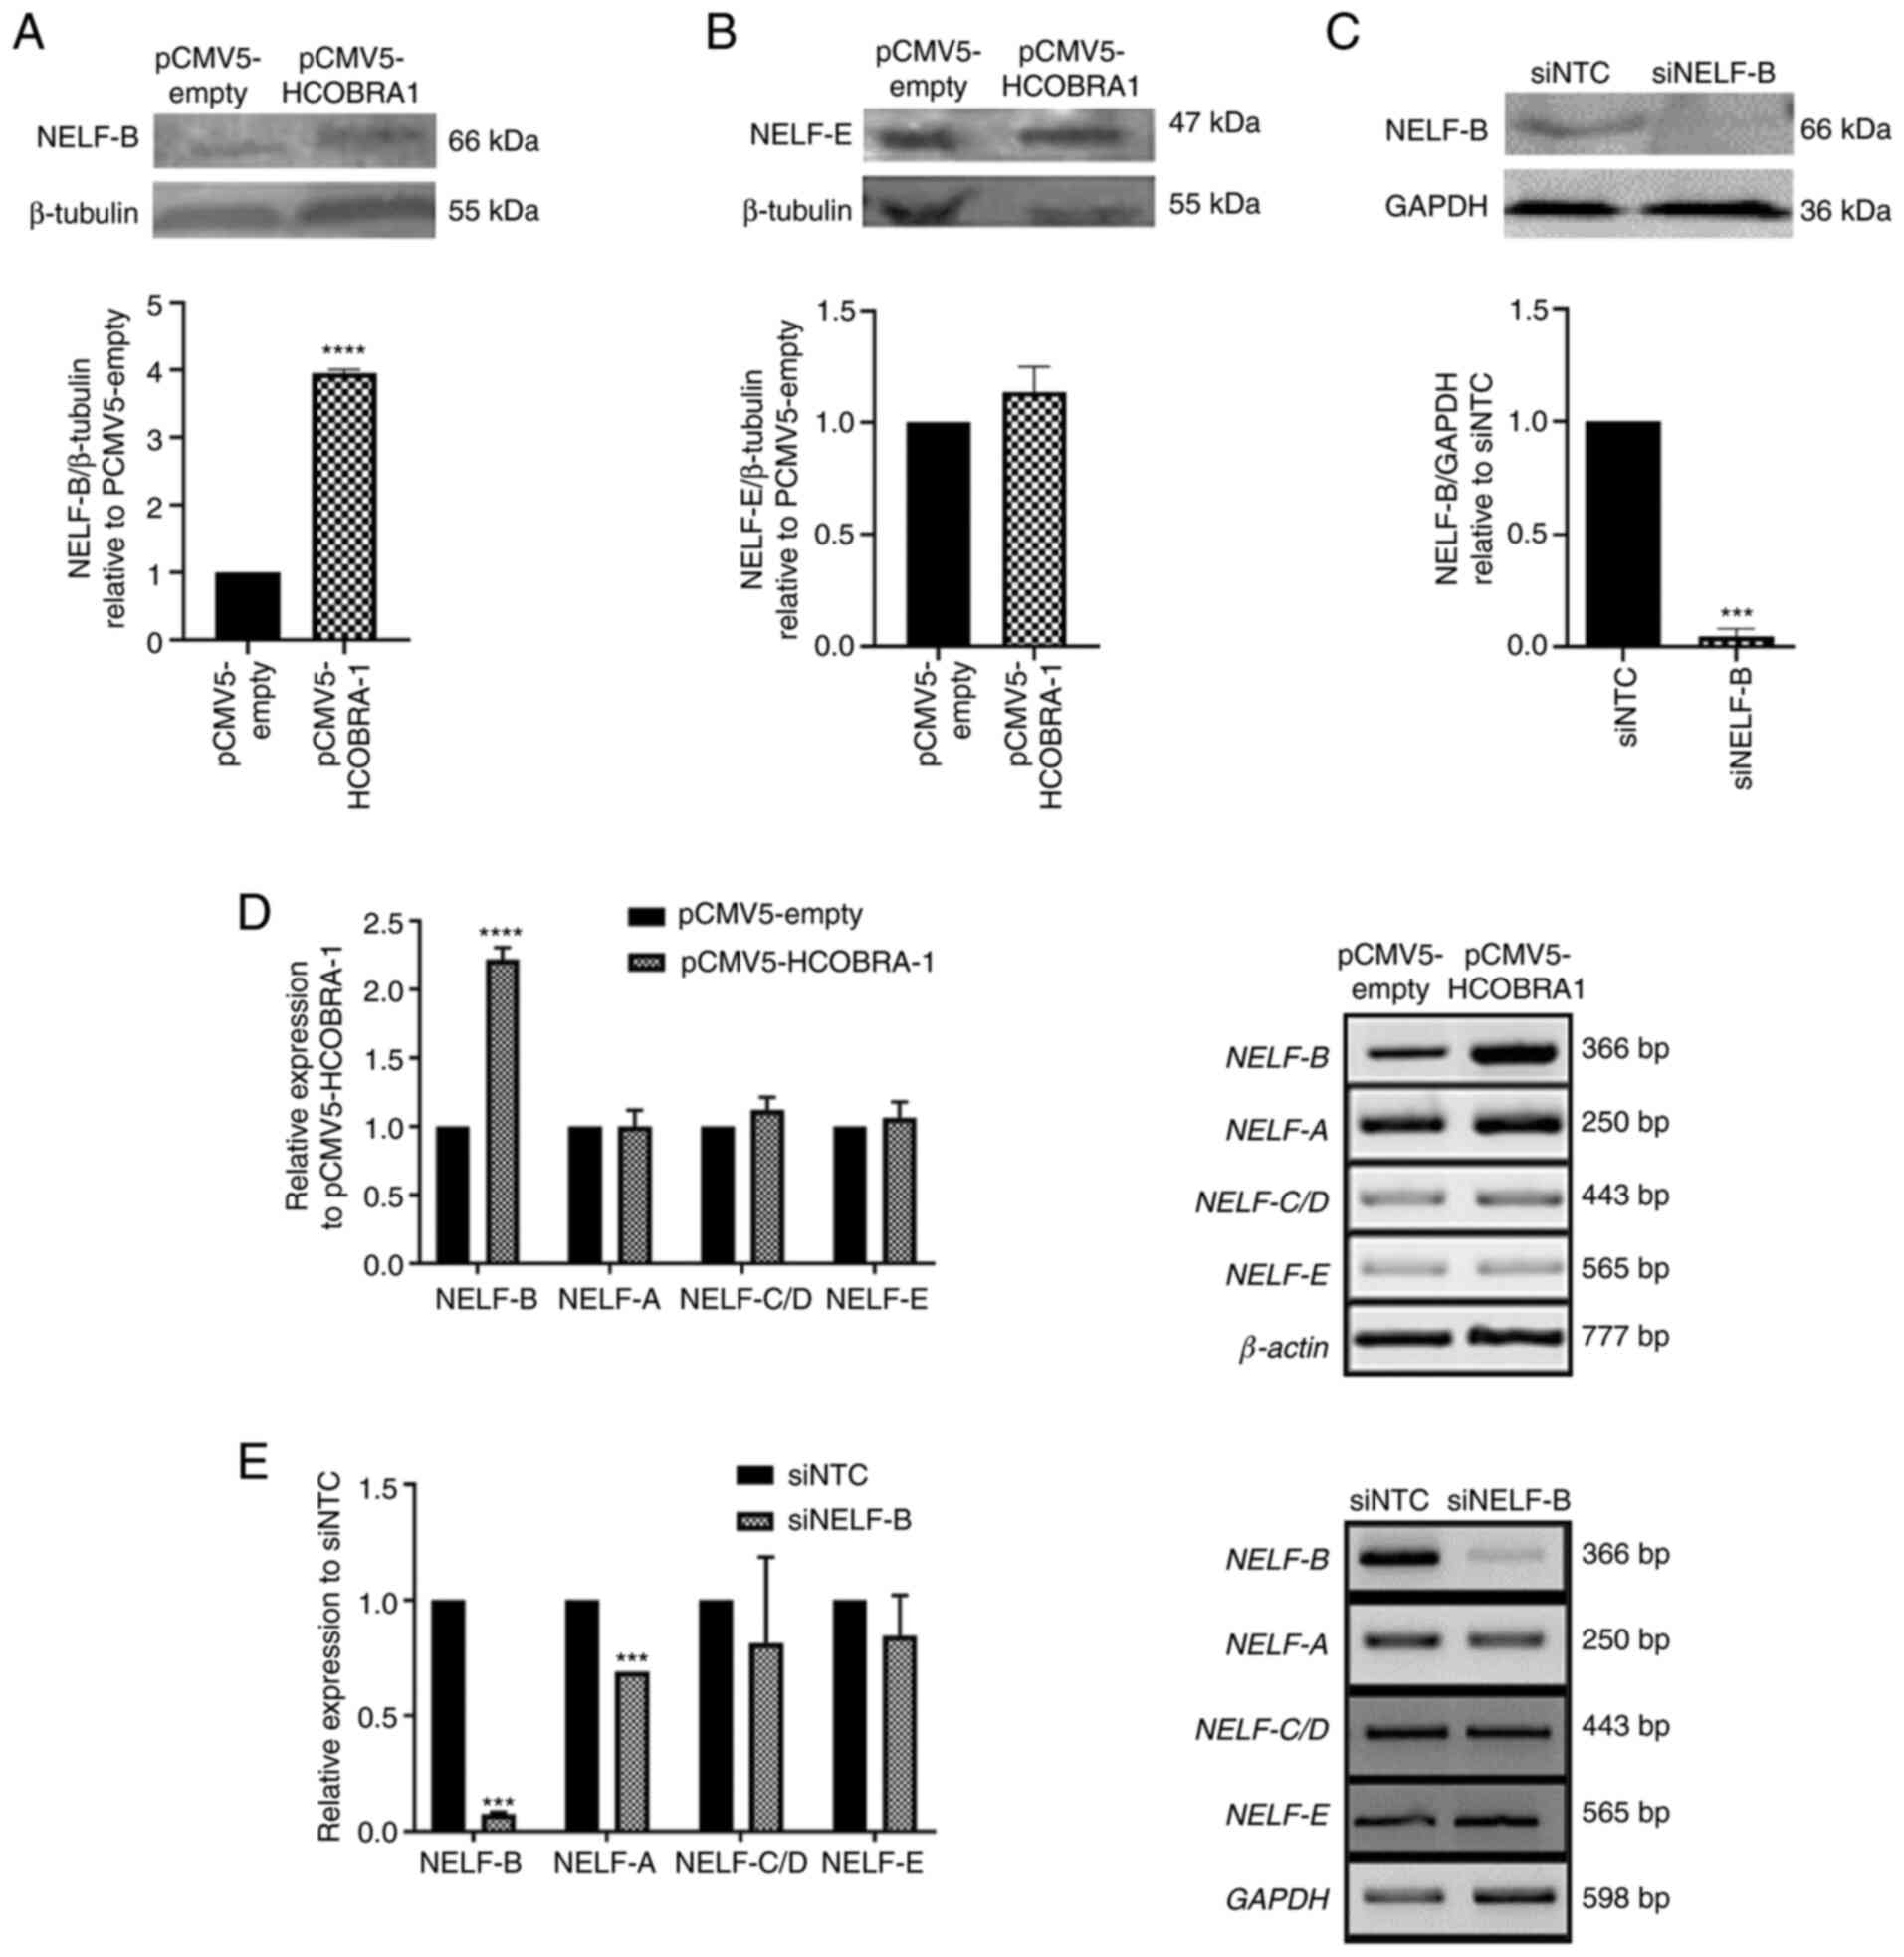 | Figure 1.Effects of overexpression and
knockdown of NELF-B on the expression levels of NELF subunits.
Representative western blots showing the relative expression levels
of (A) NELF-B and (B) NELF-E in HepG2 cells following NELF-B
overexpression (n=3), and of (C) NELF-B in SNU449 cells following
NELF-B-knockdown (n=2). Relative mRNA expression levels of NELF-A,
NELF-C/D and NELF-E (n=3) as assessed by reverse
transcription-semi-quantitative PCR showing (D) no significant
change following the overexpression of NELF-B in HepG2 cells,
whereas (E) NELF-A exhibited decreased expression
post-NELF-B-knockdown in SNU449 cells (n=2). ***P≤0.001 and
****P≤0.0001 vs. pCMV5-empty or siNTC. NELF, negative elongation
factor; COBRA1, cofactor of BRCA1; pCMV5-empty, empty pCMV5 vector;
pCMV5-HCOBRA1, NELF-B overexpression vector; siRNA, small
interfering RNA; siNTC, negative control siRNA; siNELF-B, NELF-B
siRNA. |
Gene silencing
siGENOME SMARTPool siRNA (cat. no. M-015839-02; GE
Healthcare Dharmacon, Inc.), a pool of four siRNAs targeting
different exons of the NELF-B mRNA, was used for the knockdown of
NELF-B. Allstars' negative control siRNA (cat. no. SI03650318;
Qiagen, Inc.) was used as a control. Approximately
1.5×10⁵ cells suspended in antibiotic-free medium (RPMI
+ 10% FBS) were mixed with the transfection complex prior to
seeding (reverse transfection). The complex was prepared by adding
40 nM siRNA and 3.75 µl Lipofectamine 3000 to 500 µl Opti-MEM
medium, followed by incubation for 15–20 min at room temperature.
The medium was changed 24 h after transfection, and fresh
antibiotic-free medium (RPMI + 10% FBS) was added. The optimum
knockdown conditions were determined by performing the transfection
using different siRNA concentrations (25 and 40 nM) and
post-transfection incubation time points (48, 72 and 96 h) (data
not shown). The use of 40 nM siRNA, and an incubation of 96 h after
transfection, resulted in a decrease in the protein levels of
NELF-B by an average of 96% (P≤0.001; Fig. 1C), which was considered to be the
optimal knockdown. The cells were collected 96 h following
transfection for downstream analysis.
Trypan blue exclusion test
Cell viability was determined using the trypan blue
exclusion assay (27). HepG2 cells
were harvested and counted 48 h post-transfection to monitor the
effect of NELF-B overexpression on cell proliferation. For
monitoring the effect of NELF-B silencing on cell proliferation,
the number of SNU449 cells was counted 96 h post-transfection.
Cells were mixed with 0.4% trypan blue in PBS at a ratio of 1:1,
and viable cells were counted using a hemocytometer (Hausser
Scientific) and an inverted fluorescence phase contrast microscope
at ×200 magnification.
Reverse transcription-PCR
(RT-PCR)
TRIzol® reagent (Invitrogen; Thermo
Fisher Scientific, Inc.) was used for extraction of total RNA,
according to the manufacturer's recommendations. RevertAid First
Strand cDNA synthesis kit (Thermo Fisher Scientific, Inc.) was used
for cDNA synthesis, following the manufacturer's protocol. Random
primers were used for reverse transcription of 0.5 µg of the total
RNA in a final volume of 20 µl. MyTaq DNA Polymerase kit (Bioline;
Meridian Bioscience) was used for semi-quantitative RT-PCR using 1
µl cDNA, according to the manufacturer's recommendations. All the
genes were analyzed under similar PCR conditions, except for the
cycle number and annealing temperature (Table I). Initial denaturation was performed
at 94°C for 3 min, followed by cycles of 94°C for 30 sec, annealing
temperature for 30 sec and 72°C for 45 sec, and a final extension
at 72°C for 7 min. Amplicons were electrophoresed on a 2–2.5%
agarose gel and visualized using the Gel Doc EZ System (Bio-Rad
Laboratories, Inc.). Intensities of bands generated in RT-PCR were
quantified using ImageJ software version 1.51j8 (National
Institutes of Health) (28). The
band intensities were normalized to those of respective loading
controls (GAPDH or β-tubulin). Images were converted to grey
scale.
 | Table I.Reverse
transcription-semi-quantitative PCR primer sequences, PCR
conditions and amplicon sizes. |
Table I.
Reverse
transcription-semi-quantitative PCR primer sequences, PCR
conditions and amplicon sizes.
| Gene | Primer sequence
(5′-3′) | PCR conditions
(annealing temperature, number of cycles) | Amplicon size,
bp |
|---|
| GAPDH | F:
CCACCCATGGCAAATTCCATGGCT | 60.5°C, 26
cycles | 598 |
|
| R:
TCTAGACGGCAGGTCAGGTCCACC |
|
|
| β-actin | F:
GCAAAGACCTGTACGCCAAC | 58°C, 27
cycles | 777 |
|
| R:
GAGACCAAAAGCCTTCATACATCTC |
|
|
| NELF-B | F:
ACATCACCAAGCAGAGGAA | 59.5°C, 32
cycles | 366 |
|
| R:
GATCCAGCTGTTCCAGCTTC |
|
|
| NELF-A | F:
GTCGGCAGTGAAGCTCAAGT | 60°C, 32
cycles | 250 |
|
| R:
TTCACACTCACCCACCTTTTCT |
|
|
| NELF-C/D | F:
GAAGAAGGAGAGACCCCAGC | 56°C, 28
cycles | 443 |
|
| R:
GTGCCCAAGGCTAGTGTGAT |
|
|
| NELF-E | F:
TGGTGAAGTCAGGAGCCATCAG | 63°C, 28
cycles | 565 |
|
| R:
CGCCGTTCAGGGAATGAATC |
|
|
| Ki67 | F:
CTTTGGGTGCGACTTGACG | 60°C, 27
cycles | 199 |
|
| R:
GTCGACCCCGCTCCTTTT |
|
|
| Survivin | F:
TTGAATCGCGGGACCCGTTGG | 61°C, 28
cycles | 477 |
| (BIRC5) | R:
CAGAGGCCTCAATCCATGGCA |
|
|
| TFF1 | F:
TTTGGAGCAGAGAGGAGGCAATGG | 50°C, 32
cycles | 240 |
|
| R:
TGGTATTAGGATAGAAGCACCAGGG |
|
|
| TFF3 | F:
GTGCCAGCCAAGGACAG | 58°C, 35
cycles | 302 |
|
| R:
CGTTAAGACATCAGGCTCCAG |
|
|
Quantitative PCR (qPCR)
qPCR amplification was performed using SYBR-Green as
a DNA-specific binding dye, and continuous monitoring of
fluorescence was done. Each PCR reaction (10 µl) consisted of 2X
SYBR-Green I Master Mix (Applied Biosystems; Thermo Fisher
Scientific, Inc.), 1 µl cDNA and 0.5 µl each primer. All the
primers used for the selected genes are listed in Table II. The thermal cycler was set up for
40 cycles of the following amplification program: 50°C for 2 min,
95°C for 2 min, 95°C for 15 sec and 60°C for 1 min. The instrument
was set to perform the default dissociation step under the
following conditions: 95°C for 15 sec, 60°C for 1 min and 95°C for
15 sec. All experiments were performed three times using the 7500
Real-Time PCR System (Applied Biosystems; Thermo Fisher Scientific,
Inc.). Data analysis was performed using the 2−ΔΔCq
method (29) with GAPDH used as the
reference gene.
| Table II.Quantitative PCR primer sequences and
amplicon sizes. |
Table II.
Quantitative PCR primer sequences and
amplicon sizes.
| Gene | Primer sequence
(5′-3′) | Amplicon size,
bp |
|---|
| GAPDH | F:
AAGGTCATCCCTGAGCTGAAC | 142 |
|
| R:
ACGCCTGCTTCACCACCTTCT |
|
| Ki67 | F:
CTTTGGGTGCGACTTGACG | 199 |
|
| R:
GTCGACCCCGCTCCTTTT |
|
| N-cadherin | F:
GCGTCTGTAGAGGCTTCTGGT | 173 |
|
| R:
TCTGCAGGCTCACTGCTCTC |
|
| Vimentin | F:
CTCAATCGGCGGGACAGCAG | 193 |
|
| R:
GACACGGACCTGGTGGACAT |
|
| β-catenin | F:
GAGGAGCAGCTTCAGTCCCC | 139 |
|
| R:
GCCATTGTCCACGCTGGATT |
|
| FOXF2 | F:
AATGCCACTCGCCCTACAC | 199 |
|
| R:
GGCAGTCCCACTGAGAGGTC |
|
Western blot analysis
Cells were washed with ice-cold PBS before being
lysed in 1X ice-cold Laemmli Lysis Buffer (50 mM Tris pH 6.8, 2%
SDS and 10% glycerol) supplemented with 100X Halt Protease
Inhibitor Cocktail (Thermo Fisher Scientific, Inc.; 10 µl protease
inhibitor per ml of Laemmli Lysis buffer was used). Protein
concentrations were determined using the BCA Protein Assay kit
(Pierce; Thermo Fisher Scientific, Inc.), following the
manufacturer's protocol. Whole-cell lysates (20–30 µg/lane) were
separated via 10% SDS-PAGE and the proteins were blotted onto a
nitrocellulose membrane. The membranes were blocked in 5% non-fat
dry milk, and then incubated overnight with primary antibodies at
4°C. Subsequently, the membranes were incubated for 1 h with the
secondary antibody at room temperature. Colorimetric detection of
the tested proteins was performed using BCIP/NBT Phosphatase
colorimetric substrate (KPL). Primary antibodies used were as
follows: Mouse monoclonal anti-GAPDH (Abcam; cat. no. ab8245;
1:10,000 in 5% non-fat dry milk), mouse monoclonal anti-β-tubulin
(Sigma-Aldrich; Merck KGaA; cat. no. T7816; 1:20,000 in 5% non-fat
dry milk), rabbit monoclonal anti-NELF-B (anti-COBRA1; Abcam; cat.
no. ab167401; 1:1,000 in 3% non-fat dry milk) and rabbit monoclonal
anti-NELF-E (Abcam; cat. no. ab170104; 1:1,000 in 5% non-fat dry
milk). Secondary antibodies used were polyclonal goat anti-mouse
(KPL; cat. no. 4751-1806; 1:10,000 in 5% non-fat dry milk) and
polyclonal goat anti-rabbit (KPL; cat. no. 4751-1516; 1:10,000 in
5% non-fat dry milk), both have alkaline phosphatase conjugates.
For all purposes, non-fat dry milk used in western blot analysis
was dissolved in 1X TBS-0.1% Tween-20. Intensities of bands
generated were quantified using ImageJ software version 1.51j8
(National Institutes of Health) (28). The band intensities were normalized
to those of respective loading controls (GAPDH or β-tubulin).
Wound healing assay
Classic wound healing assay (30) was performed to assess the effect of
the overexpression/knockdown of NELF-B on the cell migration rate.
After 48 h from NELF-B overexpression, and 96 h post-NELF-B
silencing, the spent medium was discarded, a scratch was made in
the confluent (~90%) cell monolayer using a sterile 20 µl yellow
tip. The cells were gently washed twice with PBS and incubated for
24 h in fresh 10% FBS RPMI medium. The migration of cells was
monitored using an inverted fluorescence phase contrast microscope
at ×100 magnification (Olympus IX70; Olympus Corporation); images
were converted to greyscale. The wound area was measured using the
TScratch software version 1.0 (31),
and the percentage of wound closure was calculated using the
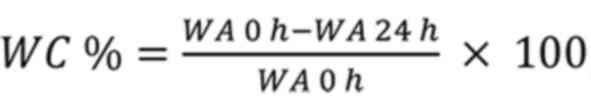
following equation (32):
where WC % is the percentage of wound
closure, WA 0 h is the wound area at 0 h, and WA 24 h
is the wound area at 24 h.
Transwell invasion assay
Transwell Boyden 24-well chambers (ThinCert™;
Greiner Bio-One) were used to determine the effect on the invasive
capacity of cells. Cells were harvested 96 h post-transfection, and
2×10⁵ cells were suspended in 100 µl RPMI-1640 medium
(supplemented with 1% FBS) and seeded in the upper chamber of the
Transwell cell culture insert (8-µm pore size). The cell culture
insert was coated with 40 µg collagen I (SERVA Electrophoresis
GmbH; cat. no. 47254), allowed to dry overnight in an incubator at
37°C, and rehydrated with 1% FBS-containing medium, 30 min before
the seeding of cells. The lower chamber was filled with 600 µl
RPMI-1640 medium supplemented with 10% FBS. Cells were placed
inside the upper chamber and incubated for 22 h at 37°C.
Subsequently, cotton swabs were used to remove cells on the upper
side of the membrane, and the cells that invaded to the lower side
of the membrane were fixed using 4% formaldehyde for 10 min at room
temperature, and subsequently stained with DAPI for 10 min at room
temperature in the dark (KPL, Inc.; cat. no. 71-03-01; 1:1,000 in
PBS). The images were captured with a fluorescence microscope at
×200 magnification in five random fields for each condition, and
the average of cell counts was compared.
Statistical analysis
Relative gene expression was calculated in reference
to the negative control siRNA or pCMV5-empty and represented as
fold-change. Data are presented as the mean ± SD of two to four
independent experiments. Statistical significance for comparison
between two groups was performed using unpaired Student's t-test
(two-tailed). GraphPad Prism 8.0 (GraphPad Software, Inc., La Jolla
California USA) was used to generate graphs. P<0.05 was
considered to indicate a statistically significant difference.
Results
NELF-B-knockdown significantly
decreases NELF-A expression in SNU449 cells
Downregulation of NELF-B in the early-stage liver
cancer HepG2 cell line has been previously shown to inhibit the
migration and proliferation of the cells (25). To investigate whether ectopic
expression of NELF-B in the same cell line would lead to an
opposite effect to that induced by its downregulation, NELF-B was
overexpressed in HepG2 cells. To further investigate the role of
NELF-B in the progression of liver cancer, loss of function
analysis was performed on the intermediate-stage HCC cell line,
SNU449. The efficiency of overexpression and knockdown was assessed
by measuring the protein expression levels by western blot
analysis. HepG2 cells transfected with the NELF-B overexpression
plasmid (pCMV5-HCOBRA1) exhibited a 4-fold increase in NELF-B
expression compared with the pCMV5-empty-transfected control cells
(P≤0.0001; Fig. 1A); however, NELF-E
expression was not significantly altered upon overexpression of
NELF-B in HepG2 cells (P>0.05; Fig.
1B). SNU449 cells transfected with NELF-B siRNA showed a
significant decrease in protein expression by an average of 96%
compared with that in the negative siRNA-transfected control cells
(P≤0.001; Fig. 1C). Consistent with
the protein expression levels, the mRNA expression levels of NELF-B
assessed by RT-PCR exhibited a 2.2-fold increase in HepG2 cells
following NELF-B overexpression and an average of 93.5% decrease in
SNU449 cells following NELF-B-knockdown compared with their
respective controls (P≤0.0001 and P≤0.001; Fig. 1D and E).
The effect of overexpression and knockdown of NELF-B
on the expression levels of other NELF subunits was assessed using
RT-PCR. The expression levels of NELF-A, NELF-C/D and NELF-E were
not significantly affected following the overexpression of NELF-B
(P>0.05, Fig. 1D). In SNU449
cells, the expression levels of NELF-C/D and NELF-E were not
significantly altered, while NELF-A expression was significantly
decreased by an average of 30% upon knockdown of NELF-B (P≤0.001;
Fig. 1E).
NELF-B-knockdown suppresses cell
proliferation and expression of the proliferation marker, Ki67, in
SNU449 cells
No morphological changes were observed after the
overexpression or knockdown of NELF-B compared with the control
cells (Fig. 2A and B). However,
cells in which NELF-B was knocked down appeared less dense than
their negative controls, suggesting a decrease in the proliferation
rate and/or survival of cells (Fig.
2B). To further examine the effect of deregulation of NELF-B on
cell proliferation, cells were counted at time points when optimum
overexpression/knockdown was observed post-transfection (48 and 96
h for HepG2 and SNU449 cells, respectively). The count of
NELF-B-overexpressing HepG2 cells was similar to that of cells
transfected with the empty vector, and no significant difference in
Ki-67 mRNA expression was observed (P>0.05; Fig. 2C). By contrast, the cell count was
significantly decreased upon silencing of NELF-B in SNU449 by an
average of 58% compared with the negative control (P≤0.001;
Fig. 2D). Consistent with these
results, a significant decrease in the expression levels of the
proliferation marker, Ki67 (by an average of 51%), compared with
the negative control was also observed (P≤0.05; Fig. 2D).
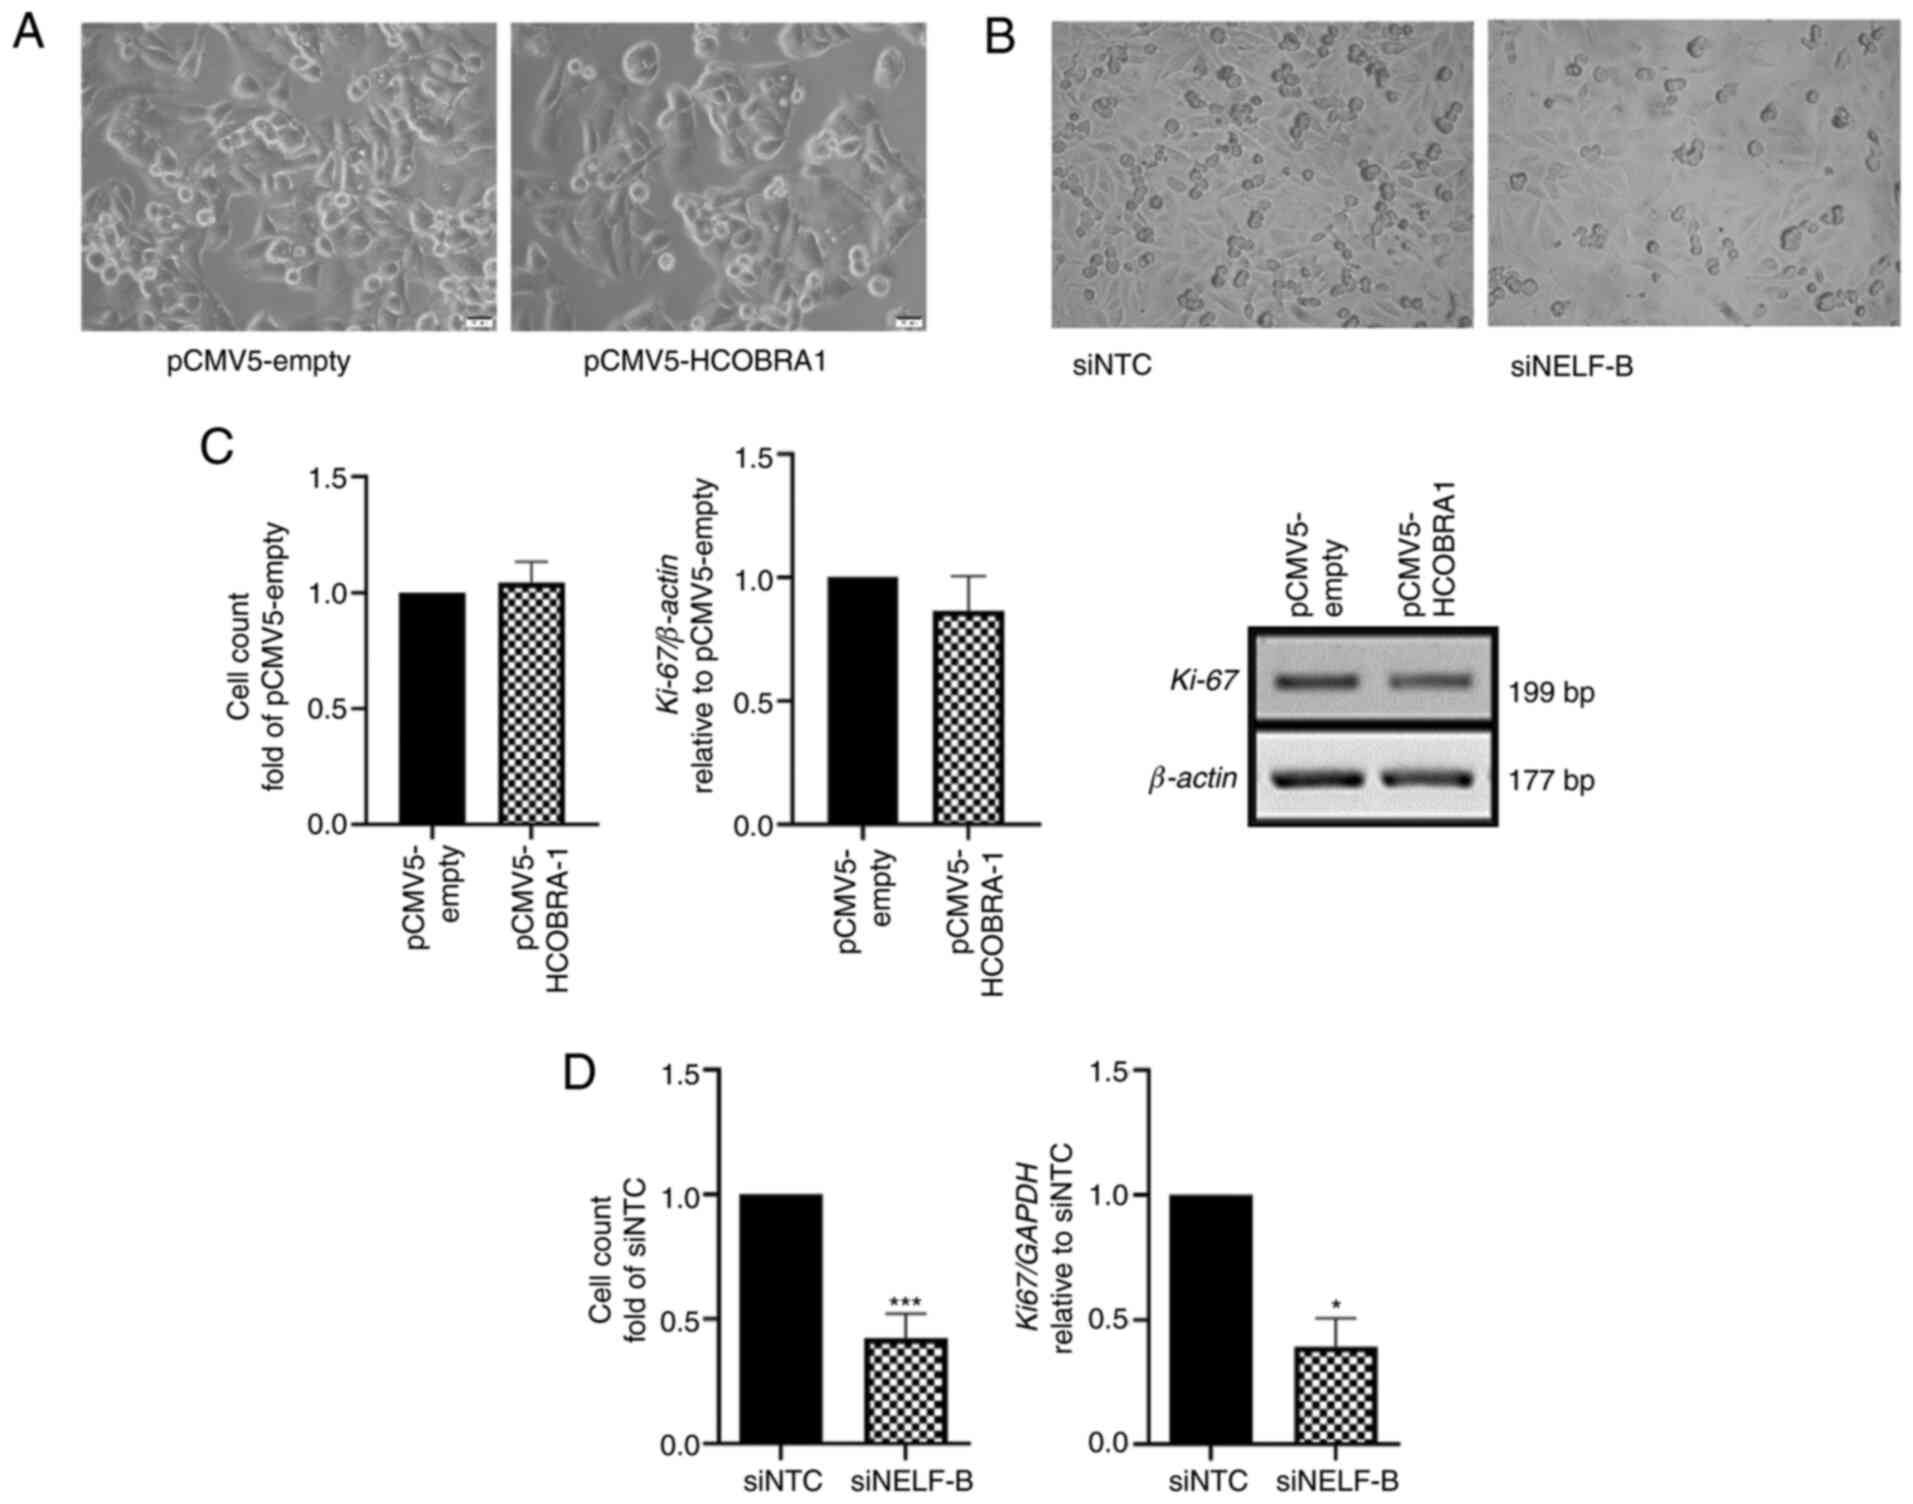 | Figure 2.Changes in the proliferation and
morphology of cells. (A) No change was observed in the morphology
of cells following overexpression of NELF-B in HepG2 cells. Images
were obtained using a fluorescence microscope at ×400
magnification. (B) In SNU449 cells, no change in morphology was
observed in NELF-B-knockdown cells, but the cells were less dense,
suggesting a decrease in cell number. Images were obtained using a
fluorescence microscope at ×200 magnification. (C) Cell counts of
HepG2 cells did not change after the overexpression of NELF-B and
the relative mRNA expression levels of Ki67 assessed by reverse
transcription-semi-quantitative PCR exhibited no significant change
(n=3). (D) A significant decrease in cell counts was observed after
the knockdown of NELF-B. Data presented as fold-change with respect
to the siNTC (n=4). Relative Ki67 mRNA expression as assessed by
reverse transcription-quantitative PCR exhibited decreased
expression after the knockdown of NELF-B (n=3). *P≤0.05 and
***P≤0.001 vs. siNTC. NELF, negative elongation factor; COBRA1,
cofactor of BRCA1; siRNA, small interfering RNA; pCMV5-empty, empty
pCMV5 vector; pCMV5-HCOBRA1, NELF-B overexpression vector; siNTC,
negative control siRNA; siNELF-B, NELF-B siRNA. |
NELF-B-knockdown significantly
inhibits the migration and invasion of SNU449 cells
Cancer progression involves epithelial-mesenchymal
transition (EMT), a process during which the migratory and invasive
abilities of cells increase (33).
The present study investigated the association between NELF-B and
EMT in liver cancer. Wound healing assay was used to examine the
effect of overexpression and knockdown of NELF-B on cell migration.
Scratches were made in cell monolayers, 48 and 96 h
post-transfection in HepG2 and SNU449 cells, respectively, and
wound closure was monitored 24 h later. The overexpression of
NELF-B in HepG2 cells resulted in a 1.4-fold higher migration rate
compared with that in the negative control group; however, the
difference was not statistically significant (P>0.05; Fig. 3A). In SNU449 cells, knockdown of
NELF-B significantly decreased the cell migration rate by an
average of 49% compared with that in the negative control group
(P≤0.001; Fig. 3B).
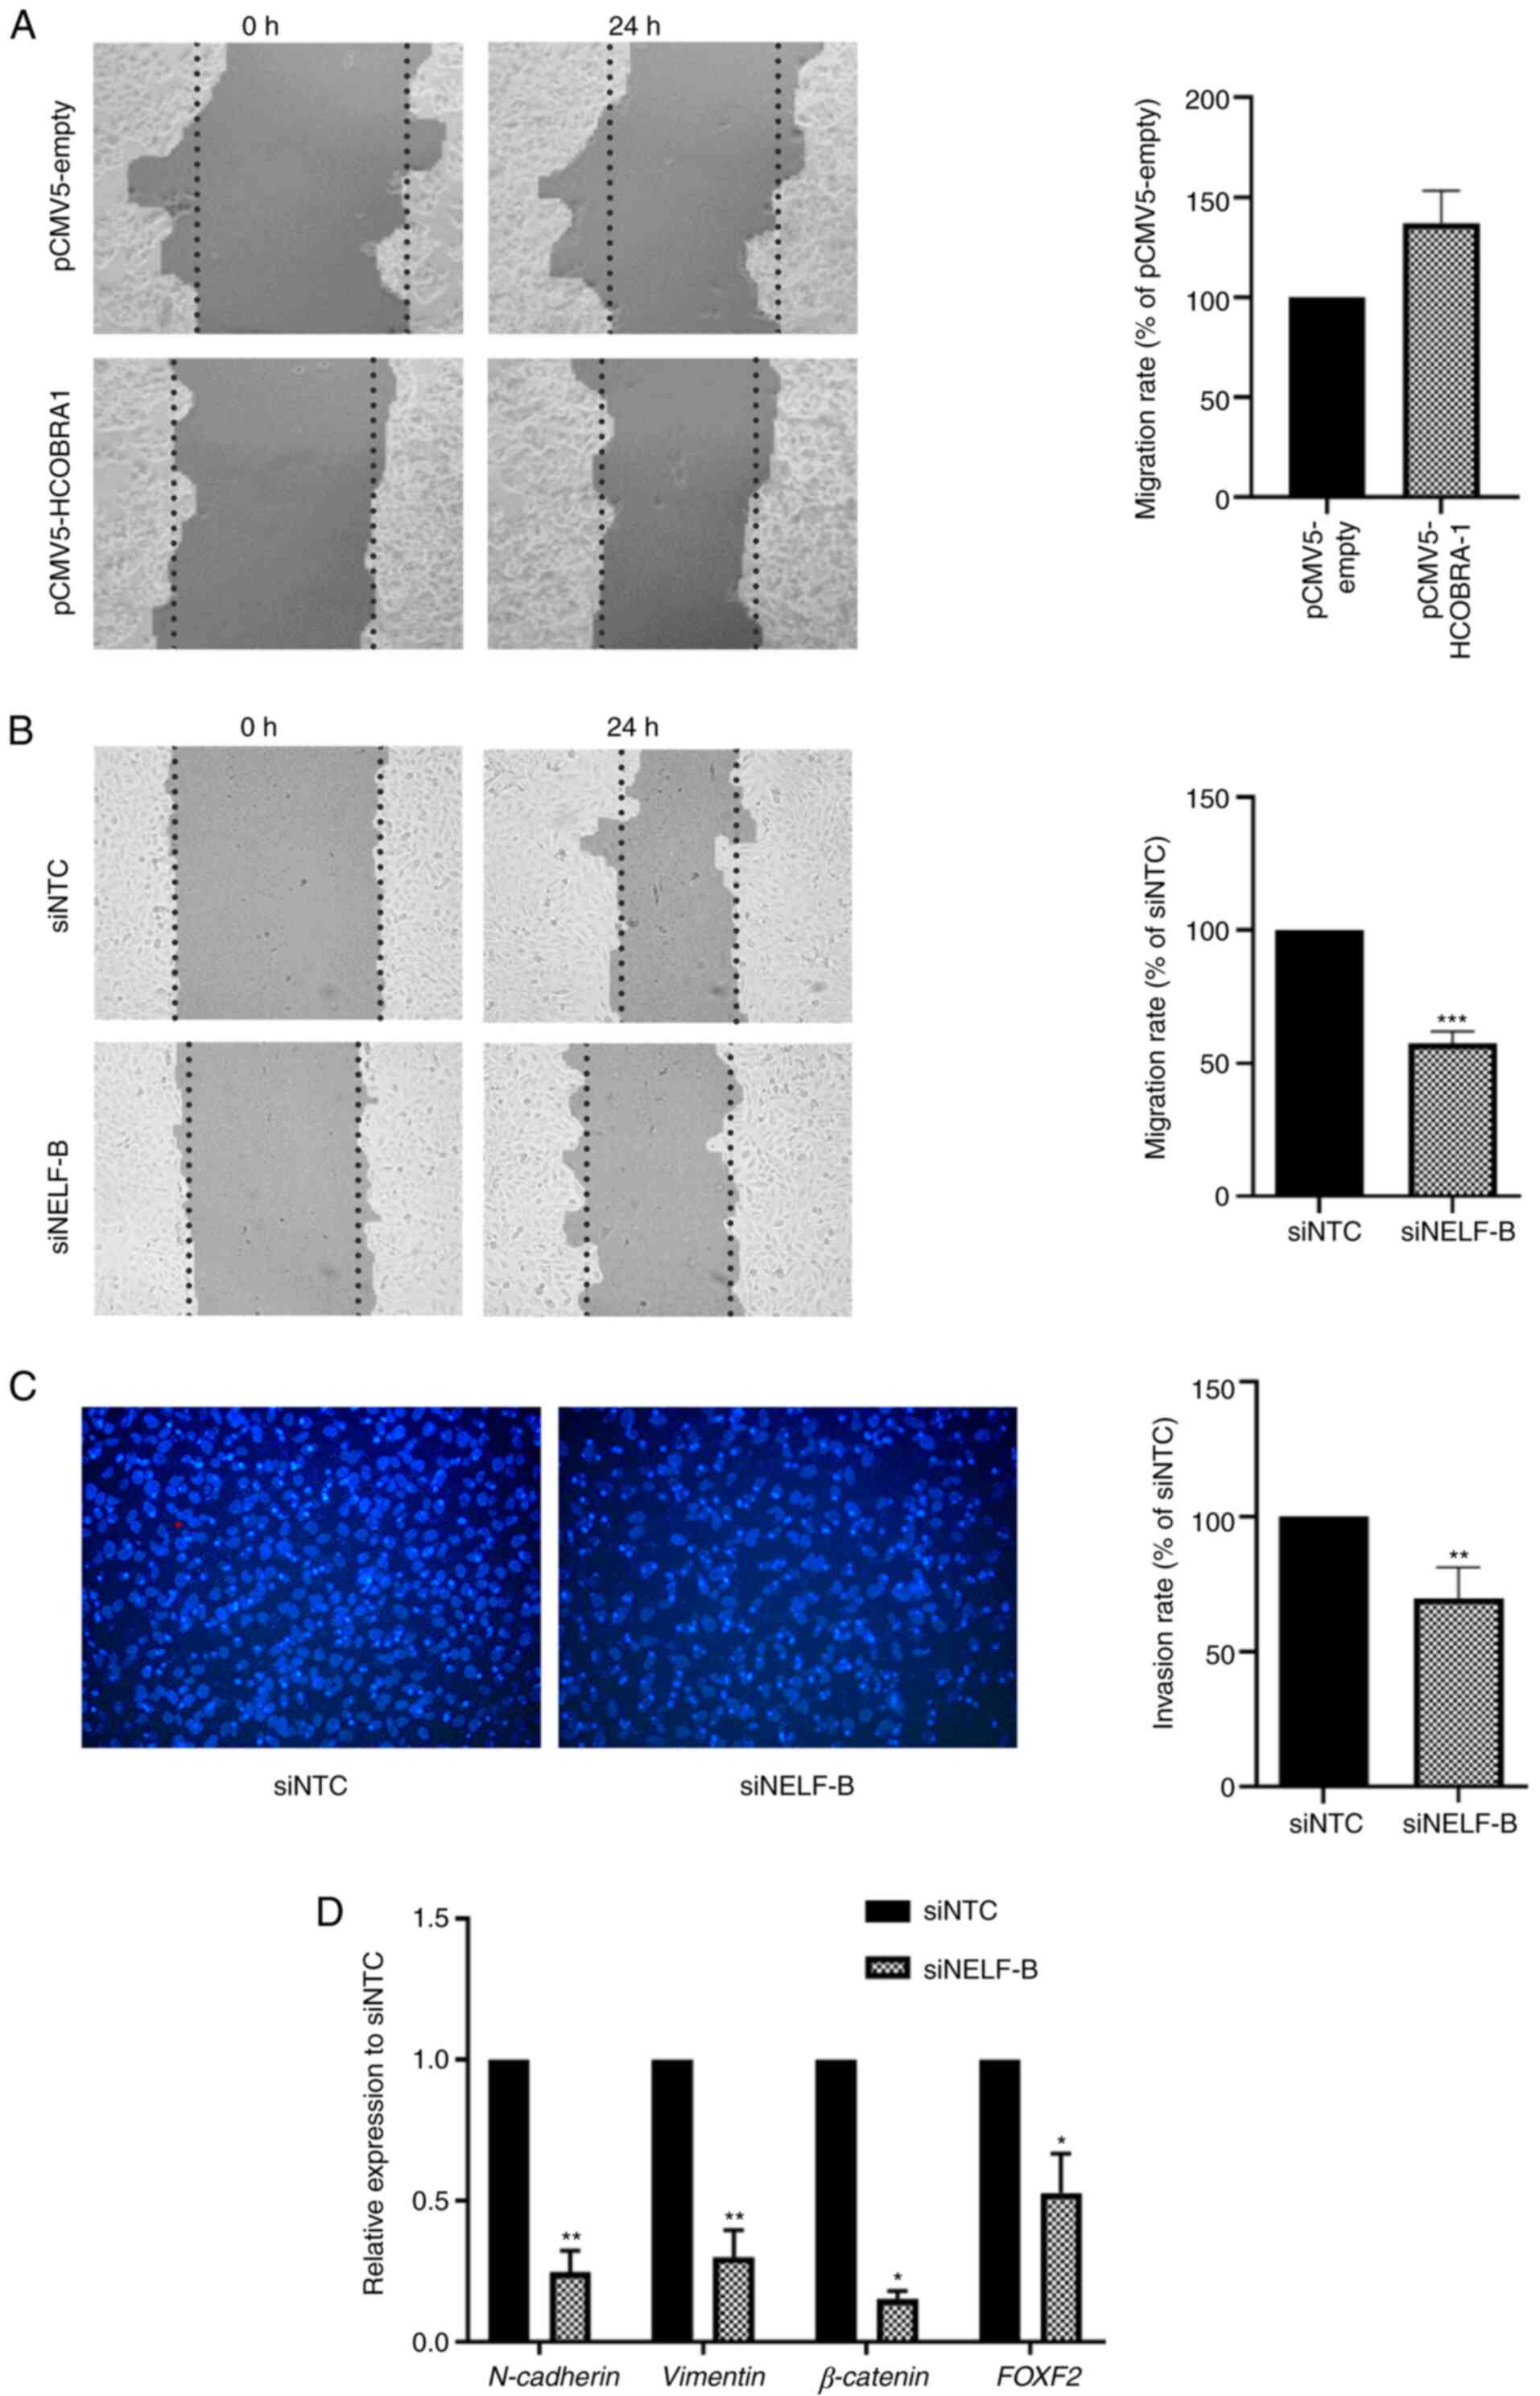 | Figure 3.NELF-B-knockdown inhibits the
migration and invasion of SNU449 cells. Wound healing assay was
performed to evaluate the effect of the overexpression and
knockdown of NELF-B on cell migration. (A) No significant changes
in the wound healing rate were measured for HepG2 cells following
overexpression of NELF-B (n=3). (B) Wound healing rate decreased
significantly after the knockdown of NELF-B in SNU449 cells (n=3).
Images were captured using a phase contrast microscope at ×100
magnification at 0 and 24 h following the scratching. Data are
presented as percentages of the migration rate in the negative
control. Contrast in the images was automatically generated by
TScratch software. (C) Transwell assay to evaluate cell invasion
after the knockdown of NELF-B in SNU449 cells revealed a
significant decrease in the number of invading cells (n=3). Images
were taken using a fluorescence microscope at ×200 magnification.
Data are presented as percentages of the invasion rate in the
negative control. (D) Effect of knockdown of NELF-B on the relative
mRNA expression levels of N-cadherin, β-catenin, vimentin and FOXF2
as assessed by reverse transcription-quantitative PCR (n=3 for all
genes, but n=2 for β-catenin). *P≤0.05, **P≤0.01 and ***P≤0.001 vs.
siNTC. NELF, negative elongation factor; COBRA1, cofactor of BRCA1;
siRNA, small interfering RNA; pCMV5-empty, empty pCMV5 vector;
pCMV5-HCOBRA1, NELF-B overexpression vector; siNTC, negative
control siRNA; siNELF-B, NELF-B siRNA. |
Transwell invasion assay was performed to assess the
effect of NELF-B-knockdown on the invasive capacity of cells
through the extracellular matrix equivalent collagen. The knockdown
of NELF-B significantly decreased the number of cells that invaded
through collagen by an average of 30% compared with the control
(P≤0.01; Fig. 3C).
NELF-B-knockdown decreases the
expression levels of FOXF2 and the EMT markers N-cadherin, vimentin
and β-catenin, in SNU449 cells
RT-qPCR was used to assess some of the primary EMT
markers, including N-cadherin, vimentin and β-catenin (34), in SNU449 cells following
NELF-B-knockdown. In line with the results of invasion and
migration assays, the expression levels of N-cadherin and vimentin
were significantly decreased by an average of 75 and 70%,
respectively, compared with the negative control (P≤0.01; Fig. 3D). Another critical gene involved in
EMT is the signal transducer molecule, β-catenin. β-catenin
expression is usually elevated in cancer and the protein is
localized in the nucleus, where it drives the expression of
downstream genes involved in the EMT process (35–37). A
significant decrease was observed in the expression levels of
β-catenin post-NELF-B-knockdown by an average of 85% (P≤0.05;
Fig. 3D). The expression levels of
the transcription factor FOXF2 were also analyzed, which is
reported to enhance the invasion and migration of HCC cells
(38). FOXF2 expression was
significantly decreased by an average of 60% following
NELF-B-knockdown (P≤0.05; Fig.
3D).
NELF-B-knockdown decreases survivin
gene expression and induces apoptosis in SNU449 cells
To examine whether NELF-B affected apoptosis in
liver cancer, the mRNA expression levels of survivin were measured,
which is known to be deregulated in cancer and serves critical
roles in the survival and proliferation of cancer cells (39). The expression levels of wild-type
survivin have been previously shown to be decreased upon knockdown
of NELF-B in HepG2 cells (25). In
the present study, the mRNA expression levels of survivin were
examined following the overexpression and knockdown of NELF-B. No
significant difference in survivin expression was detected upon
overexpression of NELF-B in HepG2 cells (P>0.05; Fig. 4A). By contrast, survivin expression
was decreased by an average of 43% following silencing of NELF-B in
SNU449 cells (P≤0.05; Fig. 4B).
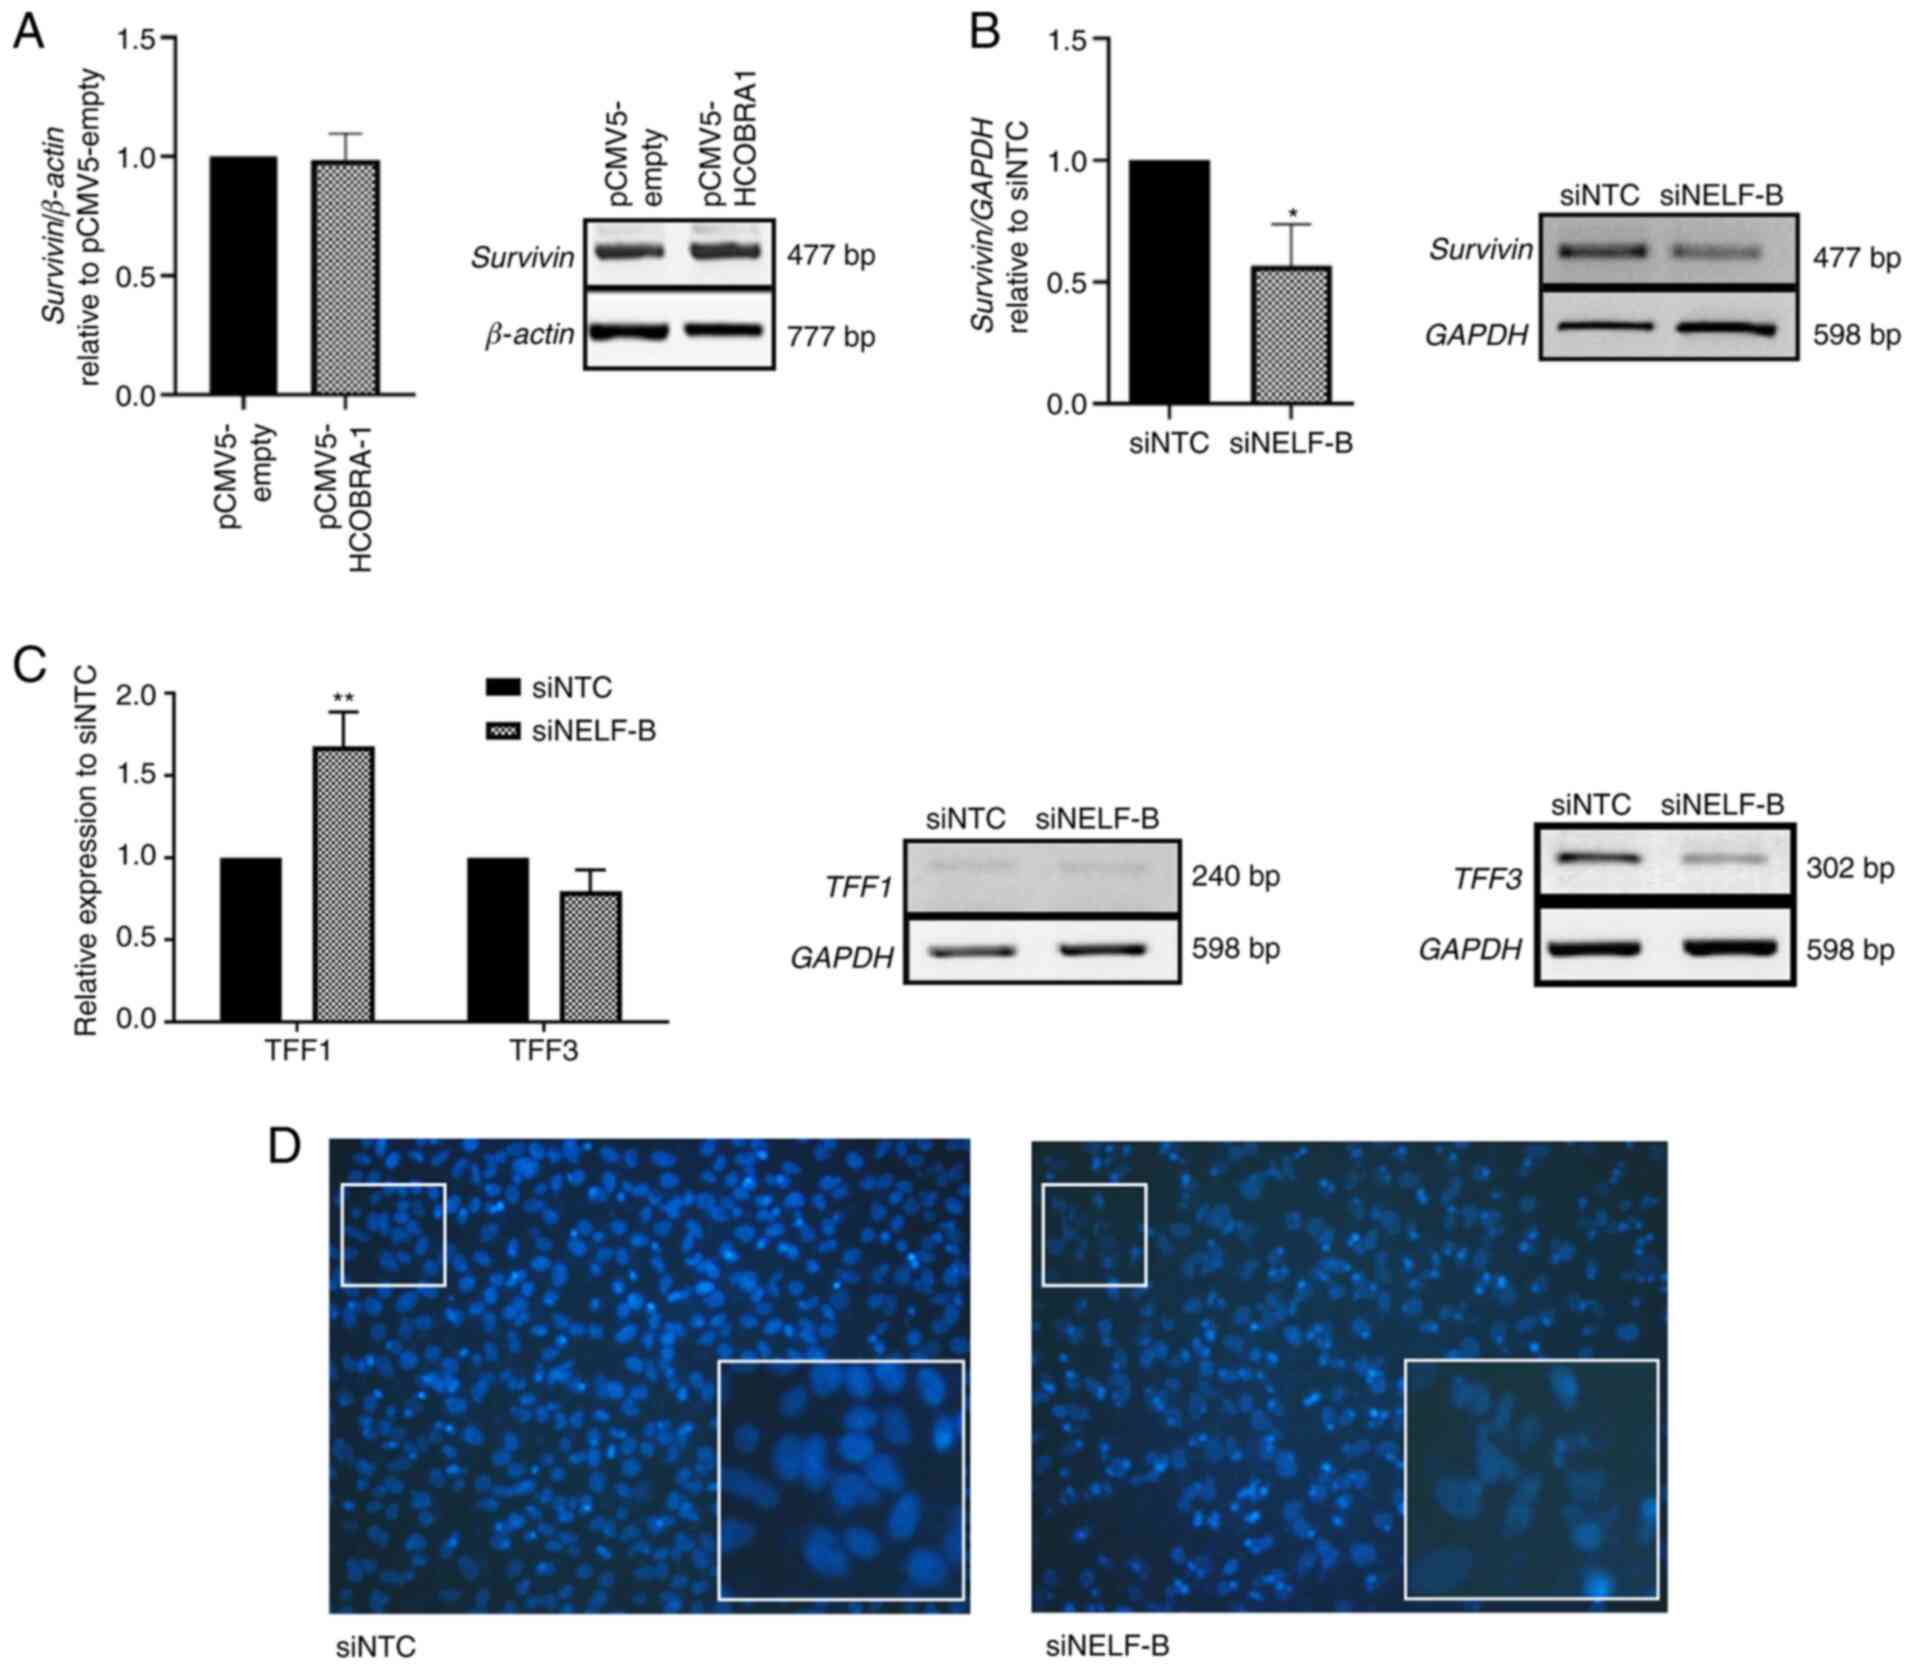 | Figure 4.Effect of NELF-B on the expression
levels of survivin, TFF1 and TFF3, and on nuclear morphology.
Relative mRNA expression levels as assessed by reverse
transcription-semi-quantitative PCR for (A) survivin in HepG2 cells
after the overexpression of NELF-B and (B) survivin (n=3) and (C)
TFF1 and TFF3 (n=3) in SNU449 cells upon NELF-B silencing. (D)
Fragmentation of nuclei, considered as a marker of apoptosis, was
detected in NELF-B-knockdown cells. Figures show the images at ×200
magnification obtained by fluorescence microscopy in Transwell
assay, which were cropped and enlarged 5.5 folds to show the
nuclei. *P≤0.05 and **P≤0.01 vs. siNTC. NELF, negative elongation
factor; COBRA1, cofactor of BRCA1; siRNA, small interfering RNA;
pCMV5-empty, empty pCMV5 vector; pCMV5-HCOBRA1, NELF-B
overexpression vector; siNTC, negative control siRNA; siNELF-B,
NELF-B siRNA. |
DAPI staining revealed fragmented nuclei in cells in
which NELF-B was silenced (Fig. 4D).
Fragmented nuclei are considered a marker for apoptosis (40), which is in agreement with the
decreased survivin expression and decrease in cell counts.
NELF-B silencing decreases trefoil
factor 1 (TFF1) expression in SNU449 cells
Several types of cancer, such as breast, gastric,
prostate and colorectal cancers exhibit aberrant expression levels
of trefoil factor family members, such as TFF1 and TFF3 (41–45). In
HCC, the downregulation of TFF1 and the upregulation of TFF3 are
frequently observed (46,47). In the present study, the mRNA
expression levels of these genes were assessed after knockdown of
NELF-B in SNU449 cells. A significant increase of 1.67 fold was
observed in the expression levels of TFF1 (P≤0.01; Fig. 4C), while TFF3 expression was
decreased by an average of 21% (P>0.05, Fig. 4C) compared with the negative control
group. Notably, the overexpression of NELF-B in HepG2 cells did not
significantly alter the expression levels of either of these genes
(data not shown).
Discussion
The potential role of NELF-B in the pathogenesis of
liver cancer has been previously shown (25,48).
NELF-B expression has been reported to be upregulated in HCC tissue
samples compared with that in paired non-neoplastic tissues
(25). In addition, NELF-B has been
shown to aid the proliferation and migration in the early stage
liver cancer cell line, HepG2 (25).
Furthermore, the differential expression of NELF-B has been
examined among different liver cancer cell lines, representing
various stages of liver cancer (48). The results have revealed that NELF-B
expression is the highest in the early stages, and decreases
gradually with the advance in stage of liver cancer, suggesting a
possible involvement of NELF-B in the initiation of liver cancer
rather than in its progression (48). The present study aimed to gain
further insights into the role of NELF-B through its ectopic
expression in HepG2 cells and tried to unravel the underlying
mechanism. To investigate the involvement of NELF-B in the
maintenance and progression of HCC, a loss-of-function analysis was
also performed in SNU449 cells, which represents an
intermediate-stage HCC cell line.
Sustenance of cell proliferation is the most
fundamental trait of cancer cells (49). In the present study, overexpression
of NELF-B did not induce the proliferation of HepG2 cells, as
evidenced by cell counting and Ki-67 mRNA expression assays. The
migratory ability of NELF-B-overexpressing cells was similar to
that of empty plasmid-transfected cells; however, this assay may
have been affected by the low initial confluence of the cells.
Additionally, NELF-B-overexpressing cells exhibited a
non-significant effect on the apoptotic marker, survivin. The
current results indicated that overexpression of NELF-B in HepG2
cells did not have an effect opposite to that of its knockdown,
which significantly decreased the proliferation and migration
potential of HepG2 cells and decreased Ki-67 and survivin
expression (25).
In prostate cancer, ectopic expression of NELF-B has
been found to support the viability, proliferation and
anchorage-independent growth of cells (24). This effect was opposite to that
observed following the knockdown of NELF-B (24). In breast cancer, ectopic expression
of NELF-B decreased the proliferation of cells, whereas its
knockdown led to the enhancement of proliferation (20). The latter study has suggested that
NELF-B may act through the NELF complex to repress estrogen
receptor α (ERα)-mediated transcription and that NELF-B may be a
rate-limiting step for enhanced NELF activity in the examined cell
line, since its ectopic expression increased NELF-E promoter
binding, and the expression of a subset of ER-α responsive genes
was subsequently repressed (20). On
the contrary, the current results indicated that overexpression of
NELF-B was inadequate at promoting the proliferation and migration
of cells. These results suggest that NELF-B may not be the
rate-limiting factor for exerting an effect on the tested cellular
features in HepG2 cells, and that it may be acting through the NELF
complex, which requires the abundance of other subunits to form a
functional complex.
The present study detected similar mRNA expression
levels of the NELF subunits and NELF-E protein following the
overexpression of NELF-B in HepG2 cells. These results are
consistent with previous findings (17), and indicate a tight control on the
abundance of the NELF complex in the regular cellular context. The
interdependence of the NELF subunits has been shown in different
cell types, where the knockdown of one subunit did not affect the
mRNA expression levels of other subunits, but resulted in
instability of the NELF complex and co-depletion of other subunits
at the protein level (17,50). Notably, in the present study, a
significant decrease in the mRNA expression levels of NELF-A was
detected in NELF-B-silenced SNU449 cells, which has not been
previously reported to the best of our knowledge. It would be
interesting to further examine the mechanism involved in this
regulation.
NELF-B silencing resulted in a significant decrease
in cell proliferation, as well as in the mRNA expression levels of
Ki-67, which is the most predominantly used proliferation marker
(51). These results are consistent
with the effect of NELF-B-knockdown in HepG2 cells (25). Inhibition of apoptotic pathways is
another main hallmark of cancer, promoting the survival of
defective cancer cells (49). BIRC5,
also known as survivin, is a member of the inhibitor of apoptosis
proteins family, which inhibit apoptosis by binding to caspases
(52). The expression of survivin is
undetectable or low in normal adult tissues, but the protein is
overexpressed in most types of cancer, such as liver, blood and
gastric cancers (52–55). Additionally, survivin supports cell
cycle progression, counteracts the tumor suppressor retinoblastoma
protein and induces angiogenesis (56–58). In
the present study, a significant decrease in survivin expression
was observed upon knockdown of NELF-B, which is in concordance with
the decrease in cell count and the detection of nuclear fragments,
which signifies apoptosis (59).
This association between survivin expression and NELF-B has been
shown in different cancer cell lines, including SNU449, HepG2
(25), cervical cancer HeLa cells
(experiments are ongoing) and breast cancer T47D cells (21). This consistent association over
different stages and different types of cancer suggests the
possibility of a direct regulation that requires to be further
examined.
To further understand the involvement of NELF-B in
cancer progression, EMT markers were investigated. EMT occurs
during cancer progression, allowing metastasis through enhanced
migration and invasion of cancer cells (33). Silencing of NELF-B in SNU449 cells
resulted in a significant decrease in cell migration, consistent
with the findings reported for HepG2 cells (25). Additionally, NELF-B-silenced cells
exhibited a decrease in the invasive ability of cells. To the best
of our knowledge, the present study demonstrated for the first time
that NELF-B supported invasion, in addition to migration, in HCC.
Consistently, decreased expression levels of the mesenchymal
markers N-cadherin, vimentin and β-catenin were observed. Vimentin
is an intermediate filament that is central to the cytoskeletal
structure and cell integrity (60),
whereas N-cadherin promotes collective cell migration and modulates
the expression of several cancer-associated genes (61). There are contradictory studies
regarding the effect of N-cadherin on metastases in HCC, with one
study linking its downregulation to enhanced metastasis (62) and another linking overexpression to
metastasis (63). β-catenin, an EMT
marker, is a central signal transducer of the canonical
Wnt/β-catenin signaling pathway (64,65).
Although this pathway is vital for the development of normal liver,
its aberrant activation is frequently implicated in HCC (66). In the absence of Wnt signaling
molecules, the β-catenin destruction complex is activated,
ultimately leading to both phosphorylation and ubiquitination of
β-catenin (67). Upon deactivation
of the destruction complex, β-catenin is accumulated in the cytosol
and is eventually translocated to the nucleus, where it binds to
LEF/TCF factors to regulate the expression of target genes
(68–70). It is suggested that β-catenin, via
the Wnt/β-catenin signaling pathway, activates the expression of
several downstream genes, such as vimentin (71), matrix metalloproteinases (72) and fibronectin (73), which are associated with a
mesenchymal phenotype. Additionally, β-catenin has been reported to
be involved in the induction of survivin expression (74).
FOXF2 is another interesting protein associated with
EMT. It is a transcription factor with a dual role of promoting or
inhibiting proliferation, invasion and metastasis in tumors,
depending on the tumor type and subtype (75). In HCC, the downregulation of FOFX2
induces mesenchymal-epithelial transition and inhibits the invasion
and migration of HCC cells (38),
which is in accordance with the concomitant decrease of FOXF2
expression, invasion and migration in NELF-B-silenced cells
observed in the present study. The downregulation of FOXF2 promotes
the proliferation of Huh7 cells, which represent
well-differentiated HCC (76,77).
Nonetheless, in SNU449 cells, decreased FOXF2 expression was
accompanied by the inhibition of proliferation, which suggests that
the effect of FOXF2 on proliferation is dependent on the
context.
NELF is a critical regulator of clustered genes,
including those of the trefoil family such as TFF1 and TFF3
(22). The knockdown of NELF-B did
not significantly affect the steady-state expression of TFF3 mRNA
in SNU449 cells; however, the steady-state expression of TFF1 mRNA
was significantly increased. The current results suggested that
NELF-B may be implicated in repressing TFF1 expression. TFF1 is
encoded by the TFF1 gene and belongs to the trefoil family; this
family of secretory proteins characteristically contains at least
one trefoil motif (46). Although
mainly secreted by gastric epithelial cells, TFF1 is also secreted
by hepatic cells, albeit to a lower degree (46). Studies performed in breast cancer and
upper gastrointestinal adenocarcinoma have revealed that NELF-B
negatively regulates TFF1 (20,23).
TFF1 has been shown to function as a protectant and restorer of the
gastrointestinal tract, an inflammatory suppressor and a possible
regulator of tissue regeneration (78). In HCC, the putative tumor suppressor,
TFF1, has been shown to suppress proliferation in HCC cell lines,
whereas its deficiency in a TFF knock-out mouse model promoted HCC
progression (46). Additionally,
TFF1 expression has been found to affect the localization of
β-catenin and to negatively regulate its transcriptional activity
and downstream targets in both gastric cancer and HCC (46,78). The
current results suggested that NELF-B may promote tumorigenesis in
SNU449 cells by negatively regulating TFF1 expression. It has been
reported that NELF-B represses the expression of specific
estrogen-responsive genes, including TFF1, in breast cancer
(22). Nevertheless, NELF-B has also
been shown to modulate gene expression, independent of Erα
(23). Therefore, NELF-B may
regulate TFF1 expression in either an estrogen-dependent or
estrogen-independent manner; however, the exact mechanism by which
NELF-B regulates TFF1 in SNU449 cells remains to be determined.
A previous study investigating the role of NELF-E in
HCC has shown that NELF-E supports cell proliferation, colony
formation, oncosphere formation and cell migration through loss-
and gain-of-function analysis (79).
The similar effects of NELF-E- and NELF-B-knockdown suggest that
NELF-B may mediate its action in HCC predominantly through the NELF
complex. Nonetheless, it should be considered that these subunits
do not act through NELF exclusively, and further elucidation of
additional mechanisms and overlap of their functions is
required.
The present study provided evidence that NELF-B
served a critical role in the progression of HCC. It supported some
of the significant cancer hallmarks, including cell proliferation,
apoptosis inhibition and EMT, which is essential for cancer
metastasis. The lack of effect on proliferation and migration
following ectopic expression in HepG2 cells suggested the
insufficiency of NELF-B overexpression in promoting an increase in
these processes. NELF-B may have a great potential for use as a
prognostic factor and a therapeutic target for liver cancer.
Further examination of different etiologies among HCC and more
advanced stages is recommended. Additionally, an elucidation of the
mechanisms of NELF-B action and its effect on the entire
transcriptome would provide valuable insights.
Supplementary Material
Supporting Data
Acknowledgements
The authors would like to thank Mr. Amged Ouf (The
American University in Cairo, New Cairo, Egypt) for his technical
support in performing the plasmid transfection experiments, and Mr.
Tarek Saleh for his help in generating the figures (Cannonball VFX
LLC, San Diego, CA, USA).
Funding
The present study was supported by the American
University in Cairo Internal Faculty Research Grant and Graduate
Student Research Grants.
Availability of data and materials
All data generated or analyzed during this study are
included in this published article.
Authors' contributions
AA conceived and designed the study. AA supervised
and contributed to the analysis and troubleshooting of all the
experiments and results. RJM performed the overexpression and
subsequent functional assays in HepG2. MHG performed the knockdown
and subsequent functional assays in SNU449. MHG, RJM, EZM, RZ and
AMA performed and interpreted RT-PCR results. OMA performed and
interpreted qPCR results. MHG, RJM, EZM and OMA contributed to data
analysis. MHG drafted the initial manuscript with outstanding
contributions from RJM, EZM and OMA. All authors have read and
approved the final manuscript. RJM and AA confirmed the
authenticity of the raw data related to NELF-B overexpression. MHG
and AA confirmed the authenticity of the raw data associated with
the NELF-B knockdown.
Ethics approval and consent to
participate
Not applicable.
Patient consent for publication
Not applicable.
Competing interests
The authors declare that they have no competing
interests.
Glossary
Abbreviations
Abbreviations:
|
COBRA1
|
cofactor of BRCA1
|
|
EMT
|
epithelial-mesenchymal transition
|
|
ERα
|
estrogen receptor α
|
|
FOXF2
|
forkhead box F2
|
|
HBV
|
hepatitis B virus
|
|
HCC
|
hepatocellular carcinoma
|
|
NELF
|
negative elongation factor
|
|
RT-qPCR
|
reverse transcription-quantitative
PCR
|
|
TFF1/3
|
trefoil factor 1/3
|
References
|
1
|
Bray F, Ferlay J, Soerjomataram I, Siegel
RL, Torre LA and Jemal A: Global cancer statistics 2018: GLOBOCAN
estimates of incidence and mortality worldwide for 36 cancers in
185 countries. CA Cancer J Clin. 68:394–424. 2018. View Article : Google Scholar : PubMed/NCBI
|
|
2
|
Simonetti RG, Liberati A, Angiolini C and
Pagliaro L: Treatment of hepatocellular carcinoma: A systematic
review of randomized controlled trials. Ann Oncol. 8:117–136. 1997.
View Article : Google Scholar : PubMed/NCBI
|
|
3
|
Chidambaranathan-Reghupaty S, Fisher PB
and Sarkar D: Hepatocellular carcinoma (HCC): Epidemiology,
etiology and molecular classification. Adv Cancer Res. 149:1–61.
2021. View Article : Google Scholar : PubMed/NCBI
|
|
4
|
Zhao YJ, Ju Q and Li GC: Tumor markers for
hepatocellular carcinoma. Mol Clin Oncol. 1:593–598. 2013.
View Article : Google Scholar : PubMed/NCBI
|
|
5
|
Sanyal AJ, Yoon SK and Lencioni R: The
etiology of hepatocellular carcinoma and consequences for
treatment. Oncologist. 15 (Suppl 4):S14–S22. 2010. View Article : Google Scholar
|
|
6
|
Dong Y, Wang WP, Mao F, Zhang Q, Yang D,
Tannapfel A, Meloni MF, Neye H, Clevert DA and Dietrich CF: Imaging
features of fibrolamellar hepatocellular carcinoma with
contrast-enhanced ultrasound. Ultraschall Med. 42:306–313. 2021.
View Article : Google Scholar : PubMed/NCBI
|
|
7
|
Jiang HY, Chen J, Xia CC, Cao LK, Duan T
and Song B: Noninvasive imaging of hepatocellular carcinoma: From
diagnosis to prognosis. World J Gastroenterol. 24:2348–2362. 2018.
View Article : Google Scholar : PubMed/NCBI
|
|
8
|
Andreana L, Isgrò G, Pleguezuelo M,
Germani G and Burroughs AK: Surveillance and diagnosis of
hepatocellular carcinoma in patients with cirrhosis. World J
Hepatol. 1:48–61. 2009. View Article : Google Scholar : PubMed/NCBI
|
|
9
|
Janevska D, Chaloska-Ivanova V and
Janevski V: Hepatocellular carcinoma: Risk factors, diagnosis and
treatment. Open Access Maced J Med Sci. 3:732–736. 2015. View Article : Google Scholar : PubMed/NCBI
|
|
10
|
Dhanasekaran R, Bandoh S and Roberts LR:
Molecular pathogenesis of hepatocellular carcinoma and impact of
therapeutic advances. F1000Res. 5:F1000 Faculty Rev. –879. 2016.
View Article : Google Scholar : PubMed/NCBI
|
|
11
|
Ye Q, Hu YF, Zhong H, Nye AC, Belmont AS
and Li R: BRCA1-induced large-scale chromatin unfolding and
allele-specific effects of cancer-predisposing mutations. J Cell
Biol. 155:911–921. 2001. View Article : Google Scholar : PubMed/NCBI
|
|
12
|
Narita T, Yamaguchi Y, Yano K, Sugimoto S,
Chanarat S, Wada T, Kim DK, Hasegawa J, Omori M, Inukai N, et al:
Human transcription elongation factor NELF: Identification of novel
subunits and reconstitution of the functionally active complex. Mol
Cell Biol. 23:1863–1873. 2003. View Article : Google Scholar : PubMed/NCBI
|
|
13
|
Wada T, Takagi T, Yamaguchi Y, Ferdous A,
Imai T, Hirose S, Sugimoto S, Yano K, Hartzog GA, Winston F, et al:
DSIF, a novel transcription elongation factor that regulates RNA
polymerase II processivity, is composed of human Spt4 and Spt5
homologs. Genes Dev. 12:343–356. 1998. View Article : Google Scholar : PubMed/NCBI
|
|
14
|
Yankulov K, Yamashita K, Roy R, Egly JM
and Bentley DL: The transcriptional elongation inhibitor
5,6-Dichloro-1-β-D-ribofuranosylbenzimidazole inhibits
transcription Factor IIH-associated protein kinase. J Biol Chem.
270:23922–23925. 1995. View Article : Google Scholar : PubMed/NCBI
|
|
15
|
Yamaguchi Y, Takagi T, Wada T, Yano K,
Furuya A, Sugimoto S, Hasegawa J and Handa H: NELF, a multisubunit
complex containing RD, cooperates with DSIF to repress RNA
polymerase II elongation. Cell. 97:41–51. 1999. View Article : Google Scholar : PubMed/NCBI
|
|
16
|
Yamaguchi Y, Filipovska J, Yano K, Furuya
A, Inukai N, Narita T, Wada T, Sugimoto S, Konarska MM and Handa H:
Stimulation of RNA polymerase II elongation by hepatitis delta
antigen. Science. 293:124–127. 2001. View Article : Google Scholar : PubMed/NCBI
|
|
17
|
Sun J, Watkins G, Blair AL, Moskaluk C,
Ghosh S, Jiang WG and Li R: Deregulation of cofactor of BRCA1
expression in breast cancer cells. J Cell Biochem. 103:1798–1807.
2008. View Article : Google Scholar : PubMed/NCBI
|
|
18
|
Sun J, Blair AL, Aiyar SE and Li R:
Cofactor of BRCA1 modulates androgen-dependent transcription and
alternative splicing. J Steroid Biochem Mol Biol. 107:131–139.
2007. View Article : Google Scholar : PubMed/NCBI
|
|
19
|
Zhong H, Zhu J, Zhang H, Ding L, Sun Y,
Huang C and Ye Q: COBRA1 inhibits AP-1 transcriptional activity in
transfected cells. Biochem Biophys Res Commun. 325:568–573. 2004.
View Article : Google Scholar : PubMed/NCBI
|
|
20
|
Aiyar SE, Sun JL, Blair AL, Moskaluk CA,
Lu YZ, Ye QN, Yamaguchi Y, Mukherjee A, Ren DM, Handa H and Li R:
Attenuation of estrogen receptor alpha-mediated transcription
through estrogen-stimulated recruitment of a negative elongation
factor. Genes Dev. 18:2134–2146. 2004. View Article : Google Scholar : PubMed/NCBI
|
|
21
|
Aiyar SE, Cho H, Lee J and Li R: Concerted
transcriptional regulation by BRCA1 and COBRA1 in breast cancer
cells. Int J Biol Sci. 3:486–492. 2007. View Article : Google Scholar : PubMed/NCBI
|
|
22
|
Aiyar SE, Blair AL, Hopkinson DA,
Bekiranov S and Li R: Regulation of clustered gene expression by
cofactor of BRCA1 (COBRA1) in breast cancer cells. Oncogene.
26:2543–2553. 2007. View Article : Google Scholar : PubMed/NCBI
|
|
23
|
McChesney PA, Aiyar SE, Lee OJ, Zaika A,
Moskaluk C, Li R and El-Rifai W: Cofactor of BRCA1: A novel
transcription factor regulator in upper gastrointestinal
adenocarcinomas. Cancer Res. 66:1346–1353. 2006. View Article : Google Scholar : PubMed/NCBI
|
|
24
|
Yun H, Bedolla R, Horning A, Li R, Chiang
HC, Huang TH, Reddick R, Olumi AF, Ghosh R and Kumar AP: BRCA1
interacting protein COBRA1 facilitates adaptation to
Castrate-Resistant growth conditions. Int J Mol Sci. 19:21042018.
View Article : Google Scholar : PubMed/NCBI
|
|
25
|
El Zeneini E, Kamel S, El-Meteini M and
Amleh A: Knockdown of COBRA1 decreases the proliferation and
migration of hepatocellular carcinoma cells. Oncol Rep.
37:1896–1906. 2017. View Article : Google Scholar : PubMed/NCBI
|
|
26
|
López-Terrada D, Cheung SW, Finegold MJ
and Knowles BB: Hep G2 is a hepatoblastoma-derived cell line. Hum
Pathol. 40:1512–1515. 2009. View Article : Google Scholar : PubMed/NCBI
|
|
27
|
Strober W: Trypan blue exclusion test of
cell viability. Curr Protoc Immunol. doi:
10.1002/0471142735.ima03bs21.
|
|
28
|
Schneider CA, Rasband WS and Eliceiri KW:
NIH Image to ImageJ: 25 years of image analysis. Nat Methods.
9:671–675. 2012. View Article : Google Scholar : PubMed/NCBI
|
|
29
|
Livak KJ and Schmittgen TD: Analysis of
relative gene expression data using real-time quantitative PCR and
the 2(-Delta Delta C(T)) method. Methods. 25:402–408. 2001.
View Article : Google Scholar : PubMed/NCBI
|
|
30
|
Jonkman JE, Cathcart JA, Xu F, Bartolini
ME, Amon JE, Stevens KM and Colarusso P: An introduction to the
wound healing assay using live-cell microscopy. Cell Adh Migr.
8:440–451. 2014. View Article : Google Scholar : PubMed/NCBI
|
|
31
|
Gebäck T, Schulz MMP, Koumoutsakos P and
Detmar M: TScratch: A novel and simple software tool for automated
analysis of monolayer wound healing assays. BioTechniques.
46:265–274. 2009. View Article : Google Scholar : PubMed/NCBI
|
|
32
|
Boleman AI, Tănasie G, Găluşcan A, Cristea
MI, Bojin FM, Panaitescu C and Păunescu V: Studies regarding the in
vitro wound healing potential of mouse dental pulp stem-like
progenitor cells. Biotechnol & Biotec Eq. 26:2781–2785. 2012.
View Article : Google Scholar
|
|
33
|
Kalluri R and Weinberg RA: The basics of
epithelial-mesenchymal transition. J Clin Invest. 119:1420–1428.
2009. View Article : Google Scholar : PubMed/NCBI
|
|
34
|
Cho SB, Lee KH, Lee JH, Park SY, Lee WS,
Park CH, Kim HS, Choi SK and Rew JS: Expression of E- and
N-cadherin and clinicopathology in hepatocellular carcinoma. Pathol
Int. 58:635–642. 2008. View Article : Google Scholar : PubMed/NCBI
|
|
35
|
Dahmani R, Just PA and Perret C: The
Wnt/β-catenin pathway as a therapeutic target in human
hepatocellular carcinoma. Clin Res Hepatol Gastroenterol.
35:709–713. 2011. View Article : Google Scholar : PubMed/NCBI
|
|
36
|
Khramtsov AI, Khramtsova GF, Tretiakova M,
Huo D, Olopade OI and Goss KH: Wnt/β-catenin pathway activation is
enriched in basal-like breast cancers and predicts poor outcome. Am
J Pathol. 176:2911–2920. 2010. View Article : Google Scholar : PubMed/NCBI
|
|
37
|
Kobayashi M, Honma T, Matsuda Y, Suzuki Y,
Narisawa R, Ajioka Y and Asakura H: Nuclear translocation of
β-catenin in colorectal cancer. Br J Cancer. 82:1689–1693.
2000.PubMed/NCBI
|
|
38
|
Dou C, Jin X, Sun L, Zhang B, Han M and Li
T: FOXF2 deficiency promotes hepatocellular carcinoma metastasis by
inducing mesenchymal-epithelial transition. Cancer Biomark.
19:447–454. 2017. View Article : Google Scholar : PubMed/NCBI
|
|
39
|
Fukuda S and Pelus LM: Survivin, a cancer
target with an emerging role in normal adult tissues. Mol Cancer
Ther. 5:1087–1098. 2006. View Article : Google Scholar : PubMed/NCBI
|
|
40
|
Kerr JF, Wyllie AH and Currie AR:
Apoptosis: A basic biological phenomenon with wide-ranging
implications in tissue kinetics. Br J Cancer. 26:239–257. 1972.
View Article : Google Scholar : PubMed/NCBI
|
|
41
|
Lacroix M: Significance, detection and
markers of disseminated breast cancer cells. Endocr Relat Cancer.
13:1033–1067. 2006. View Article : Google Scholar : PubMed/NCBI
|
|
42
|
Im S, Yoo C, Jung JH, Choi HJ, Yoo J and
Kang CS: Reduced expression of TFF1 and increased expression of
TFF3 in gastric cancer: Correlation with clinicopathological
parameters and prognosis. Int J Med Sci. 10:133–140. 2013.
View Article : Google Scholar : PubMed/NCBI
|
|
43
|
Vestergaard EM, Borre M, Poulsen SS, Nexø
E and Tørring N: Plasma levels of trefoil factors are increased in
patients with advanced prostate cancer. Clin Cancer Res. 12((3 Pt
1)): 807–812. 2006. View Article : Google Scholar : PubMed/NCBI
|
|
44
|
Yusufu A, Shayimu P, Tuerdi R, Fang C,
Wang F and Wang H: TFF3 and TFF1 expression levels are elevated in
colorectal cancer and promote the malignant behavior of colon
cancer by activating the EMT process. Int J Oncol. 55:789–804.
2019.PubMed/NCBI
|
|
45
|
Casado E, Garcia VM, Sánchez JJ, Gómez Del
Pulgar MT, Feliu J, Maurel J, Castelo B, Moreno Rubio J, López RA,
García-Cabezas MÁ, et al: Upregulation of trefoil factor 3 (TFF3)
after rectal cancer chemoradiotherapy is an adverse prognostic
factor and a potential therapeutic target. Int J Radiat Oncol Biol
Phys. 84:1151–1158. 2012. View Article : Google Scholar : PubMed/NCBI
|
|
46
|
Ochiai Y, Yamaguchi J, Kokuryo T, Yokoyama
Y, Ebata T and Nagino M: Trefoil factor family 1 inhibits the
development of hepatocellular carcinoma by regulating β-catenin
activation. Hepatology. 72:503–517. 2020. View Article : Google Scholar : PubMed/NCBI
|
|
47
|
You ML, Chen YJ, Chong QY, Wu MM, Pandey
V, Chen RM, Liu L, Ma L, Wu ZS, Zhu T and Lobie PE: Trefoil factor
3 mediation of oncogenicity and chemoresistance in hepatocellular
carcinoma is AKT-BCL-2 dependent. Oncotarget. 8:39323–39344. 2017.
View Article : Google Scholar : PubMed/NCBI
|
|
48
|
Youssef A, Shawer H, Afify A and Amleh A:
The potential involvement of the cofactor of BRCA1 in
hepatocellular carcinoma pathogenesis. Adv Mod Oncol Res.
2:2242016. View Article : Google Scholar : PubMed/NCBI
|
|
49
|
Hanahan D and Weinberg RA: The hallmarks
of cancer. Cell. 100:57–70. 2000. View Article : Google Scholar : PubMed/NCBI
|
|
50
|
Sun J and Li R: Human negative elongation
factor activates transcription and regulates alternative
transcription initiation. J Biol Chem. 285:6443–6452. 2010.
View Article : Google Scholar : PubMed/NCBI
|
|
51
|
Schlüter C, Duchrow M, Wohlenberg C,
Becker MH, Key G, Flad HD and Gerdes J: The cell
proliferation-associated antigen of antibody Ki-67: A very large,
ubiquitous nuclear protein with numerous repeated elements,
representing a new kind of cell cycle-maintaining proteins. J Cell
Biol. 123:513–522. 1993. View Article : Google Scholar : PubMed/NCBI
|
|
52
|
Hunter AM, LaCasse EC and Korneluk RG: The
inhibitors of apoptosis (IAPs) as cancer targets. Apoptosis.
12:1543–1568. 2007. View Article : Google Scholar : PubMed/NCBI
|
|
53
|
Ambrosini G, Adida C and Altieri DC: A
novel anti-apoptosis gene, survivin, expressed in cancer and
lymphoma. Nat Med. 3:917–921. 1997. View Article : Google Scholar : PubMed/NCBI
|
|
54
|
Han G, Gong H, Wang Y, Guo S and Liu K:
AMPK/mTOR-mediated inhibition of survivin partly contributes to
metformin-induced apoptosis in human gastric cancer cell. Cancer
Biol Ther. 16:77–87. 2015. View Article : Google Scholar : PubMed/NCBI
|
|
55
|
Su C: Survivin in survival of
hepatocellular carcinoma. Cancer Lett. 379:184–190. 2016.
View Article : Google Scholar : PubMed/NCBI
|
|
56
|
Giodini A, Kallio MJ, Wall NR, Gorbsky GJ,
Tognin S, Marchisio PC, Symons M and Altieri DC: Regulation of
microtubule stability and mitotic progression by survivin. Cancer
Res. 62:2462–2467. 2002.PubMed/NCBI
|
|
57
|
Suzuki A, Hayashida M, Ito T, Kawano H,
Nakano T, Miura M, Akahane K and Shiraki K: Survivin initiates cell
cycle entry by the competitive interaction with Cdk4/p16(INK4a) and
Cdk2/cyclin E complex activation. Oncogene. 19:3225–3234. 2000.
View Article : Google Scholar : PubMed/NCBI
|
|
58
|
O'Connor DS, Schechner JS, Adida C, Mesri
M, Rothermel AL, Li F, Nath AK, Pober JS and Altieri DC: Control of
apoptosis during angiogenesis by survivin expression in endothelial
cells. Am J Pathol. 156:393–398. 2000. View Article : Google Scholar : PubMed/NCBI
|
|
59
|
Kramer A, Liashkovich I, Oberleithner H,
Ludwig S, Mazur I and Shahin V: Apoptosis leads to a degradation of
vital components of active nuclear transport and a dissociation of
the nuclear lamina. Proc Natl Acad Sci USA. 105:11236–11241. 2008.
View Article : Google Scholar : PubMed/NCBI
|
|
60
|
Goldman RD, Khuon S, Chou YH, Opal P and
Steinert PM: The function of intermediate filaments in cell shape
and cytoskeletal integrity. J Cell Biol. 134:971–983. 1996.
View Article : Google Scholar : PubMed/NCBI
|
|
61
|
Mrozik KM, Blaschuk OW, Cheong CM,
Zannettino ACW and Vandyke K: N-cadherin in cancer metastasis, its
emerging role in haematological malignancies and potential as a
therapeutic target in cancer. BMC Cancer. 18:9392018. View Article : Google Scholar : PubMed/NCBI
|
|
62
|
Zhan DQ, Wei S, Liu C, Liang BY, Ji GB,
Chen XP, Xiong M and Huang ZY: Reduced N-cadherin expression is
associated with metastatic potential and poor surgical outcomes of
hepatocellular carcinoma. J Gastroenterol Hepatol. 27:173–180.
2012. View Article : Google Scholar : PubMed/NCBI
|
|
63
|
Zhou SJ, Liu FY, Zhang AH, Liang HF, Wang
Y, Ma R, Jiang YH and Sun NF: MicroRNA-199b-5p attenuates
TGF-beta1-induced epithelial-mesenchymal transition in
hepatocellular carcinoma. Br J Cancer. 117:233–244. 2017.
View Article : Google Scholar : PubMed/NCBI
|
|
64
|
Noordermeer J, Klingensmith J, Perrimon N
and Nusse R: Dishevelled and armadillo act in the Wingless
signalling pathway in Drosophila. Nature. 367:80–83. 1994.
View Article : Google Scholar : PubMed/NCBI
|
|
65
|
Peifer M, Berg S and Reynolds AB: A
repeating amino acid motif shared by proteins with diverse cellular
roles. Cell. 76:789–791. 1994. View Article : Google Scholar : PubMed/NCBI
|
|
66
|
Laurent-Puig P and Zucman-Rossi J:
Genetics of hepatocellular tumors. Oncogene. 25:3778–3786. 2006.
View Article : Google Scholar : PubMed/NCBI
|
|
67
|
Papkoff J, Rubinfeld B, Schryver B and
Polakis P: Wnt-1 regulates free pools of catenins and stabilizes
APC-catenin complexes. Mol Cell Biol. 16:2128–2134. 1996.
View Article : Google Scholar : PubMed/NCBI
|
|
68
|
Behrens J, von Kries JP, Kühl M, Bruhn L,
Wedlich D, Grosschedl R and Birchmeier W: Functional interaction of
β-catenin with the transcription factor LEF-1. Nature. 382:638–642.
1996. View Article : Google Scholar : PubMed/NCBI
|
|
69
|
Huber O, Korn R, McLaughlin J, Ohsugi M,
Herrmann BG and Kemler R: Nuclear localization of β-catenin by
interaction with transcription factor LEF-1. Mech Dev. 59:3–10.
1996. View Article : Google Scholar : PubMed/NCBI
|
|
70
|
Molenaar M, van de Wetering M, Oosterwegel
M, Peterson-Maduro J, Godsave S, Korinek V, Roose J, Destrée O and
Clevers H: XTcf-3 transcription factor mediates β-catenin-induced
axis formation in xenopus embryos. Cell. 86:391–399. 1996.
View Article : Google Scholar : PubMed/NCBI
|
|
71
|
Gilles C, Polette M, Mestdagt M,
Nawrocki-Raby B, Ruggeri P, Birembaut P and Foidart JM:
Transactivation of vimentin by beta-catenin in human breast cancer
cells. Cancer Res. 63:2658–2664. 2003.PubMed/NCBI
|
|
72
|
Lowy AM, Clements WM, Bishop J, Kong L,
Bonney T, Sisco K, Aronow B, Fenoglio-Preiser C and Groden J:
β-catenin/Wnt signaling regulates expression of the membrane type 3
matrix metalloproteinase in gastric cancer. Cancer Res.
66:4734–4741. 2006. View Article : Google Scholar : PubMed/NCBI
|
|
73
|
Gradl D, Kühl M and Wedlich D: The Wnt/Wg
signal transducer beta-catenin controls fibronectin expression. Mol
Cell Biol. 19:5576–5587. 1999. View Article : Google Scholar : PubMed/NCBI
|
|
74
|
Tapia JC, Torres VA, Rodriguez DA, Leyton
L and Quest AF: Casein kinase 2 (CK2) increases survivin expression
via enhanced beta-catenin-T cell factor/lymphoid enhancer binding
factor-dependent transcription. Proc Natl Acad Sci USA.
103:15079–15084. 2006. View Article : Google Scholar : PubMed/NCBI
|
|
75
|
He W, Kang Y, Zhu W, Zhou B, Jiang X, Ren
C and Guo W: FOXF2 acts as a crucial molecule in tumours and
embryonic development. Cell Death Dis. 11:4242020. View Article : Google Scholar : PubMed/NCBI
|
|
76
|
Shao J, Cao J, Liu Y, Mei H, Zhang Y and
Xu W: MicroRNA-519a promotes proliferation and inhibits apoptosis
of hepatocellular carcinoma cells by targeting FOXF2. FEBS Open
Bio. 5:893–899. 2015. View Article : Google Scholar : PubMed/NCBI
|
|
77
|
Shi Z, Liu J, Yu X, Huang J, Shen S, Zhang
Y, Han R, Ge N and Yang Y: Loss of FOXF2 expression predicts poor
prognosis in hepatocellular carcinoma patients. Ann Surg Oncol.
23:211–217. 2016. View Article : Google Scholar : PubMed/NCBI
|
|
78
|
Soutto M, Peng D, Katsha A, Chen Z,
Piazuelo MB, Washington MK, Belkhiri A, Correa P and El-Rifai W:
Activation of β-catenin signalling by TFF1 loss promotes cell
proliferation and gastric tumorigenesis. Gut. 64:1028–1039. 2015.
View Article : Google Scholar : PubMed/NCBI
|
|
79
|
Dang H, Takai A, Forgues M, Pomyen Y, Mou
H, Xue W, Ray D, Ha KCH, Morris QD, Hughes TR and Wang XW:
Oncogenic activation of the RNA binding protein NELFE and MYC
signaling in hepatocellular carcinoma. Cancer Cell. 32:101–114.e8.
2017. View Article : Google Scholar : PubMed/NCBI
|