Introduction
The use of immunotherapy has revolutionized the
treatment of numerous types of cancer, such as lung, gastric and
cervical cancers (1,2). New indications, treatment strategies
and thus, consensus recommendations, continuously emerge for immune
checkpoint inhibitors (ICIs) designed for different malignancies
(3,4). The ICIs nivolumab (Opdivo; Bristol
Myers Squibb) and pembrolizumab (Keytruda; Merck Sharpe &
Dohme-Hoddesdon) have been approved in the recent years for the
treatment of patients with recurrent/metastatic head and neck
squamous cell carcinoma (HNSCC) and who experience disease
progression after treatment with a platinum-based chemotherapy
agent (3–5). These novel drugs aim to target an
important immunological checkpoint in HNSCC and oral squamous cell
carcinoma (OSCC), which is the programmed death-1 receptor
(PD-1)/programmed death ligand-1 (PD-L1) interaction (5,6).
Nivolumab and pembrolizumab block the inhibitory interaction
between PD-1 and PD-L1, which reactivates the immune system and
enhances tumor cell elimination. ICIs targeting PD-1/PD-L1 have
demonstrated clinical efficacy in HNSCC, highlighting the important
role of ICIs in the management of the disease (6,7). PD-L1
expression is commonly used as a biomarker to predict the
therapeutic effect of and response rates to the immunotherapy
drugs, nivolumab and pembrolizumab (8). In patients with recurrent/metastatic
HNSCC, biopsies are commonly used for confirmation of disease
recurrence, and it has been suggested that these biopsies should
also be used to evaluate PD-L1 expression (8). However, biopsies are surgically
invasive and place a physical burden on the patient. Therefore, a
complementary and minimally invasive procedure for assessing PD-L1
expression may be beneficial for patients. Magnetic resonance
imaging (MRI) is a widespread imaging technique that is frequently
used for the diagnosis of HNSCC. In particular, dynamic
contrast-enhanced (DCE)-MRI produces functional images and provides
insight into the tumor microvasculature, which can help predict the
outcome. Thus, DCE-MRI is currently used as a non-invasive method
that provides measures related to immunohistochemical analyses
(9,10), which helps investigating numerous
histopathological features that may predict tumor behavior.
Microvessel density (MVD) is a key histopathological feature worthy
of investigation, which has been reported to be a useful prognostic
indicator in various types of malignant tumors (11,12).
Assessment of MVD involves the evaluation of vessels following
staining with the endothelial cell marker CD31 (11). MVD reflects the intensity of
angiogenesis within the tumor, which is reportedly associated with
tumor growth or metastasis in OSCC (9,12).
A previous study suggested that angiogenesis may
influence the enhancement patterns on DCE-MRI scans, and that MVD
is significantly associated with DCE-MRI parameters in patients
with OSCC (9). MVD was also reported
to be positively associated with PD-L1 expression in patients with
classical Hodgkin's lymphoma, as the mean MVD of PD-L1-positive
tumors was found to be slightly higher compared with that of
PD-L1-negative tumors (11). Based
on these studies, the present study hypothesized that DCE-MRI may
be able to predict PD-L1 expression.
In our institution, DCE-MRI is performed as a
preoperative examination for patients with HNSCC, particularly
those with OSCC. Considering that DCE-MRI is a non-invasive method,
the identification of valid DCE-MRI parameters for estimating the
expression of PD-L1 and subsequently assessing the therapeutic
effect of ICIs may reduce the physical burden that biopsies incur
to patients and expand to its clinical application. To the best of
our knowledge, no previous study has investigated the potential
roles of DCE-MRI signal intensity (SI)- and contrast index
(CI)-based parameters for predicting the therapeutic effect of ICIs
in patients with OSCC.
Materials and methods
Patients
The study protocol was approved by the Institutional
Review Board of Okayama University Graduate School of Medicine,
Dentistry and Pharmaceutical Sciences, Okayama University Hospital,
Ethics Committee (approval no. 1807-008). All patients provided
written informed consent prior to participation. Between October
2012 and March 2017, 59 patients who underwent DCE-MRI at Okayama
University Hospital (Okayama, Japan) were histopathologically
diagnosed with primary OSCC. Patients with T4 tumors according to
the Tumor-Node-Metastasis (TNM) classification (13) were excluded, as T4 tumors are large
and likely to invade the peripheral tissue, which would produce an
erroneous SI on a DCE-MRI scan. Of the selected patients with T1,
T2 and T3 tumors, patients were excluded if the lesions were too
small for the SI to be calculated, if they had substantial
metal-induced artifacts, if the tumor exhibited areas of necrosis,
or if patient movement was recorded during the scan. Furthermore,
patients who underwent DCE-MRI using a different processing
platform (Tissue 4D; Siemens Healthineers), which included 30
scans, and patients whose DCE-MRI scans were acquired in the
coronal plane, were also excluded. Thus, according to the inclusion
criteria, 21 patients (12 men and 9 women; age range, 34–87 years;
mean age, 64 years) were included as the final patient cohort in
the present study. The distribution of the primary lesions was as
follows: Tongue, n=8; maxillary gingiva, n=3; mandibular gingiva,
n=3; floor of the mouth, n=4; buccal mucosa, n=2; and palate,
n=1.
MRI protocol
The MRI examinations were performed using a 3T unit
(MAGNETOM Skyra; Siemens Healthineers) with a head coil or head and
neck coil. T1-weighted images (T1WIs) or T1-weighted
fluid-attenuated inversion recovery (T1-FLAIR) images were acquired
with a spin-echo sequence, and short inversion time inversion
recovery (STIR) images were acquired for all cases with a turbo
spin-echo sequence. Images were taken in both the axial and coronal
planes. The section level for the dynamic study was then selected
from the acquired T1WIs and STIR images. DCE-MRI in the selected
section was performed using three-dimensional fast imaging with a
steady-state precession sequence. The imaging parameters of the
dynamic study were as follows: Repetition time, 4.53–7.48 msec;
echo time, 1.7–3.06 msec; and flip angle, 12°. The first DCE-MRI
series was composed of 14 consecutive scans, the acquisition time
for each scan was 14 sec and the interscan interval was 1 sec,
resulting in a total scan time of 210 sec. Before the second scan,
0.2 ml/kg gadopentetate dimeglumine (Magnevist®; Nihon
Schering) was administered intravenously for 6 sec at a rate of
~2.0 ml/sec via manual injection. Contrast-enhanced (CE) T1WIs with
fat suppression or CE T1-FLAIR images with fat suppression were
acquired after DCE-MRI.
Evaluation of DCE-MRI parameters
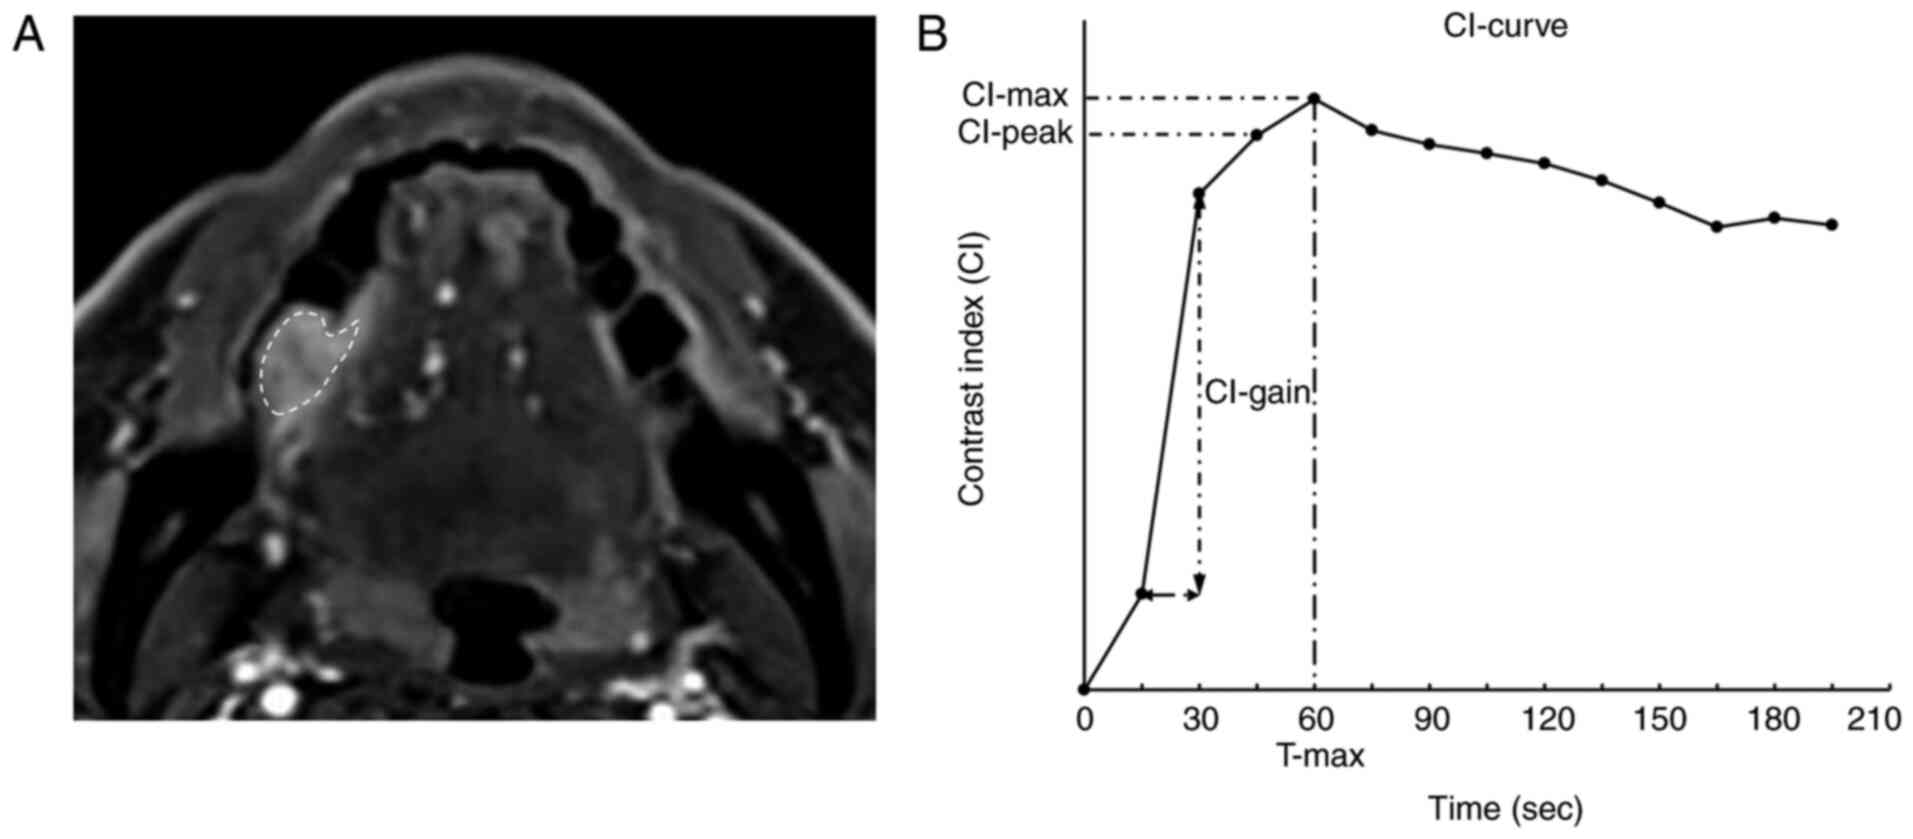
For each lesion, the region of interest (ROI) was
drawn on the DCE images to include the region containing the
greatest diameter of the tumor (Fig.
1A). The SI of each ROI was calculated using a workstation
(Synapse Vincent; Fujifilm Medical Co.). The CI was calculated
using the following formula: [SI (post-contrast)-SI
(pre-contrast)]/SI (pre-contrast). The time course of the CI was
then plotted to obtain a CI curve. Using the CI curve, the
following DCE-MRI parameters were defined: Maximum CI (CI-max; the
maximum amplitude of contrast enhancement) and time of CI-max
(T-max; the time at which CI-max occurred). The peak CI (CI-peak),
which is the first CI measurement that satisfied CI-max × 0.90, and
the maximum CI gain (CI-gain), which is the maximum gradient on the
upslope phase of the enhancement curve that indicates the
difference in the CI between two consecutive images, were
calculated (Fig. 1B).
Preparation of surgically resected
specimens for histological examinations
The surgically resected specimens were fixed in
formalin and embedded in paraffin using a standardized procedure
(14). The representative tumor
sections were selected so that the longest diameter in the plane of
measurement containing the largest amount of tumor would be
included. The representative tumor sections were cut into 3-µm
serial sections and mounted on APS-coated glass slides. These
sections were subsequently used for immunohistochemistry (IHC).
IHC
Paraffin-embedded tissue sections were
deparaffinized in a series of xylene for 15 min, rehydrated through
a decreasing series of graded ethanol (100, 90, 80 and 70%),
incubated in 3% hydrogen peroxide/methanol solution for 30 min at
room temperature to quench the endogenous peroxidase activity, and
washed with distilled water for 5 min. For CD31 detection, antigen
retrieval was performed by heating sections with 0.01 mol/l citrate
buffer (pH 9.0) at 120°C for 15 min in a pressure cooker. For PD-L1
and vascular endothelial growth factor (VEGF) detection, antigen
retrieval was performed by heating sections with 0.01 mol/l citrate
buffer (pH 6.0) at 100°C for 3 min in a microwave. Following
antigen retrieval, the sections were blocked with 10% normal goat
serum (Vector Laboratories, Inc.) for 20 min at room temperature in
a humidified chamber. The sections were subsequently incubated with
the following primary antibodies at 4°C overnight: Anti-CD31
(mouse; 1:100; cat. no. CD31-607-L-CE; Leica Biosystems Nussloch
GmbH), anti-PD-L1 (rabbit; 1:500; cat. no. ab205921; Abcam) and
anti-VEGF (rabbit; 1:100; cat. no. ab183100; Abcam). Following
primary antibody incubation, the sections were incubated with a
secondary biotinylated antibody (cat. no. PK-6101, Vector
Laboratories, Inc.) using the avidin-biotin complex method. Color
development was performed by incubating the sections with 0.02%
Histofine® DAB substrate (Nichirei Biosciences, Inc.) at
room temperature prior to counterstaining with Mayer's hematoxylin.
Stained sections were visualized under an optical microscope at low
(×20) and high (×100 and ×200) magnification.
MVD quantification
MVD in vascular hotspots was quantified according to
the consensus guidelines for the use and interpretation of
angiogenesis assays and Weidner's method (15,16).
Vascular hotspots are defined as areas with a high concentration of
new, but inefficient blood vessels, which have sprouted from
existing vessels (15). Weidner's
method states that any positively stained individual endothelial
cell or endothelial cell cluster that is clearly separate from
adjacent microvessels, tumor cells and other connective tissue
elements, should be considered as a single, countable microvessel.
The presence of vessel lumens is not necessary for a structure to
be defined as a microvessel (15,16). The
cancer and stroma areas in the specimens were identified according
to specific morphological features, including color, texture and
contextual features (17), in
addition to observing respective H&E-stained slides. Slides
were first examined at a low magnification (×20) to scan the entire
stained tumor section and to identify vascular hotspots. Images of
five vascular hotspots were then acquired at ×200 magnification.
CD31-positive microvessels were counted in the five acquired
hotspot images and the mean MVD value, which has no units, was
determined. Only cells that were morphologically compatible with
the phenotype of endothelial cells based on their size and shape
were counted as microvessels, to avoid the inclusion of
macrophages. For each tumor, the MVD was defined as the number of
microvessels in a microscopic field of 0.67 mm2. The
samples were sorted into low and high MVD groups based on the
median MVD.
Assessment of PD-L1 expression
To semi-quantify PD-L1 expression, the slides were
first examined at a low magnification (×20). All areas in the
tissue section were observed to appropriately evaluate the
expression of PD-L1 on tumor cells. PD-L1 expression was scored
using the semi-quantitative tumor proportion score (TPS), which
uses a scale of 0–100% to define the percentage of tumor cells with
membranous and cytoplasmic PD-L1 expression. PD-L1 positivity was
predefined using a TPS cutoff of ≥1% and clinically relevant
cutoffs of ≥1 and ≥50% were used. Tumor-associated immune cells
(macrophages and lymphocytes) were not accounted for by using the
TPS. Based on the TPS, the samples were sorted into three groups:
Negative (<1%), low-positive (1-49%) and high-positive (50-100%)
PD-L1 expression.
Assessment of VEGF expression
To quantify VEGF expression, 5 fields were acquired
at ×200 magnification and 2 areas of 100 tumor cells were
quantified in each of the 5 fields. VEGF, expressed as a
percentage, was defined as the number of positively stained cells
to the total number of cells. The samples were sorted into low and
high VEGF expression groups based on the median VEGF
expression.
Statistical analysis
Statistical analyses were performed using SPSS v27.0
software (IBM Corp.). The correlation between DCE-MRI parameters
(CI-max, T-max, CI-gain and CI-peak) and MVD, PD-L1 and VEGF
expression were evaluated using Spearman's correlation coefficient
(r), which uses a scale from −1 to 1, where 1 implies a perfect
positive correlation and −1 indicates a perfect negative
correlation. Statistical differences between the DCE-MRI parameters
and MVD and PD-L1 expression levels were determined using a U-Mann
Whitney test or a Kruskal Wallis test followed by a Dunn's post hoc
test. P<0.05 was considered to indicate a statistically
significant difference.
Results
Patients' characteristics
A total of 21 patients with OSCC were analyzed in
the present study. The patients' characteristics, DCE-MRI
parameters and immunohistochemical findings are detailed in
Table I.
 | Table I.Clinicopathological characteristics,
DCE-MRI parameters and immunohistochemical findings of patients
with oral squamous cell carcinoma. |
Table I.
Clinicopathological characteristics,
DCE-MRI parameters and immunohistochemical findings of patients
with oral squamous cell carcinoma.
| Number | Age | Sex | Region | TNM | CI-max | T-max | CI-peak | CI-gain | MVD | VEGF | PD-L1 |
|---|
| 1 | 65 | M | Maxilla | T1N0M0 | 1.00 | 43.60 | 0.90 | 0.57 | 49.25 | 89.90 |
PD-L1+low |
| 2 | 58 | M | Tongue | T1N0M0 | 1.61 | 89.90 | 1.45 | 0.82 | 24.80 | 71.70 |
PD-L1+low |
| 3 | 68 | M | Mouth floor | T1N0M0 | 1.17 | 59.70 | 1.05 | 1.02 | 73.80 | 58.30 |
PD-L1+high |
| 4 | 55 | M | Tongue | T1N0M0 | 2.28 | 29.30 | 2.05 | 1.14 | 73.40 | 99.50 |
PD-L1+high |
| 5 | 77 | F | Mandibular | T2N0M0 | 1.04 | 87.20 | 0.93 | 0.59 | 42.00 | 93.80 |
PD-L1− |
| 6 | 65 | F | Mandibular | T2N0M0 | 1.33 | 87.20 | 1.20 | 0.49 | 32.00 | 97.00 |
PD-L1− |
| 7 | 34 | F | Tongue | T2N0M0 | 1.51 | 60.10 | 1.36 | 1.23 | 5.20 | 89.30 |
PD-L1− |
| 8 | 54 | M | Tongue | T2N0M0 | 1.29 | 75.00 | 1.16 | 0.80 | 29.40 | 46.90 |
PD-L1− |
| 9 | 70 | M | Tongue | T2N0M0 | 1.13 | 59.90 | 1.02 | 0.73 | 38.80 | 4.50 |
PD-L1− |
| 10 | 63 | M | Mouth floor | T2N0M0 | 0.81 | 45.00 | 0.73 | 0.55 | 22.40 | 14.80 |
PD-L1− |
| 11 | 53 | M | Tongue | T2N0M0 | 1.06 | 74.90 | 0.95 | 0.74 | 80.60 | 84.90 |
PD-L1− |
| 12 | 59 | M | Mouth floor | T2N0M0 | 1.19 | 89.80 | 1.07 | 0.80 | 31.40 | 15.80 |
PD-L1− |
| 13 | 71 | F | Tongue | T2N0M0 | 1.06 | 43.80 | 0.95 | 0.77 | 67.80 | 84.00 |
PD-L1+low |
| 14 | 41 | M | Tongue | T2N0M0 | 0.98 | 58.10 | 0.88 | 0.55 | 89.00 | 35.60 |
PD-L1+low |
| 15 | 68 | F | Mandibular | T2N0M0 | 1.16 | 44.90 | 1.05 | 1.17 | 56.80 | 75.10 |
PD-L1+low |
| 16 | 64 | M | Palate | T2N0M0 | 2.10 | 29.00 | 1.89 | 1.12 | 81.40 | 99.00 |
PD-L1+low |
| 17 | 87 | M | Buccal | T2N0M0 | 1.36 | 72.60 | 1.23 | 0.73 | 37.20 | 39.70 |
PD-L1+high |
| 18 | 66 | F | Buccal | T2N0M0 | 3.09 | 44.40 | 2.78 | 2.59 | 67.40 | 1.50 |
PD-L1+high |
| 19 | 72 | F | Mouth floor | T2N2bM0 | 2.62 | 29.20 | 2.36 | 2.42 | 71.00 | 4.70 |
PD-L1+high |
| 20 | 83 | F | Maxilla | T2N2bM0 | 2.13 | 135.10 | 1.92 | 1.28 | 86.40 | 91.40 |
PD-L1+high |
| 21 | 76 | F | Maxilla | T3N0M0 | 0.56 | 101.80 | 0.50 | 0.34 | 30.20 | 93.10 |
PD-L1− |
| Mean | 64 |
|
|
| 1.45 | 64.79 | 1.31 | 0.97 | 51.92 | 61.45 |
|
| SD | 13 |
|
|
| 0.64 | 27.26 | 0.57 | 0.57 | 24.65 | 34.97 |
|
| Median | 65 |
|
|
| 1.19 | 59.90 | 1.07 | 0.80 | 49.25 | 75.10 |
|
DCE-MRI findings
Amongst the OSCC samples, the mean CI-max was found
to be 1.45±0.64 (range, 0.56–3.09), which occurred at a mean T-max
of 65 sec. The mean CI-peak was recorded as 1.31±0.57 (range,
0.50–2.78) and the mean CI-gain was 0.97±0.57 (range, 0.34–2.59;
Table I).
Histopathological findings
CD31 staining was performed on all patient samples.
Representative images of low and high MVD staining patterns are
presented in Fig. 2. CD31-positive
microvessels were observed in the cancer stromal area. Microvessels
were either narrow without a lumen or rounded with a lumen. The
mean MVD was discovered to be 51.92±24.65 (range, 5.20–89.00). The
median MVD, which was used to divide the patient cohort into low
(n=10) and high (n=11) MVD groups, was 49.25 (Table I).
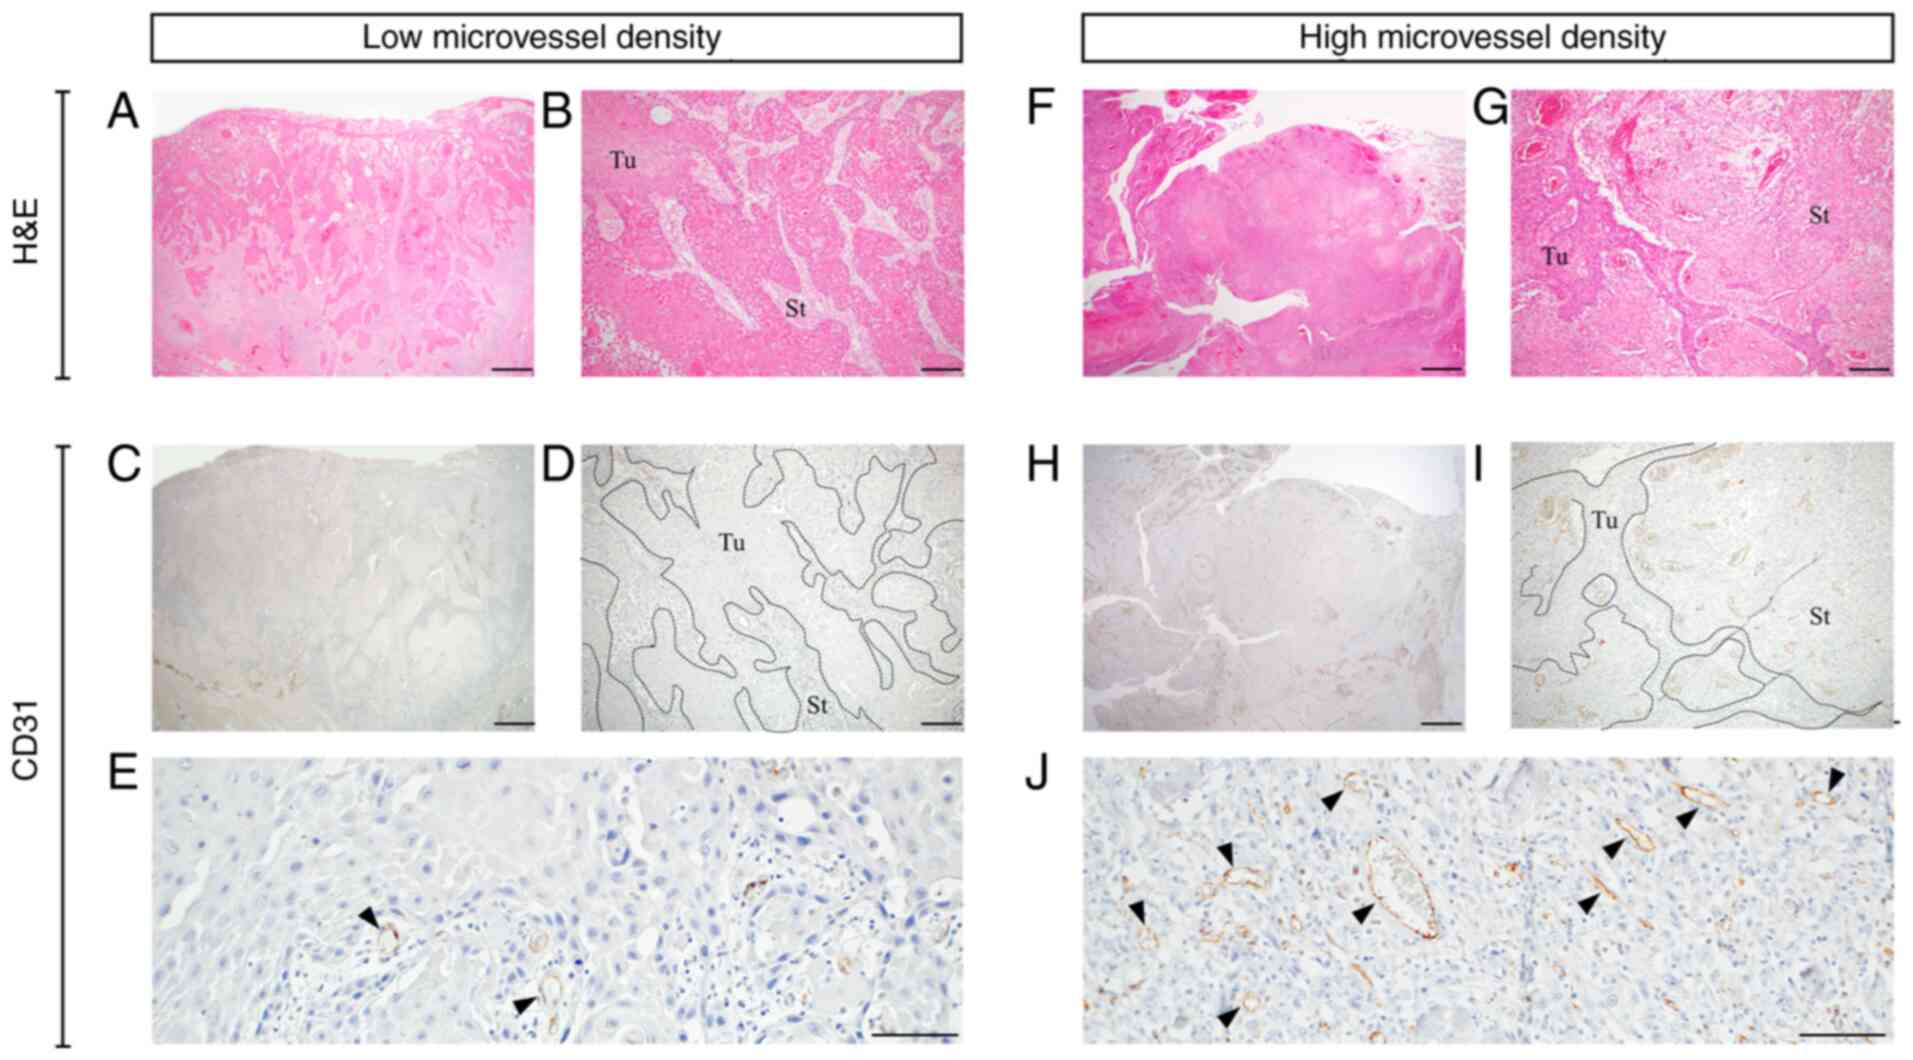 | Figure 2.Microvessel density in OSCC. (A-E)
Representative OSCC case with low microvessel density. (F-J)
Representative OSCC case with high microvessel density. (A, B, F
and G) H&E staining. (C, D, E, H, I and J) Immunohistochemistry
staining for CD31. The slides were examined at low and high
magnifications. Borders between Tu and St are shown using the
dotted lines. Arrowheads indicate CD31-positive microvessels. Scale
bar=1 mm in A, C, F and H. Scale bar=200 µm in B, D, G and I. Scale
bar=100 µm in E and J. OSCC, oral squamous cell carcinoma; Tu,
tumor; St, stroma; H&E, hematoxylin and eosin. |
According to the previously outlined criteria, the
patient cohort was divided into negative (n=9), low-positive (n=6)
and high-positive (n=6) PD-L1 expression groups. Representative
samples of negative, low-positive and high-positive PD-L1 staining
patterns are presented in Fig. 3.
The results demonstrated that PD-L1 was expressed in the membrane
and cytoplasm of cancer cells. In particular, PD-L1 expression was
higher in the cytoplasm of the high-positive PD-L1 expression group
compared with that in the other groups. The PD-L1 expression levels
in each patient are seen in Table
I.
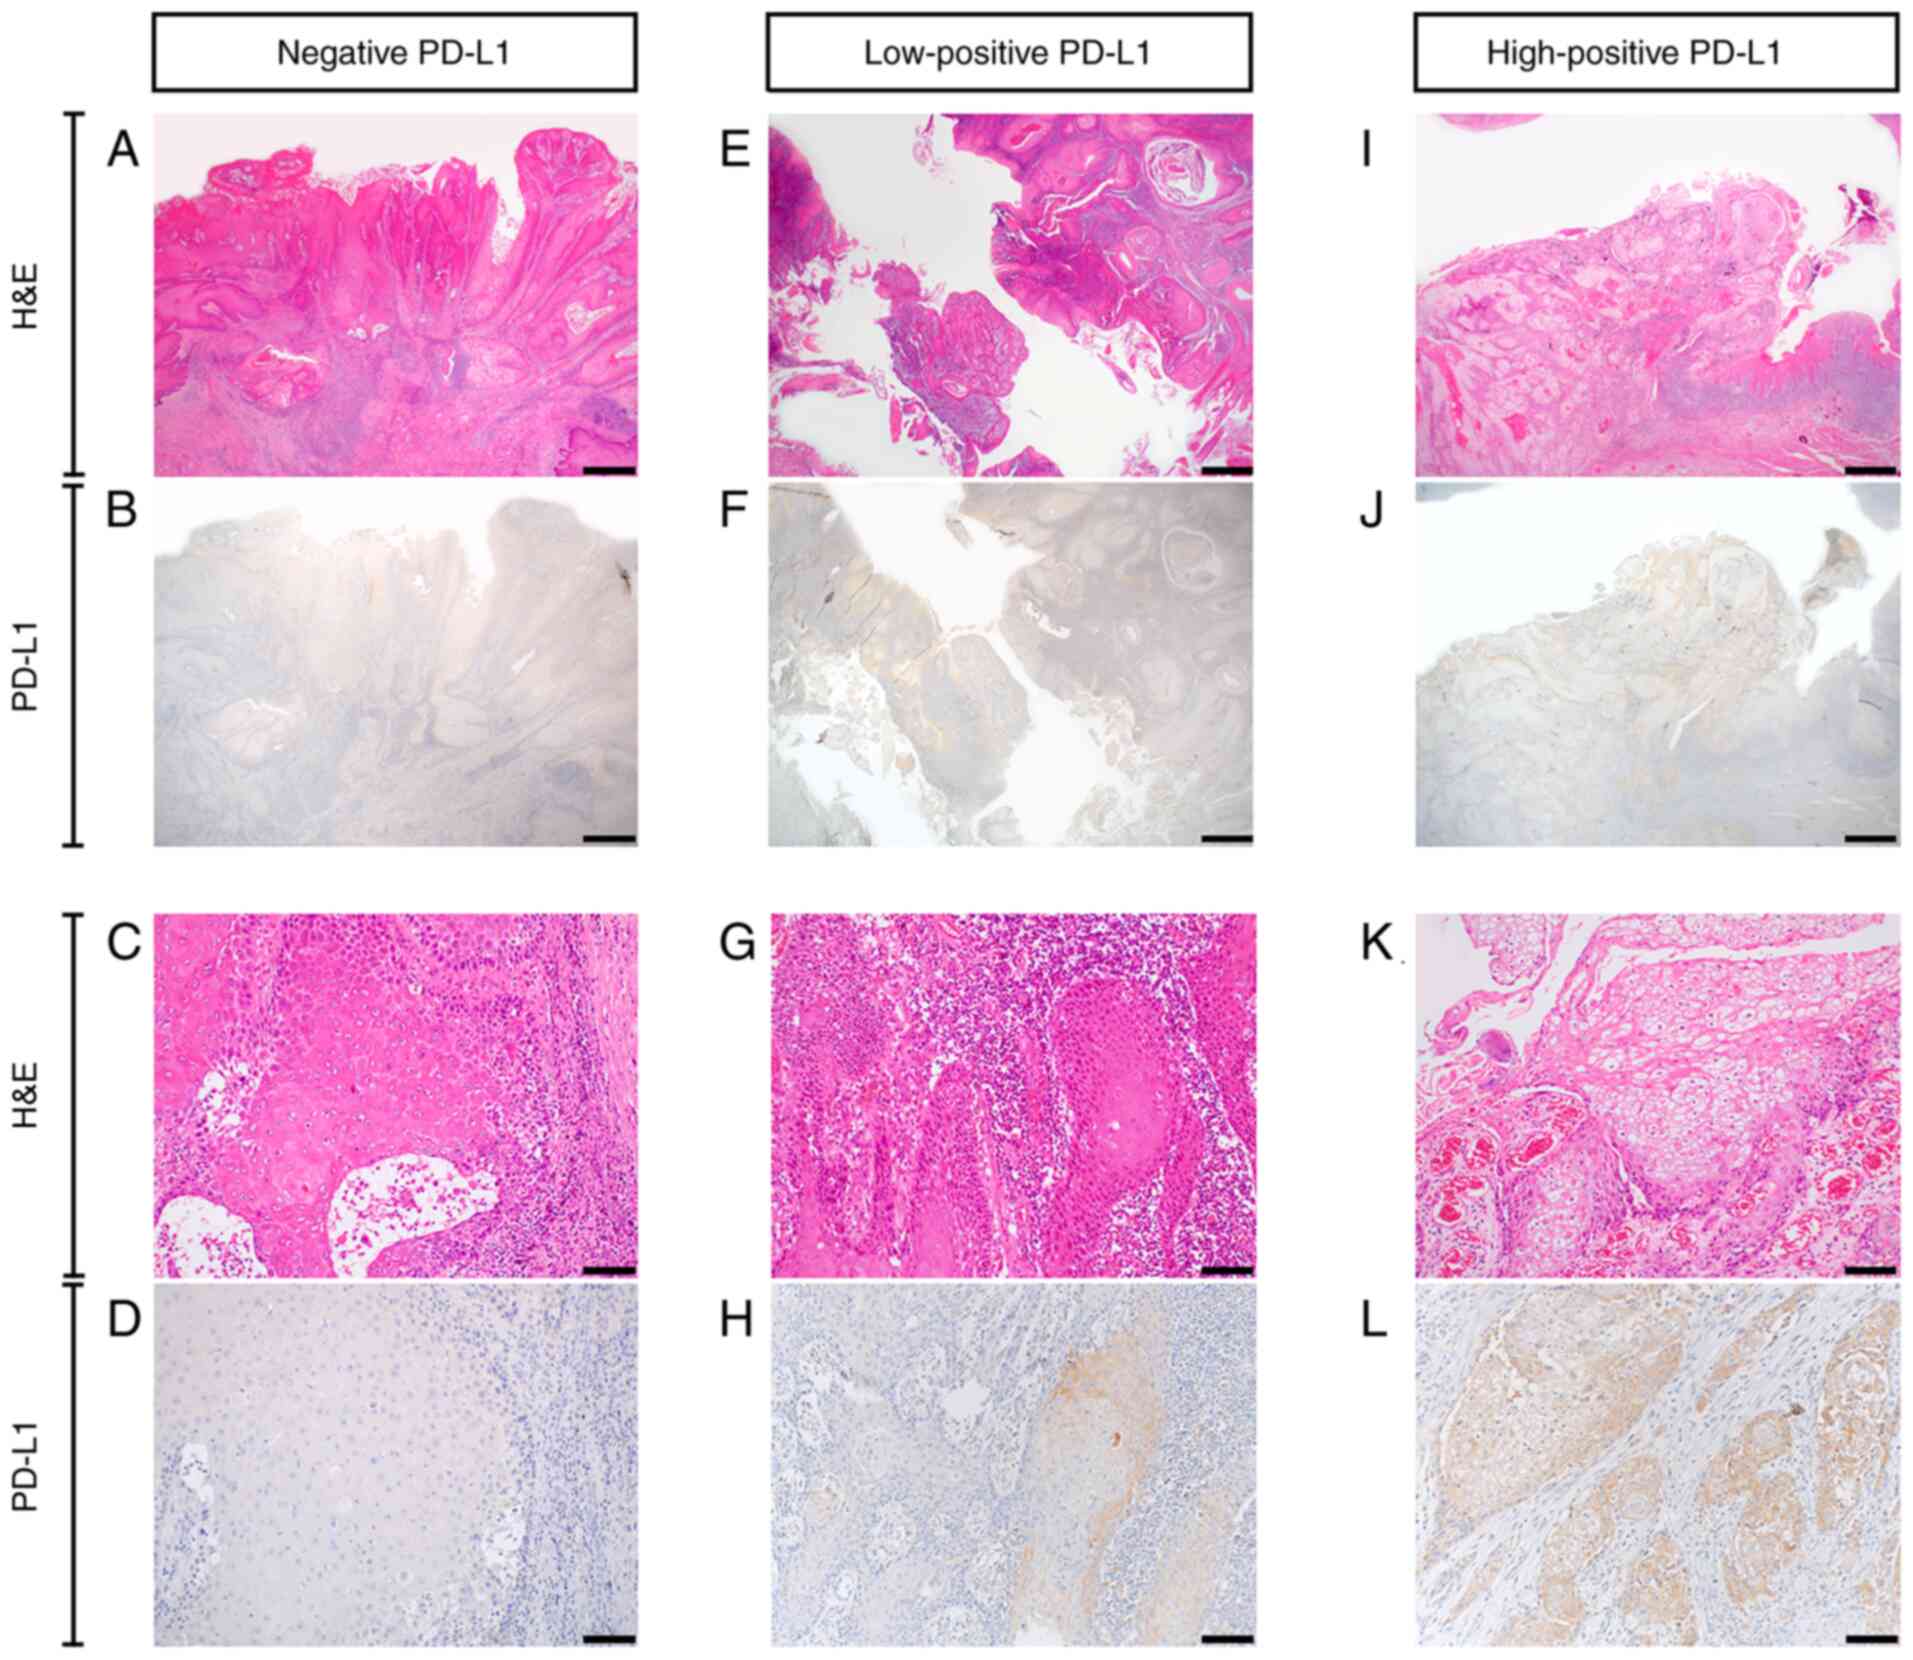 | Figure 3.PD-L1 expression in oral squamous
cell carcinoma. (A-D) Negative PD-L1 expression. (E-H) Low-positive
PD-L1 expression. (I-L) High-positive PD-L1 expression. (A, C, E,
G, I and K) H&E staining. (B, D, F, H, J and L)
Immunohistochemistry staining for PD-L1. Scale bar=1 mm in A, B, E,
F, I and J. Scale bar=100 µm in C, D, G, H, K and L. PD-L1,
programmed death ligand-1; H&E, hematoxylin and eosin. |
Analysis of DCE-MRI parameters and
histopathological findings
The correlations between the DCE-MRI parameters and
histopathological findings are shown in Table II. The MVD was found to be
negatively correlated with the T-max (r=−0.61; P=0.003) and
positively correlated with the CI-gain (r=0.46; P=0.037). PD-L1
expression was identified to be positively correlated with the
CI-max (r=0.57; P=0.007), CI-peak (r=0.57; P=0.007) and CI-gain
(r=0.58; P=0.006). PD-L1 expression was also discovered to be
positively correlated with MVD (r=0.66; P=0.001).
| Table II.Correlation between DCE-MRI
parameters and immunohistochemical findings. |
Table II.
Correlation between DCE-MRI
parameters and immunohistochemical findings.
| Variables | MVD (n=21) | PD-L1 (n=21) | VEGF (n=21) |
|---|
| DCE-MRI
parameters |
|
|
|
|
CI-max | 0.20 (P=0.373) | 0.57
(P=0.007)a | −0.11
(P=0.634) |
|
T-max | −0.61
(P=0.003)a | −0.42
(P=0.055) | −0.02
(P=0.946) |
|
CI-peak | 0.20 (P=0.373) | 0.57
(P=0.007)a | −0.11
(P=0.634) |
|
CI-gain | 0.46
(P=0.037)a | 0.58
(P=0.006)a | −0.05
(P=0.839) |
| IHC staining |
|
|
|
|
MVD | – | 0.66
(P=0.001)a | 0.24 (P=0.302) |
|
PD-L1 | 0.66
(P=0.001)a | – | −0.15
(P=0.513) |
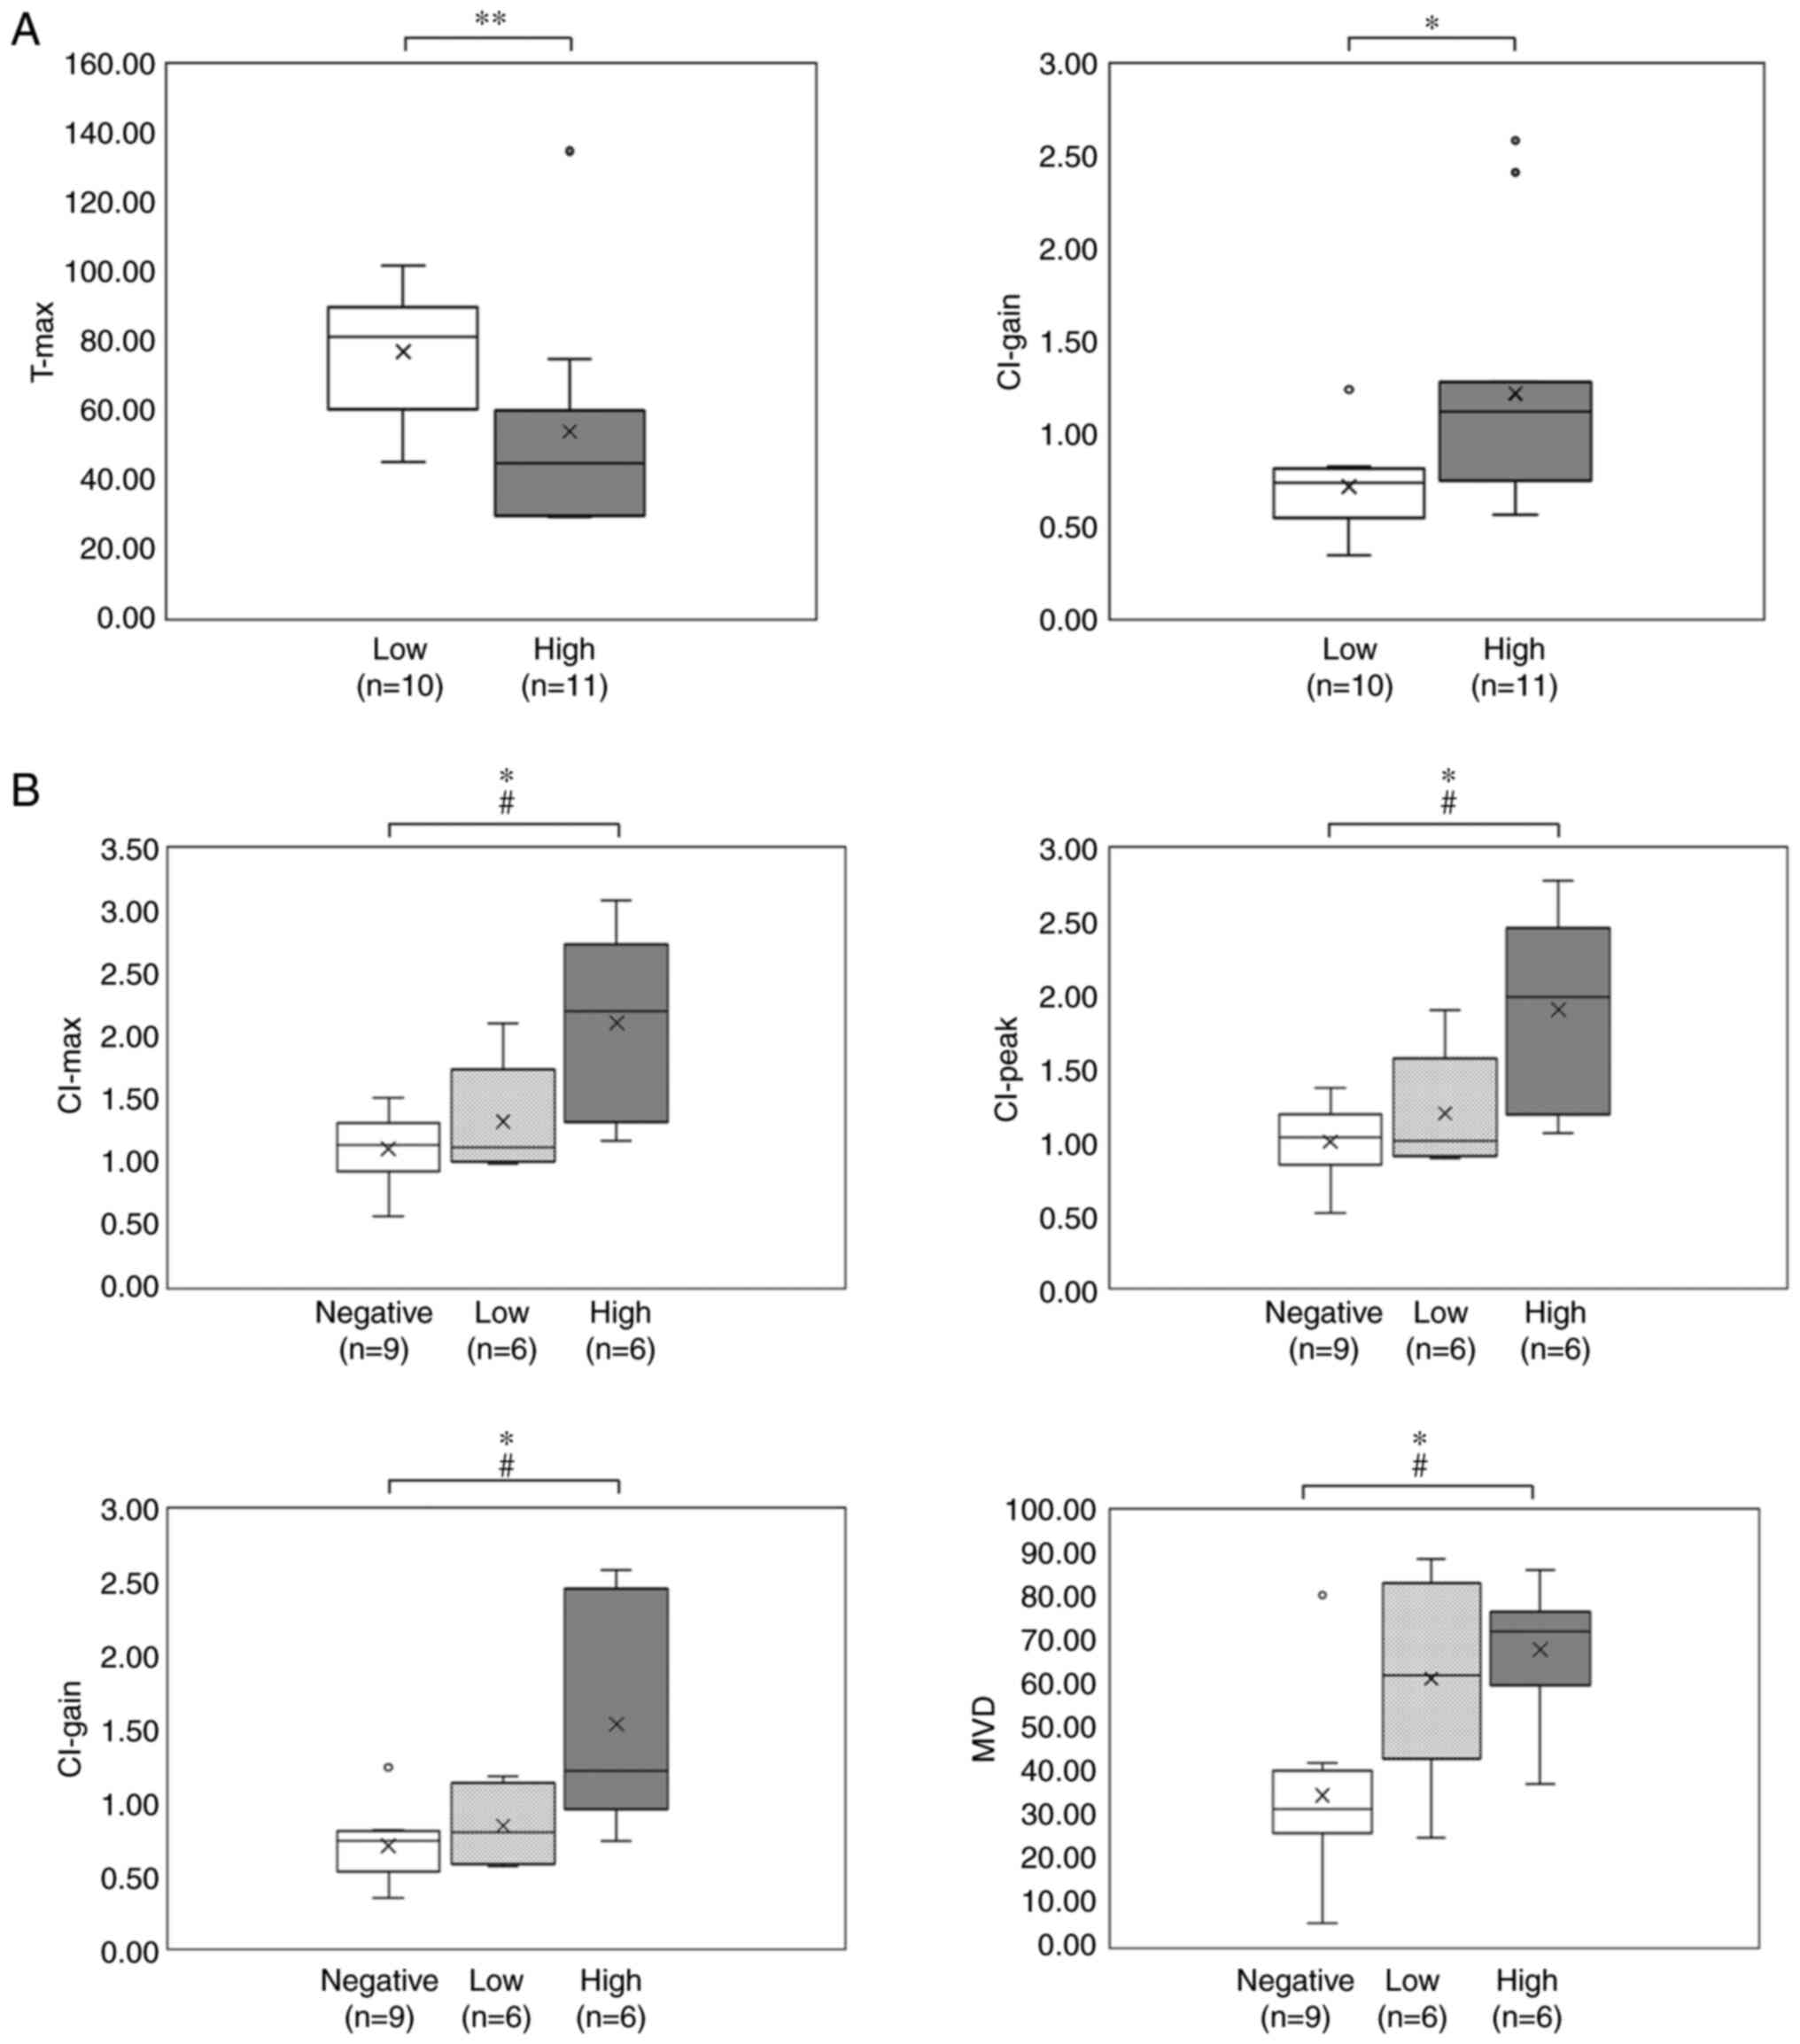
The DCE-MRI parameters according to the MVD levels
are shown in Table III and
Fig. 4A. Comparison of the DCE-MRI
parameters according to the MVD levels showed that the mean CI-max,
CI-peak and CI-gain were higher in the high MVD tumors, whereas the
T-max was longer in the low MVD tumors. The differences in the
CI-gain and T-max parameters between the two MVD groups were
statistically significant (P<0.05 and P<0.01,
respectively).
| Table III.DCE-MRI parameters and
immunohistochemical findings according to the microvessel density
and PD-L1 expression. |
Table III.
DCE-MRI parameters and
immunohistochemical findings according to the microvessel density
and PD-L1 expression.
| Variables | All patients
(n=21) | MVD, low
(n=10) | MVD, high
(n=11) |
P-valuea | PD-L1−,
(n=9) |
PD-L1+low, (n=6) |
PD-L1+high, (n=6) |
P-valueb |
|---|
| DCE-MRI
parameters |
|
|
|
|
|
|
|
|
|
CI-max | 1.45 | 1.18 | 1.70 | P=0.38 | 1.10 | 1.32 | 2.11 | P<0.05
(P<0.05c) |
|
T-max | 64.79 | 76.85 | 53.82 | P<0.01 | 75.66 | 51.55 | 61.72 | P=0.07 |
|
CI-peak | 1.31 | 1.06 | 1.53 | P=0.38 | 0.99 | 1.19 | 1.90 | P<0.05
(P<0.05c) |
|
CI-gain | 0.97 | 0.71 | 1.22 | P<0.05 | 0.70 | 0.83 | 1.53 | P<0.05
(P<0.05c) |
| IHC staining |
|
|
|
|
|
|
|
|
|
MVD | 51.92 | – | – |
| 34.67 | 61.51 | 68.20 | P<0.05
(P<0.05c) |
The DCE-MRI parameters and MVD according to the
PD-L1 expression levels are shown in Table III and Fig. 4B. Comparison of the DCE-MRI
parameters according to the PD-L1 expression levels showed that the
mean CI-max, CI-peak and CI-gain were highest in the tumors with
high-positive PD-L1 expression, whereas the mean T-max was longest
in the tumors with negative PD-L1 expression. The differences in
CI-max, CI-peak and CI-gain among the three PD-L1 expression level
groups were statistically significant (P<0.05), particularly
between the tumors with negative and high-positive PD-L1
expression. The mean MVD was also highest in the tumors with
high-positive PD-L1 expression, and differences in the mean MVD
between the three PD-L1 expression level groups were statistically
significant (P<0.05).
Analysis of VEGF expression
The median VEGF expression, which was used to divide
the patient cohort into low (n=10) and high (n=11) VEGF expression
groups, was 75.10 (Table I).
Representative samples of low and high VEGF staining patterns are
presented in Fig. S1. VEGF
expression was not significantly correlated with the DCE-MRI
parameters; CI-max (P=0.634), T-max (P=0.946), CI-peak (P=0.634)
and CI-gain (P=0.839). VEGF expression was also not significantly
correlated with MVD (P=0.302) and PD-L1 expression (P=0.513)
(Table II).
Tumor recurrence
The association between PD-L1 expression and tumor
recurrence was examined. Seventeen patients fulfilled the
requirement of 5-year follow-up. The high-positive PD-L1 expression
rate in patients with recurrence was 50%. The recurrence rate in
patients with high-positive PD-L1 expression was 80%. However, the
association was not statistically significant (P=0.165 via Fisher's
exact test) (Table SI).
Discussion
The present study aimed to investigate the
correlations between DCE-MRI parameters and histopathological
parameters in patients with OSCC. The results demonstrated
significant correlations among various DCE-MRI parameters, MVD and
PD-L1 expression.
The implementation of functional imaging modalities,
including DCE-MRI, in clinical practice has led to an increased
number of studies investigating the potential of these modalities
in the assessment of histopathological parameters. DCE-MRI reflects
tissue perfusion and vascularization and is presumed to be based on
tissue composition parameters, such as cellularity and vascular
density (18). Previous studies have
investigated the findings obtained from DCE-MRI in various types of
cancer; however, only a few studies have to date assessed the
correlation between DCE-MRI findings and the histopathological
parameters in HNSCC and OSCC in particular (9,18–20).
Surov et al (18,19) and
Jansen et al (20) evaluated
DCE-MRI perfusion and DCE-MRI histogram-based parameters in HNSCC.
The results identified correlations between DCE-MRI parameters and
histopathological findings reflecting VEGF and Ki-67 expression,
MVD, cellularity and nucleic content. The results from these
studies suggested that DCE-MRI may be used to assess
histopathological parameters in patients with HNSCC.
In the present study, quantitative DCE-MRI
parameters were derived from the SI and CI curves. Previous studies
have reported the value of these SI- and CI-based parameters in the
identification of oral lesion characteristics, which can contribute
to the diagnosis of oral lesions (21–25). In
a previous study evaluating quantitative DCE-MRI CI-based
parameters in patients with OSCC, Unetsubo et al (9) suggested that DCE-MRI may be useful for
the assessment of MVD, as a significant correlation was identified
between CI-gain and MVD. It is important to note that the present
study was conducted using 3T MRI and analyzed CD31 expression via
IHC, whereas Unetsubo et al (9) used 1.5T MRI and analyzed CD34
expression.
To interpret the MVD findings from the present
study, the study population was categorized into low and high MVD
groups based on the median MVD value. The results revealed that MVD
was negatively correlated with the T-max and positively correlated
with the CI-gain. These paradoxical observations in the
correlations could be explained by the nature of the CI-curve. For
instance, the correlation between the high MVD and short T-max
suggests that in the presence of high blood flow, the contrast
agent is rapidly circulated through the blood and absorbed;
therefore, the time at which the contrast enhancement reaches its
maximum amplitude is short. Conversely, the positive correlation
between the high MVD and high CI-gain indicates that in the
presence of high blood flow, the gradient on the upslope phase of
the enhancement curve is high. Furthermore, the findings from the
present study supported the hypothesis that DCE-MRI may be used to
assess MVD and be able to distinguish tumors with low and high
levels of angiogenesis (18). In
fact, the comparison of MRI parameters according to the MVD
revealed that the mean CI-gain was significantly increased, while
the mean T-max was significantly shorter in high-MVD tumors,
suggesting that tumors with high levels of angiogenesis exhibit a
higher and faster uptake of the contrast agent. These findings were
consistent with a previous study reporting that intratumor
angiogenesis can influence the enhanced patterns on the DCE-MRI
scan (9). DCE-MRI may therefore
represent a promising non-invasive method for assessing
angiogenesis in patients with OSCC.
The present study also evaluated VEGF expression.
The correlations between DCE-MRI parameters and VEGF expression
were found to be not statistically significant. The correlation
between MVD and VEGF expression was also found to be not
statistically significant, although MVD and VEGF expression
exhibited similar tendency. Well-defined markers of angiogenesis
include microvessels stained with CD31 and VEGF (26). However, more than one factor is
required to suggest an angiogenic response. Vessel maturation is a
crucial factor for angiogenesis regulation (27). An indicative of vessel maturation is
the presence of pericytes and of smooth muscle cells stained by
α-smooth muscle actin (α-SMA) (27,28).
VEGF is a positive regulator of pericyte function that has a
potential role in the maintenance of mature blood vessels (28,29).
However, CD31 is expressed in both mature and immature blood
vessels (28). These differences in
expression between angiogenesis markers may explain the differences
observed in correlations with DCE-MRI parameters. Thus, a more
thorough study may be required to further clarify the association
between DCE-MRI and angiogenesis using different markers (CD31,
VEGF and α-SMA).
Highly promising immunotherapies have recently
emerged, of which the most prominent subtype is ICIs that target
the PD-1/PD-L1 signaling pathway. The binding of PD-1 to its major
ligands, PD-L1 and PD-L2, releases inhibitory cytokines that
inhibit T-cell activation and proliferation (8,30).
PD-1/PD-L1-targeting ICIs disrupt this interaction and allow for
immune system recognition, activation and destruction of tumor
cells (8).
The first immunotherapy approved for use in HNSCC
was granted in 2016. Several ICIs have since been trialed, of which
the two most extensively studied are pembrolizumab and nivolumab,
which were found to induce considerable and durable responses
(1). PD-L1 expression is often used
as a prognostic and predictive marker of the response to PD-1/PD-L1
ICIs. Previous evidence has shown that PD-L1 positivity is
associated with clinical benefits and improved responses and
outcomes (8). Furthermore,
high-positive PD-L1 expression is a poor prognostic marker in OSCC
(30). Due to the reported
correlations between DCE-MRI parameters and MVD and between PD-L1
and MVD (9,11), the present study investigated the
potential correlations between DCE-MRI parameters and PD-L1
expression.
A previous study reported that PD-L1 expression is
upregulated in 18–96% of OSCC cases (5). This high variability in expression is
due to numerous factors, such as intratumor and intertumor
heterogeneity, differences in study populations and differences in
methodology (including different assays used for determining PD-L1
expression, different scoring systems and different cutoff values
for positive expression) (4,8). As the TPS reflects PD-L1 expression on
cancer cells themselves, but not that of immune cells, this scoring
method was used in the present study, with a TPS of 1% selected as
the positivity cutoff value. Using these parameters, the present
study demonstrated that PD-L1 was upregulated in 57.1% of OSCC
cases.
In a recent preliminary study, Meyer et al
(31) investigated the correlation
between DCE-MRI histogram-based parameters and PD-L1 expression.
The results identified some correlations between the histogram
parameters, the immune cell score and the combined cell score, but
not with the TPS (31). However, by
using DCE-MRI SI- and CI-based parameters, the present study
identified correlations with PD-L1 expression using the TPS. The
CI-max, CI-peak and CI-gain were found to be positively correlated
with PD-L1 expression. These findings suggested that the high and
rapid uptake of the contrast agent may reflect the high levels of
PD-L1 expression, thus confirming the hypothesis that PD-L1
expression may be actually reflected in the CI curve.
To further understand the correlations between
DCE-MRI parameters and PD-L1 expression, the present study analyzed
the DCE-MRI parameters in three different PD-L1 expression groups.
The tumors with high-positive PD-L1 expression showed the highest
mean CI-max, CI-peak and CI-gain, whereas tumors with negative
PD-L1 expression showed the longest T-max. These findings suggested
that a higher number of tumor cells expressing PD-L1 may increase
the likelihood of the CI curve to show a high and rapid uptake
pattern. In particular, significant differences in these parameters
were found between the tumors with negative and high-positive PD-L1
expression. These findings indicated that DCE-MRI SI- and CI-based
parameters may be useful for distinguishing tumors with negative
PD-L1 expression from tumors with high-positive PD-L1 expression.
In addition, the results from the present study revealed that MVD
and PD-L1 expression were strongly positively correlated in OSCC.
Similar to the DCE-MRI findings, tumors with high-positive PD-L1
expression showed the highest mean MVD among the three expression
level groups. Current evidence of the association between PD-L1
expression and MVD has not been well documented and previous
reports have produced conflicting results. For example, Yugawa
et al (32) demonstrated the
absence of correlation between MVD and PD-L1 expression in cancer
cells using a positivity cutoff of 1%. Franz et al (33) reported that PD-L1 expression using
the combined positive score is negatively correlated with MVD in
patients with laryngeal carcinoma. However, Koh et al
(11) demonstrated that
PD-L1-positive tumors are positively correlated with
hypoxia-inducible factors signaling pathway including MVD in
patients with classical Hodgkin lymphoma. The present study
reported similar findings to the latter, indicating that tumors
with high levels of angiogenesis may tend to contain a higher
number of tumor cells expressing PD-L1. The detailed mechanism
underlying the interaction between angiogenesis and PD-1/PD-L1
signaling pathways should therefore be further investigated in
future studies.
The results from the present study were consistent
with the findings from previous studies demonstrating that DCE-MRI
might be able to predict the response to anti-angiogenic therapy
(18). Furthermore, the present
findings indicated that using DCE-MRI to identify tumors with
high-positive PD-L1 expression (which seemingly have a more
favorable response to ICIs) may predict the therapeutic effect and
outcome of such immunotherapies. DCE-MRI may also help improving
patient selection by identifying patients who are most likely to
benefit from the treatment.
The results from the present study were preliminary
and further studies should be performed on larger patient
populations to validate these findings. Furthermore, configuration
of the ROI for T4 tumors has proven to be difficult. Therefore,
DCE-MRI assessment of PD-L1 expression may only be beneficial for
T1, T2 and T3 tumors according to the TNM classification. Finally,
although PD-L1 has shown clinical value as a biomarker, it does not
fully predict the response to ICIs. Thus, the assessment of PD-L1
expression using DCE-MRI should solely be performed as an
adjunctive examination.
In summary, the findings from the present study
indicated that the CI parameters derived from DCE-MRI may be
associated with PD-L1 expression on tumor cells. A high and rapid
uptake pattern of the CI curve was found to be significantly
correlated with high-positive PD-L1 expression. Therefore, these
findings suggested that DCE-MRI may be considered as a valuable
non-invasive method for assessing PD-L1 expression and the
therapeutic efficacy of ICIs in patients with OSCC.
Supplementary Material
Supporting Data
Acknowledgements
The authors would like to thank Dr Angela Morben for
editing a draft of this manuscript.
Funding
The present study was supported by a JSPS
Grant-in-Aid for Young Scientists (grant no. JP 18K17169). The
funding source had no role in the study design, analysis, writing
or submission of the data.
Availability of data and materials
The datasets used and/or analyzed during the current
study are available from the corresponding author on reasonable
request.
Authors' contributions
NT, MF, JIA, YY, TK and MH conceived the idea for
the study. NT, MF, TO and HK designed the study. NT, MF, HK, MWO,
SO and YT performed the experiments. NT, MF, TO and HK were
responsible for the quality control of data and algorithms. NT, MF,
TO, HK and MB analyzed and interpreted the data. NT, MF and TO
performed the statistical analysis. MF and HK confirmed the
authenticity of all the raw data. NT, SO, YT and MB wrote the
initial draft of the manuscript. MF, TO and HK edited the
manuscript. JIA, HN, TK and MH reviewed the manuscript. All authors
have read and approved the final manuscript.
Ethics approval and consent to
participate
The study protocol was approved by the institutional
review board of Okayama University Graduate School of Medicine,
Dentistry and Pharmaceutical Sciences, Okayama University Hospital,
Ethics Committee (approval no. 1807-008).
Patient consent for publication
Not applicable.
Competing interests
The authors declare that they have no competing
interests.
References
|
1
|
Bauml JM, Aggarwal C and Cohen RB:
Immunotherapy for head and neck cancer: Where are we now and where
are we going? Ann Transl Med. 7 (Suppl 7):S752019. View Article : Google Scholar : PubMed/NCBI
|
|
2
|
Twomey JD and Zhang B: Cancer
immunotherapy update: FDA-approved checkpoint inhibitors and
companion diagnostics. AAPS J. 23:392021. View Article : Google Scholar : PubMed/NCBI
|
|
3
|
Samra B, Tam E, Baseri B and Shapira I:
Checkpoint inhibitors in head and neck cancer: Current knowledge
and perspectives. J Investig Med. 66:1023–1030. 2018. View Article : Google Scholar : PubMed/NCBI
|
|
4
|
Cohen EEW, Bell RB, Bifulco CB, Burtness
B, Gillison ML, Harrington KJ, Le QT, Lee NY, Leidner R, Lewis RL,
et al: The society for immunotherapy of cancer consensus statement
on immunotherapy for the treatment of squamous cell carcinoma of
the head and neck (HNSCC). J Immunother Cancer. 7:1842019.
View Article : Google Scholar : PubMed/NCBI
|
|
5
|
Lenouvel D, González-Moles MÁ, Talbaoui A,
Ramos-García P, González-Ruiz L, Ruiz-Ávila I and Gil-Montoya JA:
An update of knowledge on PD-L1 in head and neck cancers:
Physiologic, prognostic and therapeutic perspectives. Oral Dis.
26:511–526. 2020. View Article : Google Scholar : PubMed/NCBI
|
|
6
|
De Vicente JC, Rodríguez-Santamarta T,
Rodrigo JP, Blanco-Lorenzo V, Allonca E and García-Pedrero JM:
PD-L1 expression in tumor cells is an independent unfavorable
prognostic factor in oral squamous cell carcinoma. Cancer Epidemiol
Biomarkers Prev. 28:546–554. 2019. View Article : Google Scholar : PubMed/NCBI
|
|
7
|
Forster MD and Devlin MJ: Immune
checkpoint inhibition in head and neck cancer. Front Oncol.
8:3102018. View Article : Google Scholar : PubMed/NCBI
|
|
8
|
McCusker MG, Orkoulas-Razis D and Mehra R:
Potential of pembrolizumab in metastatic or recurrent head and neck
cancer: Evidence to date. Onco Targets Ther. 13:3047–3059. 2020.
View Article : Google Scholar : PubMed/NCBI
|
|
9
|
Unetsubo T, Konouchi H, Yanagi Y, Murakami
J, Fujii M, Matsuzaki H, Hisatomi M, Nagatsuka H and Asaumi JI:
Dynamic contrast-enhanced magnetic resonance imaging for estimating
tumor proliferation and microvessel density of oral squamous cell
carcinomas. Oral Oncol. 45:621–626. 2009. View Article : Google Scholar : PubMed/NCBI
|
|
10
|
Pałasz P, Adamski Ł, Górska-Chrząstek M,
Starzyńska A and Studniarek M: Contemporary diagnostic imaging of
oral squamous cell carcinoma-A review of literature. Pol J Radiol.
82:193–202. 2017. View Article : Google Scholar : PubMed/NCBI
|
|
11
|
Koh YW, Han JH, Yoon DH, Suh C and Huh J:
PD-L1 expression correlates with VEGF and microvessel density in
patients with uniformly treated classical Hodgkin lymphoma. Ann
Hematol. 96:1883–1890. 2017. View Article : Google Scholar : PubMed/NCBI
|
|
12
|
Szafarowski T, Sierdzinski J, Szczepanski
MJ, Whiteside TL, Ludwig N and Krzeski A: Microvessel density in
head and neck squamous cell carcinoma. Eur Arch Otorhinolaryngol.
275:1845–1851. 2018. View Article : Google Scholar : PubMed/NCBI
|
|
13
|
Brierley JD, Gospodarowicz MK and
Wittekind CH: TNM Classification of Malignant Tumours, 8th Edition.
Oxford, UK; Hoboken, NJ: John Wiley & Sons, Inc.; 2017
|
|
14
|
Takabatake K, Tsujigiwa H, Nakano K, Inada
Y, Qiusheng S, Kawai H, Sukegawa S, Fushimi S and Nagatsuka H:
Geometrical structure of honeycomb TCP to control dental
pulp-derived cell differentiation. Materials (Basel). 13:51552020.
View Article : Google Scholar : PubMed/NCBI
|
|
15
|
Nowak-Sliwinska P, Alitalo K, Allen E,
Anisimov A, Aplin AC, Auerbach R, Augustin HG, Bates DO, van
Beijnum JR, Bender RHF, et al: Consensus guidelines for the use and
interpretation of angiogenesis assays. Angiogenesis. 21:425–532.
2018. View Article : Google Scholar : PubMed/NCBI
|
|
16
|
Weidner N, Semple JP, Welch WR and Folkman
J: Tumor angiogenesis and metastasis-correlation in invasive breast
carcinoma. N Engl J Med. 324:1–8. 1991. View Article : Google Scholar : PubMed/NCBI
|
|
17
|
Fang L, He Y, Liu Y, Ding H, Tong Y, Hu L,
Wang C, Zhang Y, Zheng X and Huang P: Adjustment of microvessel
area by stromal area to improve survival prediction in non small
cell lung cancer. J Cancer. 10:3397–3406. 2019. View Article : Google Scholar : PubMed/NCBI
|
|
18
|
Surov A, Meyer HJ, Gawlitza M, Höhn AK,
Boehm A, Kahn T and Stumpp P: Correlations between DCE MRI and
histopathological parameters in head and neck squamous cell
carcinoma. Transl Oncol. 10:17–21. 2017. View Article : Google Scholar : PubMed/NCBI
|
|
19
|
Surov A, Meyer HJ, Leifels L, Höhn AK,
Richter C and Winter K: Histogram analysis parameters of dynamic
contrast-enhanced magnetic resonance imaging can predict
histopathological findings including proliferation potential,
cellularity, and nucleic areas in head and neck squamous cell
carcinoma. Oncotarget. 9:21070–21077. 2018. View Article : Google Scholar : PubMed/NCBI
|
|
20
|
Jansen JFA, Carlson DL, Lu Y, Stambuk HE,
Moreira AL, Singh B, Patel SG, Kraus DH, Wong RJ, Shaha AR, et al:
Correlation of a priori DCE-MRI and 1H-MRS data with molecular
markers in neck nodal metastases: Initial analysis. Oral Oncol.
48:717–722. 2012. View Article : Google Scholar : PubMed/NCBI
|
|
21
|
Asaumi J, Yanagi Y, Konouchi H, Hisatomi
M, Matsuzaki H and Kishi K: Application of dynamic
contrast-enhanced MRI to differentiate malignant lymphoma from
squamous cell carcinoma in the head and neck. Oral Oncol.
40:579–584. 2004. View Article : Google Scholar : PubMed/NCBI
|
|
22
|
Yanagi Y, Asaumi JI, Unetsubo T, Ashida M,
Takenobu T, Hisatomi M, Matsuzaki H, Konouchi H, Katase N and
Nagatsuka H: Usefulness of MRI and dynamic contrast-enhanced MRI
for differential diagnosis of simple bone cysts from true cysts in
the jaw. Oral Surg Oral Med Oral Pathol Oral Radiol Endod.
110:364–369. 2010. View Article : Google Scholar : PubMed/NCBI
|
|
23
|
Hisatomi M, Yanagi Y, Konouchi H,
Matsuzaki H, Takenobu T, Unetsubo T and Asaumi JI: Diagnostic value
of dynamic contrast-enhanced MRI for unilocular cystic-type
ameloblastomas with homogeneously bright high signal intensity on
T2-weighted or STIR MR images. Oral Oncol. 47:147–152. 2011.
View Article : Google Scholar : PubMed/NCBI
|
|
24
|
Matsuzaki H, Hara M, Yanagi Y, Asaumi JI,
Katase N, Unetsubo T, Hisatomi M, Konouchi H, Takenobu T and
Nagatsuka H: Magnetic resonance imaging (MRI) and dynamic MRI
evaluation of extranodal non-Hodgkin lymphoma in oral and
maxillofacial regions. Oral Surg Oral Med Oral Pathol Oral Radiol.
113:126–133. 2012. View Article : Google Scholar : PubMed/NCBI
|
|
25
|
Fujita M, Matsuzaki H, Yanagi Y, Hara M,
Katase N, Hisatomi M, Unetsubo T, Konouchi H, Nagatsuka H and
Asaumi JI: Diagnostic value of MRI for odontogenic tumours.
Dentomaxillofac Radiol. 42:201202652013. View Article : Google Scholar : PubMed/NCBI
|
|
26
|
Schlüter A, Weller P, Kanaan O, Nel I,
Heusgen L, Höing B, Haßkamp P, Zander S, Mandapathil M, Dominas N,
et al: CD31 and VEGF are prognostic biomarkers in early-stage, but
not in late-stage, laryngeal squamous cell carcinoma. BMC Cancer.
18:2722018. View Article : Google Scholar : PubMed/NCBI
|
|
27
|
Tonino P and Abreu C: Microvessel density
is associated with VEGF and α-SMA expression in different regions
of human gastrointestinal carcinomas. Cancers (Basel). 3:3405–3418.
2011. View Article : Google Scholar : PubMed/NCBI
|
|
28
|
Usuda K, Iwai S, Funasaki A, Sekimura A,
Motono N, Ueda Y, Shimazaki M and Uramoto H: Expression and
prognostic impact of VEGF, CD31 and αSMA in resected primary lung
cancers. Anticancer Res. 38:4057–4063. 2018. View Article : Google Scholar : PubMed/NCBI
|
|
29
|
dela Paz NG, Walshe TE, Leach LL,
Saint-Geniez M and D'Amore PA: Role of shear-stress-induced VEGF
expression in endothelial cell survival. J Cell Sci. 125:831–843.
2012. View Article : Google Scholar : PubMed/NCBI
|
|
30
|
He J, Chen XF, Xu MG and Zhao J:
Relationship of programmed death ligand-1 expression with
clinicopathological features and prognosis in patients with oral
squamous cell carcinoma: A meta-analysis. Arch Oral Biol.
114:1047172020. View Article : Google Scholar : PubMed/NCBI
|
|
31
|
Meyer HJ, Höhn AK and Surov A:
Associations between histogram analysis parameters derived from
dynamic-contrast enhanced MRI and PD L1-expression in head and neck
squamous cell carcinomas. A preliminary study. Magn Reson Imaging.
72:117–121. 2020. View Article : Google Scholar : PubMed/NCBI
|
|
32
|
Yugawa K, Itoh S, Yoshizumi T, Iseda N,
Tomiyama T, Toshima T, Harada N, Kohashi K, Oda Y and Mori M:
Prognostic impact of tumor microvessels in intrahepatic
cholangiocarcinoma: Association with tumor-infiltrating
lymphocytes. Mod Pathol. 34:798–807. 2021. View Article : Google Scholar : PubMed/NCBI
|
|
33
|
Franz L, Alessandrini L, Calvanese L,
Crosetta G, Frigo AC and Marioni G: Angiogenesis, programmed death
ligand 1 (PD-L1) and immune microenvironment association in
laryngeal carcinoma. Pathology. May 13–2021.(Epub ahead of print).
View Article : Google Scholar : PubMed/NCBI
|