Introduction
Ovarian cancer (OC) is the most common and fatal
gynecological malignancy worldwide with most of patients diagnosed
in locally advanced stage due to lack of symptoms (1). Surgery along with platinum-based
chemotherapy is the standard treatment recommended by International
Guidelines for patients with advanced stage OC. However, 5-year
survival is only about 30-40% in most countries (2). Indeed, while OC is considered a
platinum-sensitive tumor with significant and prolonged responses
to platinum-based chemotherapy, the occurrence of platinum
resistance represents a critical step in OC progression, being the
prognosis of platinum-resistant OC extremely unfavorable. Thus, the
identification of molecular mechanisms of platinum resistance onset
and novel reliable therapeutic targets are needed to improve the OC
clinical outcome.
Insulin-like growth factor binding proteins (IGFBPs)
are a family of secreted proteins originally characterized as
passive high-affinity carriers of two Insulin-like Growth Factors
(IGFI and II) in the circulation, composed of 7 members (IGFBP1, 2,
3, 4, 5, 6, 7) (3). Apart from
functions within the IGF system, they play various roles in the
extracellular and intracellular compartment to modulate cell
proliferation and apoptosis and survival (4).
The relationships between IGFBPs and cancer is
sometimes contradictory and divergent, according to different tumor
types (5). Their role has been
investigated in many cancers, which may be especially relevant
since IGF-II is frequently an autocrine cancer growth factor
(6). In most studies, IGFBP6
expression was lower in malignant than in normal cells, consistent
with the idea that it may act as an inhibitor of tumorigenic
pathways, including those driven by an excess of IGF-II activity.
However, few studies showed IGFBP6 upregulation in cancer cells,
which may represent a compensatory response to increased IGF-II
activity or may reflect IGF-independent actions. IGFBP6 was
detected in 38 of 41 OCs (7), and
a microarray study showed that IGFBP6 mRNA levels were lower in OC
than in non-cancerous tissue (8).
Consistently, IGFBP6 plasma levels have been found downregulated in
patients with OC compared to those without cancer. In a biological
perspective, recent findings suggest that IGFBP6 may have opposing
effects on the migration of two OC cell lines, this further
supporting heterogeneous responsiveness of OC cells to IGFBP6
(9). Furthermore, several findings
suggest that the IGFs/IGFBPs axis is involved in modulating drug
sensitivity in cancer cells (10)
and, specifically, IGFPB6 is responsible for the proliferation of
chemoresistant tumor cells is human glioblastoma (11).
Based on this evidence, our study evaluated the role
of IGFBP6 in two matched cell lines of high-grade serous OC (HGSOC)
obtained from the same patient before and after the development of
clinical platinum resistance (PEA1 and PEA2 cells, respectively)
(12). A comparative gene
expression profiling of these cell lines was performed to evaluate,
at molecular level, the differential response of OC cell lines to
IGFBP6 in two different contexts of OC progression, before and
after the onset of platinum resistance.
Materials and methods
Cell lines, chemicals
The human ovarian adenocarcinoma cell lines PEA1 and
PEA2 were purchased from European Collection of Authenticated Cell
Cultures (ECACC). PEA1 and PEA2 cells were derived from a malignant
effusion from the peritoneal ascites of the same patient with a
HGSOC. PEA1 cell line was collected prior to treatment with
cisplatin and prednimustine; PEA2 were collected on relapse after
the treatment (12). Both cell
lines were cultured in RPMI 1640 medium (Gibco; Thermo Fisher
Scientific, Inc.) supplemented with 10% fetal bovine serum (FBS)
(Gibco; Thermo Fisher Scientific, Inc.), 1% glutamine (Gibco;
Thermo Fisher Scientific, Inc.) and 1% Pen-Strep (Gibco; Thermo
Fisher Scientific, Inc.) and grown at 37°C in a 5% CO2
atmosphere (12). In order to
study IGFBP6 signaling, PEA1 and PEA2 cells were cultured overnight
in serum-free RPMI 1640 medium and subsequently incubated with
IGFBP6 recombinant protein (Recombinant Human IGFBP6, Peprotech,
Cat. No: 350-07B) at a final concentration of 1 µg/ml.
Immunoblot analysis
Total cell lysates were obtained by homogenization
of cell pellets in cold lysis buffer [20 mmol/l Tris (pH 7.5)
containing 300 mmol/l sucrose, 60 mmol/l KC1, 15 mmol/l NaC1, 5%
(v/v) glycerol, 2 mmol/l EDTA, 1% (v/v) Triton X100, 1 mmol/l
phenylmethylsulfonylfluoride, 2 mg/ml aprotinin, 2 mg/ml leupeptin,
and 0.2% (w/v) deoxycholate] for 30 min on ice and centrifuged at
12,000 rpm for 30 min. Protein concentration was quantified using
the Bio-Rad protein assay kit (Bio-Rad Laboratories, Cat. No.
5000006), according to the manufacturer's procedures. 30 µg of
protein samples were resolved on SDS-PAGE using polyacrylamide
4–20% precast gels (Mini-PROTEAN TGX Stain-Free Gels, Bio-Rad, Cat.
No. 456-8094) and then transferred on nitrocellulose membrane
(Trans-Blot Turbo Transfer Pack, Bio-Rad, Cat. No. 1704158). The
membrane was incubated for 60 min at room temperature (RT) with
Western Blocker Solution (Sigma Aldrich, Cat. No. W0138) and
immunoblotted with the following antibodies: Mouse monoclonal
anti-Phospho-p44/42 MAPK (Erk1/2) (Thr202/Tyr204) (E10) (Cell
Signaling, Cat. No. #9106), rabbit polyclonal anti-MAPkinase ERK1/2
from (Calbiochem, Cat. No. #442704), mouse monoclonal anti-IGFBP6
(Human IGFBP6 antibody, R&D, Cat. No: MAB8761), rabbit
monoclonal anti-IL-6 (D3K2N) (Cell Signaling, Cat. No. #12153);
mouse monoclonal anti-Phospho-Stat3 (Tyr705) (3E2) (Cell Signaling,
Cat. No. #913); rabbit polyclonal anti-Stat3 (C-20) (Santa Cruz
Biotechnology, Inc. Cat. No. sc-482); mouse monoclonal anti-GAPDH
(Santa Cruz Biotechnology, Inc. Cat. No: Sc-47724); mouse
monoclonal anti-β-Actin (Santa Cruz Biotechnology, Inc. Cat. No:
Sc-47778). During the study, anti-Stat3 antibody (C-20) has been
discontinued and replaced by mouse monoclonal anti-Stat3 antibody
(F-2, Santa Cruz Biotechnology, Inc. Cat. No. sc-8019). The
expression of specific proteins was detected by a secondary
antibody labeled with peroxidase (Bio Rad, Goat Anti Mouse, (H +
L)-HRP Conjugate, Cat. No. #170-6516, Goat Anti Rabbit (H + L)-HRP
Conjungate, Cat. No. #170-6515) and the Clarity Western ECL
Substrate (Bio-Rad Laboratories, Cat. No. 1705061). The differences
in protein expression were quantified through densitometric
analysis, using the ImageJ software and normalized according to the
expression of housekeeping genes.
RNA extraction and reverse
transcription-quantitative PCR (RT-qPCR)
Total RNA extraction was performed by Pure Link RNA
Mini Kit (Invitrogen, Cat. No. 12183018A). RNA was first quantified
through optical density measurements at 260 and 280 nm, and
subsequently converted in complementary DNA (cDNA) using a
SuperScript Vilo IV (Life Technologies Cat. No 11756050) Reverse
Transcriptase, according to the supplier's instructions. One µl of
cDNA was amplified by SsoAdvanced Universal SYBR green Supermix
(Bio-Rad, Cat. No. 1725271) and Real-Time PCR CFX96 Touch
(Bio-Rad). The reaction was conducted according to the following
amplification protocol: 95°C for 3 min, 39 cycles at 95°C for 10
sec, 60°C for 30 sec and 65-95°C for 5 sec. β-Actin and α-Tubulin
were chosen as internal controls. The results were calculated using
the ∆∆CT (where CT is threshold cycle) method (13). Gene expression was analyzed using
CFX manager software (Bio-Rad, Hercules, CA). Primers are reported
in Table I.
 | Table I.Forward and reverse primers used for
all reverse transcription-quantitative PCR analyses. |
Table I.
Forward and reverse primers used for
all reverse transcription-quantitative PCR analyses.
| Gene | Primer | Brand |
|---|
| c-FOS | F
5′-CAGTTATCTCCAGAAGAAGAAG-3′ |
KiCqStart® |
|
| R
5′-CTTCTAGTTGGTCTGTCTCC-3′ | Sigma-Aldrich |
| c-JUN | F
5′-AAAGGATAGTGCGATGTTTC-3′ |
KiCqStart® |
|
| R
5′-TAAAATCTGCCACCAATTCC-3′ | Sigma-Aldrich |
| IL-8 | F
5′-CCAACACAGAAATTATTGTAAAGC-3′ | Invitrogen |
|
| R
5′-TGAATTCTCAGCCCTCTTCAA-3′ |
|
| TNF-α | F
5′-CTCCAGGCGGTGCTTGTTC-3′ | Invitrogen |
|
| R
5′-CAGGCAGAAGAGCGTGGTG-3′ |
|
| IL-6 | F
5′-CAGTTGCCTTCTCCCTGGG-3′ | Eurofin MWG |
|
| R
5′-TGAGTGGCTGTCTGTGTGGG-3′ | Operon |
| IGFBP-6 | F
5′-GGAAGCTGAGGGCTGTCTC-3′ | Eurofin MWG |
|
| R
5′-GTCTCTGCGGTTCACATCCT-3′ | Operon |
| EGR1 | F
5′-GCAGAGTCTTTTCCTGAC-3′ |
KiCqStart® |
|
| R
5′-TTGGTCATGCTCACTAGG-3′ | Sigma-Aldrich |
| β-ACT | F
5′-GACGACATGGAGAAAATCTG-3′ |
KiCqStart® |
|
| R
5′-ATGATCTGGGTCATCTTCTC-3′ | Sigma-Aldrich |
| TUBB | F
5′-CTTTGTATTTGGTCAGTCTGG-3′ |
KiCqStart® |
|
| R
5′-ATCTTGCTGATAAGGAGAGTG-3′ | Sigma-Aldrich |
Microarray experiments and data
analysis
Total RNA from PEA1 and PEA2 cells treated or not
with IGFBP6 (1 µg/ml) for 2 h was extracted using TRIzol reagent
(Invitrogen) and evaluated for quality and integrity number by the
2100 Bioanalyzer (Agilent Technologies). For each sample, 300 ng of
total RNA were reverse transcribed and used for the synthesis of
cDNA and biotinylated cRNA according to the protocol of the
Illumina TotalPrep RNA amplification kit (Ambion; Life Technologies
Cat. No AMIL1791).
A total of 750 ng of each cRNA were hybridized on
the Illumina HumanHT12 V4_0_R2 Expression BeadChip array (Illumina
inc.). Staining was performed according to standard protocols
(14). The BeadChip was dried and
then scanned with the Illumina HiScanSQ System (Illumina Inc.). All
analyses were performed in triplicate.
Raw data from Illumina HumanHT-12_V4_0_R2 microarray
were normalized using neqc function in limma package and
low-quality annotation probes were excluded. Differentially
expressed genes (DEGs) were obtained on the linear model fit of the
microarray data. The statistical significance was established on
P<0.05.
The differences of gene expression levels were shown
in terms of LogFC and the cut-off of +/-0.58 was based on its
correspondence to +1.5/-1.5 fold-change (2^|0.58|=|1.5|FC), showing
the number of upregulated or downregulated genes, respectively
(15).
The enrichment analysis was carried out by the Gene
Set Enrichment Analysis (GSEA) method in clusterProfiler package
(16) and on the base of the gene
sets collections (Hallmark, Pathway) in MSigDB (Molecular
Signatures Database) (17,18). The statistical significance was
established on adjusted P<0.05 for Hallmark collections and on
P<0.05 for Pathway collections. All the steps were performed
according to the ‘microarray analysis’ best practice using R well
known packages (19,20).
Microarray data are available at the Gene Expression
Omnibus (GEO) repository under accession number GSE189717.
Analysis of public datasets
IGFBP6 expression analysis in OC samples, compared
with normal tissue, was performed using the TNMplot database
(https://www.tnmplot.com/). The platform directly
compares tumor and/or metastasis and normal samples and performs a
Mann-Whitney U or Kruskal-Wallis tests or a paired Wilcoxon test
(in case of availability of paired normal and adjacent tumor) for
statistical significance (21).
The expression correlation between IGFBP6 and selected FOS
and EGR1 genes was revealed by R2: Genomics Analysis and
Visualization Platform (http://r2.amc.nl)
using the Tumor Ovarian Bowtell-285-MAS5.0-u133p2 dataset. The R2
software evaluated the statistical significance with the Pearson's
correlation analysis. The expression of FOS and EGR1
genes was analyzed in ovarian serous adenocarcinomas compared to
normal tissues using TNMplot (RNA seq data) and GEPIA (TCGA normal
vs GTEX data) databases. GEPIA (http://gepia.cancer-pku.cn) is a network-based tool
for processing the RNA expression information, collected from
carcinomas and healthy specimens from GTEx project and TCGA
(22).
Statistical analysis
The unpaired Student's t-test was used to establish
the statistical significance in IGFBP6-stimulated versus
unstimulated cells. The densitometric analysis data were analyzed
by two-way ANOVA and Bonferroni post hoc test. Statistically
significant values (P<0.05) are reported in Figure Legends. All
experiments were independently performed at least three times.
Results
IGFBP6 is downregulated along ovarian
carcinogenesis
Since the role of IGFBP6 in human OC carcinogenesis
is controversial, IGFBP6 expression levels were preliminary
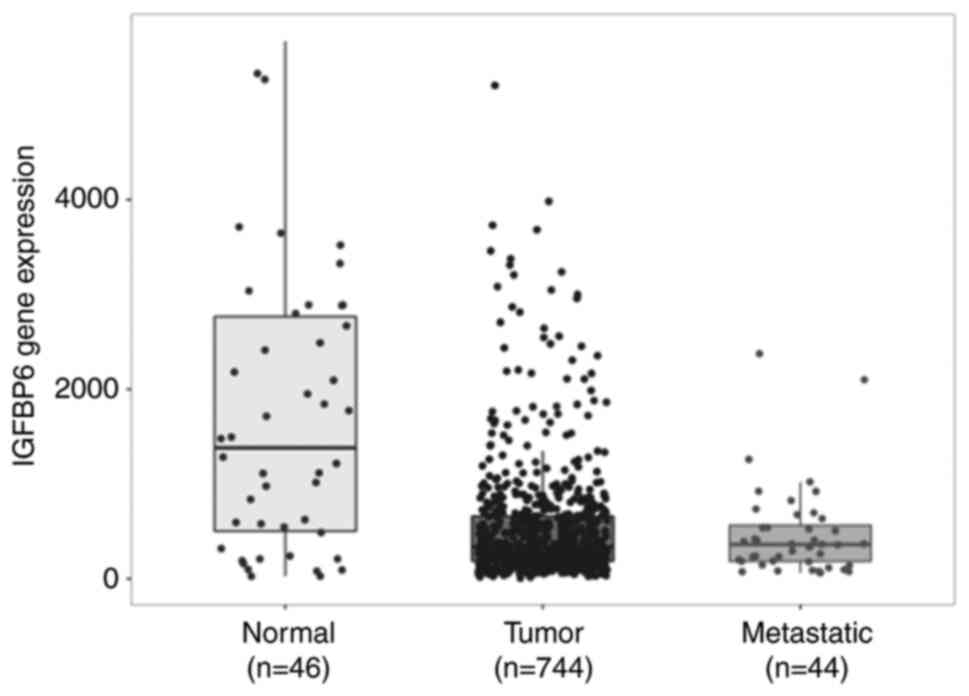
explored using gene expression data from public datasets. Thus,
TNMplot gene chip data were used to analyze the differential
expression of IGFBP6 in normal human ovarian samples (n=46),
non-metastatic OCs (n=744) and metastatic OCs (n=44).
Interestingly, while normal ovarian tissues were characterized by
high IGFBP6 expression, a significant downregulation of IGFBP6 mRNA
was observed from normal ovarian tissue to non-metastatic OC
tissues (Fig. 1) (P=1.77e-07,
Kruskal-Wallis test and post hoc Dunn's test). No further
down-regulation was observed between primary tumor tissue and
metastatic OCs. These data suggest that IGFBP6 expression is
downregulated at early stages during ovarian carcinogenesis.
Platinum-sensitive PEA1 HGSOC cells
are more sensitive to IGFBP6 stimulation compared to
platinum-resistant PEA2 HGSOC cells
To study the activity of IGFBP6 during OC
progression, IGFBP6 mRNA and protein expression levels were
examined in both platinum-sensitive (PEA1) and platinum-resistant
(PEA2) OC cell lines by quantitative RT-PCR and immunoblot blot
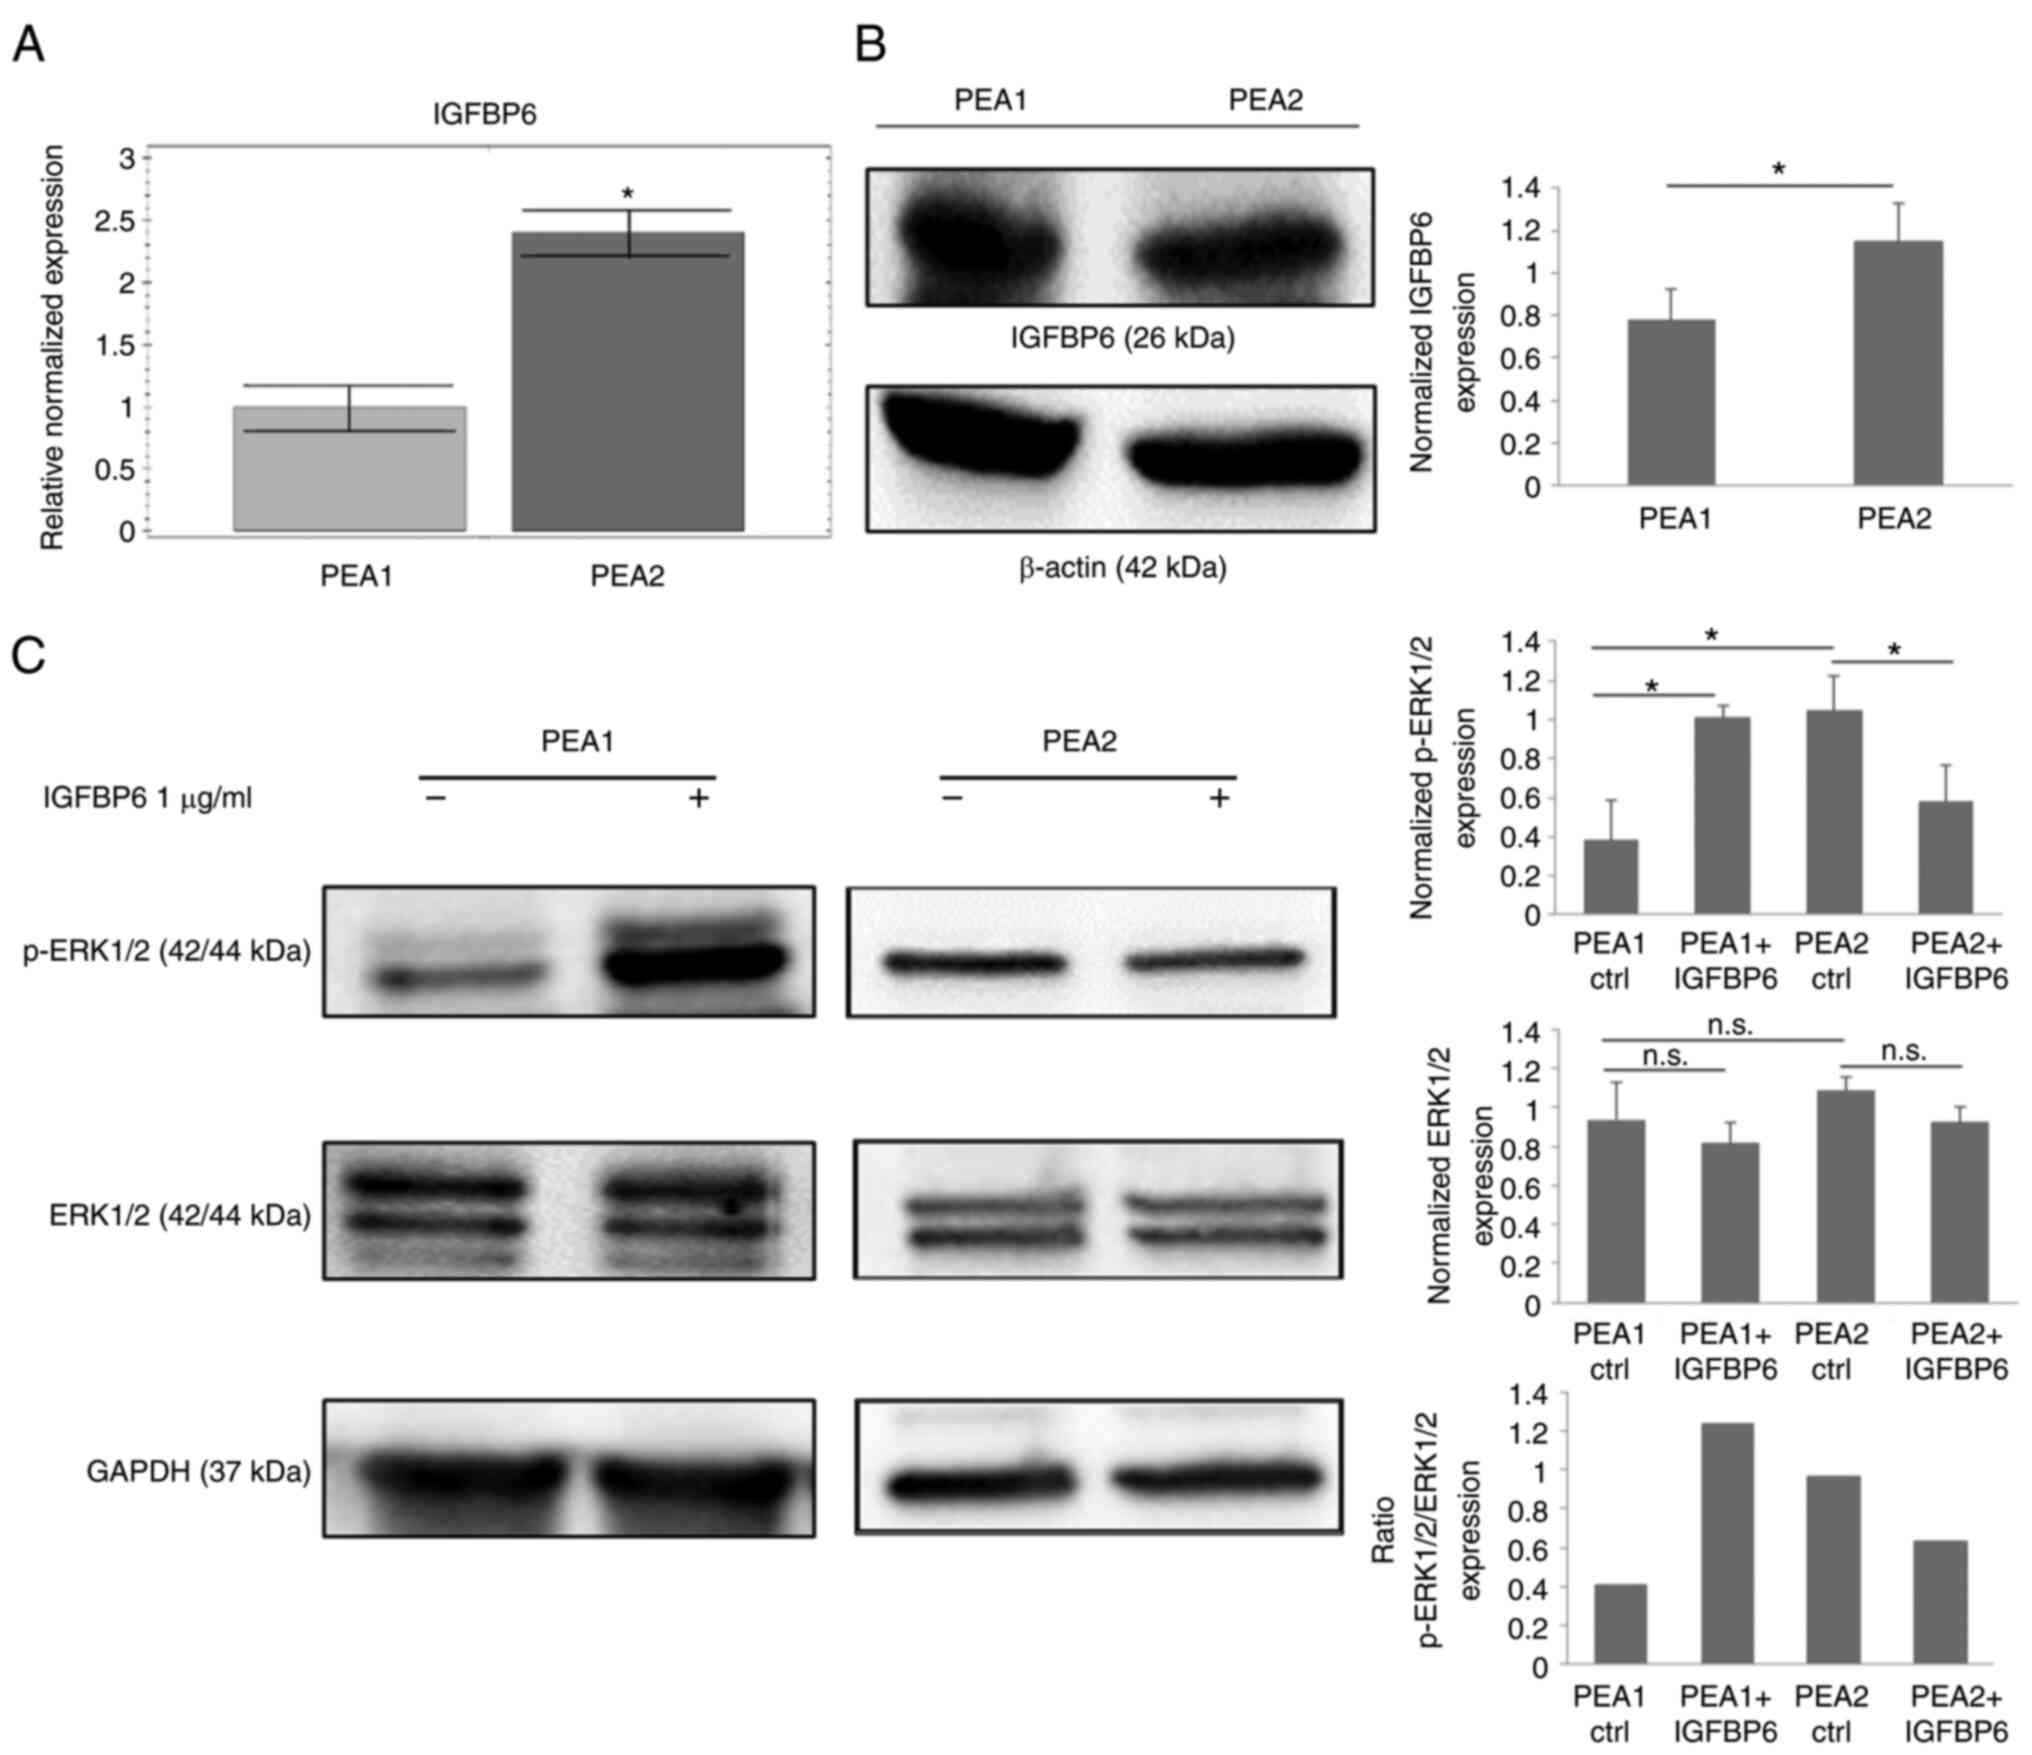
analysis, respectively. IGFPB6 mRNA levels were significantly
higher in OC PEA2 cells compared to PEA1 cells (Fig. 2A), while IGFBP6 protein expression
was similar in both cell lines (Fig.
2B).
In the effort to explore the effects of IGFBP6 on
ERK pathway, which is known to play a major role in OC pathogenesis
(23), ERK1/2 phosphorylation was
evaluated in PEA1 and PEA2 cell lines in response to exogenous
IGFBP6. Interestingly, a 10 min stimulation with IGFBP6 recombinant
protein increased ERK1/2 phosphorylation in PEA1 cells and induced
no effects on ERK pathway activation in PEA2 cell line (Fig. 2C). These preliminary data suggest
that IGFBP6 signaling is more active in PEA1 OC cells.
IGFBP6 elicits a wider gene expression
reprogramming in platinum-sensitive PEA1 compared to
platinum-resistant PEA2 cell lines
To further characterize IGFBP6 activity and identify
differentially expressed genes in PEA1 and PEA2 OC cell lines
following IGFBP6 perturbation, a full genome gene expression
profiling was performed by Illumina technology after cell
stimulation with IGFBP6 recombinant protein for 2 h. Data allowed
the identification of significantly modulated genes and were also
analyzed to understand the role of IGFBP6 in the regulation of
pathways of interest.
The analysis of PEA1 cell line treated with IGFBP6
compared to its unstimulated control identified 2,440 significantly
modulated genes, 1,348 up- and 1,092 down-regulated (P<0.05).
Therefore, performing a filter based on absolute logFC>0.58
(15), this list was restricted to
85 up- and 28 down-regulated genes (Table SI). Likewise, the analysis of gene
expression data from PEA2 cell line stimulated with IGFBP6
identified 1,471 genes (P<0.05), 729 up- and 742 down-regulated.
Therefore, performing a filter based on absolute logFC>0.58,
this list was restricted to 37 up- and 36 down-regulated genes
(Table SII).
The enrichment analysis was focuses on the Hallmarks
and Pathways categories (Table
SIII). We identified 16 hallmarks statistically significant
(adjusted P<0.05) and with ES>0.3 upon IGFBP6 stimulation in
PEA1 cells and, among them, TNF-α signaling via NF-κB was the most
significant (Table II).
Conversely, only two hallmarks were statistically significant
(adjusted P<0.05) and with ES>0.3 in PEA2 cells stimulated
with IGFBP6 (Table III).
| Table II.Hallmarks significantly enriched in
PEA1 cells stimulated with IGFBP6. |
Table II.
Hallmarks significantly enriched in
PEA1 cells stimulated with IGFBP6.
| Hallmarks | ES | P-value | NES |
|---|
|
TNFA_SIGNALING_VIA_NFKB | 0.609 | 1E-10 | 2.53 |
| UV_RESPONSE_UP | 0.503 | 7.28E-08 | 2.029 |
| HYPOXIA | 0.456 | 4.57E-07 | 1.899 |
|
TGF_BETA_SIGNALING | 0.546 | 0.0006 | 1.829 |
| P53_PATHWAY | 0.431 | 1.09E-05 | 1.792 |
| MYC_TARGETS_V2 | 0.518 | 0.0018 | 1.773 |
|
MITOTIC_SPINDLE | 0.399 | 0.0001 | 1.664 |
|
INFLAMMATORY_RESPONSE | 0.384 | 0.0008 | 1.596 |
|
IL6_JAK_STAT3_SIGNALING | 0.423 | 0.0083 | 1.557 |
| APOPTOSIS | 0.373 | 0.0065 | 1.505 |
|
ESTROGEN_RESPONSE_EARLY | 0.362 | 0.0029 | 1.504 |
|
EPITHELIAL_MESENCHYMAL_TRANSITION | 0.361 | 0.0031 | 1.503 |
|
CHOLESTEROL_HOMEOSTASIS | 0.418 | 0.0015 | 1.496 |
| UV_RESPONSE_DN | 0.372 | 0.0088 | 1.482 |
|
IL2_STAT5_SIGNALING | 0.353 | 0.0059 | 1.468 |
| MYOGENESIS | 0.348 | 0.0079 | 1.450 |
| Table III.Hallmarks significantly enriched in
PEA2 cells stimulated with IGFBP6. |
Table III.
Hallmarks significantly enriched in
PEA2 cells stimulated with IGFBP6.
| Hallmarks | ES | P-value | NES |
|---|
| MYC_TARGET_V1 | 0.329 | 0.0018 | 1.475 |
| G2M_CHECKPOINT | 0.329 | 0.0018 | 1.483 |
In order to further study the differential
activation of IGFBP6 pathway in OC cell lines, six genes (i.e.,
FOS, JUN, EGR1, TNF, IL-6 and IL-8) were selected
among the top 20 significantly upregulated genes in PEA1 data set
(Tables IV and SI). Considerably, all the selected genes
enriched the 16 hallmarks reported in Table II, while three of them (i.e.,
FOS, JUN and EGR1) were also in the list of
IGFBP6-modulated genes in PEA2 cells (Tables V and SII). Noteworthy, while all these genes
were significantly upregulated in PEA1 cells upon IGFBP6
stimulation (Fig. 3A; Table IV), FOS, JUN and
EGR1 were downregulated in PEA2 cells after exogenous IGFBP6
stimulation (Fig. 3B; Table V). The expression of these genes
was further validated by quantitative RT-PCR in PEA1 and PEA2 cells
stimulated with IGFBP6, confirming the significantly upregulation
of all genes in PEA1 cells (Fig.
3A) and the downregulation of FOS and EGR1 in
PEA2 cells (Fig. 3B).
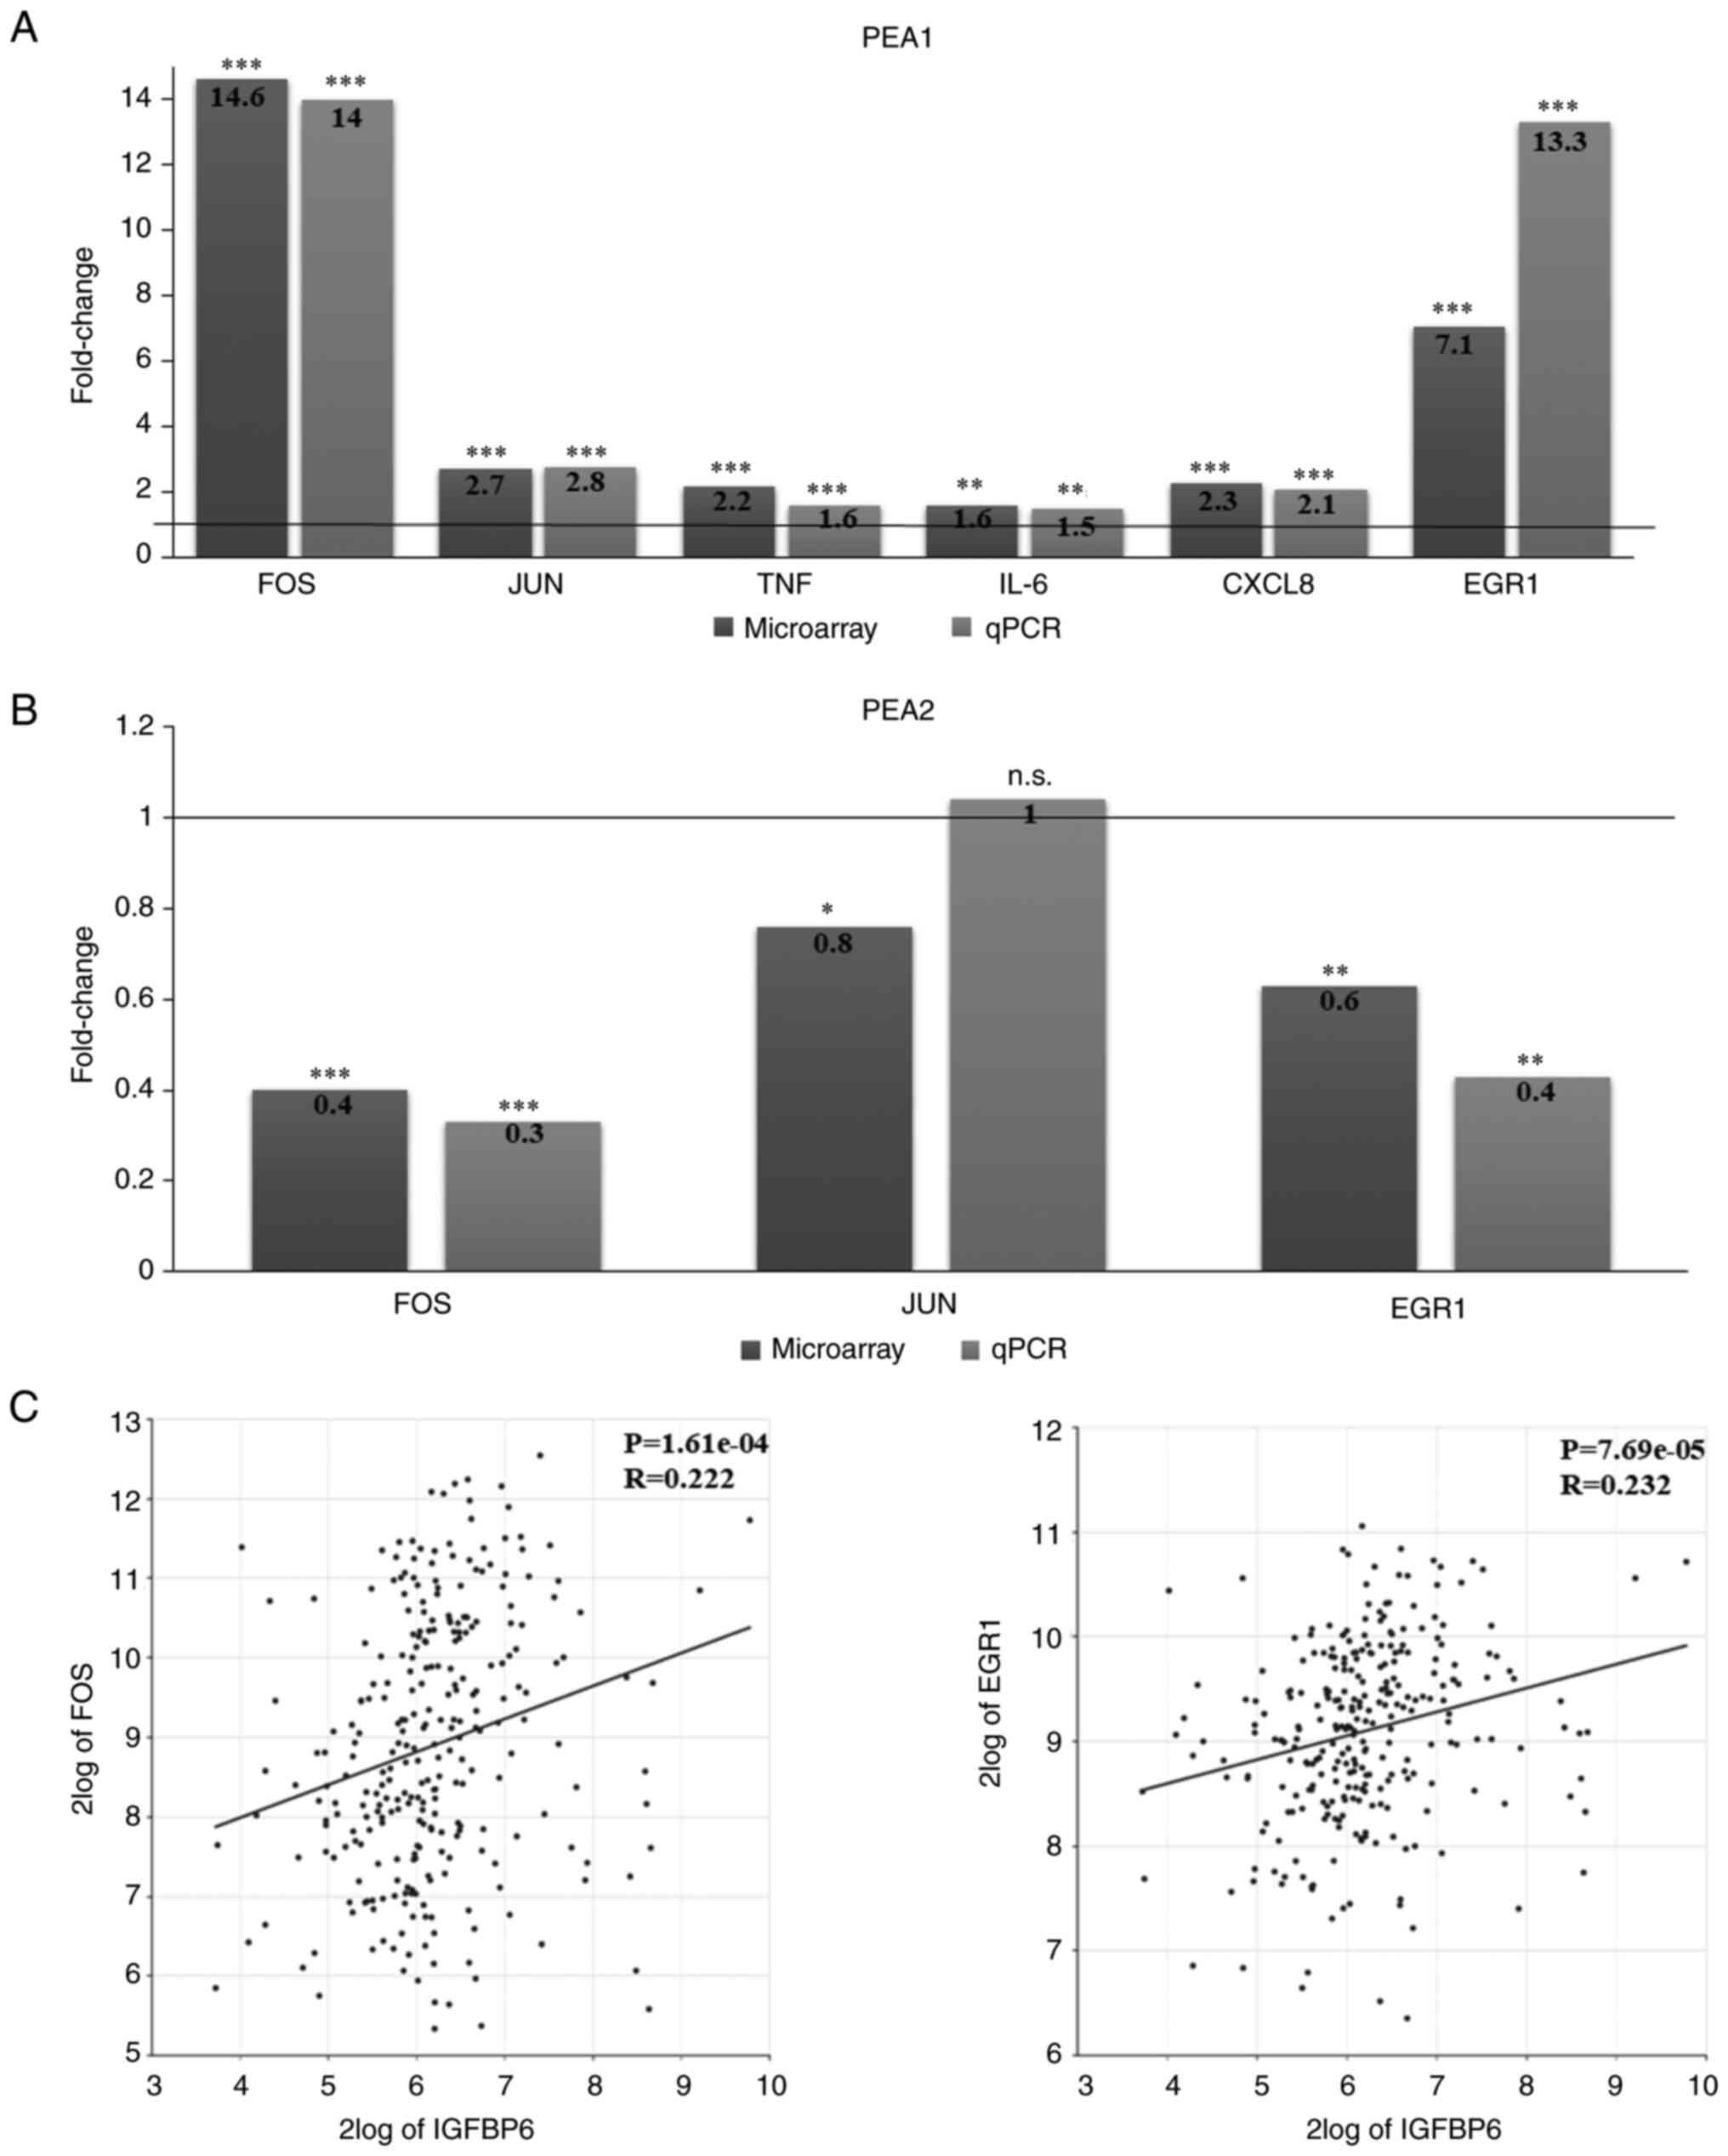 | Figure 3.Gene expression profiles of OC
platinum-sensitive PEA1 and platinum-resistant PEA2 cells
stimulated with IGFBP6. Comparative gene expression (microarray vs.
quantitative PCR) of genes reported in Tables IV and V in (A) PEA1 and (B) PEA2 cells.
P-values respect to unstimulated control: *P<0.05; **P<0.001;
***P<0.0001. (C) Statistical correlation between the expression
of IGFBP6 and FOS (R=0.222, P=1.61e-04, T=3.826, degrees of
freedom=283) or EGR1 (R=0.232, P=7.69e-05, T=4.013 degrees of
freedom=283) based on the Tumor Ovarian-Bowtell dataset and
analyzed via R2: Genomics Analysis and Visualization Platform. OC,
ovarian cancer; PEA1, pleural effusion adenocarcinoma-1; PEA2,
pleural effusion adenocarcinoma-2; IGFBP6, insulin-like growth
factor binding protein 6; FOS, proto-oncogene, AP-1 transcription
factor subunit; EGR1, early growth response 1. |
| Table V.Expression levels of selected genes
in PEA2 data set. |
Table V.
Expression levels of selected genes
in PEA2 data set.
| Symbol | Name | Entrez ID | logFC | P-value | Fold change |
|---|
| EGR1 | Early growth
response 1 | 1958 | −0.661 | 0.003 | 0.632 |
| FOS | Fos proto-oncogene,
AP1 trancription factor subunit | 2353 | −1.299 | 0.0002 | 0.406 |
| JUN | Jun proto-oncogene,
AP1 trancription factor subunit | 3725 | −0.388 | 0.026 | 0.764 |
| Table IV.Expression levels of selected genes
in PEA1 data set. |
Table IV.
Expression levels of selected genes
in PEA1 data set.
| Symbol | Name | Entrez ID | logFC | P-value | Fold change |
|---|
| EGR1 | Early growth
response 1 | 1958 | 2.829 | 2.2E-10 | 7.106 |
| FOS | Fos proto-oncogene,
AP1 trancription factor subunit | 2353 | 3.874 | 2.9E-10 | 14.662 |
| JUN | Jun proto-oncogene,
AP1 trancription factor subunit | 3725 | 1.451 | 8.7E-08 | 2.734 |
| TNF | Tumor Necrosis
Factor | 7124 | 1.133 | 3.9E-08 | 2.193 |
| IL-6 | Interelukin 6 | 3569 | 0.679 | 4.7E-06 | 1.601 |
| CXCL8 | C-X-C motif
chemokine ligand 8 | 3576 | 1.198 | 1.4E-07 | 2.294 |
Since these data suggest that IGFBP6 induces a wider
gene expression reprogramming in platinum-sensitive PEA1 compared
to platinum-resistant PEA2 cells, we comparatively evaluated gene
expression data at basal level between PEA2 and PEA1 cell lines.
This comparative analysis of PEA2 versus PEA1 cell lines in basal
conditions identified 9,372 significantly modulated genes, 4,477
up- and 4,895 down-regulated (P<0.05). Moreover, performing a
filter based on absolute logFC>0.58, 2,871 genes up-regulated
and 3,238 down-regulated were identified. Hallmarks enrichment
analysis in PEA2 versus PEA1 cells identified 16 positive and 9
negative statistically significant hallmarks (adjusted P<0.05,
ES>0.3, ES<-0.3) and, among other, the TNF-α signaling via
NF-κB pathway, which is known to favor platinum resistance
(24) (Tables SIV and SV). Consistently, the comparative
expression analysis of FOS, JUN, EGR1, TNF, IL-6 and
IL-8 showed that these genes are upregulated in
platinum-resistant PEA2 compared to platinum-sensitive PEA1 cells
(Tables SVI and SVII). Altogether, these data suggest
that IGFBP6 stimulation of platinum-sensitive PEA1 cells results in
the activation of gene/pathways that are already constitutive
active in platinum-resistance PEA2 cells and that this is a
potential explanation of the poorer response of PEA2 cells to
IGFBP6 stimulation.
To further validate the relationship between IGFBP6
and the expression of selected genes observed in PEA1 and PEA2
cells, gene expression correlation analysis of IGFBP6 with
FOS and EGR1 genes, was performed using R2 software.
In particular, the correlation analysis was carried out
interrogating the microarray dataset Tumor Ovarian Bowtell, which
provides the gene expression profiling of 285 OC samples (25). Interestingly, the analysis revealed
positive association between mRNA levels of IGFBP6 and expression
of both FOS (R=0.222, P=1.61e-04) and EGR1 (R=0.232,
P=7.69e-05) in OC specimens (Fig.
3C). In addition, since IGFBP6 is downregulated from normal
ovarian tissue to OC, we evaluated the hypothesis that FOS
and EGR1 may have a similar behavior being IGFBP6-modulated.
The expression of FOS and EGR1 genes was analyzed in
ovarian serous cystadenocarcinomas in TNMplot database (RNA seq
data), comparing normal tissue (133 samples) to tumor tissue (374
samples) (FOS P=1.52e-11, EGR1 P=3.07e-07). The
down-regulation of FOS and EGR1 expression was
observed in tumors compared to normal samples (Fig. S1A). These results were further
confirmed analyzing 426 tumor tissue samples (OC) and 88 normal
tissue samples in the GEPIA (TCGA normal vs GTEX data)
dataset(|logFc| 0.58; P-value cutoff:0.05) (Fig. S1B).
IGFBP6 activity is qualitatively
different in platinum-sensitive PEA1 compared to platinum-resistant
PEA2 cell lines
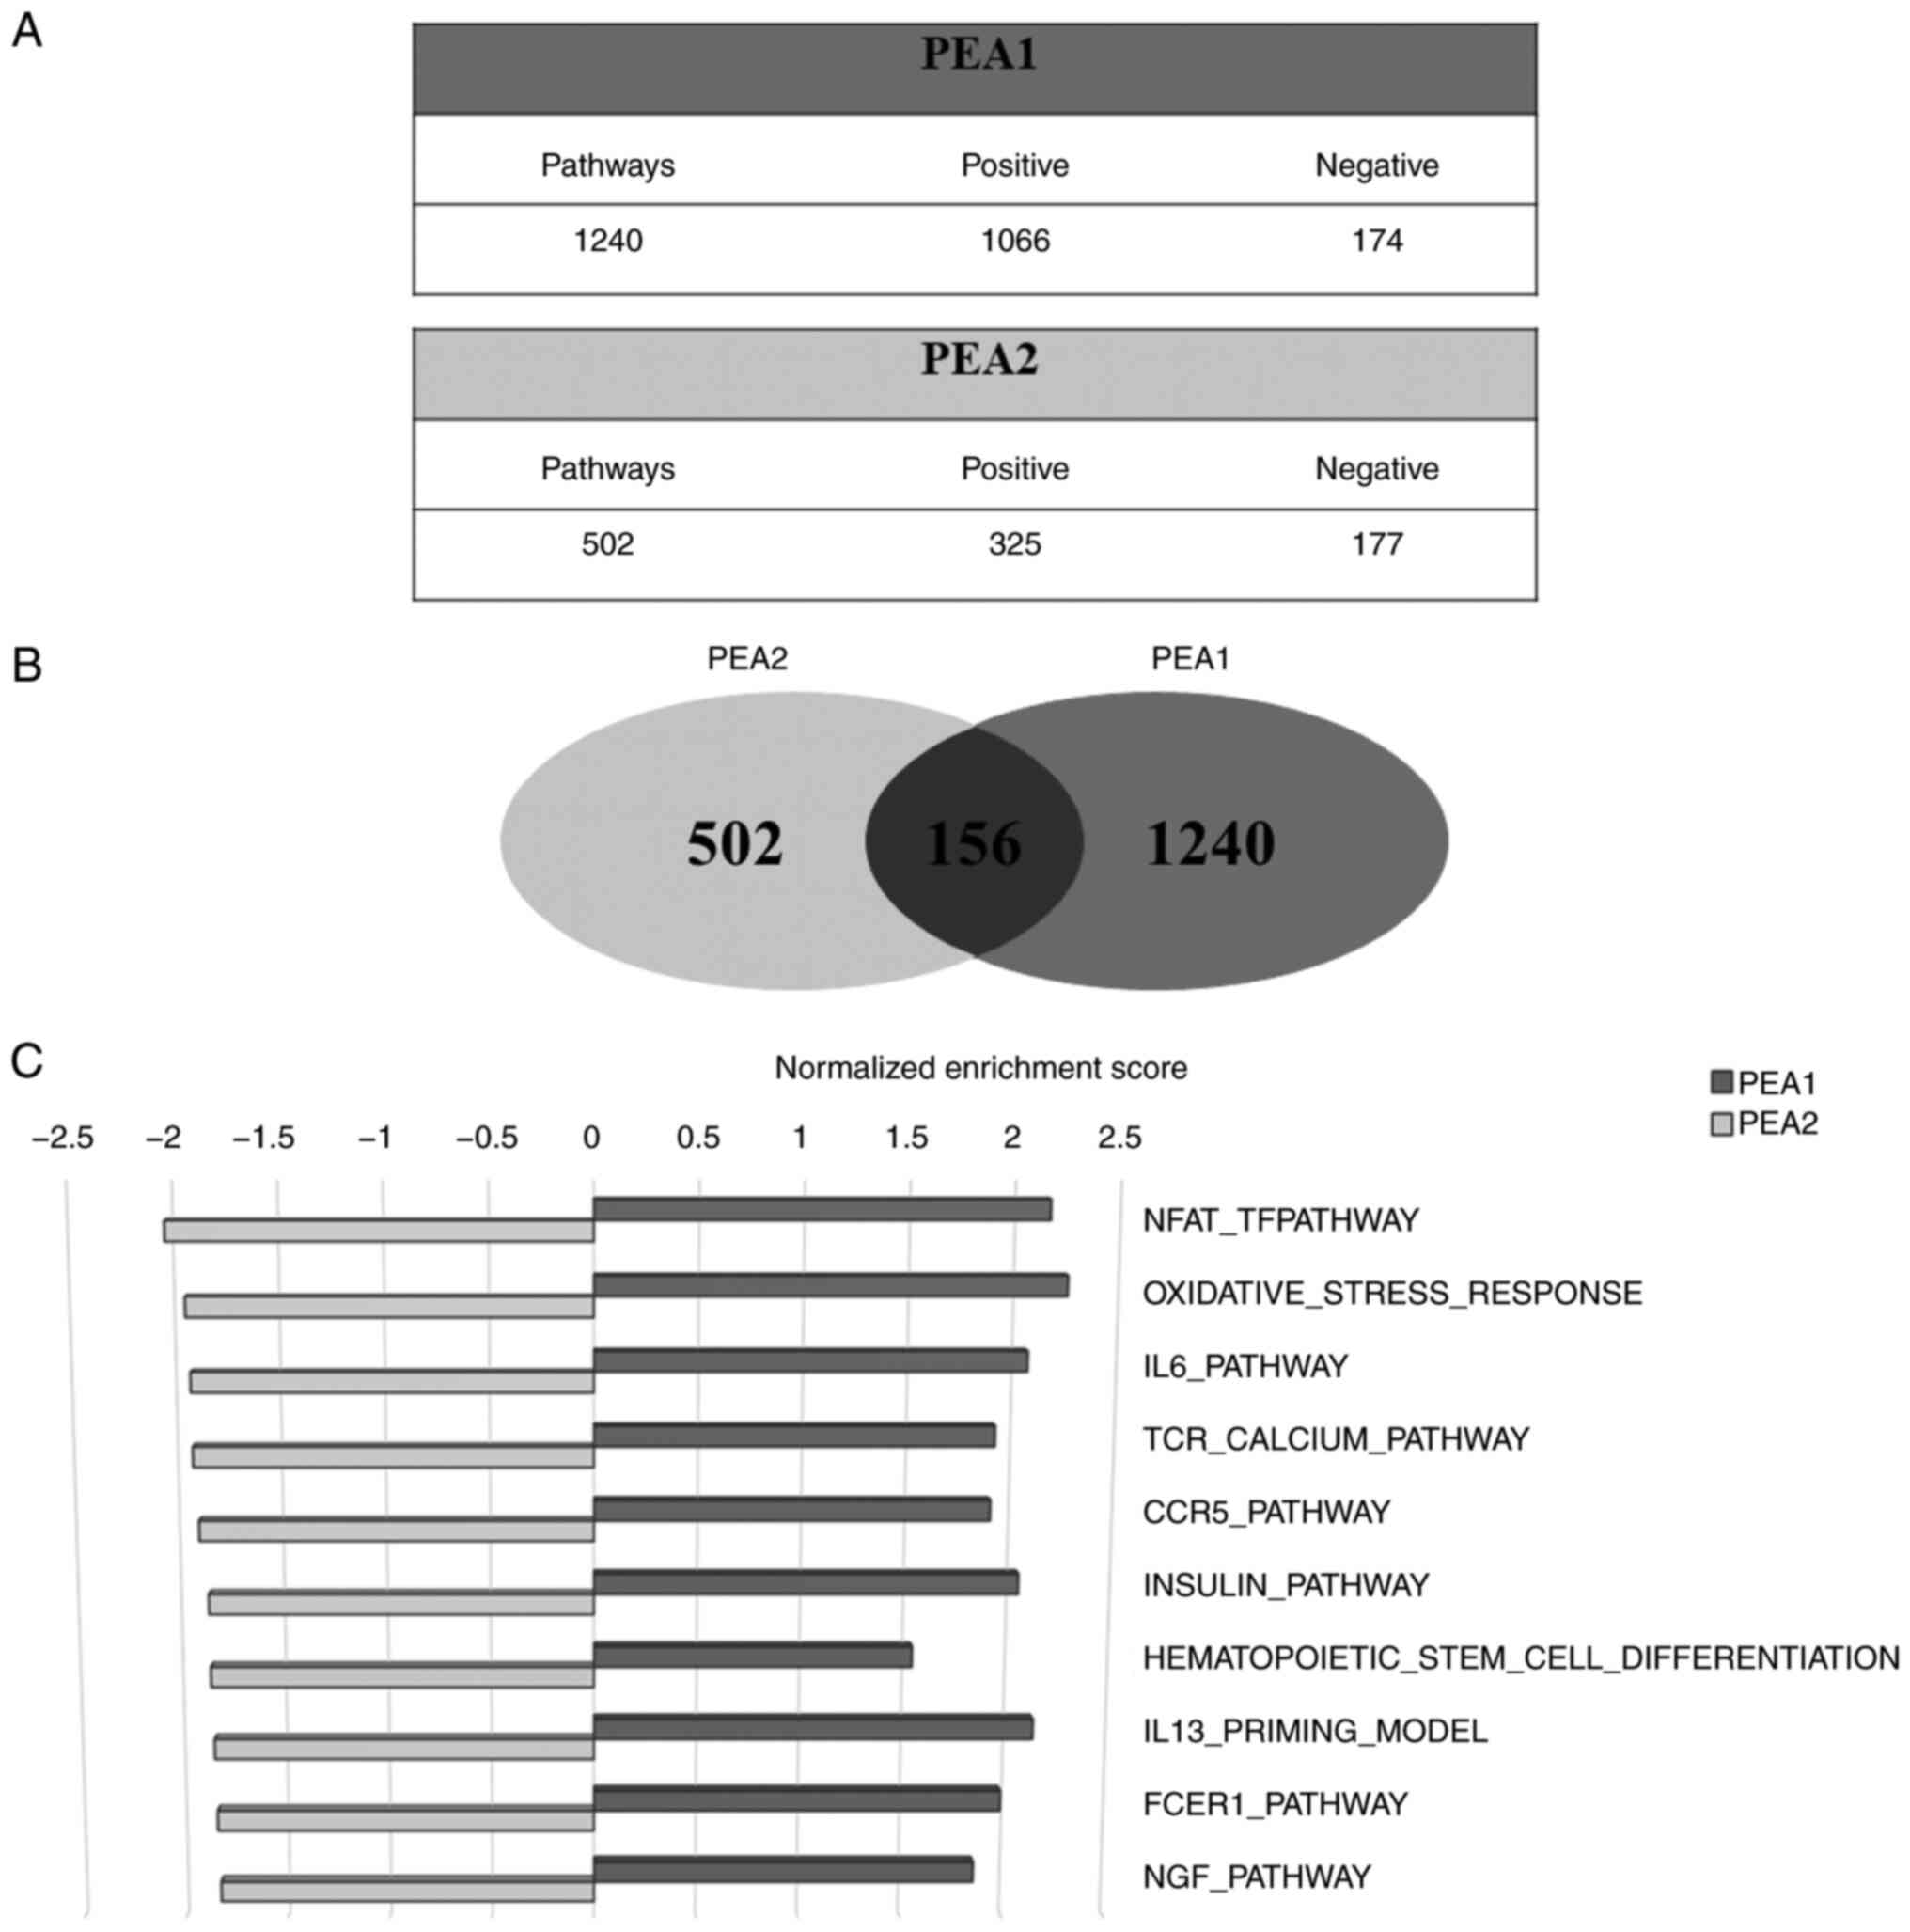
Since our data suggest a different response of
platinum-sensitive and platinum-resistant OC cell lines to IGFBP6
stimulation, signaling pathways significantly deregulated
(ES>0.4, P<0.05) by IGFBP6 in PEA1 versus PEA2 cells were
subsequently analyzed. The analysis identified 1240 and 502
pathways in PEA1 and PEA2 cells, respectively (Fig. 4A) and among them, 156 in common
between the two cell lines (Fig.
4B). Of note, the comparison of the top 10 common pathways in
Table SIII showed a positive
regulation in PEA1 cells and a negative regulation in PEA2 cells
exposed to IGFBP6 (Fig. 4C).
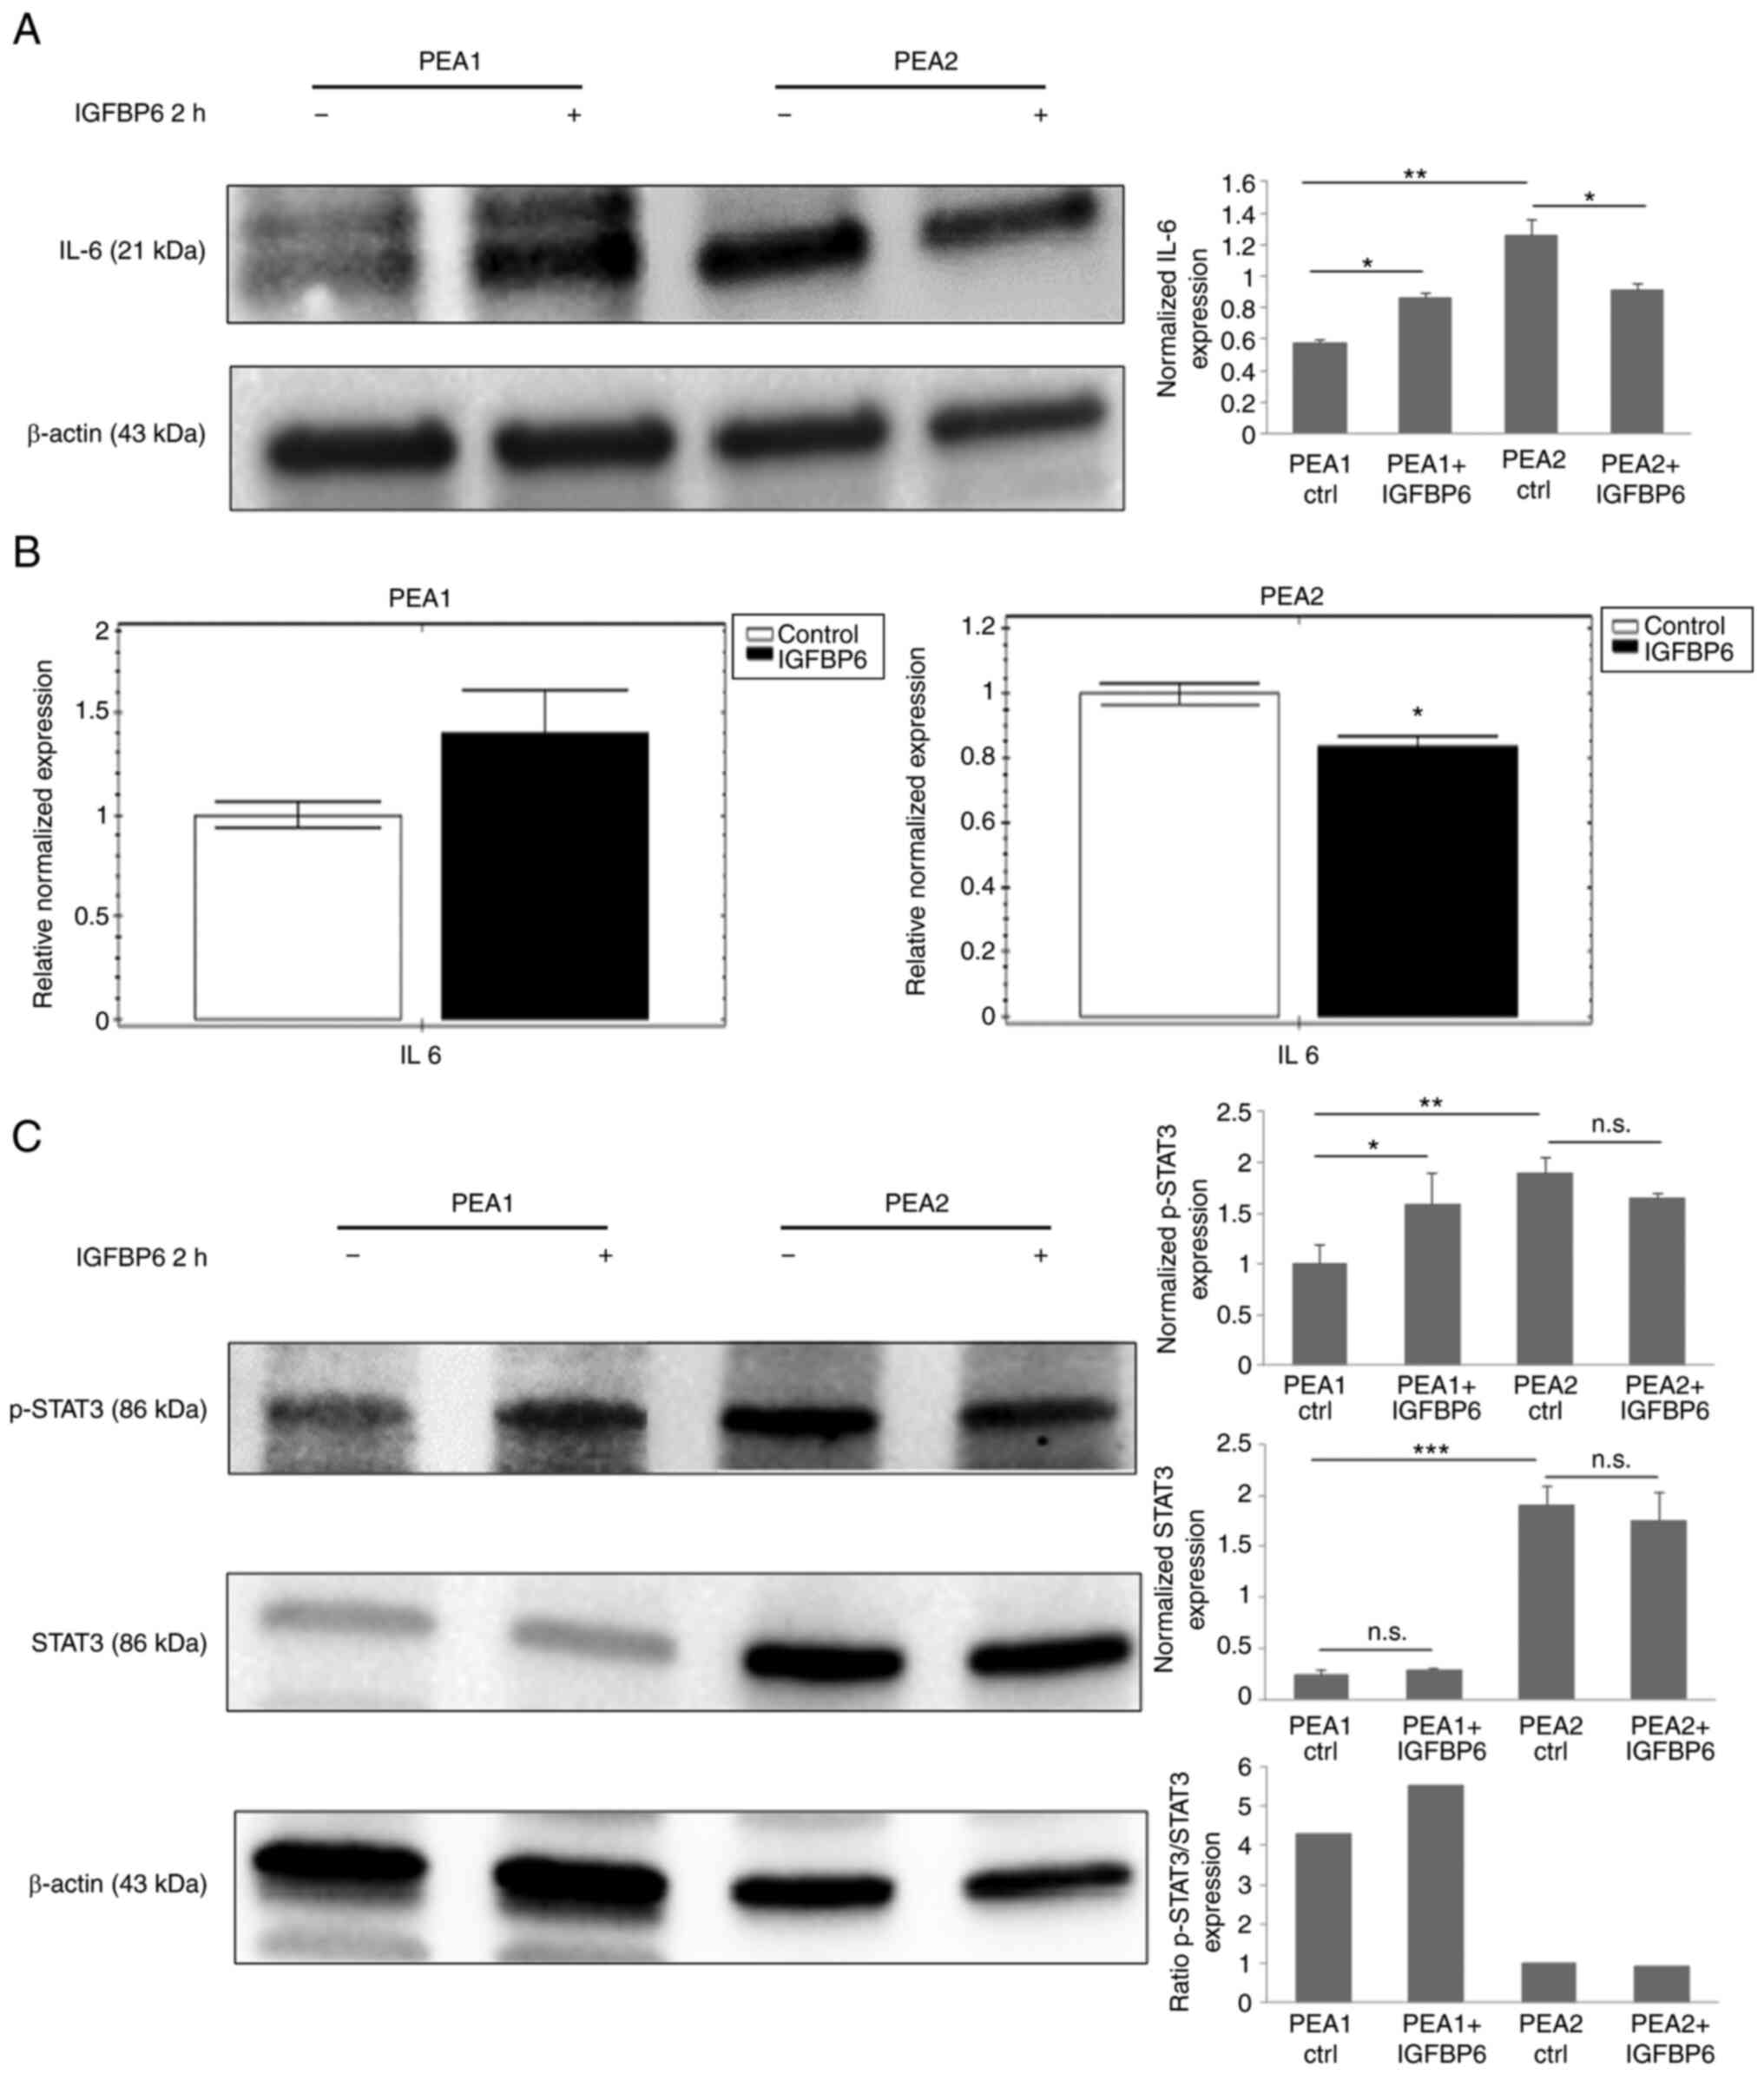
Since the statistical analysis identified
IL6-JAK-STAT3 signaling as an enriched hallmark in IGFBP6
stimulated PEA1 cells (Table II),
and IL6 among genes differently regulated by IGFBP6 in PEA1 cells
(Fig. 3A), this pathway was
further investigated to characterize the divergent response of
platinum-sensitive and platinum-resistant OC cells to IGFBP6. Thus,
IL6 protein and mRNA levels were analyzed in both cell lines
exposed to IGFBP6 and STAT3 phosphorylation was used as a signaling
event downstream to IL6 stimulation. IL6 protein (Fig. 5A) and mRNA levels (Fig. 5B) resulted both up-regulated in
IGFBP6-stimulated PEA1, while significantly downregulated in PEA2
cells (Fig. 5A and B). In line
with an increased activity of IL6 pathway in PEA1 after IGFBP6
stimulation, recombinant IGFBP6 increased STAT3 phosphorylation in
PEA1 cells, while STAT3 phosphorylation was moderately reduced in
PEA2 cells exposed to IGFBP6 (Fig.
5C). Consistently with data showing a constitutive activation
of selected pathways in PEA2 versus PEA1 cells, higher levels of
IL6, STAT3 and phosphoSTAT3 were observed in PEA2 compared to PEA1
cells.
Concluding, these data suggest that OC cell response
to IGFBP6 stimulation is divergent in platinum-sensitive PEA1 cells
compared to platinum-resistant PEA2 cells.
Discussion
The role of IGFBP6 in human malignancies and
specifically in OC is still controversial (9). The majority of studies suggests that
IGFBP6 is downregulated in human tumors compared to normal tissues,
this supporting the hypothesis that IGFBP6 is characterized by
oncosuppressive functions, stimulating apoptosis and inhibiting
cell proliferation (6). Again,
IGFBP6 expression is increased in selected tumors (26–28),
along with evidence that IGFBP6 positively regulates cell
proliferation and migration.
Several data suggest that IGFBP6 is downregulated
along OC progression (8,29), while other authors report that
IGFBP6 promotes migration in SKOV3 OC cells by activation of MAP
kinase signaling, while represses migration in HEY OC cells through
both IGF-dependent and IGF-independent mechanisms (9). The IGFBPs family revealed distinct
prognosis in patients with OCs (30). Indeed, it was recently reported
that increased IGFBP6 mRNA levels negatively affect overall
survival and progression-free survival in OC patients.
Interestingly, aberrant IGFBP6 mRNA expression was correlated with
significantly worse prognosis in patients receiving different
chemotherapeutic regimens, suggesting IGFBP6 as a useful prognostic
predictor for chemotherapeutic effect in OCs (30).
To shed light on this conflicting evidence, the role
of IGFBP6 was evaluated by using gene expression data from public
datasets of human OCs and by an established OC cell model of two
matched cell lines derived from the same patient with HGSOC, before
and after rising platinum resistance. Our data suggest that i)
IGFBP6 is downregulated from normal ovarian tissues to primary OCs,
and that ii) IGFBP6 signaling is quantitatively and qualitatively
different in platinum-sensitive PEA1 compared to platinum-resistant
PEA2 cells. Indeed, data showed a more abundant and significant
gene expression reprogramming in PEA1 compared to PEA2 cells and
the analysis of specific genes and signaling pathways suggest a
divergent response to IGFBP6 in platinum-sensitive PEA1 versus
platinum-resistant PEA2 cells. Among them, IGFBP6 activated ERK1/2
signaling only in PEA1 cells, while IL6 signaling pathway was
positively regulated in PEA1 and conversely inhibited in PEA2
cells, upon IGFBP6 stimulation.
This evidence supports the hypothesis that IGFBP6
signaling is deregulated during ovarian carcinoma progression,
likely playing a role in the transition from platinum-sensitive to
platinum-resistant conditions. Actually, platinum-based
chemotherapy is the mainstay of OC treatment in locally advanced
and metastatic stages (31,32).
OC is considered a chemo-responsive neoplasm, but, despite this,
most patients ultimately develop recurrent disease and resistance
to platinum-based chemotherapy with parallel worsening of clinical
outcome (33). In such context,
our data, although limited to a single model of platinum
resistant/sensitive OC cell lines, suggest that the deregulation of
IGFBP6 signaling may represent a mechanism associated to the
development of platinum resistance and that its modulation may be
ultimately a strategy to prevent/delay its onset.
Intriguingly, we observed both quantitative and
qualitative differences in gene expression reprogramming between
platinum-sensitive PEA1 and platinum-resistant PEA2 cell lines upon
IGFBP6 stimulation. Since the differential expression of IGFBP6
between the two cell lines is minimal, it does not explain the
differences observed in signal transduction and gene expression.
Indeed, the mechanism used by IGFPB6 to activate its downstream
signaling is complex and still largely unknown (34). The extracellular activity of IGFBP6
presents both IGF-dependent and IGF-independent mechanisms. As
observed for others IGFBPs, IGFBP6 binds and inhibit IGFs
preventing their interaction with the receptors, with a relatively
higher propensity towards IGF-II than IGF-I. Furthermore, IGFBP6 is
capable of actions independent of IGF-II, including regulation of
proliferation, apoptosis, angiogenesis and cell migration upon
binding with other receptors, mostly unknown (35,36).
In such a context, IGFBP6 binding to prohibitin-2 (PBH2) has been
proposed as a mechanism responsible for IGF-independent inhibition
of cancer cell migration (36).
Thus, it is reasonable to hypothesize that modifications in IGFBP6
signaling transduction machinery are responsible for the
qualitative different response of PEA2 compared to PEA1 cells and
are likely involved in the onset of platinum resistance.
A relevant observation is the evidence that IGFBP6
stimulation of platinum sensitive PEA1 cells induces several
genes/pathways/hallmarks that are already constitutively active in
platinum-resistant PEA2 cells. While this result may account for
the lower response of PEA2 cells to IGFBP6 stimulation, it may also
suggest that IGFBP6 is responsible for promoting platinum
resistance by activating specific pathways responsible for escape
from cytotoxic agents. Interestingly, ERK signaling is among
signaling pathways differentially active between PEA1 and PEA2 and
this, in our preliminary experiments, was used to establish that
PEA2 cells are poorly sensitive to IGFBP6 stimulation. Since ERK
signaling is one of the most relevant signaling pathway whose
activation is modulated upon IGFBP6 stimulation (37), the differential activation of ERK
signaling between the two cell lines may be responsible for the
difference in gene expression after IGFBP6 stimulation and likely
drug resistance. In line with this hypothesis, the expression of
JUN and FOS, two well established downstream targets of ERK
signaling (38), is upregulated in
PEA1 and downregulated/unchanged in PEA2 cells upon IGFPB6
stimulation. However, further studies are needed to address the
specific role of ERK signaling in IGFBP6-dependent reprogramming of
gene expression and its relationship with drug resistance.
Intriguingly, our data suggest a qualitative
difference between drug-resistant PEA2 and drug-sensitive PEA1
cells lines in terms of response to IGFBP6. Indeed, IGFBP6
regulates specific genes and pathways involved in inflammation and
their expression/activation was inhibited in PEA2 cells where
IGFBP6 signaling is contextually downregulated. More specifically,
several hallmarks/pathways involved in inflammatory processes, as
IL6-JAK-STAT3 and TGF-B signaling pathways (39) are active in PEA1 and conversely
inhibited in PEA2 cells, after IGFBP6 stimulation. This evidence is
consistent with several studies, which suggest that inflammatory
pathways along with metabolic remodeling are involved in the
development of platinum resistance (40–42).
In addition, specific inflammatory indexes are predictive of
platinum sensitivity in OC (43,44)
and are differentially expressed in platinum-sensitive versus
resistant OC cell models (45).
However, although the literature demonstrates that IL6-JAK-STAT3
pathway is known to favor platinum resistance in OC (46), our data failed to demonstrate that
IL6-JAK-STAT3 axis activation/inhibition is the main mechanism
responsible for modulation of platinum sensitivity in response to
IGFBP6 in OC cells (data not shown). Thus, based on our results, we
suggest that it is unlikely that a single pathway/hallmark is
responsible for modulation of platinum sensitivity in response to
IGFBP6, but rather that the vast remodeling induced by IGFBP6 with
activation/inhibition of several pathways may modulate platinum
sensitivity in PEA1/PEA2 ovarian carcinoma cells. However, it is
important to underline that this study does was performed using a
single model of platinum sensitive/resistant ovarian carcinoma cell
lines and does not provide a final answer about the specific
molecular mechanism responsible for this process. Thus, further
studies are needed to further validate these results and clarify
the role of IGFBP6 in platinum resistance/sensitivity.
In conclusion, this study suggests a role of IGFBP6
in OC progression, highlighting that the deregulation of its
actions is likely involved in the remodeling of the gene expression
response and the occurrence of platinum resistance. Further studies
are needed to evaluate whether IGFBP6 may represent a target to
slowdown OC progression toward drug resistance and characterize
this signaling pathway as a novel source of biomarkers.
Supplementary Material
Supporting Data
Supporting Data
Supporting Data
Supporting Data
Supporting Data
Supporting Data
Supporting Data
Supporting Data
Acknowledgements
Not applicable.
Funding
The present study was supported by the LILT grant 5×1000-2020
(grant no. CUP D79J21003680005) to ML. SV was supported by PON AIM
R&I (National Operational Programme-Attraction and
International Mobility-Research&Innovation) 2014-2020-1879351-3
(grant no. CUP D74I18000160006) and GB was supported by PON AIM
R&I (National Operational Programme-Attraction and
International Mobility-Research&Innovation) 2014-2020-1879351-2
(grant no. CUP D74I18000140006). This manuscript has been published
with the financial support of the Dept. of Medical and Surgical
Sciences of the University of Foggia.
Availability of data and materials
Gene expression data generated in this study are
available at the GEO repository under accession number GSE189717
(https://www.ncbi.nlm.nih.gov/geo/query/acc.cgi?acc=GSE189717).
Authors' contributions
ML and AL designed the study. AP, VC, MP, FC and SV
performed the experiments. AP, VC, FC, ARDC, GB, GC, GG and DT
analyzed the data. AP and VC confirmed the authenticity of the raw
data. ML and AP wrote the manuscript. AL, SV, GB, GG, VC, FC, MP
and DT revised the paper. All authors approved the final version of
the manuscript.
Ethics approval and consent to
participate
Not applicable.
Patient consent for publication
Not applicable.
Competing interests
The authors declare that they have no competing
interests.
References
|
1
|
Gaona-Luviano P, Medina-Gaona LA and
Magaña-Pérez K: Epidemiology of ovarian cancer. Chin Clin Oncol. 9.
pp. 472020, View Article : Google Scholar : PubMed/NCBI
|
|
2
|
Torre LA, Islami F, Siegel RL, Ward EM and
Jemal A: Global cancer in women: Burden and trends. Cancer
Epidemiol Biomarkers Prev. 26:444–457. 2017. View Article : Google Scholar : PubMed/NCBI
|
|
3
|
Bach LA: IGF-binding proteins. J Mol
Endocrinol. 61:T11–T28. 2018. View Article : Google Scholar : PubMed/NCBI
|
|
4
|
Firth SM and Baxter RC: Cellular actions
of the insulin-like growth factor binding proteins. Endocr Rev.
23:824–854. 2002. View Article : Google Scholar : PubMed/NCBI
|
|
5
|
Baxter RC: IGF binding proteins in cancer:
Mechanistic and clinical insights. Nat Rev Cancer. 14:329–341.
2014. View
Article : Google Scholar : PubMed/NCBI
|
|
6
|
Bach LA, Fu P and Yang Z: Insulin-like
growth factor-binding protein-6 and cancer. Clin Sci (Lond).
124:215–229. 2013. View Article : Google Scholar : PubMed/NCBI
|
|
7
|
Walker G, MacLeod K, Williams ARW, Cameron
DA, Smyth JF and Langdon SP: Insulin-like growth factor binding
proteins IGFBP3, IGFBP4, and IGFBP5 predict endocrine
responsiveness in patients with ovarian cancer. Clin Cancer Res.
13:1438–1444. 2007. View Article : Google Scholar : PubMed/NCBI
|
|
8
|
Bahrani-Mostafavi Z, Tickle TL, Zhang J,
Bennett KE, Vachris JC, Spencer MD, Mostafavi MT and Tait DL:
Correlation analysis of HOX, ERBB and IGFBP family gene expression
in ovarian cancer. Cancer Invest. 26:990–998. 2008. View Article : Google Scholar : PubMed/NCBI
|
|
9
|
Yang Z and Bach LA: Differential effects
of insulin-like growth factor binding protein-6 (IGFBP-6) on
migration of two ovarian cancer cell lines. Front Endocrinol
(Lausanne). 5:2312015. View Article : Google Scholar : PubMed/NCBI
|
|
10
|
Amutha P and Rajkumar T: Role of
insulin-like growth factor, insulin-like growth factor receptors,
and insulin-like growth factor-binding proteins in ovarian cancer.
Indian J Med Paediatr Oncol. 38:198–206. 2017.PubMed/NCBI
|
|
11
|
Oliva CR, Halloran B, Hjelmeland AB,
Vazquez A, Bailey SM, Sarkaria JN and Griguer CE: IGFBP6 controls
the expansion of chemoresistant glioblastoma through paracrine
IGF2/IGF-1R signaling. Cell Commun Signal. 16:612018. View Article : Google Scholar : PubMed/NCBI
|
|
12
|
Langdon SP, Lawrie SS, Hay FG, Hawkes MM,
McDonald A, Hayward IP, Schol DJ, Hilgers J, Leonard RC and Smyth
JF: Characterization and properties of nine human ovarian
adenocarcinoma cell lines. Cancer Res. 48:6166–6172.
1988.PubMed/NCBI
|
|
13
|
Livak KJ and Schmittgen TD: Analysis of
relative gene expression data using real-time quantitative PCR and
the 2(−Delta Delta C (T)) method. Methods. 25:402–408. 2001.
View Article : Google Scholar : PubMed/NCBI
|
|
14
|
Avolio R, Järvelin AI, Mohammed S,
Agliarulo I, Condelli V, Zoppoli P, Calice G, Sarnataro D, Bechara
E, Tartaglia GG, et al: Protein syndesmos is a novel RNA-binding
protein that regulates primary cilia formation. Nucleic Acid Res.
46:12067–12086. 2018.PubMed/NCBI
|
|
15
|
Zhao B. Erwin A and Xue B: How many
differentially expressed genes: A perspective from the comparison
of genotypic and phenotypic distances. Genomics. 110:67–73. 2018.
View Article : Google Scholar : PubMed/NCBI
|
|
16
|
Yu G, Wang LG, Han Y and He QY:
clusterProfiler: An R package for comparing biological themes among
gene clusters. OMICS. 16:284–287. 2012. View Article : Google Scholar : PubMed/NCBI
|
|
17
|
Subramanian A, Tamayo P, Mootha VK,
Mukherjee S, Ebert BL, Gillette MA, Paulovich A, Pomeroy SL, Golub
TR, Lander ES and Mesirov JP: Gene set enrichment analysis: A
knowledge-based approach for interpreting genome-wide expression
profiles. Proc Natl Acad Sci USA. 102:15545–50. 2005. View Article : Google Scholar : PubMed/NCBI
|
|
18
|
Liberzon A, Subramanian A, Pinchback R,
Thorvaldsdóttir H, Tamayo P and Mesirov JP: Molecular signatures
database (MSigDB) 3.0. Bioinformatics. 27:1739–1740. 2011.
View Article : Google Scholar : PubMed/NCBI
|
|
19
|
R Core Team R, . A language and
environment for statistical computing. R Foundation for Statistical
Computing; Vienna, Austria: 2020
|
|
20
|
Ritchie ME, Phipson B, Wu D, Hu Y, Law CW,
Shi W and Smyth GK: Limma powers differential expression analyses
for RNA-sequencing and microarray studies. Nucleic Acids Res.
43:e472015. View Article : Google Scholar : PubMed/NCBI
|
|
21
|
Bartha A and Győrffy B: TNMplot.com: A web
tool for the comparison of gene expression in normal, tumor and
metastatic tissues. Int J Mol Sci. 22:26222021. View Article : Google Scholar : PubMed/NCBI
|
|
22
|
Tang Z, Li C, Kang B, Gao G, Li C and
Zhang Z: GEPIA: A web server for cancer and normal gene expression
profiling and interactive analyses. Nucleic Acids Research.
45:W98–W102. 2017. View Article : Google Scholar : PubMed/NCBI
|
|
23
|
Guo YJ, Pan WW, Liu SB, Shen ZF, Xu Y and
Hu LL: ERK/MAPK signalling pathway and tumorigenesis. Exp Ther Med.
19:1997–2007. 2020.PubMed/NCBI
|
|
24
|
Fujioka S, Son K, Onda S, Schmidt C,
Scrabas GM, Okamoto T, Fujita T, Chiao PJ and Yanaga K:
Desensitization of NFκB for overcoming chemoresistance of
pancreatic cancer cells to TNF-α or paclitaxel. Anticancer Res.
32:4813–4821. 2012.PubMed/NCBI
|
|
25
|
Tothill RW, Tinker AV, George J, Brown R,
Fox SB, Lade S, Johnson DS, Trivett MK, Etemadmoghadam D, Locandro
B, et al: Novel molecular subtypes of serous and endometrioid
ovarian cancer linked to clinical outcome. Clin Cancer Res.
14:5198–5208. 2008. View Article : Google Scholar : PubMed/NCBI
|
|
26
|
Drivdahl RH, Sprenger C, Trimm K and
Plymate SR: Inhibition of growth and increased expression of
insulin-like growth factor-binding protein-3 (IGFBP-3) and −6 in
prostate cancer cells stably transfected with antisense IGFBP-4
complementary deoxyribonucleic acid. Endocrinology. 142:1990–1998.
2001. View Article : Google Scholar : PubMed/NCBI
|
|
27
|
Nordqvist AC and Mathiesen T: Expression
of IGF-II, IGFBP-2, −5, and −6 in meningiomas with different brain
invasiveness. J Neurooncol. 57:19–26. 2002. View Article : Google Scholar : PubMed/NCBI
|
|
28
|
Cacalano NA, Le D, Paranjpe A, Wang MY,
Fernandez A, Evazyan T, Park NH and Jewett A: Regulation of IGFBP6
gene and protein is mediated by the inverse expression and function
of c-jun N-terminal kinase (JNK) and NFkappaB in a model of oral
tumor cells. Apoptosis. 13:1439–1449. 2008. View Article : Google Scholar : PubMed/NCBI
|
|
29
|
Gunawardana CG, Kuk C, Smith CR, Batruch
I, Soosaipillai A and Diamandis EP: Comprehensive analysis of
conditioned media from ovarian cancer cell lines identifies novel
candidate markers of epithelial ovarian cancer. J Proteome Res.
8:4705–4713. 2009. View Article : Google Scholar : PubMed/NCBI
|
|
30
|
Zheng R, Chen W, Xia W, Zheng J and Zhou
Q: The prognostic values of the insulin-like growth factor binding
protein family in ovarian cancer. Biomed Res Int. 2020:76587822020.
View Article : Google Scholar : PubMed/NCBI
|
|
31
|
Pavlakis G, Mountzios G, Terpos E,
Leivaditou A, Papadopoulos G and Papasavas P: Recurrent ovarian
cancer metastatic to the sternum, costae, and thoracic wall after
prolonged treatment with platinum-based chemotherapy: A case report
and review of the literature. Int J Gynecol Cancer. 16 (Suppl
1):S299–S303. 2006. View Article : Google Scholar : PubMed/NCBI
|
|
32
|
Vergote I, Tropé CG, Amant F, Kristensen
GB, Ehlen T and Johnson N: Neoadjuvant chemotherapy or primary
surgery in stage IIIC or IV ovarian cancer. N Engl J Med.
363:943–953. 2010. View Article : Google Scholar : PubMed/NCBI
|
|
33
|
Lisio MA, Fu L, Goyeneche A, Gao ZH and
Telleria C: High-grade serous ovarian cancer: Basic Sciences,
clinical and therapeutic standpoints. Int J Mol Sci. 20:9522019.
View Article : Google Scholar : PubMed/NCBI
|
|
34
|
Bach LA: Recent insights into the actions
of IGFBP-6. J Cell Commun Signal. 9:189–200. 2015. View Article : Google Scholar : PubMed/NCBI
|
|
35
|
Liso A, Capitanio N, Gerli R and Conese M:
From fever to immunity: A new role for IGFBP-6? J Cell Mol Med.
22:4588–4596. 2018. View Article : Google Scholar : PubMed/NCBI
|
|
36
|
Bach LA: Current ideas on the biology of
IGFBP-6: More than an IGF-II inhibitor? Growth Horm IGF Res.
30-31:81–86. 2016. View Article : Google Scholar : PubMed/NCBI
|
|
37
|
Fu P, Liang GJ, Khot SS, Phan R and Bach
LA: Cross-talk between MAP kinase pathways is involved in
IGF-independent, IGFBP-6-induced Rh30 rhabdomyosarcoma cell
migration. J Cell Physiol. 224:636–643. 2010. View Article : Google Scholar : PubMed/NCBI
|
|
38
|
Plotnikov A, Zehorai E, Procaccia S and
Seger R: The MAPK cascades: Signaling components, nuclear roles and
mechanisms of nuclear translocation. Biochim Biophys Acta.
1813:1619–1633. 2011. View Article : Google Scholar : PubMed/NCBI
|
|
39
|
Heinrich PC, Behrmann I, Haan S, Hermanns
HM, Müller-Newen G and Schaper F: Principles of interleukin
(IL)-6-type cytokine signalling and its regulation. Biochem J.
374:1–20. 2003. View Article : Google Scholar : PubMed/NCBI
|
|
40
|
Amoroso MR, Matassa DS, Agliarulo I,
Avolio R, Maddalena F, Condelli V, Landriscina M and Esposito F:
Stress-adaptive response in ovarian cancer drug resistance: Role of
TRAP1 in oxidative metabolism-driven inflammation. Adv Protein Chem
Struct Biol. 108:163–198. 2017. View Article : Google Scholar : PubMed/NCBI
|
|
41
|
Wang Y, Niu XL, Qu Y, Wu J, Zhu YQ and Sun
WJ: Autocrine production of interleukin-6 confers cisplatin and
paclitaxel resistance in ovarian cancer cells. Cancer Lett.
295:110–123. 2010. View Article : Google Scholar : PubMed/NCBI
|
|
42
|
Matassa DS, Amoroso MR, Lu H, Avolio R,
Arzeni D, Procaccini C, Faicchia D, Maddalena F, Simeon V,
Agliarulo I, et al: Oxidative metabolism drives
inflammation-induced platinum resistance in human ovarian cancer.
Cell Death Differ. 23:1542–1554. 2016. View Article : Google Scholar : PubMed/NCBI
|
|
43
|
Farolfi A, Scarpi E, Greco F, Bergamini A,
Longo L, Pignata S, Casanova C, Cormio G, Bologna A, Orditura M, et
al: Inflammatory indexes as predictive factors for platinum
sensitivity and as prognostic factors in recurrent epithelial
ovarian cancer patients: A MITO24 retrospective study. Sci Rep.
10:181902020. View Article : Google Scholar : PubMed/NCBI
|
|
44
|
Zhao Q, Zhong J, Lu P, Feng X, Han Y, Ling
C, Guo W, Zhou W and Yu F: DOCK4 is a platinum-chemosensitive and
prognostic-related biomarker in ovarian cancer. PPAR Res.
2021:66298422021. View Article : Google Scholar : PubMed/NCBI
|
|
45
|
Grabosch S, Bulatovic M, Zeng F, Ma T,
Zhang L, Ross M, Brozick J, Fang Y, Tseng G, Kim E, et al:
Cisplatin-induced immune modulation in ovarian cancer mouse models
with distinct inflammation profiles. Oncogene. 38:2380–2393. 2019.
View Article : Google Scholar : PubMed/NCBI
|
|
46
|
Browning L, Patel MR, Horvath EB, Tawara K
and Jorcyk CL: IL-6 and ovarian cancer: Inflammatory cytokines in
promotion of metastasis. Cancer Manag Res. 10:6685–6693. 2018.
View Article : Google Scholar : PubMed/NCBI
|