Introduction
Colorectal cancer (CRC) can be classified into
mismatch repair-deficient (dMMR) and mismatch repair-proficient
(pMMR) subtypes (1). dMMR CRC is
characterized by a high tumor mutational burden (TMB) and high
infiltration rates of activated CD8+ cytotoxic T
lymphocytes (CTLs) (2). These
features contribute to the generally superior therapeutic outcomes
of immunotherapy, including immune checkpoint inhibitors (ICIs), in
patients with dMMR CRC (3).
Compared with dMMR CRC, pMMR CRC exhibits a low TMB and few
tumor-infiltrating lymphocytes, leading to immune tolerance and
evasion in the tumor microenvironment (4). However, previous studies have shown
that immune cell infiltration can be used for the subtype
classification of CRC regardless of MMR protein expression
(5,6), since a fraction of pMMR CRCs are also
relatively immunogenic (2). As
pMMR CRCs with high TMB can potentially respond to ICIs (7), it is reasonable to assess the immune
response status based on MMR protein expression in combination with
other biomarkers capable of evaluating immune reactions in the
tumor microenvironment, such as a scoring system from
immunohistochemistry (8).
Although the methods used for assessing MMR protein
expression, TMB and for determining the number of
tumor-infiltrating T cells (TITs) are similar, each one focuses on
a different aspect of tumor biology. MMR protein expression
analysis and TMB tests can be used to indicate the tumor mutation
load, which can lead to immune cell recruitment (9). By contrast, TITs are indicative of
the host immune response to the tumor (10). Therefore, the present study
evaluated whether MMR protein expression alone is a viable and
precise tool for assessing immunogenicity in the tumor
microenvironment when combined with TIT analysis and TMB
testing.
Materials and methods
Patients and samples
All 73 patients (mean age, 71.4±10.4 years; female,
n=33; male, n=40) enrolled into this study were diagnosed with CRC
and underwent surgical treatment at the Kurume University Hospital
(Kurume, Japan) between January and December 2017. All of the
resected tumor samples were immersed in a solution of 10%
neutral-buffered formalin for about 18–24 h at room temperature and
were collected, dehydrated with ethanol, infiltrated with paraffin
wax, embedded into paraffin at 60°C and then cooled to become
formalin fixed, paraffin embedded (FFPE) tissue blocks. Patients
who underwent preoperative chemotherapy/chemoradiotherapy or had
multiple cancers were excluded. Clinical data, including age, sex
and anatomical tumor location, were obtained from the Kurume
University Hospital pathology databases. Postoperative pathological
staging of the resected specimens was conducted according to the
seventh edition of the Tumor, Node, and Metastasis classification
scheme of the Union for International Cancer Control (UICC)
(11). The surgeons involved in
the study reviewed patient medical records for information
regarding their clinical outcomes and pathology records. Informed
consent was obtained from all 73 patients enrolled in the present
study, which was conducted in accordance with the provisions of The
Declaration of Helsinki and approved by the institutional ethical
review board of Kurume University Hospital (approval no. 388).
Analysis of MMR protein
expression
MMR protein expression was assessed using a
four-antibody immunohistochemical assay targeting MutL homolog 1
(MLH1 clone; ES05; cat. no. M3640), MutS homolog 2
(MSH2 clone; FE11; cat. no. 556349), MutS homolog 6
(MSH6 clone; EP49; cat. no. 287R) and post-meiotic
segregation 1 homolog 2 (PMS2 clone; EP51; cat. no. M3647)
and the DAKO EnVision system (Dako; Agilent Technologies, Inc.), as
previously described (12). The
Autostainer Link 48 and PT link (Agilent Technologies, Inc.) were
used for automated immunostaining system. Tissue sections
(4-µm-thick) were deparaffinized and pretreated with heat-induced
epitope retrieval at 97°C for 20 min at high pH (Target retrieval
solution; diluted 1:50; cat. no. K8023) using PT link (Agilent
Technologies, Inc.). The slides were then incubated with blocking
reagent (Peroxidase-blocking reagent; ready to use; cat. no. SM801)
for 5 min at room temperature. The slides were then incubated with
the following antibodies: MLH1, MSH2, MSH6 and PMS2,
for 30 min at room temperature, and incubated with secondary
antibody (EnvisionFLEX+ LINKER kit; ready to use; cat. no. K8021;
Agilent Technologies, Inc.) for 30 min at room temperature using
Autostainer Link 48. After washing in Tris-buffered saline, the
slides were visualized using 3, 3′-diaminobenzidine (DAB) as the
nuclear stain. All IHC results were evaluated using a light
microscope. Loss of MMR proteins expression was defined as the
absence of nuclear expression in tumor cells in five fields of view
compared with positive nuclear expression in corresponding normal
epithelial cells. Patients showing loss of expression for ≥ one of
MMR proteins in the tumor epithelium would be diagnosed as CRC with
dysfunctional MMR (dMMR CRC).
Analysis of T-cell densities
FFPE tissue sections (4-µm thick) were prepared and
placed on coated glass slides. The tissue sections were labeled
with antibodies using the fully automated Bond-III autostainer
(Leica Microsystems, Ltd.) as previously described (12). Primary antibodies against
CD3+ (clone LN10; diluted 1:300; cat. no.
NCL-L-CD3-565; Leica Microsystems, Ltd.) and CD8+
(clone 4B11; diluted 1:200; cat. no. NCL-L-CD8-4B11; Leica
Microsystems, Ltd.) were used for immunostaining. Tissue sections
were deparaffinized using dewax solution (ready to use; cat. no.
AR9222; Leica Microsystems, Ltd.), and the slides were then
incubated with blocking reagent (peroxidase-blocking reagent; 3–4%
hydrogen peroxide solution), including a Refine polymer detection
system (ready to use; cat. no. DS9800; Leica Microsystems, Ltd.)
for 5 min at room temperature (~25°C). CD3+ and
CD8+ antibodies were heat-treated using epitope
retrieval solution 2 (pH 9.0) for 20 min at 99°C, and incubated
with CD3+ and CD8+ as primary
antibodies for 15 min at room temperature (~25°C). This automated
system used a Refine polymer detection system with HRP (Horseradish
peroxidase)-polymer as secondary antibody and DAB as the nuclear
stain, and incubated with secondary antibody for 8 min at room
temperature (~25°C). The slides were visualized using DAB. Fig. S1 shows representative images of
immunohistochemical staining of CD3+ and
CD8+ in the center of the tumor (CT) and the
invasive margin (IM).
All stained slides were scanned and digitized using
a NanoZoomer 2.0-HT: C9600-13 slide scanner (Hamamatsu Photonics
KK). The scanned images were analyzed using the NDP.view2 viewing
software (Hamamatsu Photonics KK). In, total, five areas in each of
the CT and the IM were captured (magnification, ×200) and stored as
JPEG images. The captured images were processed using the ImageJ
software (version 1.50i) (13) to
quantify CD3+ and CD8+ cells in
the tissue specimens, as previously described (12). HUGO Gene Nomenclature
Committee-approved symbols and root symbols are used for genes and
gene families, including BRCA, CD3, CD8, MLH1, MSH2, MSH6, PDCD1,
PMS2, POLD, POLD1, POLD2, POLE and RAD; all of which are described
at www.genenames.org. Italicized gene
symbols indicate gene names and non-italicized gene symbols
indicate gene product names (14).
Evaluation of the number of TITs
After the quantified values of numbers of
CD3+ and CD8+ cells in CT and
IM were obtained, the median values of each marker in CT and IM
were calculated. According to each CD3+ and
CD8+ median value, following
high-CD3+, low-CD3+,
high-CD8+ and low-CD8+ in each
CT and IM could be determined. Low-CD3+ or low-CD8+ was 0 points
and 1 point was given to high-CD3+ or high-CD8+ in each CT and IM.
TIT score (from I0 to I4) was acquired from the total points of CT
and IM that were determined with each CD3 and CD8 status (8,12,15).
Analysis of TMB
DNA was extracted from specimens that had been
cryopreserved following excision using the AllPrep DNA/RNA/Protein
Mini kit (Qiagen GmbH) according to the manufacturer's protocols.
TMB analysis was performed using the Oncomine™ Tumor
Mutation Load Assay (cat. no. A37909; Thermo Fisher Scientific,
Inc.), which is a PCR-based next-generation sequencing (NGS) assay.
For each sample's quality test, TM Qubit M dsDNA BR Assay kit
(Thermo Fisher Scientific) was utilized. TaqMan M Universal PCR
Master Mix (Thermo Fisher Scientific) and TaqMan M RNase P
Detection Reagents (Thermo Fisher Scientific) were used to confirm
amplification and fragmentation by quantitative qPCR. Each sample
was confirmed to have a Qubit quantitative concentration/qPCR
quantitative concentration value ≥0.5.
Library preparation required 200 ng input DNA
extracted from frozen specimens. This multi-gene target sequencing
panel covers 1.7 megabases (Mb) of 409 genes, which are known to be
associated with cancer development, including 1.2 Mb exonic and
0.45 Mb intronic regions. The panel consists of 15,513 PCR targets
that are evenly distributed in two pools. The Agilent SureSelect
Human All Exon V5 kit (Agilent Technologies, Inc.; with-50 Mb
panel) was used for target capture from 200 ng input DNA followed
by sequencing on HiSeqX (Illumina, Inc.). All single base
substitutions with allele frequency ≥5% were considered. TMB was
defined as the number of nonsynonymous somatic mutations per Mb
(muts/Mb), including missense and nonsense point mutations, in the
exonic genome regions examined. Germline variants were removed
using a germline filter chain based on information in population
databases (1000 Genome Project (https://www.internationalgenome.org/), NHLBI GO Exome
Sequencing Project (https://esp.gs.washington.edu/drupal/), and ExAC;
http://gnomad.broadinstitute.org/).
After computational germline mutation filtering, reads were aligned
to hg19 using Torrent Suite 5.8 and BAM files were transferred to
Ion Reporter 5.1 for variant calling and secondary analysis,
including TMB calculation, which is an analysis workflow optimized
mapping and variant calling parameters. This method was previously
validated for accuracy in whole-exome sequencing (16). Patients with available TMB data
were divided into two groups. Those with TMB ≥10 muts/Mb were
classified into the TMB-H group, whereas those with TMB <10
muts/Mb were classified in the TMB-L group (17).
TMB analysis was performed on the 12 of the 73 cases
which had sufficient frozen tumor tissue. TMB analysis was
performed for 12 cases in total, including three dMMR cases with a
high number of TITs (dMMR/TIT-H), two dMMR cases with a low number
of TITs (dMMR/TIT-L), four pMMR cases with TIT-H (pMMR/TIT-H) and
three pMMR cases with TIT-L(pMMR/TIT-L).
Statistical analysis
All statistical analyses were conducted using the
JMP software (version 13.0; SAS Institute, Inc.). P-values were
determined using two-sided tests, with a two-sided α level of 0.05
used as the threshold for statistical significance. Age was
analyzed with the Wilcoxon rank sum test. The χ2 test was used to
evaluate association among MMR protein expression, the number of
TITs and clinicopathological characteristics. Fisher's exact test
was used for the analysis of characteristics between dMMR and pMMR
in Table I, the analysis of
associations between MMR protein expression and the number of TITs
in Table II, and the analysis of
characteristics for TIT-H and TIT-L in Table III. Spearman's correlation
analysis was used to analyze correlations between TMB and T-cell
densities.
 | Table I.Characteristics of patients with
colorectal cancer according to their MMR protein expression and the
number of TITs. |
Table I.
Characteristics of patients with
colorectal cancer according to their MMR protein expression and the
number of TITs.
|
|
| MMR-protein
expression |
|
|
|
|
|---|
|
|
|
|
| Number of TITs |
|
|---|
|
|
|
|
|
|
|
|
|---|
|
Characteristicsa | Total (n=73) | MMR-proficient
(n=63) | MMR- deficient
(n=10) | P-values | TIT-low (n=41) | TIT-high
(n=32) | P-values |
|---|
| Sex |
|
|
| 0.036b |
|
| 0.46c |
|
Male | 40 (54.8%) | 38 (60.3%) | 2 (20.0%) |
| 24 (58.8%) | 16 (50.0%) |
|
|
Female | 33 (45.2%) | 25 (39.7%) | 8 (80.0%) |
| 17 (41.2%) | 16 (50.0%) |
|
| Mean ± SD age,
years |
| 70.9±10.1 | 74.7±12.4 | 0.32d | 70.4±10.6 | 72.6±10.3 | 0.42d |
| Tumor location |
|
|
| 0.006b |
|
| 0.085c |
| Distal
(descending colon to rectum) | 51 (69.9%) | 48 (76.2%) | 3 (30.0%) |
| 32 (78.1%) | 19 (59.4%) |
|
|
Proximal (cecum to splenic
flexure) | 22 (30.1%) | 15 (23.8%) | 7 (70.0%) |
| 9 (21.9%) | 13 (40.6%) |
|
| pT stage (depth of
tumor invasion) |
|
|
| 0.71b |
|
| 0.38c |
| T1-2
(submucosa or muscularis propria) | 21 (29.2%) | 19 (30.6%) | 2 (20.0%) |
| 10 (25.0%) | 11 (34.4%) |
|
| T3-4
(subserosa or serosa or other organs) | 51 (70.8%) | 43 (69.4%) | 8 (80.0%) |
| 30 (75.0%) | 21 (65.6%) |
|
| pN stage (number of
positive lymph nodes) |
|
|
| 0.74b |
|
| 0.11c |
| N0
(0) | 38 (52.1%) | 32 (50.8%) | 6 (60.0%) |
| 18 (43.9%) | 20 (62.5%) |
|
| N1-3
(≥1) | 35 (47.9%) | 31 (49.2%) | 4 (40.0%) |
| 23 (56.1%) | 12 (37.5%) |
|
| Union for
International Cancer |
|
|
| 0.62c |
|
| 0.04c |
| Control disease
stage |
|
|
|
|
|
|
|
| Stage
I | 15 (20.5%) | 13 (20.6%) | 2 (20.0%) |
| 7 (17.1%) | 8 (25.0%) |
|
| Stage
II | 20 (27.4%) | 16 (25.4%) | 4 (40.0%) |
| 8 (19.5%) | 12 (37.5%) |
|
| Stage
III | 27 (37.0%) | 25 (39.7%) | 2 (20.0%) |
| 16 (39.0%) | 11 (34.4%) |
|
| Stage
IV | 11 (15.1%) | 9 (14.3%) | 2 (20.0%) |
| 10 (24.4%) | 1 (3.1%) |
|
| Tumor
differentiation |
|
|
| 0.01b |
|
| 0.008c |
|
Well-moderate | 65 (89.0%) | 59 (93.7%) | 6 (60.0%) |
| 40 (97.6%) | 25 (78.2%) |
|
|
Poor | 8 (11.0%) | 4 (6.3%) | 4 (40.0%) |
| 1 (2.4%) | 7 (21.8%) |
|
| Lymphatic
invasion |
|
|
| 1.0b |
|
| 0.54c |
|
Negative | 45 (61.6%) | 39 (61.9%) | 6 (60.0%) |
| 24 (58.5%) | 21 (65.6%) |
|
|
Positive | 28 (38.4%) | 24 (38.1%) | 4 (40.0%) |
| 17 (41.5%) | 11 (34.4%) |
|
| Venous
invasion |
|
|
| 0.71b |
|
| 0.23c |
|
Negative | 22 (30.1%) | 20 (31.7%) | 2 (20.0%) |
| 10 (24.4%) | 12 (37.5%) |
|
|
Positive | 51 (69.9%) | 43 (68.3%) | 8 (80.0%) |
| 31 (75.6%) | 20 (62.5%) |
|
| Table II.Association between MMR protein
expression and the number of TITs. |
Table II.
Association between MMR protein
expression and the number of TITs.
|
| MMR proteins
expressiona |
|
|---|
|
|
|
|
|---|
| Number of TITs | MMR-proficient
(n=63) (%) | MMR-deficient
(n=10) (%) |
P-valueb |
|---|
|
|
|
| 0.32 |
| Low (n=41) | 37 (58.7) | 4 (40.0) |
|
| High (n=32) | 26 (41.2) | 6 (60.0) |
|
| Table III.Characteristics of patients with
colorectal cancer according to MMR protein expression and the
number of TITs. |
Table III.
Characteristics of patients with
colorectal cancer according to MMR protein expression and the
number of TITs.
|
| MMR-proficient |
| MMR-deficient |
|
|---|
|
|
|
|
|
|
|---|
|
Characteristicsa | TIT-low (n=37) | TIT-high
(n=26) | P-value | TIT-low (n=4) | TIT-high (n=6) | P-value |
|---|
| Sex |
|
| 0.72b |
|
| 1.0c |
|
Male | 23 (62.2%) | 15 (57.7%) |
| 1 (25.0%) | 1 (16.7%) |
|
|
Female | 14 (37.8%) | 11 (42.3%) |
| 3 (75.0%) | 5 (83.3%) |
|
| Mean ± SD age,
years | 70.4±10.5 | 71.5±9.7 | 0.34d | 70.5±12.8 | 77.5±12.5 | 0.34d |
| Tumor location |
|
| 0.28b |
|
| 0.5c |
| Distal
(descending colon to rectum) | 30 (81.1%) | 18 (69.2%) |
| 2 (50.0%) | 1 (16.7%) |
|
|
Proximal (cecum to splenic
flexure) | 7 (18.9%) | 8 (30.8%) |
| 2 (50.0%) | 5 (83.3%) |
|
| pT stage (depth of
tumor invasion) |
|
| 0.56b |
|
| 0.47c |
| T1-2
(submucosa or muscularis propria) | 10 (27.8%) | 9 (34.6%) |
| 0 (0%) | 2 (33.3%) |
|
| T3-4
(subserosa or serosa or other organs) | 26 (72.2%) | 17 (65.4%) |
| 4 (100%) | 4 (66.7%) |
|
| pN stage (number of
positive lymph nodes) |
|
| 0.35b |
|
| 0.19c |
| N0
(0) | 17 (45.9%) | 15 (57.7%) |
| 1 (25.0%) | 5 (83.3%) |
|
| N1-3
(≥1) | 20 (54.1%) | 11 (42.3%) |
| 3 (75.0%) | 1 (16.7%) |
|
| Union for
International Cancer |
|
| 0.17b |
|
| 0.18b |
| Control disease
stage |
|
|
|
|
|
|
| Stage
I | 7 (18.9%) | 6 (23.1%) |
| 0 (0%) | 2 (33.3%) |
|
| Stage
II | 7 (18.9%) | 9 (34.6%) |
| 1 (25.0%) | 3 (50.0%) |
|
| Stage
III | 15 (40.6%) | 10 (38.4%) |
| 1 (25.0%) | 1 (16.7%) |
|
| Stage
IV | 8 (21.6%) | 1 (3.9%) |
| 2 (50.0%) | 0 (0%) |
|
| Tumor
differentiation |
|
| 0.025c |
|
| 0.57c |
|
Well-moderate | 37 (100%) | 22 (84.6%) |
| 3 (75.0%) | 3 (50.0%) |
|
|
Poor | 0 (0%) | 4 (15.4%) |
| 1 (25.0%) | 3 (50.0%) |
|
| Lymphatic
invasion |
|
| 0.63b |
|
| 1.0c |
|
Negative | 22 (59.5%) | 17 (65.4%) |
| 2 (50.0%) | 4 (66.7%) |
|
|
Positive | 15 (40.5%) | 9 (34.6%) |
| 2 (50.0%) | 2 (33.3%) |
|
| Venous
invasion |
|
| 0.34b |
|
| 0.47c |
|
Negative | 10 (27.0%) | 10 (38.5%) |
| 0 (0%) | 2 (33.3%) |
|
|
Positive | 27 (73.0%) | 16 (61.5%) |
| 4 (100.0%) | 4 (66.7%) |
|
Results
Characteristics of patients with CRC
according to their MMR protein expression and the number of
TITs
The present study investigated 73 patients with CRC
and available clinicopathological data, including MMR protein
expression and the number of TITs. In total, 10/73 patients (13.7%)
were diagnosed with dMMR CRC, whereas 32/73 patients (43.8%) were
assessed as having CRC with TIT-H. Table I summarizes the clinical,
pathological and molecular characteristics according to MMR protein
expression and the number of TITs. dMMR was positively associated
with female sex (P=0.04), a proximal-sided tumor location (P=0.006)
and histologically poor differentiation (P=0.01). TIT-H was
positively associated with histologically poor differentiation
(P=0.02) and inversely associated with an advanced disease stage
according to the UICC staging system (P=0.04).
Association between MMR protein
expression and the number of TITs
Table II and
Fig. S2 show the association
between MMR protein expression and the number of TITs. Although the
frequency of TIT-H was higher in the dMMR group (60%) compared with
that in the pMMR group (41.2%), 40% of the patients in the dMMR
group were TIT-L. However, the association between MMR protein
expression and the number of TITs was not statistically significant
(P=0.32).
Table III shows
that the clinicopathological characteristics tested, namely age,
sex, pathological depth of invasion and lymph node metastasis, were
not statistically different between the dMMR/TIT-H and dMMR/TIT-L
groups. In the pMMR group, pMMR/TIT-H was associated with poor
differentiation compared with pMMR/TIT-L (P=0.025; Table III).
Analysis of association of TMB with
MMR protein expression and the number of TITs
Among the 73 patients, tumor tissues were available
from 12 patients (Table SI).
Therefore, their tumor DNA was subjected to NGS analysis to obtain
the TMB data. The associations of TMB with MMR protein expression
and the number of TITs were subsequently analyzed (Table IV). TMB ranged from 2.51 to 54.7
muts/Mb in all samples. Among the four designated groups, the
median TMB reached the highest value in the dMMR/TIT-H group but
was below <10 muts/Mb in the dMMR/TIT-L, pMMR/TIT-H and
pMMR/TIT-L groups. All cases in the dMMR/TIT-H group were TMB-H,
whereas all the cases in the dMMR/TIT-L group were TMB-L. pMMR was
associated with TMB-L regardless of the TIT number, although one
case in the pMMR/TIT-H group (case ID 6) showed TMB-H. The MMR
protein expression and the number of TITs in the 12 cases were
ranked according to TMB (Fig. 1).
Regarding MMR protein expression, two cases (case IDs 4 and 5),
which showed both TIT-L and TMB-L in the dMMR group, showed
isolated loss of PMS2 expression (Fig. 1). Among the dMMR cases, three cases
with both TIT-H and TMB-H were found. In particular, both
MLH1 and PMS2 expression were lost in three cases
(case IDs 1, 2 and 3; Fig. S3).
Correlation analysis of TMB and TITs revealed that TMB was
associated with the densities of CD3+ and
CD8+ in the CT (CD3+, r=0.76
and P=0.004; CD8+, r=0.76 and P=0.004), but not
in the IM (CD3+, r=0.35 and P=0.25;
CD8+, r=0.35 and P=0.26; Table V; Fig. S4).
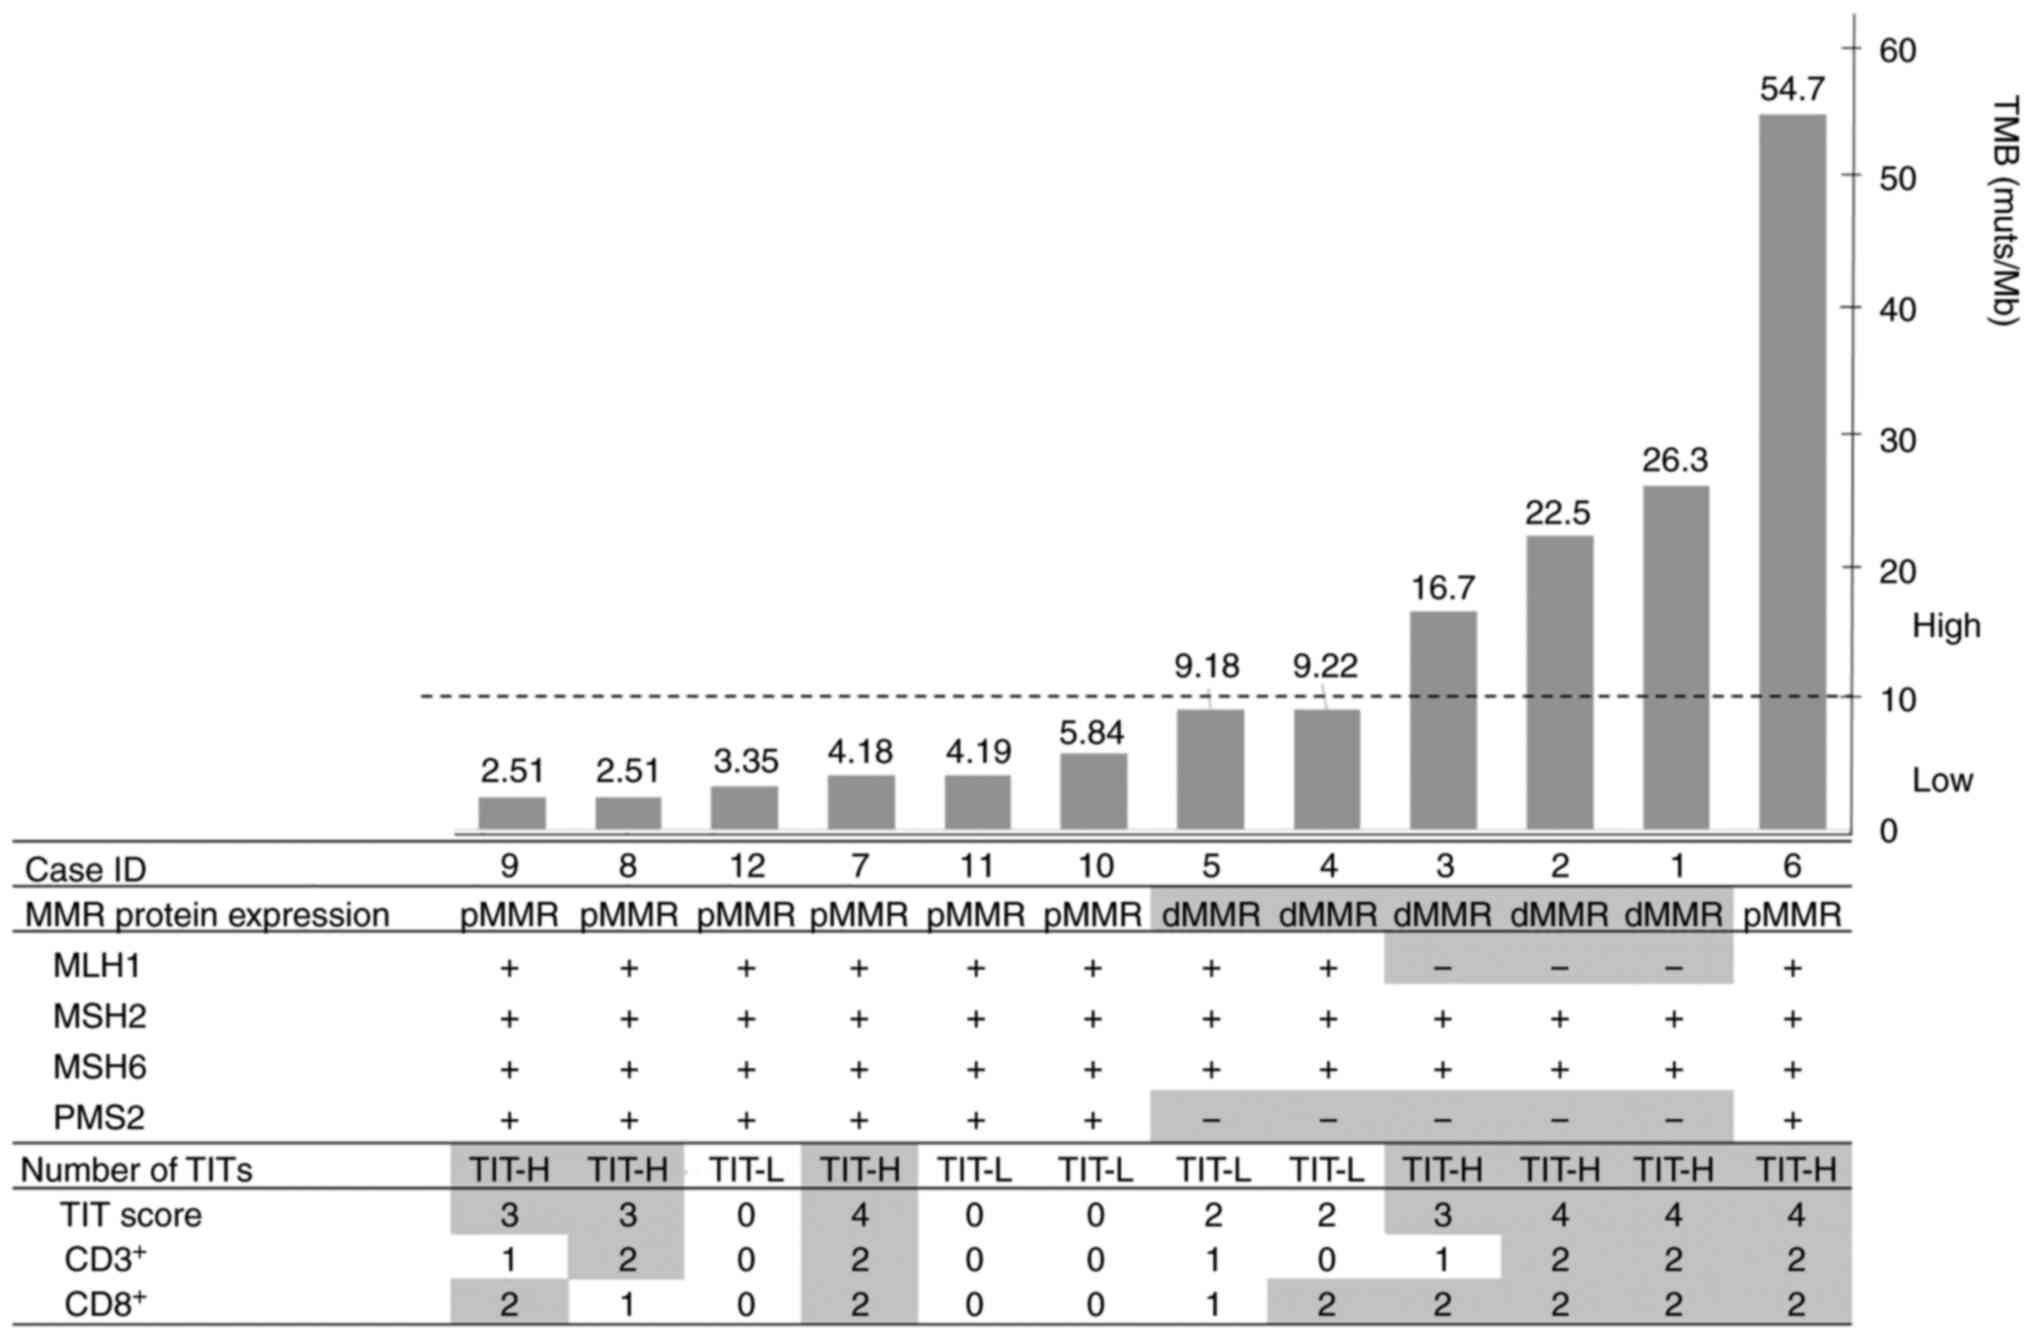 | Figure 1.Association analysis of TMB with MMR
protein expression and the number of TITs. Colorectal cancer cases
were arranged according to TMB levels, the MMR protein expression
status and the number of TITs. The cases were additionally divided
into two groups based on the TMB level, as shown by the dotted
line. The sections highlighted in gray represent dMMR, loss of MMR
protein expression, TIT-H and the high numbers of
CD3+ and 8+ cells in the
figure. TMB-L, TMB <10; TMB-H, TMB ≥10. MMR, mismatch repair;
MLH1, MutL homolog 1; MSH, MutS homolog; PMS2, post-meiotic
segregation 1 homolog 2; dMMR, mismatch repair-deficient; pMMR,
mismatch repair-proficient; TMB, tumor mutational burden; TIT-H,
high number of tumor-infiltrating T cells; TIT-L, low number of
tumor-infiltrating T cells; muts/Mb, mutations per megabases. |
| Table IV.Associations of TMB with MMR proteins
expressions and the number of TITs. |
Table IV.
Associations of TMB with MMR proteins
expressions and the number of TITs.
|
| MMR-proficient | MMR-deficient |
|---|
|
|
|
|
|---|
| Parameter | TIT-low (n=3) | TIT-high (n=4) | TIT-low (n=2) | TIT-high (n=3) |
|---|
| TMBa | 4.2
(3.35-5.84) | 3.35
(2.5-42.1) | 9.2
(9.18-9.22) | 22.5
(16.7-26.3) |
| TMB-low
(n=8)b | 3 | 3 | 2 | 0 |
|
TMB-high (n=4)b | 0 | 1 | 0 | 3 |
| Table V.Correlations between TMB and number
of TITs. |
Table V.
Correlations between TMB and number
of TITs.
|
| TMB |
|---|
|
|
|
|---|
| Type of TITs | ρ(95% CI) |
P-valuea |
|---|
|
CD3+ |
|
|
| CT
(n=12) | 0.76
(0.33-0.93) | 0.036 |
| IM
(n=12) | 0.36
(−0.27-0.77) | 0.66 |
|
CD8+ |
|
|
| CT
(n=12) | 0.76
(0.33-0.93) | 0.027 |
| IM
(n=12) | 0.35
(−0.28-0.77) | 0.47 |
Discussion
The present study evaluated if MMR protein
expression alone could be a viable measure to assess immunogenicity
in the tumor microenvironment, using TIT analyses and TMB tests.
The frequency of TIT-H was higher in the dMMR group compared with
that in the pMMR group, but 40% of dMMR cases were TIT-L. Among the
dMMR cases, three cases with dMMR/TIT-H were TMB-H, whereas the
dMMR/TIT-L group was TMB-L. pMMR was found to be associated with
TMB-L regardless of the number of TITs, although one case in the
pMMR/TIT-H group (case ID 6) showed TMB-H. In total, two cases in
the dMMR group showed both TIT-L and TMB-L cases and isolated loss
of PMS2 expression (case IDs 4 and 5). These findings
suggest that MMR protein expression alone is a rather imprecise
measure for assessing tumor immunogenicity and antitumor immunity
in the tumor microenvironment. Consideration of parameters other
than MMR protein expression, such as the number of TITs and TMB,
may strengthen the assessment of tumor immunogenicity for screening
patients who may benefit from ICI therapy.
dMMR CRCs are caused by MMR dysfunction, which can
result in increased TMB and the generation of neoantigens, which
are antigens resulting from the tumor somatic mutations that confer
tumor immunogenicity and can elicit an antitumor immune response
(9). T cells activated in response
to abundant neoantigens in the tumor microenvironment can suppress
tumor proliferation and progression (4). Therefore, ICIs have exerted effective
responses among dMMR CRCs because of the high immunogenicity in the
tumor microenvironment (3,18). A large-scale case study previously
reported microsatellite instability (MSI)-high (MSI-H) and
immunoscore-low cases in 2.7% (15/550) of all CRC cases tested
(19), suggesting that a fraction
of the patients with MSI-H CRC showing low immune reaction might
show relatively low TMB levels. MMR dysfunction results from a loss
of function in any of the MMR genes encoding the four MMR proteins,
MLH1, MSH2, MSH6 and PMS2. Because MLH1 and
MSH2 are essential for MMR function, their deficiency causes
a large decrease in MMR function (20). While MLH1 mutation
represents loss of both MLH1 and PMS2 protein
expression, PMS2 mutation represents isolated loss of
PMS2 protein expression not loss of MLH1 protein
expression. MLH1 and PMS2 proteins form a
heterodimer, MLH1 protein is a key function of MMR compared
to PMS2 protein. Therefore, isolated PMS2 loss of
expression are due to PMS2 mutation, not MLH1
mutation (21). Moreover, Lynch
syndrome patients harboring PMS2 germline mutation is lower
risk of colorectal cancer incidence (22), which may explain why the isolated
loss of PMS2 results in milder forms of MMR dysfunction and
lower TMB levels (22,23). Therefore, CRC with isolated loss of
PMS2 expression can show reduced TMB levels (22). In the present study, three out of
the five cases in the dMMR group had both high TMB levels and TIT-H
who also showed the loss of either MLH1 or MSH2
expression, whereas the other two showed dMMR/TIT-L with the
isolated loss of PMS2 expression. Although the number of
insertion/deletion variants tend to be more strongly correlated
with tumor-infiltrating lymphocyte (TIL) densities compared with
TMB (24), the MMR protein
expression status and the number of TIT were not found to be
significantly associated with the number of insertion/deletion
variants in this study. Given the association between MMR protein
function and TMB levels (24,25),
CRCs with isolated loss of PMS2 expression show lower levels
of TMB and immune cell infiltration compared with those with
MLH1 and MSH2 expression (26). Accordingly, the present findings
indicated that CRCs with isolated loss of PMS2 expression
showed a lower TMB level and number of TITs showed loss of both
MLH1 and PMS2. This suggests that an MMR protein
expression assay considering the patterns of MMR protein expression
(isolated loss of PMS2 vs. loss of both MLH1 and
PMS2) may provide an improved estimation of the degree of
immunogenicity compared with that of the MSI analysis.
In a number of studies on the ICI treatment of CRCs
with MSI, 85% of CRCs with MSI and low TMB failed to respond to
immune checkpoint blockade (4,28).
In CRCs with microsatellite stability (MSS), TMB-L and a lack of
immune cell infiltration have been posited as mechanisms underlying
immune resistance (5,27). CRCs with MSS have a low mutation
load in tumor cells (29,30) and a low number of presenting
antigens, leading to a lower level of T-cell infiltration in the
tumor microenvironment (4).
However, previous studies have reported that 21–50% of CRCs with
MSS actually showed high T-cell infiltration (19,31,32).
In addition, pMMR CRCs with a high number of TILs showed
therapeutic response to ICIs (30,33),
suggesting that pMMR CRCs harbor antitumor immunogenic potential
and may be therapeutically responsive to ICIs. Although MMR protein
expression can predict immunogenicity, it cannot reflect the number
of TITs. Compared with MMR protein expression, the number of TITs,
such as Immunoscore (a scoring tool used to assess the immune
response by counting the densities of infiltrating
CD3+ and CD8+ T cells at the CT
and IM of colorectal tumors) (31), can serve as a biomarker for
assessing not only immunogenicity, but also responsiveness to ICIs
(34). In line with findings in
previous studies, among the seven cases in the pMMR group, three
cases showed both TIT-L and TMB-L, whereas the remaining four cases
showed TIT-H. These four cases showing both pMMR and TIT-H may have
activated antitumor immunity. Therefore, considering not only MMR
proteins expression, but also additional parameters, such as the
number of TITs and TMB level, may strengthen the tumor
immunogenicity assessment.
The present study had several limitations. Due to
the limited number of CRC tissue samples, only MMR function among
the DNA-repair mechanisms was evaluated, without considering
base-excision repair, nucleotide-excision repair or homologous
recombination (35). Several of
the pMMR CRCs are highly immunogenic owing to dysfunction in the
DNA-repair-related proteins other than those involved in MMR,
including ataxia telangiectasia mutated kinase, ataxia
telangiectasia and Rad3 related kinase, BRCA, DNA polymerase ɛ
(POLE), DNA polymerase δ 1 (POLD1), DNA polymerase δ
2 (POLD2) and RAD (36). Although these CRCs are generally
not of the MSI-H/dMMR subtype, they can also be highly immunogenic
(29,30). In a large CRC cohort study, 3% of
MSS tumors were previously identified to be TMB-H, which harbored
somatic POLE, MSH6 and MSH2 mutations (37). Additionally, MSS tumors with
POLE mutation have demonstrated promising clinical responses
to the anti-PDCD1(PD-1) ICI, nivolumab (38). In the present study, one out of the
seven cases of pMMR CRCs were TMB-H. Therefore, this CRC may harbor
a POLE or POLD1 mutation, although any potential
mutations in these genes were not analyzed. In pMMR CRCs,
DNA-repair dysfunctions other than those associated with MMR genes
can increase immunogenicity, leading to TIT-H (30). Therefore, assessing other
DNA-repair genes, as well as MMR genes according to MMR protein
expression, may be useful for designing and monitoring ICI
treatment regimens. CD3+ and
CD8+ were examined to accurately evaluate
immunogenicity in the present study. However, the presence of
immunosuppressive cells, such as M2 macrophages (M2Ms) and
myeloid-derived suppressor cells (MDSCs), were not examined in the
microenvironment. M2Ms and MDSCs can suppress T-cell infiltration,
leading to immunosuppression (39). In addition, a previous study
reported that pMMR CRCs showed high levels of M2Ms and MDSCs in the
tumor microenvironment (4).
Therefore, accurate evaluation of the tumor immune status,
including M2M and MDSC levels, is warranted in future studies.
Based on the present findings, it cannot conclude that ICI
treatment would be effective for patients with pMMR/TIT-H CRC
because ICI treatment was not given to the patients enrolled in the
present study. Furthermore, a clinical trial was not performed to
determine if the combined analysis of MMR protein expression and
the number of TITs would improve the accuracy in estimating the ICI
response. However, the present study provides preliminary data for
designing future clinical trials. The present study was a
single-center retrospective study with a small cohort size. In
addition, TMB could not be examined in all cases, since the
relevant data were available in only 12 cases. Therefore, the
statistical power of the present study was limited, where larger
sample sizes are required to strengthen the findings. However, the
results were similar to those of large-scale trials (40,41),
supporting the accuracy of the findings.
In conclusion, determining MMR proteins expression
alone may not be a sufficiently precise assay for tumor
immunogenicity and antitumor immunity in the tumor microenvironment
of CRC tumors. Furthermore, the present study suggests that
considering not only MMR proteins expression, but also other
parameters, such as the number of TITs and TMB, may strengthen the
assessment of tumor immunogenicity for the screening of patients
who may benefit from ICI therapy.
Supplementary Material
Supporting Data
Supporting Data
Acknowledgements
Not applicable.
Funding
The present study was supported by the Kurume University
Research Branding Project.
Availability of data and materials
The datasets used and/or analyzed during the current
study are available from the corresponding author on reasonable
request. The datasets generated during and/or analyzed during the
current study are available in the PSUB017737 repository,
https://ddbj.nig.ac.jp/DRASearch/.
Authors' contributions
KF, TSu and TSh took part in conceptualization and
methodology. HN, SN, TSh performed the experiments. FF, HN, TY, SN,
TK and YA obtained and handled colorectal specimens and clinical
data. AK and JA performed the histological examination of the
samples and clinical data. AK, KF, TSu and TSh analyzed the data
and were major contributors in writing the manuscript. FF, JA, TK
and YA confirm the authenticity of all the raw data. HN, TY, SN and
AK organized the tables. KF, TSh and TSu were involved in the
preparation of the figure. TK, FF and YA reviewed and edited the
article. All authors read and approved the final manuscript.
Ethics approval and consent to
participate
The present study was conducted in accordance with
the provisions of The Declaration of Helsinki and approved by the
institutional ethical review board of Kurume University Hospital
(approval no. 388; Kurume, Japan). Informed consent was obtained
from all 73 patients enrolled in the study.
Patient consent for publication
Not applicable.
Competing interests
The authors declare that they have no competing
interests.
Glossary
Abbreviations
Abbreviations:
|
CRC
|
colorectal cancer
|
|
CT
|
center of the tumor
|
|
dMMR
|
mismatch repair-deficient
|
|
FFPE
|
formalin-fixed, paraffin-embedded
|
|
ICI
|
immune checkpoint inhibitor
|
|
IM
|
invasive margin
|
|
MDSC
|
myeloid-derived suppressor cell
|
|
Mb
|
megabases
|
|
M2M
|
M2 macrophage
|
|
MMR
|
mismatch repair
|
|
MSI
|
microsatellite instability
|
|
NGS
|
next-generation sequencing
|
|
pMMR
|
mismatch repair-proficient
|
|
TIT
|
tumor-infiltrating T cell
|
|
TMB
|
tumor mutational burden
|
|
UICC
|
Union for International Cancer
Control
|
References
|
1
|
Llosa NJ, Cruise M, Tam A, Wicks EC,
Hechenbleikner EM, Taube JM, Blosser RL, Fan H, Wang H, Luber BS,
et al: The vigorous immune microenvironment of microsatellite
instable colon cancer is balanced by multiple counter-inhibitory
checkpoints. Cancer Discov. 5:43–51. 2015. View Article : Google Scholar : PubMed/NCBI
|
|
2
|
Ganesh K, Stadler ZK, Cercek A, Mendelsohn
RB, Shia J, Segal NH and Diaz LA Jr: Immunotherapy in colorectal
cancer: Rationale, challenges and potential. Nat Rev Gastroenterol
Hepatol. 16:361–375. 2019. View Article : Google Scholar : PubMed/NCBI
|
|
3
|
Le DT, Uram JN, Wang H, Bartlett BR,
Kemberling H, Eyring AD, Skora AD, Luber BS, Azad NS, Laheru D, et
al: PD-1 blockade in tumors with mismatch-repair deficiency. N Engl
J Med. 372:2509–2520. 2015. View Article : Google Scholar : PubMed/NCBI
|
|
4
|
Picard E, Verschoor CP, Ma GW and Pawelec
G: Relationships between immune landscapes, genetic subtypes and
responses to immunotherapy in colorectal cancer. Front Immunol.
11:3692020. View Article : Google Scholar : PubMed/NCBI
|
|
5
|
Galon J, Costes A, Sanchez-Cabo F,
Kirilovsky A, Mlecnik B, Lagorce-Pagès C, Tosolini M, Camus M,
Berger A, Wind P, et al: Type, density, and location of immune
cells within human colorectal tumors predict clinical outcome.
Science. 313:1960–1964. 2006. View Article : Google Scholar : PubMed/NCBI
|
|
6
|
Galon J, Fridman WH and Pagès F: The
adaptive immunologic microenvironment in colorectal cancer: A novel
perspective. Cancer Res. 67:1883–1886. 2007. View Article : Google Scholar : PubMed/NCBI
|
|
7
|
Marabelle A, Fakih M, Lopez J, Shah M,
Shapira-Frommer R, Nakagawa K, Chung HC, Kindler HL, Lopez-Martin
JA, Miller WH Jr, et al: Association of tumour mutational burden
with outcomes in patients with advanced solid tumours treated with
pembrolizumab: Prospective biomarker analysis of the multicohort,
open-label, phase 2 KEYNOTE-158 study. Lancet Oncol. 21:1353–1365.
2020. View Article : Google Scholar : PubMed/NCBI
|
|
8
|
Galon J, Mlecnik B, Bindea G, Angell HK,
Berger A, Lagorce C, Lugli A, Zlobec I, Hartmann A, Bifulco C, et
al: Towards the introduction of the ‘Immunoscore’ in the
classification of malignant tumours. J Pathol. 232:199–209. 2014.
View Article : Google Scholar : PubMed/NCBI
|
|
9
|
Schumacher TN and Schreiber RD:
Neoantigens in cancer immunotherapy. Sciencec. 348:69–74. 2015.
View Article : Google Scholar : PubMed/NCBI
|
|
10
|
Galon J and Bruni D: Tumor immunology and
tumor evolution: Intertwined histories. Immunity. 52:55–81. 2020.
View Article : Google Scholar : PubMed/NCBI
|
|
11
|
Weiser MR: AJCC 8th edition: Colorectal
cancer. Ann Surg Oncol. 25:1454–1455. 2018. View Article : Google Scholar : PubMed/NCBI
|
|
12
|
Yomoda T, Sudo T, Kawahara A, Shigaki T,
Shimomura S, Tajiri K, Nagasu S, Fujita F, Kinugasa T and Akagi Y:
The immunoscore is a superior prognostic tool in stages II and III
colorectal cancer and is significantly correlated with programmed
death-ligand 1 (PD-L1) expression on tumor-infiltrating mononuclear
cells. Ann Surg Oncol. 26:415–424. 2019. View Article : Google Scholar : PubMed/NCBI
|
|
13
|
Schneider CA, Rasband WS and Eliceiri KW:
NIH image to ImageJ: 25 years of image analysis. Nat Methods.
9:671–675. 2012. View Article : Google Scholar : PubMed/NCBI
|
|
14
|
Fujiyoshi K, Bruford EA, Mroz P, Sims CL,
O'Leary TJ, Lo AWI, Chen N, Patel NR, Patel KP, Seliger B, et al:
Opinion: Standardizing gene product nomenclature-a call to action.
Proc Natl Acad Sci USA. 118:e20252071182021. View Article : Google Scholar : PubMed/NCBI
|
|
15
|
Kirilovsky A, Marliot F, El Sissy C,
Haicheur N, Galon J and Pagès F: Rational bases for the use of the
immunoscore in routine clinical settings as a prognostic and
predictive biomarker in cancer patients. Int Immunol. 28:373–382.
2016. View Article : Google Scholar : PubMed/NCBI
|
|
16
|
Chaudhary R, Quagliata L, Martin JP,
Alborelli I, Cyanam D, Mittal V, Tom W, Au-Young J, Sadis S and
Hyland F: A scalable solution for tumor mutational burden from
formalin-fixed, paraffin-embedded samples using the oncomine tumor
mutation load assay. Transl Lung Cancer Res. 7:616–630. 2018.
View Article : Google Scholar : PubMed/NCBI
|
|
17
|
Hellmann MD, Ciuleanu TE, Pluzanski A, Lee
JS, Otterson GA, Audigier-Valette C, Minenza E, Linardou H, Burgers
S, Salman P, et al: Nivolumab plus ipilimumab in lung cancer with a
high tumor mutational burden. N Engl J Med. 378:2093–2104. 2018.
View Article : Google Scholar : PubMed/NCBI
|
|
18
|
Overman MJ, Lonardi S, Wong KYM, Lenz HJ,
Gelsomino F, Aglietta M, Morse MA, Van Cutsem E, McDermott R, Hill
A, et al: Durable clinical benefit with nivolumab plus ipilimumab
in DNA mismatch repair-deficient/microsatellite instability-high
metastatic colorectal cancer. J Clin Oncol. 36:773–779. 2018.
View Article : Google Scholar : PubMed/NCBI
|
|
19
|
Noepel-Duennebacke S, Juette H, Schulmann
K, Graeven U, Porschen R, Stoehlmacher J, Hegewisch-Becker S, Raulf
A, Arnold D, Reinacher-Schick A and Tannapfel A: Microsatellite
instability (MSI-H) is associated with a high immunoscore but not
with PD-L1 expression or increased survival in patients (pts.) with
metastatic colorectal cancer (mCRC) treated with oxaliplatin (ox)
and fluoropyrimidine (FP) with and without bevacizumab (bev): A
pooled analysis of the AIO KRK 0207 and RO91 trials. J Cancer Res
Clin Oncol. 147:3063–3072. 2021. View Article : Google Scholar : PubMed/NCBI
|
|
20
|
de Jong AE, van Puijenbroek M, Hendriks Y,
Tops C, Wijnen J, Ausems MG, Meijers-Heijboer H, Wagner A, van Os
TA, Bröcker-Vriends AH, et al: Microsatellite instability,
immunohistochemistry, and additional PMS2 staining in suspected
hereditary nonpolyposis colorectal cancer. Clin Cancer Res.
10:972–980. 2004. View Article : Google Scholar : PubMed/NCBI
|
|
21
|
Truninger K, Menigatti M, Luz J, Russell
A, Haider R, Gebbers JO, Bannwart F, Yurtsever H, Neuweiler J,
Riehle HM, et al: Immunohistochemical analysis reveals high
frequency of PMS2 defects in colorectal cancer. Gastroenterology.
128:1160–1171. 2005. View Article : Google Scholar : PubMed/NCBI
|
|
22
|
Senter L, Clendenning M, Sotamaa K, Hampel
H, Green J, Potter JD, Lindblom A, Lagerstedt K, Thibodeau SN,
Lindor NM, et al: The clinical phenotype of Lynch syndrome due to
germ-line PMS2 mutations. Gastroenterology. 135:419–428. 2008.
View Article : Google Scholar : PubMed/NCBI
|
|
23
|
Ten Broeke SW, van der Klift HM, Tops CMJ,
Aretz S, Bernstein I, Buchanan DD, de la Chapelle A, Capella G,
Clendenning M, Engel C, et al: Cancer risks for PMS2-associated
Lynch syndrome. J Clin Oncol. 36:2961–2968. 2018. View Article : Google Scholar : PubMed/NCBI
|
|
24
|
Chan TA, Yarchoan M, Jaffee E, Swanton C,
Quezada SA, Stenzinger A and Peters S: Development of tumor
mutation burden as an immunotherapy biomarker: Utility for the
oncology clinic. Ann Oncol. 30:44–56. 2019. View Article : Google Scholar : PubMed/NCBI
|
|
25
|
Hwang HS, Kim D and Choi J: Distinct
mutational profile and immune microenvironment in
microsatellite-unstable and POLE-mutated tumors. J Immunother
Cancer. 9:e0027972021. View Article : Google Scholar : PubMed/NCBI
|
|
26
|
Salem ME, Bodor JN, Puccini A, Xiu J,
Goldberg RM, Grothey A, Korn WM, Shields AF, Worrilow WM, Kim ES,
et al: Relationship between MLH1, PMS2, MSH2 and MSH6 gene-specific
alterations and tumor mutational burden in 1057 microsatellite
instability-high solid tumors. Int J Cancer. 147:2948–2956. 2020.
View Article : Google Scholar : PubMed/NCBI
|
|
27
|
Boland CR and Goel A: Microsatellite
instability in colorectal cancer. Gastroenterology.
138:2073–2087.e3. 2010. View Article : Google Scholar : PubMed/NCBI
|
|
28
|
Le DT, Durham JN, Smith KN, Wang H,
Bartlett BR, Aulakh LK, Lu S, Kemberling H, Wilt C, Luber BS, et
al: Mismatch repair deficiency predicts response of solid tumors to
PD-1 blockade. Science. 357:409–413. 2017. View Article : Google Scholar : PubMed/NCBI
|
|
29
|
Angelova M, Charoentong P, Hackl H,
Fischer ML, Snajder R, Krogsdam AM, Waldner MJ, Bindea G, Mlecnik
B, Galon J and Trajanoski Z: Characterization of the
immunophenotypes and antigenomes of colorectal cancers reveals
distinct tumor escape mechanisms and novel targets for
immunotherapy. Genome Biol. 16:642015. View Article : Google Scholar : PubMed/NCBI
|
|
30
|
Giannakis M, Mu XJ, Shukla SA, Qian ZR,
Cohen O, Nishihara R, Bahl S, Cao Y, Amin-Mansour A, Yamauchi M, et
al: Genomic correlates of immune-cell infiltrates in colorectal
carcinoma. Cell Rep. 15:857–865. 2016. View Article : Google Scholar : PubMed/NCBI
|
|
31
|
Pagès F, Mlecnik B, Marliot F, Bindea G,
Ou FS, Bifulco C, Lugli A, Zlobec I, Rau TT, Berger MD, et al:
International validation of the consensus Immunoscore for the
classification of colon cancer: A prognostic and accuracy study.
Lancet. 391:2128–2139. 2018. View Article : Google Scholar : PubMed/NCBI
|
|
32
|
Mlecnik B, Bindea G, Angell HK, Maby P,
Angelova M, Tougeron D, Church SE, Lafontaine L, Fischer M,
Fredriksen T, et al: Integrative analyses of colorectal cancer show
immunoscore is a stronger predictor of patient survival than
microsatellite instability. Immunity. 44:698–711. 2016. View Article : Google Scholar : PubMed/NCBI
|
|
33
|
Chalabi M, Fanchi LF, Dijkstra KK, Van den
Berg JG, Aalbers AG, Sikorska K, Lopez-Yurda M, Grootscholten C,
Beets GL, Snaebjornsson P, et al: Neoadjuvant immunotherapy leads
to pathological responses in MMR-proficient and MMR-deficient
early-stage colon cancers. Nat Med. 26:566–576. 2020. View Article : Google Scholar : PubMed/NCBI
|
|
34
|
Chakrabarti S, Huebner LJ, Finnes HD,
Muranyi A, Singh S, Clements J, McWilliams RR, Hubbard JM,
Shanmugam K and Sinicrope FA: Intratumoral CD3+ and
CD8+ T-cell densities in patients with deficient DNA
mismatch repair (dMMR) metastatic colorectal cancer (mCRC)
receiving programmed death-1 (PD-1) blockade. J Clin Oncol. 37 (15
Suppl):S35322019. View Article : Google Scholar
|
|
35
|
Chatterjee N and Walker GC: Mechanisms of
DNA damage, repair, and mutagenesis. Environ Mol Mutagen.
58:235–263. 2017. View Article : Google Scholar : PubMed/NCBI
|
|
36
|
Nicolas E, Golemis EA and Arora S: POLD1:
Central mediator of DNA replication and repair, and implication in
cancer and other pathologies. Gene. 590:128–141. 2016. View Article : Google Scholar : PubMed/NCBI
|
|
37
|
Fabrizio DA, George TJ Jr, Dunne RF,
Frampton G, Sun J, Gowen K, Kennedy M, Greenbowe J, Schrock AB,
Hezel AF, et al: Beyond microsatellite testing: Assessment of tumor
mutational burden identifies subsets of colorectal cancer who may
respond to immune checkpoint inhibition. J Gastrointest Oncol.
9:610–617. 2018. View Article : Google Scholar : PubMed/NCBI
|
|
38
|
Santin AD, Bellone S, Buza N, Choi J,
Schwartz PE, Schlessinger J and Lifton RP: Regression of
chemotherapy-resistant polymerase ε (POLE) ultra-mutated and MSH6
hyper-mutated endometrial tumors with nivolumab. Clin Cancer Res.
22:5682–5687. 2016. View Article : Google Scholar : PubMed/NCBI
|
|
39
|
Monu NR and Frey AB: Myeloid-derived
suppressor cells and anti-tumor T cells: A complex relationship.
Immunol Investig. 41:595–613. 2012. View Article : Google Scholar : PubMed/NCBI
|
|
40
|
Samstein RM, Lee CH, Shoushtari AN,
Hellmann MD, Shen R, Janjigian YY, Barron DA, Zehir A, Jordan EJ,
Omuro A, et al: Tumor mutational load predicts survival after
immunotherapy across multiple cancer types. Nat Genet. 51:202–206.
2019. View Article : Google Scholar : PubMed/NCBI
|
|
41
|
Marabelle A, Fakih MG, Lopez J, Shah M,
Shapira-Frommer R, Nakagawa K, Chung HC, Kindler HL, Lopez-Martin
JA, Miller W, et al: 1192O-Association of tumor mutational burden
with outcomes in patients with select advanced solid tumors treated
with pembrolizumab in KEYNOTE-158. Ann Oncol. 30:v477–v478. 2019.
View Article : Google Scholar
|


