Introduction
HBV-related HCC cases are not necessarily
characterized by chronic inflammation, the mechanism of
hepatocarcinogenesis is believed to involve both host and viral
factors, particularly those related to sites wherein the viral
genome has integrated into the host genomes (1–4).
Integration of HBV genomic elements reportedly leads to
carcinogenesis via destabilization of human chromosomes, altered
expression of genes in the vicinity of integration sites, and
production of chimeric human-HBV proteins via expression and
translation of integrant-proximal sequences. Furthermore, the
fusion transcript of HBV X protein (HBx) and long-interspersed
nuclear element 1 reportedly functions as a long noncoding RNA and
affects Wnt signaling (5).
Next-generation sequencing (NGS) has revolutionized
human genomic analysis in a variety of fields, including disease
genomics. However, given that host integration sites often contain
numerous LINE repeats, short interspersed nuclear elements (SINE),
and other transposable elements, short-read sequencers sometimes
fail to accurately identify integration sites, making integration
analysis more challenging. Moreover, because host integration sites
include pseudogenes, failure to obtain sufficiently long read
lengths and accurate sequence information makes proper
identification of these sites difficult, regardless of high read
number yields and the use of paired-end sequencing technology
(6).
In our previous study using custom-made HBV-specific
bait, we selectively captured genomic fragments containing HBV
integrants from DNA extracted from HBV-infected HCC cell lines,
allowing for the development of an efficient NGS-based
integration-analysis methodology (NGS-based structural methylation
analysis of virus genome integration; G-Navi) (7). G-Navi analysis using HBV-infected
liver cancer cell lines [PLC/PRF/5 and Hep2.2.15 (HepG2 cells
infected with HBV)] enabled the discovery of integrated HBV
fragments not only in the nuclear genome but also in the
mitochondrial genome of HepG2.2.15 cells. Unfortunately, previous
primary NGS technologies were limited in their ability to provide
sufficiently detailed analyses, even when combined with the G-Navi
method. In particular, these methods exhibited a limited capacity
to distinguish pseudogenes containing repetitive or highly similar
sequences. However, advanced NGS methods do not require polymerase
chain reaction (PCR) pretreatment of sequenced samples and employ
single-molecule real-time (SMRT) sequencing technology that can
read single bases at the molecular level in real-time. Using these
‘third-generation’ NGS machines capable of achieving high-fidelity
reads without PCR amplification and the attendant GC bias that it
introduces, we aimed to test the hypothesis that their
incorporation into G-Navi analysis would facilitate detailed
integration analysis of the HepG2.2.15 cell line and especially its
mtDNA.
Materials and methods
Cell lines
The PLC/PRF/5 (Alexander) and HepG2 human liver
cancer cell lines were purchased from the Japanese Collection of
Research Bioresources (JCRB, Tokyo, Japan) (8). These cell lines have been
authenticated using STR profiling in the JCRB. HepG2.2.15 cells
(genotype D) authenticated using STR profiling were provided by
Professor Stephan Urban of the University Hospital Heidelberg
(9,10).
SMRT DNA sequencing-based HBV
DNA-integration analysis
DNA extraction was performed using the standard
phenol-chloroform method. The integrity of the extracted DNA was
assessed by 0.8% agarose gel electrophoresis, and concentration was
measured with a Qubit 2.0 Fluorometer (Thermo Fisher Scientific
K.K., Waltham, Ma, USA). We used the SureSelect target enrichment
system (Agilent Technologies) along with 12 391 custom baits
covering the DNA sequences of HBV genotypes A through J and
PLC/PRF/5 HBV sequences. HBV DNA fragments were selectively
captured using unique baits in a sequence-dependent manner. The
resulting HBV integrant (HBV plus human genome) DNA fragments were
used for downstream analysis via SMRT DNA sequencing. The
concentration of the final library was determined on an Agilent
2100 Bioanalyzer. Libraries were prepared with the PacBio DNA
Template Prep Kit 1.0 (Pacific Biosciences, Menlo Park, CA, US,
100-259-100) and the PacBio DNA/Polymerase Binding Kit P6 (Pacific
Biosciences,100-372-700), and Sequencing was performed using C4
chemistry (DNA sequencing Reagent 4.0, Pacific Biosciences) and
PacBio RSII platform (Pacific Biosciences) with an on-plate loading
concentration of 0.15 pM. Data analysis was performed by CLC
Genomics Workbench software 10.1.1 (Qiagen, Hilden, Germany,
http://digitalinsights.qiagen.com/).
Reverse transcription (RT)-PCR
RNA extraction was performed using TRIzol RNA
Isolation Reagents (Thermo Fisher). For cDNA synthesis, 100 ng of
total RNA was used with SuperScript™ III First-Strand Synthesis
System (Thermo Fisher). Real-time quantitative RT-PCR was performed
using SYBR green and targeting mitochondrially encoded
cytochrome C oxidase III (MT-CO3), hepatitis B pre-S1 protein
(HB PreS1), hepatitis B core/capsid protein
(HBc), and HBx. The PCR amplification conditions
were: An initial denaturation step of 20 s at 95°C, followed by 45
cycle of 3 s at 95°C and 30 s at 60°C. All qPCR reactions were
performed in triplicate on an ABI 7500 fast (Applied Biosystems,
Foster City, Ca, USA). The qPCR data analysis was performed using
the 2-ΔΔCq (Livak) method, a widely used method for relative gene
expression analysis, corrected for the housekeeping gene Actin Beta
(ACTB) (11). Three cell lines
were analyzed using the following primers: MT-CO3 forward
5-CCCACCAATCACATGCCTAT-3 and reverse 5-GTGGCCTTGGTATGTGCTTT-3;
HB PreS1 forward 5-GGGTCACCATATTCTTGGGAAC-3 and reverse
5-CCTGAGCCTGAGGGCTCCAC-3: HBc forward
5-CTGGGTGGGTGTTAATTTGG-3 and reverse 5-TAAGCTGGAGGAGTGCGAAT-3; and
HBx forward 5-CACTTCGCCTCACCTCTG-3 and reverse
5-TCGGTCGTTGACATTGCT-3 and ACTB forward
5-TCCTTCCTGGGCATGGAGT-3 and reverse 5-CAGGAGGAGCAATGATCTTGAT-3.
Immunofluorescence analysis
Cell fixation was performed using 4%
Paraformaldehyde Phosphate Buffer Solution for 10 min at room
temperature (RT). Blocking was performed with 2.5% normal horse
serum (Vector Laboratories, Inc., Burlingame, CA, USA) for 1-h at
RT. Immunofluorescence analysis of MT-CO3, hepatitis B surface
protein (HBs), and HBc was performed using 4-well
Millicell® EZ slides (Merck Millipore, Ltd.,
Carrigtwohill, Ireland) with one of the following primary
antibodies for overnight at 4°C: rabbit polyclonal anti-MT-CO3
(1:200; Cat#55082-1-AP; Proteintech, Rosemont, IL, USA), rabbit
polyclonal anti-HBsAg (1:200; Cat#NB100-62652; NOVUS Biologicals,
Littleton, CO, USA), and mouse anti-HBcAg (1:100; Cat#ab8638;
Abcam, Cambridge, MA, USA). As secondary antibodies, Vecta Fluor
Excel Amplified Anti-Rabbit IgG, DyLight 488 Antibody Kit(Vector
Laboratories, Inc.), and Vecta Fluor Excel Amplified Anti-Mouse
IgG, DyLight 488 Antibody Kit(Vector Laboratories, Inc.) were used.
Incubated at room temperature for 15 min with Amplifier Antibody,
followed by 30 min at room temperature with VectaFluor Reagent.
Cells were observed using an all-in-one Fluorescence Microscope
(KEYENCE Corp., Osaka, Japan).
Western blotting
Cells were lysed in a 0.5% NP40 Lysis Buffer (final
concentration 50 mM Tris-HCL, 150 mM NaCl, 0.5% NP-40 50 mM NaF) in
the presence of the complete protease inhibitor cocktail (Roche,
Basel, Switzerland). Protein concentrations were determined with
the BCA protein assay kit (Thermo Fisher Scientific K.K., Waltham,
Ma, USA). For SDS-PAGE, samples were loaded 20 µg using 4 × NuPAGE
LDS Sample Buffer and NuPAGE 10% Bis-Tris Gel(Thermo Fisher).
Western blot analysis was performed using the iBlot2 Gel Transfer
Device (Thermo Fisher) and PVDF membranes(Thermo Fisher). The
blocking reagent was Blocking One (NACALAI TESQUE, INC., Kyoto,
Japan) and incubated at RT 1-h. Primary antibodies were rabbit
polyclonal anti-MT-CO3 (1:300; Cat#55082-1-AP; Proteintech) and
mouse monoclonal anti-cytochrome c (1:2,000; Cat#NB100-56503SS;
NOVUS Biologicals) with COX IV Antibody (1:1,000; Cat#4844; Cell
Signaling Technology, Inc.) was used as the reference proteins,
mouse monoclonal anti-HBsAg (1:1,000; Cat#ab20758; abcam), and
mouse anti-HBcAg (1:1,000; Cat#ab8638; Abcam) with Tubulin Antibody
(1:1,000; Cat#4844; Cell Signaling Technology, Inc.) was used as
the reference proteins and incubated at 4°C overnight. ECL
Anti-Mouse IgG, Horseradish Peroxidase Linked Whole Antibody
(1:10,000; cytiva, MEL, USA) and ECL Anti-Rabbit IgG, Horseradish
Peroxidase Linked Whole Antibody (1:10,000; cytiva) was used as a
secondary antibody and incubated at RT 1-h. Detected with LAS3000
(Fuji Photo Film Co., Ltd. Tokyo, Japan) using ECLSelect™ Western
Blotting Detection Reagent (cytiva).
Cell viability assay
HepG2, HepG2.2.15, and PLC/PRF/5 cells were seeded
in a 96-well plate at a density of 4000 cells/well. Cells were
evaluated using a Cell Counting Kit-8 (Dojindo Molecular
Technologies, Rockville, MD, USA) according to the manufacturer's
instructions (12). Absorbance was
measured at 450 nm after 4-h incubation at 37°C in a CO2
incubator.
Lactate assay
Measurement of lactate concentrations in the medium
of HepG2, HepG2.2.15, and PLC/PRF/5 cultures was performed using a
lactate assay kit (WST; Dojindo Molecular Technologies) and a
microplate reader (Multiskan Ex; Cat#51118230; Thermo Fisher
Scientific) according to the manufacturer's instructions (13).
Quantitative pyrosequencing
methylation analysis
DNA methylation of the integrated HBV genome as well
as the adjacent human mitochondrial genome was analyzed by
bisulfite pyrosequencing (allele-specific and orthologous loci DNA
methylation analysis). Bisulfite PCR was performed using the
EpiTect Bisulfite Kit (Qiagen N.V., Venlo, NLD) according to the
manufacturer's protocol. One microliter of bisulfite-treated DNA
was used as the template. Primers used for methylation analysis of
mitochondrial genome-integration sites in HepG2.2.15 cells were as
follows: biotinylated forward primer 5-TGTAGTATGGTGAGGTGAATAATGT-3
and reverse primer 5-CCCRCTAAATCCCCTAAAAATCCCACTC-3; sequencing
primer-1 5-GTTTAGGAGATTTTAAGGTTTT-3 and sequencing primer-2
5-AGGTGATTGATATTTTTGATG-3. Methylation levels of orthologous
mitochondrial genome loci in HepG2.2.15 cells at the same (empty)
mitochondrial target sites as those in HepG2 and PLC/PRF/5 cells
were analyzed using bisulfite pyrosequencing. Primers used for
methylation analysis were as follows: biotinylated forward primer
5-TAGATTATGGTGAGTTTAGGTGATTGATAT-3 and reverse primer
5-ATTAAAAAAACACTAACCCCCAACAAACA-3; and sequencing primer
5-GTTTAGGTGATTGATATTTTTG-3. Analyses were performed using touchdown
PCR, with denaturation at 95°C for 30 s, annealing at the 95°C for
30 s, and extension at 72°C for 30 s. The PCR products were
confirmed by electrophoresis using a 2% agarose gel. Ten
microliters of biotinylated strands were then captured on
streptavidin-coated beads (cytiva) and incubated with sequencing
primers. The pyrosequencing reactions were performed using the
PyroMark Q24 Advanced (Qiagen). The resulting pyrogram was analyzed
with the PyroMark Q24 software version 3.0.0 (Qiagen).
Statistical analysis
All statistical analyses were performed using SPSS
for Windows (v.12.0; SPSS, Inc., Chicago, IL, USA) and PRISM for
Windows (v.7.0; GraphPad Software, San Diego, CA, USA), and free
software R (v. 4.2.1; R Development Core Team, Vienna, Austria).
Integration-site analysis and tree-view analysis were performed
using Geneious Prime software (v.2019.2.3; (Biomatters Ltd) and
data are presented as the means ± standard error of the mean.
For comparisons involving the three groups, the
Bonferroni correction to the Kruskal-Wallis test (multiple
comparison test) was performed. For MT-CO3 expression analysis in
the four groups of HepG2, HepG2.2.15, PLC/PRF/5, and HepG2.2.15
(HBV integrant), the Kruskal-Wallis test was also performed and a
Bonferroni correction (multiple comparison test) was performed. All
reported P-values were two-sided, and a P<0.05 was considered
significant.
Results
NGS combined with G-Navi increases the
accuracy of integration-site identification
We used our previously described method
(G-Navi)7 along with the PacBio RSII sequencer (Pacific
Biosciences) to identify HBV-integration sites. For efficient
genome analysis, we synthesized 12 391 custom baits based on the
sequences of HBV genotypes A through J (7). The DNA fragment length obtained by
SureSelect Target enrichment system was approximately 1500 bp.
NGS analysis using genomic DNA from three cell lines
(HepG2, HepG2.2.15, and PLC/PRF/5) revealed a total read number
ranging from 0.61 to 0.97 million, with an average read-quality
score of 0.848 (raw: 0.532), corresponding to a >99.9% accuracy.
We first constructed a consensus sequence using both polymerase
reads and subreads, followed by mapping of the sequencing data
using the UCSC Genome Browser (https://genome.ucsc.edu/index.html). The results
showed that the use of G-Navi combined with the PacBio RSII
sequencer revealed 49-fold more bases than conventional NGS
analysis.
Identification of an HBV integrant in
MT-CO3 from a similar mitochondrial pseudogene
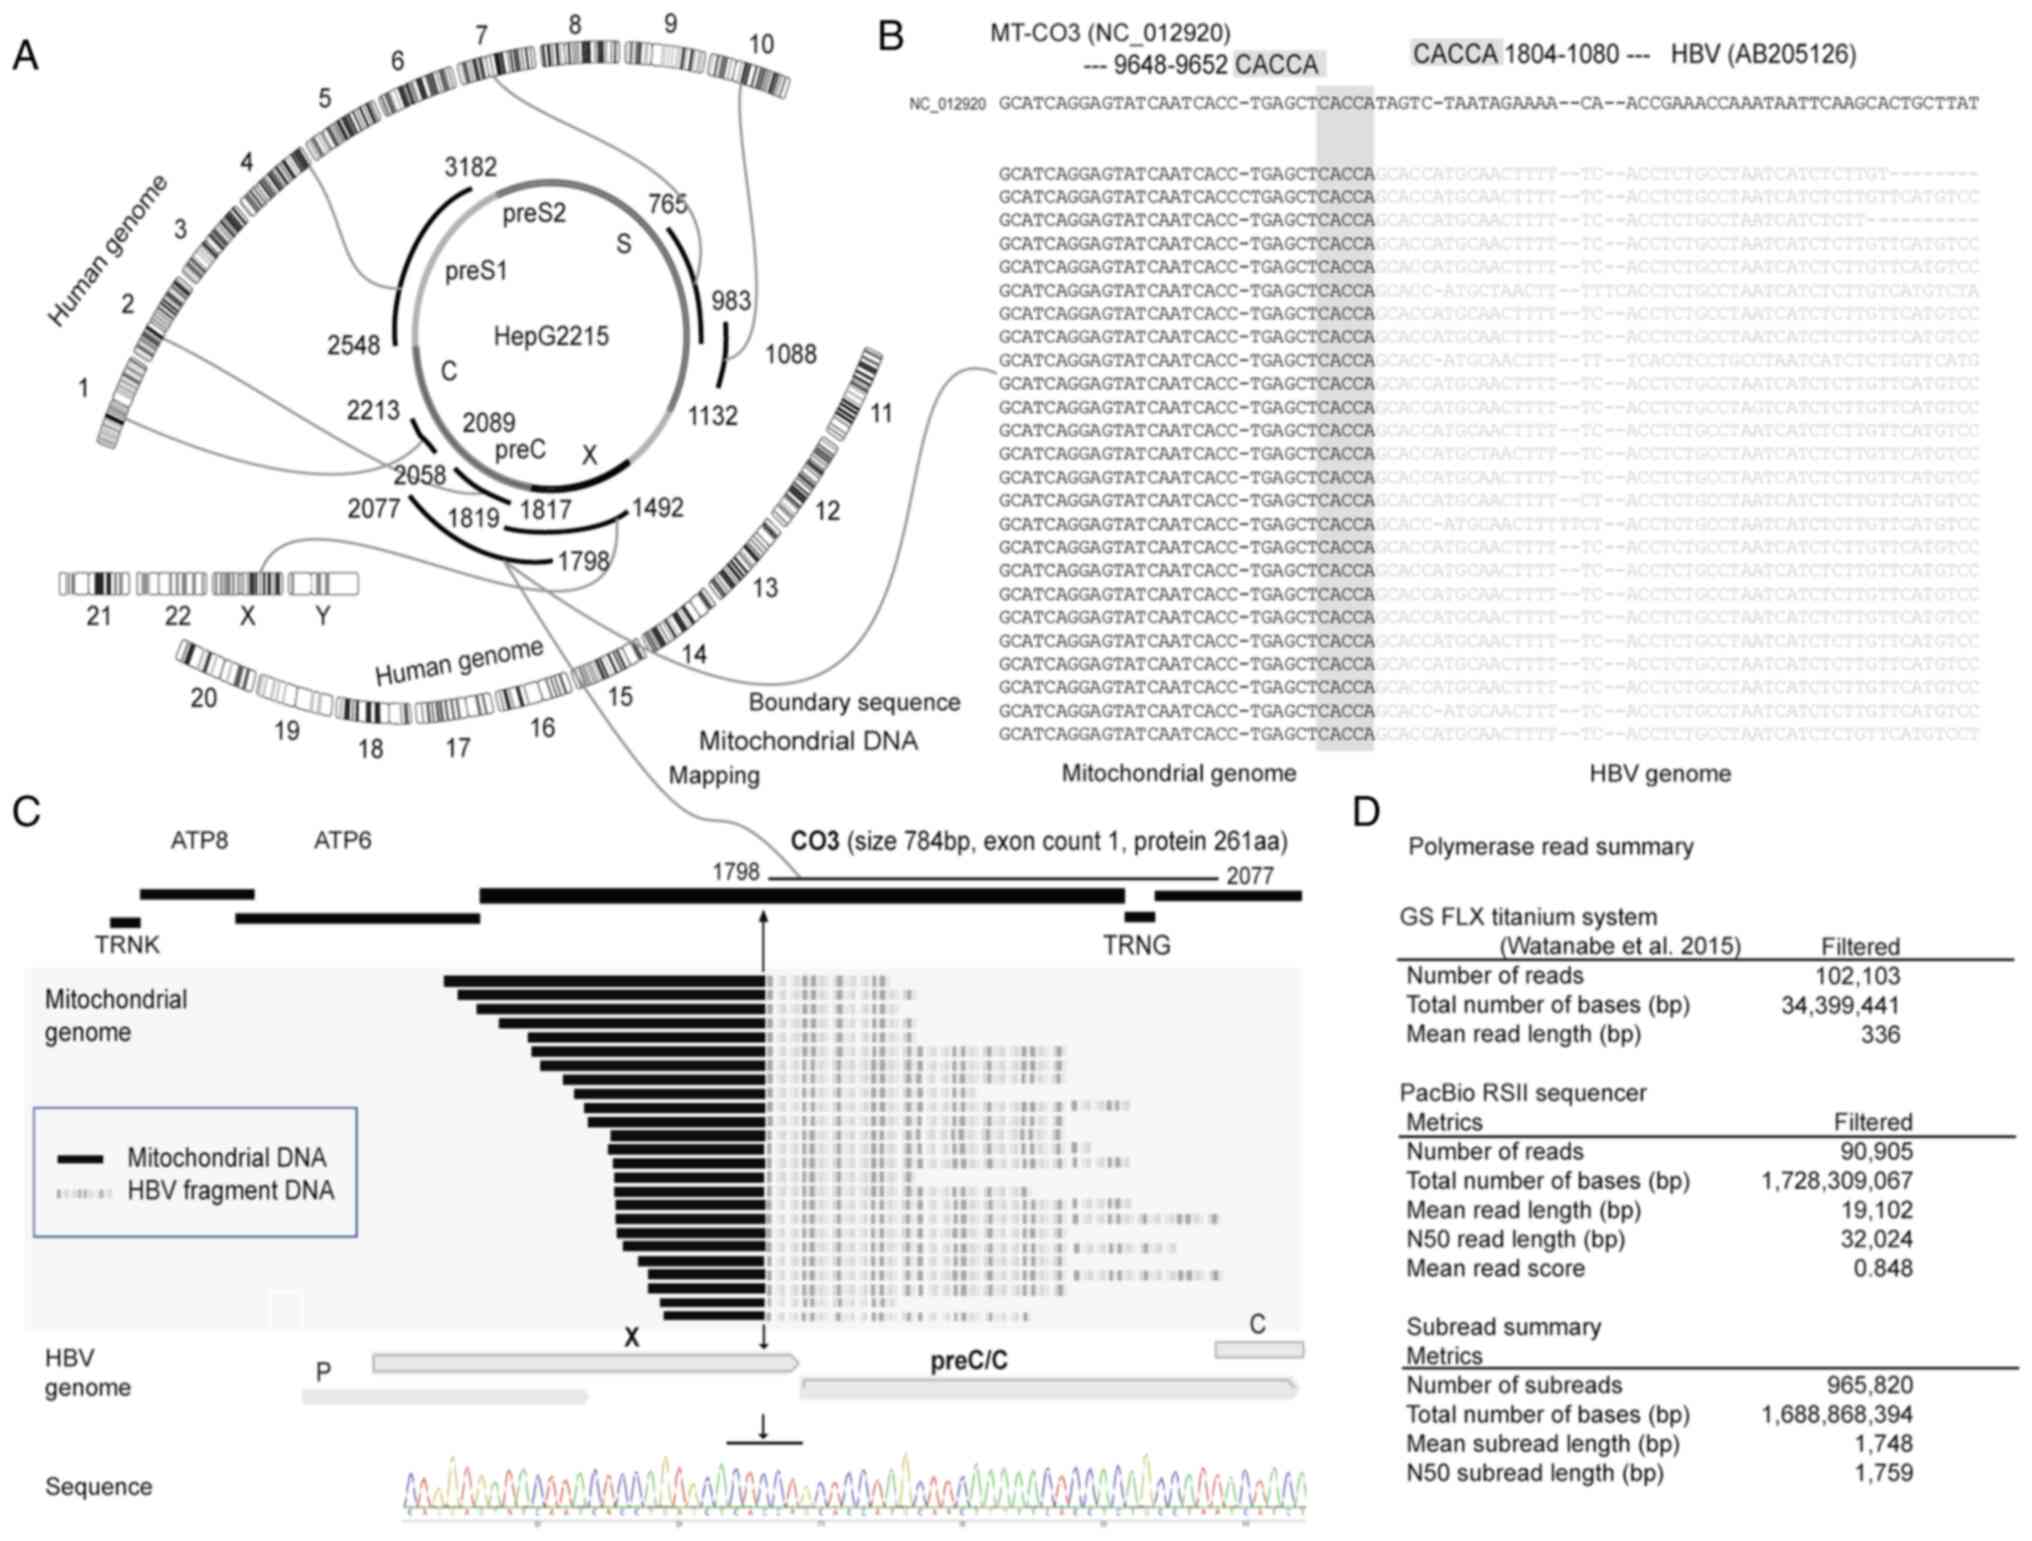
Using an assembly of NGS data containing the human
genome (Human GRCh38/hg38; http://genome.ucsc.edu/index.html), the HBV genome
(AB205126 genotype D), and the mitochondrial genome (NC_012920), we
determined that an HBV integrant in the HepG2.2.15 cell line (HBV
genotype D) was present in MT-CO3 (NC-012920; chromosome M,
9652), representing an HBV gene fragment (AB205126; preCore, X
gene, 1080–1804) with a common homology sequence of ‘CACCA’
(Fig. 1A-C). Alignment analysis
revealed that the HBV fragment integrated into the mitochondrial
genome was not the full-length genome, but rather the contig from
HBx (1804) to the fragment encoding the hepatitis B preCore
protein (HB preCore; 1080) (Fig. 1A and C). We did not observe any
other HBV genome fragments integrated into the mitochondrial
genome. Moreover, due to the high subread (965 820 reads) and
base-pair (1 699 868 394 bp) yields combined with the high mean
read length (19 102 bp) returned by PacBio RSII sequencing, we were
able to distinguish among several highly similar MT-CO3
pseudogenes (MT-CO3Pxx) and the true MT-CO3 sequence
by manipulating the consensus sequences used for NGS analysis
(Figs. 1D, and 2A and B).
MT-CO3 expression levels are higher in
HepG2.2.15 than HepG2 cells
MT-CO3 expression levels in HepG2.2.15 were
significantly higher than in HepG2 cells and also higher in
PCL/PRF/5 cells (P<0.0001) (Fig.
3A). However, the expression level at a specific integration
site in HepG2.2.15 cells was lower than the difference in
expression levels between HepG2.2.15 and HepG2 cells (Fig. 3A). Immunofluorescence staining
confirmed MT-CO3 levels in the mitochondria of all three cell lines
(Fig. 3C). Furthermore, a
comparison of HBV expression levels in PLC/PRF/5 and HepG2.2.15
cells indicated higher levels of HB PreS1 and HBc in HepG2.2.15
cells (P<0.0001) (Fig. 3B).
However, these results did not show mitochondrial expression,
instead revealing levels throughout the somatic cells, including
the nucleus (Fig. 3B).
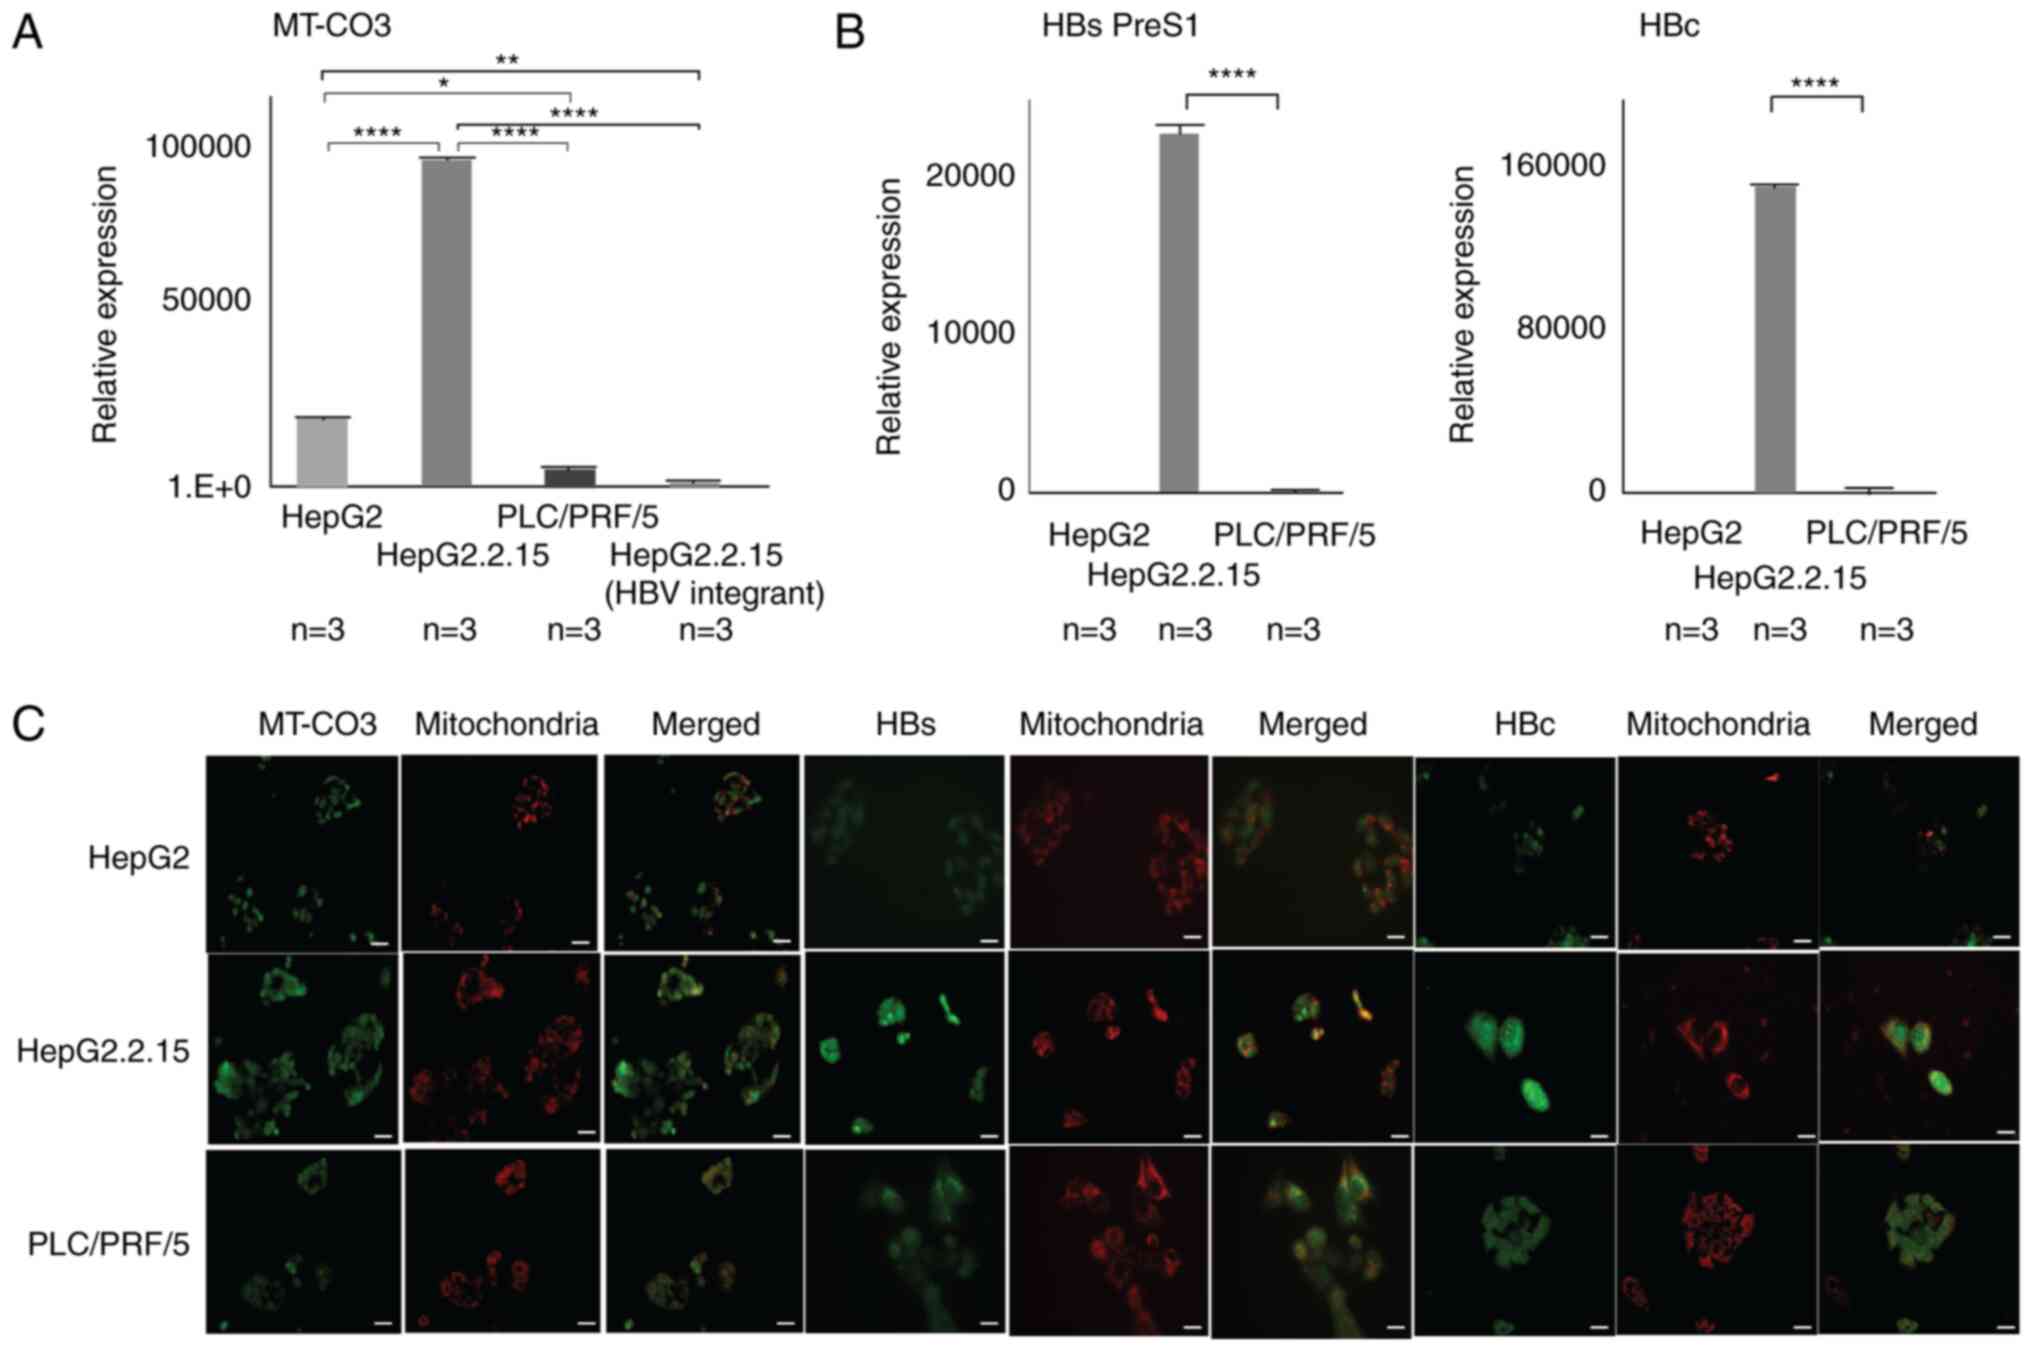 | Figure 3.Expression analyses in three
different hepatic cell lines. (A) There was a significant
difference in MT-CO3 expression between HepG2 and HepG2.2.15 cells.
Three groups were compared using the Kruskal-Wallis test followed
by the Bonferroni multiple comparison test. (B) In HepG2.2.15
cells, HBV-integrant expression included HB PreS1 and HBc. HepG2
cells without HBV integration were used as a control. Gene
expression of HBVs and HBc was analyzed in triplicate, and since
the Kruskal-Wallis test showed significant differences among the
three groups (HepG2, HepG2.2.15 and PLC/PEF/5 cells), multiple
comparisons were then performed using the Bonferroni post hoc test.
Asterisks indicate significant differences (*P<0.05,
**P<0.01, ****P<0.0001). (C) Expression
and localization of MT-CO3 in each cell line according to
immunofluorescence staining. MT-CO3 was highly expressed in the
mitochondria of HepG2.2.15 compared with other cell lines. Although
HBs and HBc expression was apparent in the HepG2.2.15 cell line,
they localized overlapping with mitochondria. Scale bars, 100 µm.
HBc, hepatitis B core/capsid protein; HBs PreS1, hepatitis B
surface protein; HBV, hepatitis B virus; MT-CO3,
mitochondrially encoded cytochrome C oxidase III. |
HepG2.2.15 cells display higher
proliferative capacity relative to HepG2 cells
Cell viability assays revealed that HepG2.2.15 cells
showed higher proliferative capacity than HepG2 cells (P=0.01)
(Fig. 4A). Additionally,
mitochondrial MT-CO3 levels were higher in HepG2.2.15 cells
(P=0.0002) and cytochrome C levels were also higher in HepG2.2.15
(P=0.0007) (Fig. 4B). HB PreS1 and
HBc levels were not significantly different between HepG2.2.15 and
PLC/PRF/5 cells (P=0.06 for HB PreS1 and P=0.1 for HBc). These
results may reflect the fact that we used total protein extracts
but not mitochondrial protein only (Fig. 4B). Moreover, lactate assays
indicated that HepG2.2.15 cells displayed significantly greater
lactic acid production relative to that observed in HepG2 cells
(P=0.0003) (Fig. 4C).
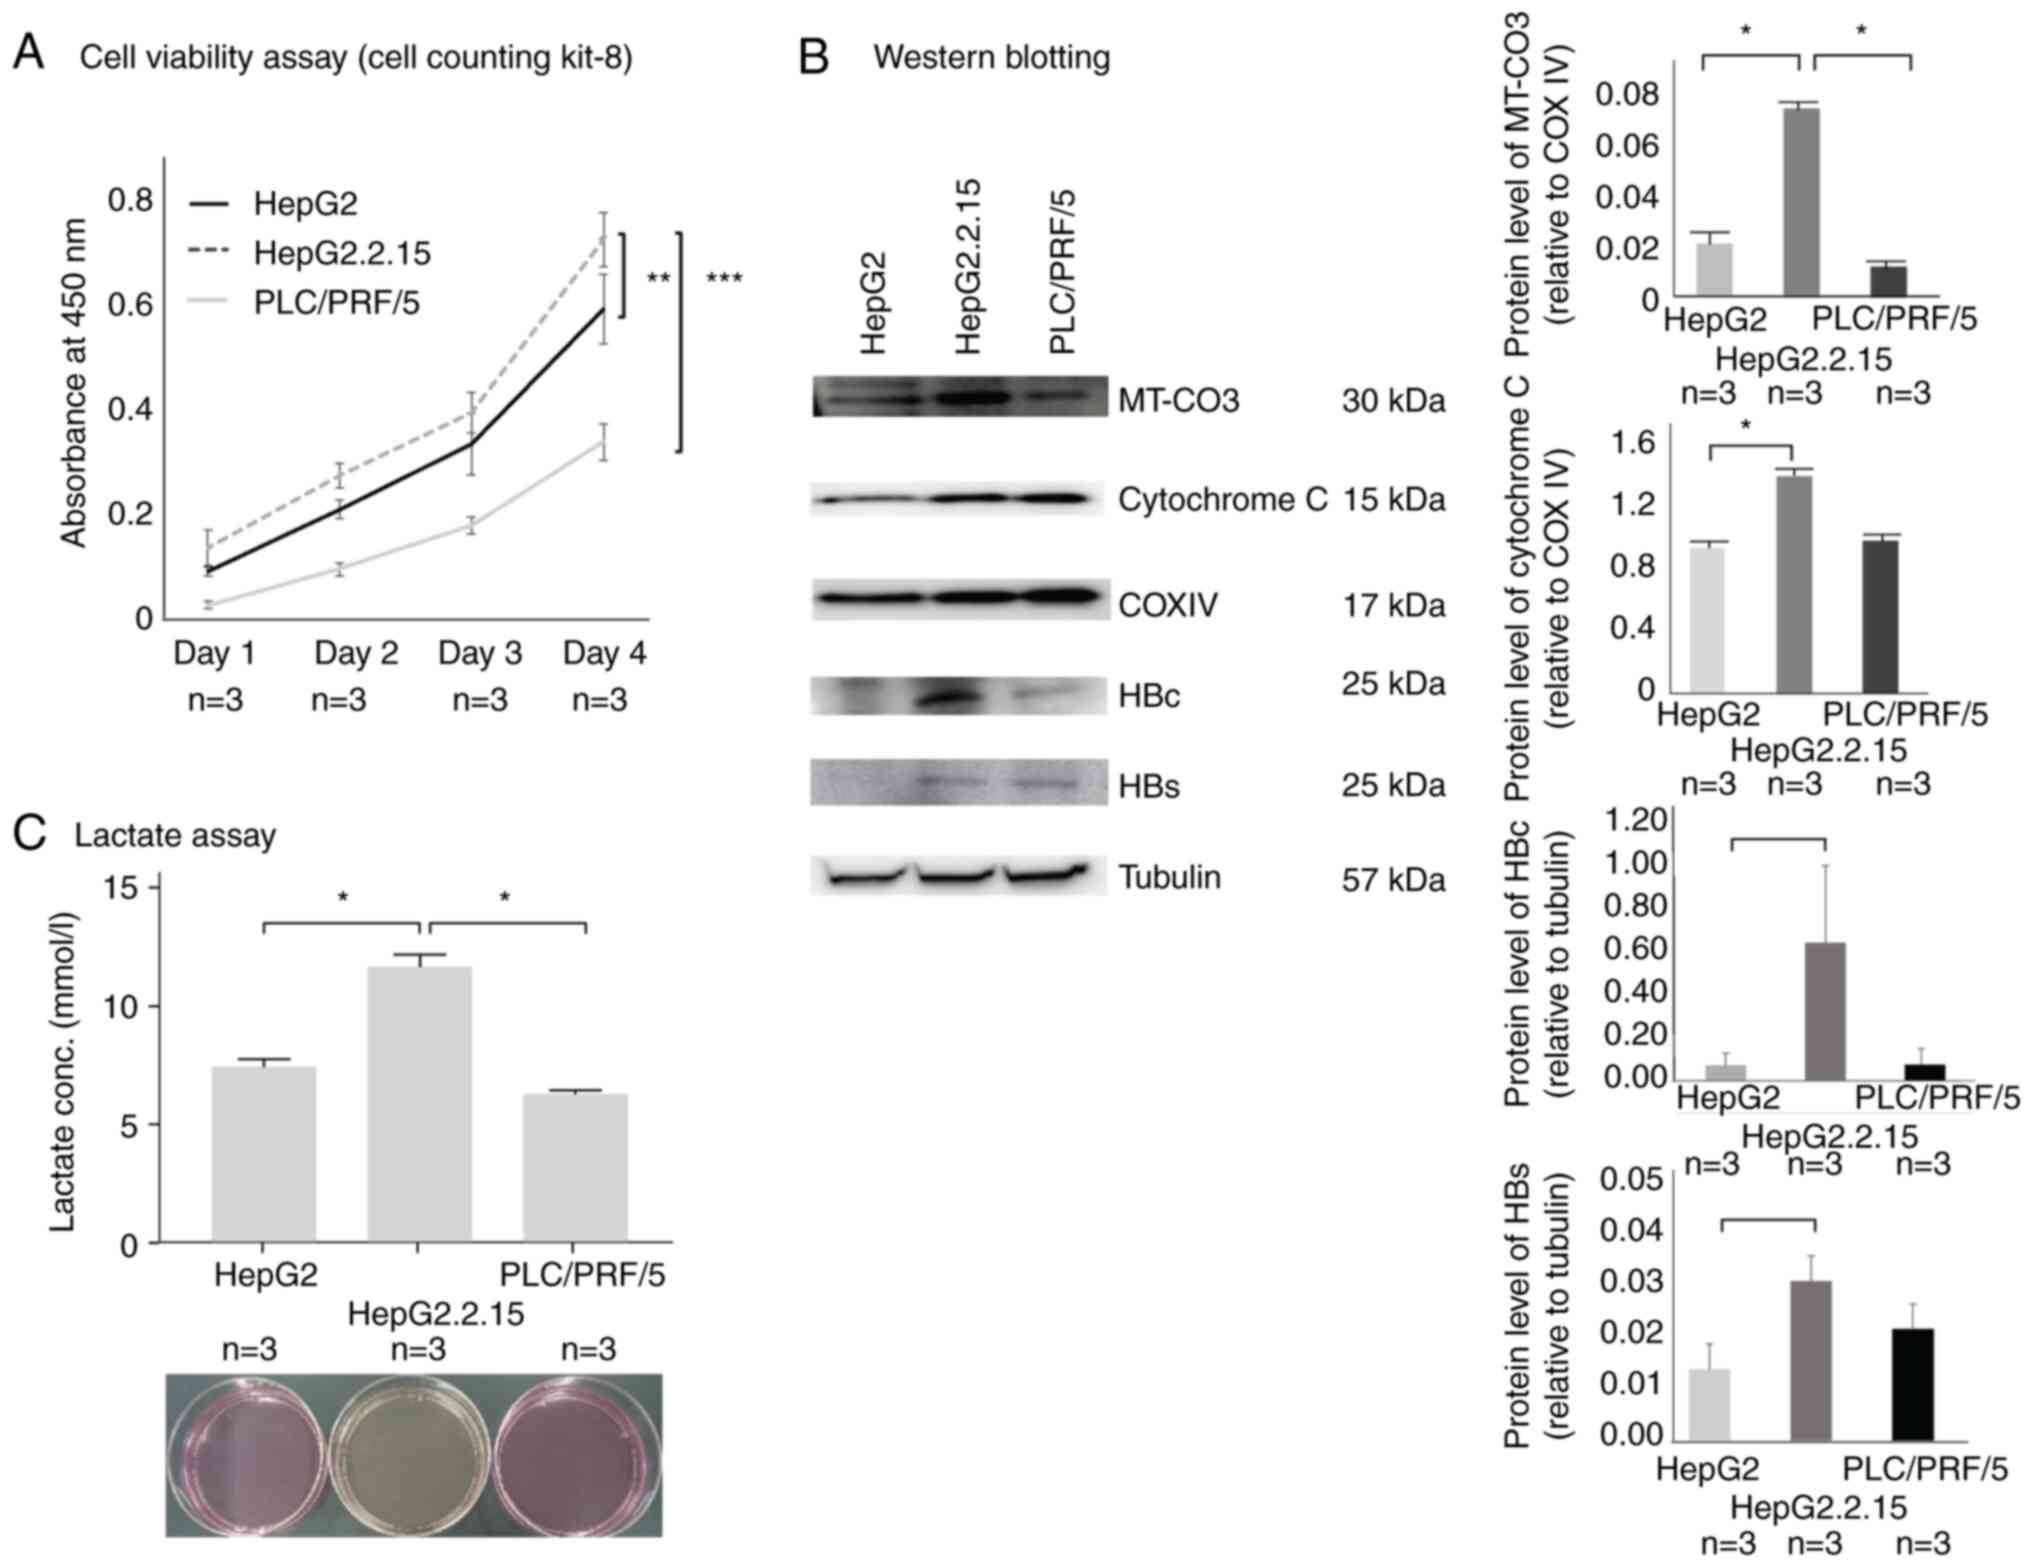 | Figure 4.(A) Viability analysis of the three
cell lines. HepG2.2.15 cells exhibited higher proliferation than
HepG2 cells. Cell viability counts were analyzed in triplicate and
statistical analysis was performed to compare the HepG2, HepG2.2.15
and PLC/PEF/5 groups on day4. (B) MT-CO3 protein levels in
mitochondria were compared by western blotting and were found to be
higher in HepG2.2.15 cells than in HepG2 cells. Cytochrome C levels
in mitochondria of HepG2.2.15 cells were higher than those of HepG2
cells. There were no significant differences between HepG2.2.15 and
PLC/PRF/5 cells for HB PreS1 and HBc in somatic cells, including
the nucleus (HBc; P=0.066, HBs; P=0.079). Protein levels of MT-CO3
and cytochrome C in mitochondria and HB PreS1 and HBc in somatic
cells, including the nucleus, were analyzed in triplicate. (C)
Analysis of lactate acid production. The color of the culture
medium was more yellow in HepG2.2.15 cells compared with HepG2
cells and PLC/PRF/5 cells, indicating that HepG2.2.15 produced the
most lactic acid when analyzed for lactic acid production. Data are
presented as the mean ± standard error of the mean. In experiments
with three groups, data were analyzed using the Kruskal-Wallis test
followed by the Bonferroni multiple comparison test. Asterisks
indicate significant differences (*P<0.05,
**P<0.01, ***P<0.001). COXIV,
cytochrome c oxidase subunit IV; HBc, hepatitis B core/capsid
protein; HBs, hepatitis B surface protein; MT-CO3, mitochondrially
encoded cytochrome C oxidase III. |
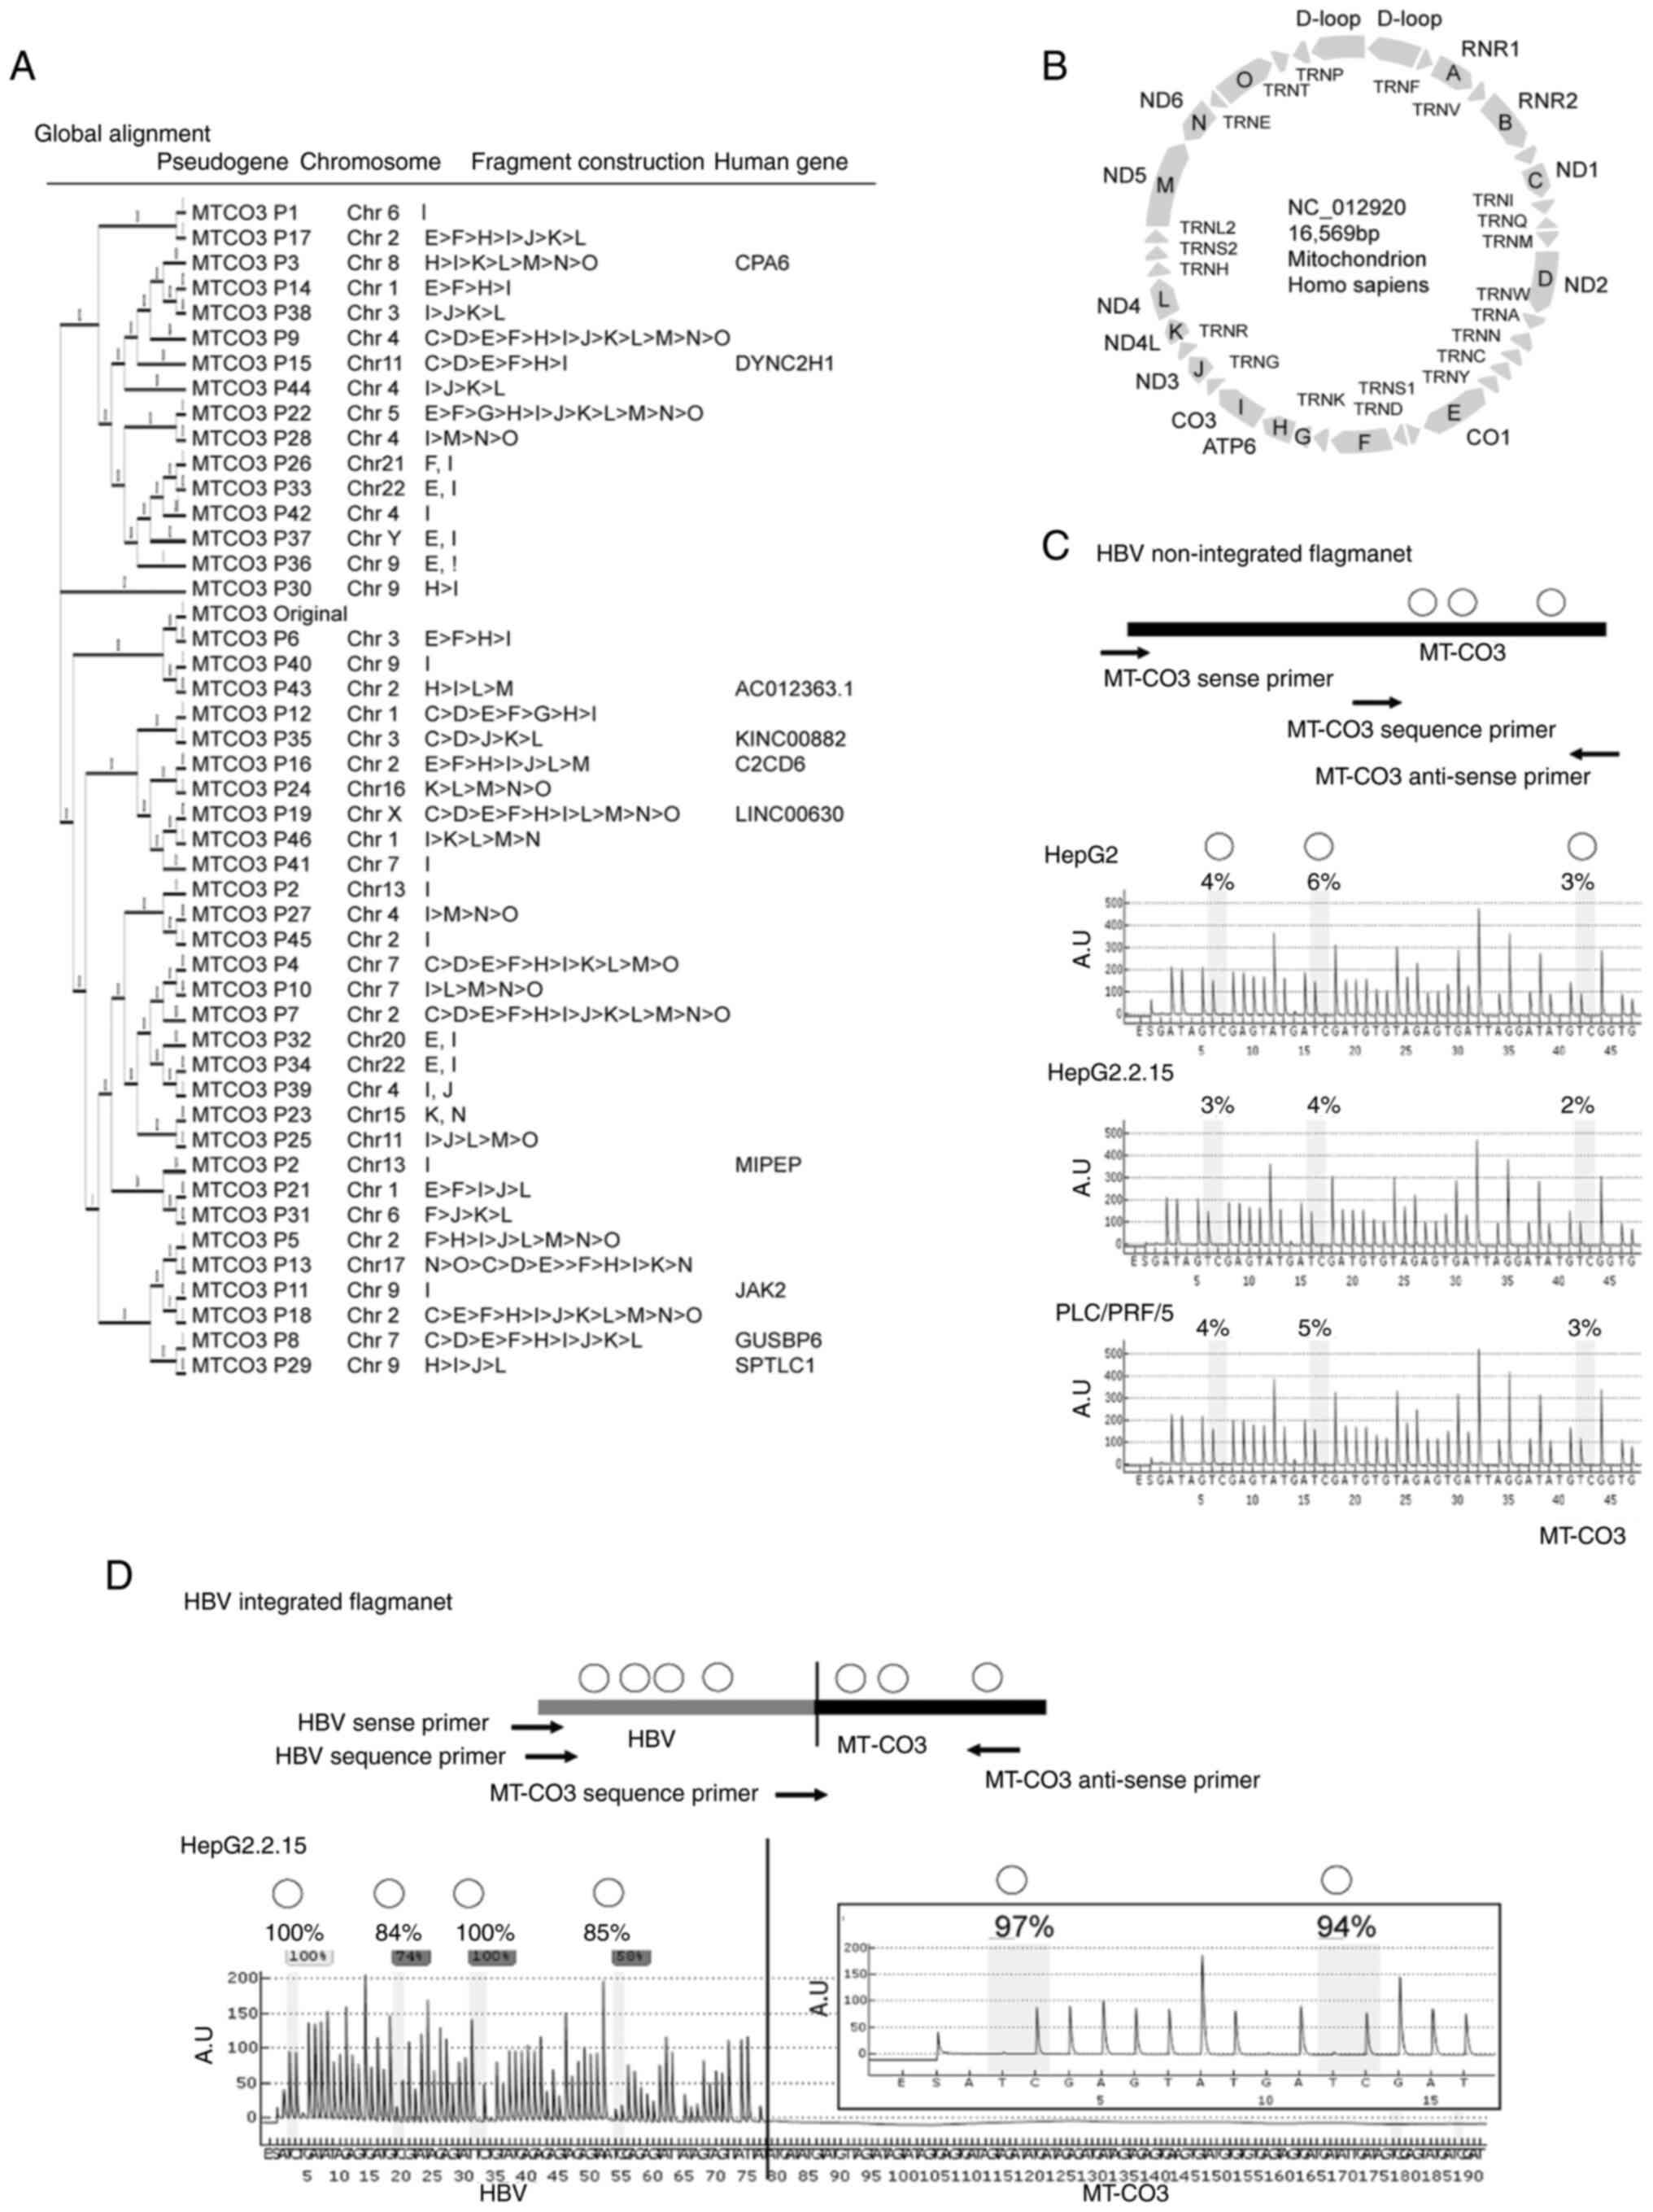
Identification of MT-CO3 pseudogenes
(MT-CO3Pxx) in nuclear DNA
Using information obtained from the UCSC Genome
Browser (Human GRCh38/hg38; http://genome.ucsc.edu/index.html), we identified the
existence of several nuclear MT-CO3 pseudogenes with
sequences highly similar to that of the original gene.
MT-CO3 pseudogenes were found at a total of 46 loci
(Fig. 2A and B), ranging from
MT-CO3 P6 (chromosome 3) exhibiting the highest sequence
similarity with MT-CO3 to single CO3 sequences and
constructs existing as mitochondrial genome complexes. The data
obtained from G-Navi-NGS analysis enabled the distinction between
MT-CO3 and pseudogenes.
The MT-CO3/HBV integrant shows
concordance and high methylation levels in HepG2.2.15 cells
G-Navi-NGS analysis was able to not only detect HBV
integrants at MT-CO3 (MT-CO3/HBV) in HepG2.2.15
cells, it also confirmed the results of direct sequencing analysis.
The GC percentage of the integrated MT-CO3/HBV boundary (500
bp) in HepG2.2.15 was less than 50% (GC: 48.4%; A: 28.2%; C: 17.0%;
G: 31.4%; T: 23.4%) located in non-promoter regions of both MT-CO3
and HBx preCore genes. We also found mitochondrial heteroplasmy in
HepG2.2.15 cells, containing both nonintegrated and
MT-CO3/HBV integrated mitochondria. DNA methylation analysis
demonstrated that nonintegrated HepG2.2.15 MT-CO3 loci
exhibited low DNA methylation (3.0%), similar to levels in HepG2
and PLC/PRF/5 cells (4.3 and 4.0%, respectively) (Fig. 2C). In contrast, MT-CO3/HBV
loci in HepG2.2.15 cells showed high levels of methylation
throughout both HBV and MT-CO3 (92.3 and 95.5%,
respectively) based on semiquantitative pyrosequencing analysis
(Fig. 2D).
Discussion
Underlying persistent HBV infection, chronic
hepatitis, and cirrhosis that precede initial infections along with
chronic inflammation associated with long-term infections are
suggested as factors affecting hepatocarcinogenesis. These
processes are believed to foment the accumulation of genetic and
epigenetic multistage gene alterations via the involvement of
reactive oxygen species produced inside hepatocytes as a response
to chronic inflammation (14–16).
However, because HBV-related hepatocarcinogenesis is not
necessarily characterized by long-term chronic inflammation, it is
widely accepted that the carcinogenic mechanism involves viral
factors, particularly the HBV integrants in the human genome
(17–21). Development of NGS technologies has
enabled comprehensive detection of integration sites in host
genomes. However, these methods have lacked the sophistication to
facilitate efficient and detailed analysis, especially for
repetitive and approximated sequences (22,23).
We previously performed NGS-based HBV-integration analysis in an
HBV-infected liver cancer cell line (HepG2.2.15) and found
integrants in the mitochondrial genome as well as the nucleus
(4). However, many mitochondrial
pseudogenes, which are highly similar in sequence to the original
genes on the mitochondrial genome, are located on human chromosomes
overlapping each other by as long as 30,000 bp. Therefore,
conventional short-lead NGS, with its average read length of 300
bp, has precluded a more detailed analysis of the mitochondrial
genome and the nuclear genome. Recently, studies focusing on the
relationship between mtDNA damage and carcinogenesis clarified that
most of the proteins constituting mitochondria have been encoded by
nuclear DNA (pseudogenes) (7,24).
Consequently, we next tried to analyze HBV/mtDNA integrants using
high specification of NGS following the G-Navi method.
Recent advances in NGS technology have led to the
development of machines capable of generating read depth, length,
and bases sufficient for de novo genome sequencing. To
investigate the integration of HBV genetic material into the
mitochondrial genome of HepG2.2.15 cells, we altered our NGS
protocol originally designed for the Roche 454 GS FLX Titanium
system (discontinued in 2013 by Roche, Basel, Switzerland) to work
with the PacBio RSII sequencer and applied this platform with a
focus on the mitochondrial genome.
Our G-Navi-NGS analysis revealed only one
integration locus in the mitochondrial genome (NC_012920) of
HepG2.2.15 cells. The integrant was located in exon 1 of
MT-CO3 and contained a shared microhomology sequence ‘CACCA’
(bases 9648–9652 in MT-CO3) as the boundary between the
mitochondrial and HBV genomes. The integrant contained portions of
the HBV preCore, X gene sequences, with the immediate
vicinity (~50 bp) of the boundary highly similar across all contigs
obtained from NGS. We also found both non-integrant and HBV/MT-CO3
integrants of mitochondria in HepG2.2.15 by pyrosequencing analysis
(mitochondrial heteroplasmy). This suggested that in HepG2.2.15
mitochondria, the HBV/MT-CO3 integration site was not repaired and
partially retained the integrants.
Mitochondria are organelles that generate energy
through oxygen absorption and possess a 37-gene genome that encodes
enzymes responsible for respiratory function. In addition to
mitochondrial diseases, genome abnormalities not only cause
diabetes, neurodegenerative diseases, and cancer, but are also
implicated in age-related tissue alterations (15,16).
However, investigation of the mitochondrial genome is difficult,
hampering detailed investigations necessary to elucidate the impact
of alterations and the mechanisms by which diseases of this
organelle arise. Furthermore, mutations in mitochondrial DNA from
HCC cells have been identified and implicated in mitochondrial
dysfunction, although the associated mechanisms have not yet been
determined (25).
To clarify this mechanism, we next compared cell
viability and lactate assays between HepG2 and HepG2.2.15, given
the significantly increased cell viability and lactic acid
production of HepG2.2.15 cells. Thus, we hypothesized that HBV
genome integrants (especially HBV/mtDNA integrants) in mtDNA might
functionally affect the mitochondrial genome; however, we were
unable to clarify the association due to discrepancies in gene
expression and the result of epigenetic modifications (DNA
methylation in the boundary).
Immunofluorescence staining showed higher MT-CO3
staining in HepG2.2.15 than in HepG2 and PLC/PRF/5 cells; protein
levels showed higher MT-CO3 and cytochrome C in mitochondria in
HepG2.2.15 cells relative to HepG2 cells. MT-CO3 expression
in HepG2.2.15 was significantly higher than that in HepG2 cells;
however, it is not a comparable different levels for HBV/MT-CO3
integrant specific expression levels in HepG2.2.15.
A variety of spontaneous mutations and abnormal
DNA-methylation states are present in cancer cells, including those
associated with hepatocellular carcinoma (26–28).
Moreover, a previous study discussed the extent of epigenetic
modifications caused by gene integration (29). To elucidate the effects of the
MT-CO3/HBV integrant on the mitochondria of HepG2.2.15
cells, we analyzed epigenetic modifications in somatic cells. We
hypothesized that these modifications might be similar to those
occurring in hepatic cells undergoing HBV integration (7). Given that no reports discussing this
process in the mitochondrial genome exist, we performed this
analysis and found that non-integrated MT-CO3 was
unmethylated across three cell lines (HepG2, HepG2.2.15, and
PLC/PRF/5), whereas MT-CO3/HBV was highly methylated on both
the HBV and MT-CO3 sides.
Many MT-CO3 pseudogenes exist on various
chromosomes. To account for their possible effects on CO3 levels,
we statistically analyzed the sequence homology of all 46
pseudogene loci (MT-CO3Pxx on autosomal chromosomes and
chromosome Y) according to information accessed via the human UCSC
genome browser graphical viewing tool (https://genome.ucsc.edu/).
Taken together, our results identify continuous
preservation of the integration of HBV genetic material into the
mitochondrial MT-CO3 gene of HepG2.2.15 cells as a
mitochondrial heteroplasmy. HepG2.2.15 cells showed higher
expression, immunostaining, and protein levels of MT-CO3, as well
as higher proliferative capacity and lactate production. Thus, we
hypothesized that HBV/MT-CO3 integrants may functionally affect the
mitochondrial genome; however, the HBV/MT-CO3 boundary was already
highly methylated on both the HBV and MT-CO3 sides. We speculate
that epigenetic modification (DNA methylation) might be affected
HBV/MT-CO3 silent; however, the detailed mechanism of the
epigenetic mitochondrial modifications remains unknown.
Acknowledgements
The authors would like to thank Professor Stephan
Urban (Department of Infectious Diseases, Molecular Virology at
Heidelberg University, Heidelberg, Germany) for the cell lines.
Funding
This work was supported by Grants-in-Aid for Scientific Research
from the Ministry of Education, Culture, Sports, Science and
Technology of Japan (#16K09295, #18K15764 and #19H03568), the
Suzuken Memorial Foundation (#17-032) and a Glaxosmithkline
Research Grant 2018 (#E-7).
Availability of data and materials
The raw sequence datasets generated and/or analyzed
during the current study are available in the DDBJ Sequence Read
Archive (DDBJ; http://ddbj.nig.ac.jp/public/ddbj_database/dra/fastq/DRA010/DRA010456/).
The other datasets used and/or analyzed during the current study
are available from the corresponding author on reasonable
request.
Authors' contributions
RO substantially contributed to the conception and
the design of the study, and was involved in data acquisition and
analysis. YW performed SMRT DNA sequencing-based HBV
DNA-integration analysis and the bioinformatics analysis, and was a
major contributor in writing the manuscript. HYa substantially
contributed to the conception and the design of the study, and
contributed to manuscript drafting. HYo and FI were involved in
analysis and interpretation of the data, and critically revised the
intellectual content. RO, YW, HYo, HYa, and FI confirm the
authenticity of all the raw data. All authors have read and
approved the final manuscript.
Ethics approval and consent to
participate
Not applicable.
Patient consent for publication
Not applicable.
Competing interests
The authors declare that they have no competing
interests.
References
|
1
|
Fattovich G, Bortolotti F and Donato F:
Natural history of chronic hepatitis B: Special emphasis on disease
progression and prognostic factors. J Hepatol. 48:335–352. 2008.
View Article : Google Scholar : PubMed/NCBI
|
|
2
|
Ganem D and Prince AM: Hepatitis B virus
infection-natural history and clinical consequences. N Engl J Med.
350:1118–1129. 2004. View Article : Google Scholar : PubMed/NCBI
|
|
3
|
McMahon BJ: Natural history of chronic
hepatitis B. Clin Liver Dis. 14:381–396. 2010. View Article : Google Scholar : PubMed/NCBI
|
|
4
|
Shibata T and Aburatani H: Exploration of
liver cancer genomes. Nat Rev Gastroenterol Hepatol. 11:340–349.
2014. View Article : Google Scholar : PubMed/NCBI
|
|
5
|
Lau CC, Sun T, Ching AK, He M, Li JW, Wong
AM, Co NN, Chan AW, Li PS, Lung RWT, et al: Viral-human chimeric
transcript predisposes risk to liver cancer development and
progression. Cancer Cell. 25:335–349. 2014. View Article : Google Scholar : PubMed/NCBI
|
|
6
|
Yamamoto H, Watanabe Y, Maehata T, Morita
R, Yoshida Y, Oikawa R, Ishigooka S, Ozawa S, Matsuo Y, Hosoya K,
et al: An updated review of gastric cancer in the next-generation
sequencing era: Insights from bench to bedside and vice versa.
World J Gastroenterol. 20:3927–3937. 2014. View Article : Google Scholar : PubMed/NCBI
|
|
7
|
Watanabe Y, Yamamoto H, Oikawa R, Toyota
M, Yamamoto M, Kokudo N, Tanaka S, Arii S, Yotsuyanagi H, Koike K
and Itoh F: DNA methylation at hepatitis B viral integrants is
associated with methylation at flanking human genomic sequences.
Genome Res. 25:328–337. 2015. View Article : Google Scholar : PubMed/NCBI
|
|
8
|
Ou JH and Rutter WJ: Hybrid hepatitis B
virus-host transcripts in a human hepatoma cell. Proc Natl Acad Sci
USA. 82:83–87. 1985. View Article : Google Scholar : PubMed/NCBI
|
|
9
|
Sells MA, Zelent AZ, Shvartsman M and Acs
G: Replicative intermediates of hepatitis B virus in HepG2 cells
that produce infectious virions. J Virol. 62:2836–2844. 1988.
View Article : Google Scholar : PubMed/NCBI
|
|
10
|
Sells MA, Chen ML and Acs G: Production of
hepatitis B virus particles in Hep G2 cells transfected with cloned
hepatitis B virus DNA. Proc Natl Acad Sci USA. 84:1005–1009. 1987.
View Article : Google Scholar : PubMed/NCBI
|
|
11
|
Livak KJ and Schmittgen TD: Analysis of
relative gene expression data using real-time quantitative PCR and
the 2(−Delta Delta C(T)) Method. Methods. 25:402–408. 2001.
View Article : Google Scholar : PubMed/NCBI
|
|
12
|
Fotakis G and Timbrell JA: In vitro
cytotoxicity assays: Comparison of LDH, neutral red, MTT and
protein assay in hepatoma cell lines following exposure to cadmium
chloride. Toxicol Lett. 160:171–177. 2006. View Article : Google Scholar : PubMed/NCBI
|
|
13
|
Ishiyama M, Miyazono Y, Sasamoto K, Ohkura
Y and Ueno K: A highly water-soluble disulfonated tetrazolium salt
as a chromogenic indicator for NADH as well as cell viability.
Talanta. 44:1299–1305. 1997. View Article : Google Scholar : PubMed/NCBI
|
|
14
|
Koike K: Hepatitis B virus X gene is
implicated in liver carcinogenesis. Cancer Lett. 286:60–68. 2009.
View Article : Google Scholar : PubMed/NCBI
|
|
15
|
Al Shahrani M, Heales S, Hargreaves I and
Orford M: Oxidative stress: Mechanistic insights into inherited
mitochondrial disorders and Parkinson's disease. J Clin Med.
6:1002017. View Article : Google Scholar : PubMed/NCBI
|
|
16
|
Davalli P, Mitic T, Caporali A, Lauriola A
and D'Arca D: ROS, cell senescence, and novel molecular mechanisms
in aging and age-related diseases. Oxid Med Cell Longev.
2016:35651272016. View Article : Google Scholar : PubMed/NCBI
|
|
17
|
Bonilla Guerrero R and Roberts LR: The
role of hepatitis B virus integrations in the pathogenesis of human
hepatocellular carcinoma. J Hepatol. 42:760–777. 2005. View Article : Google Scholar : PubMed/NCBI
|
|
18
|
Kachirskaia I, Shi X, Yamaguchi H, Tanoue
K, Wen H, Wang EW, Appella E and Gozani O: Role for 53BP1 tudor
domain recognition of p53 dimethylated at lysine 382 in DNA damage
signaling. J Biol Chem. 283:34660–34666. 2008. View Article : Google Scholar : PubMed/NCBI
|
|
19
|
Kim S, Park SY, Yong H, Famulski JK, Chae
S, Lee JH, Kang CM, Saya H, Chan GK and Cho H: HBV X protein
targets hBubR1, which induces dysregulation of the mitotic
checkpoint. Oncogene. 27:3457–3464. 2008. View Article : Google Scholar : PubMed/NCBI
|
|
20
|
Martin-Lluesma S, Schaeffer C, Robert EI,
van Breugel PC, Leupin O, Hantz O and Strubin M: Hepatitis B virus
X protein affects S phase progression leading to chromosome
segregation defects by binding to damaged DNA binding protein 1.
Hepatology. 48:1467–1476. 2008. View Article : Google Scholar : PubMed/NCBI
|
|
21
|
Minami M, Poussin K, Brechot C and
Paterlini P: A novel PCR technique using Alu-specific primers to
identify unknown flanking sequences from the human genome.
Genomics. 29:403–408. 1995. View Article : Google Scholar : PubMed/NCBI
|
|
22
|
Sung WK, Zheng H, Li S, Chen R, Liu X, Li
Y, Lee NP, Lee WH, Ariyaratne PN, Tennakoon C, et al: Genome-wide
survey of recurrent HBV integration in hepatocellular carcinoma.
Nat Genet. 44:765–769. 2012. View
Article : Google Scholar : PubMed/NCBI
|
|
23
|
Kawai-Kitahata F, Asahina Y, Tanaka S,
Kakinuma S, Murakawa M, Nitta S, Watanabe T, Otani S, Taniguchi M,
Goto F, et al: Comprehensive analyses of mutations and hepatitis B
virus integration in hepatocellular carcinoma with
clinicopathological features. J Gastroenterol. 51:473–486. 2016.
View Article : Google Scholar : PubMed/NCBI
|
|
24
|
Furuta M, Tanaka H, Shiraishi Y, Uchida T,
Imamura M, Fujimoto A, Fujita M, Sasaki-Oku A, Maejima K, Nakano K,
et al: Correction: Characterization of HBV integration patterns and
timing in liver cancer and HBV-infected livers. Oncotarget.
9:317892018. View Article : Google Scholar : PubMed/NCBI
|
|
25
|
Machida K, Cheng KTH, Sung VMH, Lee KJ,
Levine AM and Lai MM: Hepatitis C virus infection activates the
immunologic (type II) isoform of nitric oxide synthase and thereby
enhances DNA damage and mutations of cellular genes. J Virol.
78:8835–8843. 2004. View Article : Google Scholar : PubMed/NCBI
|
|
26
|
Yamamoto H, Watanabe Y, Oikawa R, Morita
R, Yoshida Y, Maehata T, Yasuda H and Itoh F: BARHL2 methylation
using gastric wash DNA or gastric juice exosomal dna is a useful
marker for early detection of gastric cancer in an H.
pylori-Independent Manner. Clin Transl Gastroenterol. 7:e1842016.
View Article : Google Scholar : PubMed/NCBI
|
|
27
|
Watanabe Y, Toyota M, Kondo Y, Suzuki H,
Imai T, Ohe-Toyota M, Maruyama R, Nojima M, Sasaki Y, Sekido Y, et
al: PRDM5 identified as a target of epigenetic silencing in
colorectal and gastric cancer. Clin Cancer Res. 13:4786–4794. 2007.
View Article : Google Scholar : PubMed/NCBI
|
|
28
|
Watanabe Y, Kim HS, Castoro RJ, Chung W,
Estecio MR, Kondo K, Guo Y, Ahmed SS, Toyota M, Itoh F, et al:
Sensitive and specific detection of early gastric cancer with DNA
methylation analysis of gastric washes. Gastroenterology.
136:2149–2158. 2009. View Article : Google Scholar : PubMed/NCBI
|
|
29
|
Orend G, Kuhlmann I and Doerfler W:
Spreading of DNA methylation across integrated foreign (adenovirus
type 12) genomes in mammalian cells. J Virol. 65:4301–4308. 1991.
View Article : Google Scholar : PubMed/NCBI
|