Introduction
Renal cancer has a global incidence and mortality
rate of 2.2 and 1.8%, respectively (1), ranking the eighth cause of cancer in
America. Approximately 16% are metastatic at the time of diagnosis
(2).
At present, immunotherapy is the first-line
treatment for renal cell cancer. However, its high cost makes it
difficult to obtain in some regions (3). Therefore, in this subgroup of
patients with advanced disease, therapy with Tyrosine Kinase
Inhibitors (TKI) drugs such as Sunitinib and Pazopanib has become
the standard of treatment in patients with favorable risk and some
with intermediate and poor risk since 2005 (4–6).
Nevertheless, up to 30% of these patients are intrinsically
resistant to this type of therapy (7). High stages are associated with a
five-year survival of 12% (8).
Although TKI increases this rate, median overall survival remains
around 8 and 11 months (9–11).
Currently, the National Comprehensive Cancer Network
(NCCN) guidelines do not include any predictive factors regarding
response to systemic therapy with TKI in recurrent and advanced
disease, but rather stratify patients into risk groups according to
the International Metastatic Renal Cell Carcinoma Database
Consortium (IMDC) scale (5).
Therefore, exploring potential biomarkers that identify patients
with a high probability of failure to systemic therapy with TKI is
crucial to avoid spending valuable time and resources.
Radiomics, including Tomographic Texture Analysis
(TTA), are not new imaging techniques (12). Recent advances in computational
processing and the availability of technology have facilitated its
application in imaging studies. Radiomics extract large amounts of
quantifiable features from the images that are impossible to see
for the human reader and reflect the underlying biological
components in terms of texture and shape. Radiomic analysis is a
tool that can be used as a biomarker for tumor characterization, to
assess response to treatment, and as a prognostic factor. This
imaging tool predicted the development of metastatic disease
(13) and five-year survival in
patients with colorectal cancer (14,15)
and served as a prognostic factor in esophageal cancer (16). Furthermore, its association with
tumor glucose metabolism and stage has been demonstrated in
non-small cell lung cancer (17).
In terms of prediction, Smith et al found a
correlation with the survival of patients with melanoma treated
with anti-angiogenic drugs (18).
Regarding kidney tumors, the Radiomic texture analysis showed an
area under the curve (AUC) of 0.80 to discriminate between renal
cell carcinoma and papillary carcinoma (19). In a recent study, radiomic texture
analysis parameters Entropy (ENT) and standard deviation (SD)
showed a correlation with overall survival in clear cell carcinoma
treated with Sunitinib (20).
This study aimed to determine whether Radiomic
parameters can predict response to systemic therapy with TKI in
advanced stage renal cancer.
Materials and methods
Design
We carried out a retrospective study approved by our
IRB under the number RA20-00007, requiring no informed consent. We
obtained the patient information from the medical record system at
the Oncology Department from March 2016 to November 2020. Inclusion
criteria were the following: adults older than 18 years old,
diagnosis of renal-cell cancer in stages 3 or 4 by imaging and
confirmed by histopathology, available images of contrast-enhanced
abdominal CT in the arterial phase before treatment in our system,
treated with TKI (i.e., sunitinib and pazopanib). Exclusion
criteria were the presence of synchronous tumors, baseline CT
abdomen performed after one month of treatment, clinical stages 1
and 2, incomplete or unavailable clinical and imaging records, and
treatment with radiochemotherapy.
Other variables obtained from the medical record
were sex, age, IMDC risk, the Eastern Cooperative Oncology Group
(ECOG) score, smoking status, and comorbidities (i.e., diabetes,
hypertension, and heart disease).
Imaging protocol
All the baseline CT scans were performed on a
General Electric CT99 Light Speed scanner at the Radiology
Department. CT scans parameters were as follows: tube voltage 120
kVp, a slice thickness 2.5 mm and increment of 1.5 mm. A weight-
based dose was used to determine the amount of intravenous contrast
media administered of either Optiray® 300 mg/ml
(Guebert, Villepinte, France) or Ultravist® 375 mg/ml
(Bayer, Whippany, USA). This was followed by a 20–30 ml saline
chaser at 3 ml/sec.
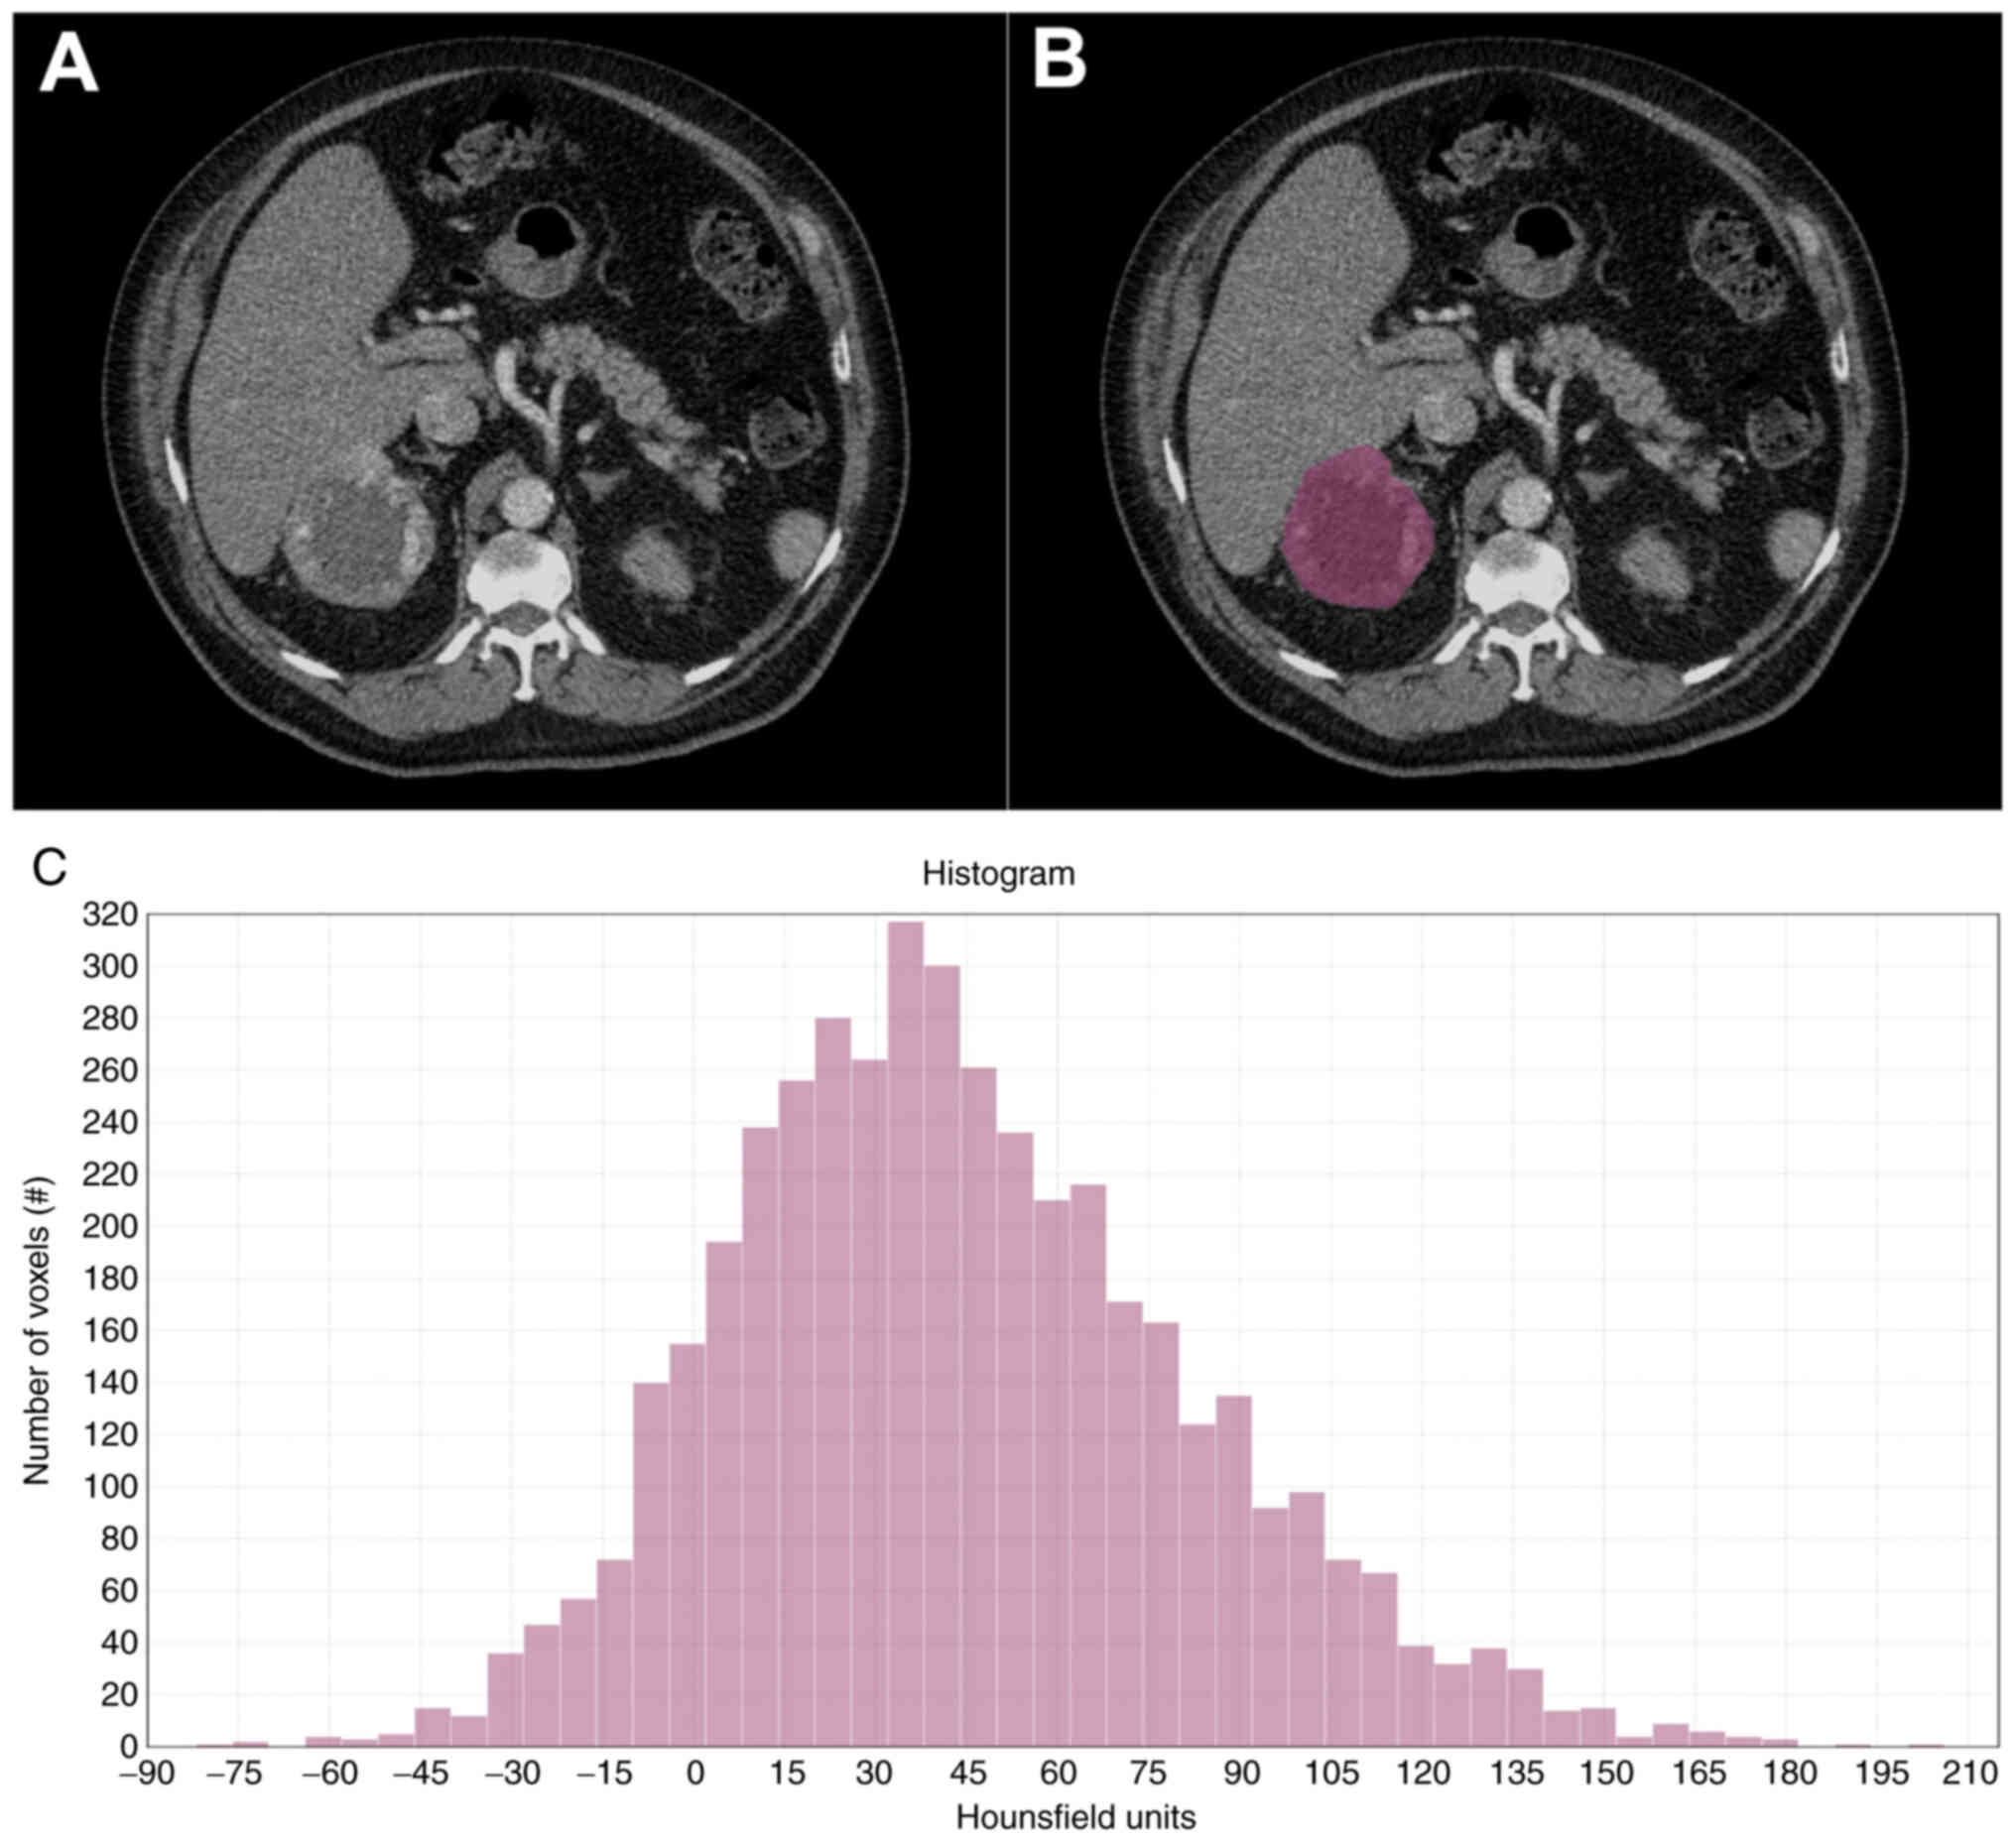
Radiomics
Texture analysis was performed using the texture
protocol of LifeX software version 6.0 (https://lifexsoft.org/) (21). A single operator drew one region of
interest (ROI) on the largest cross-sectional area of the primary
tumor from each CT scan in the arterial phase (Fig. 1). We set the software to obtain
features in the following categories: texture features (Grey Level
Co-occurrence Matrix, GLCM; Neighborhood Grey-Level Difference
Matrix, NGLDM; Grey-Level Run Length Matrix, GLRLM; Grey-Level Zone
Length Matrix, GLZLM), shape indices (sphericity, compacity,
volume), first-order features from the histogram (entropy,
entropy_log2, energy), conventional indices (quartiles, min, mean,
max, peak, skewness, kurtosis), and discretized indices (quartiles,
min, mean, max, peak, skewness, kurtosis). We obtained a total of
58 radiomic parameters.
Statistical analysis
We applied a backward stepwise selection process to
obtain the variables for building the logistic regression models
(22). We began with a model
composed of all the variables. Then we tested the elimination of
each variable to choose the ones that best fit the model to the
desired criterion (in this case, response to treatment). The goal
is to reduce the predictor variables to those necessary and
contribute most of the variance in the model. The process is done
automatically by the software. After this step, we ran a logistic
regression analysis of the variables in three models to explore a
possible correlation with the systemic therapy response.
We performed a Receiver Operating Characteristic
(ROC) curve analysis to calculate the AUC and the 95% confidence
interval (CI) in each model. We performed all statistical analysis
in Stata/IC 16.1 (https://www.stata.com/).
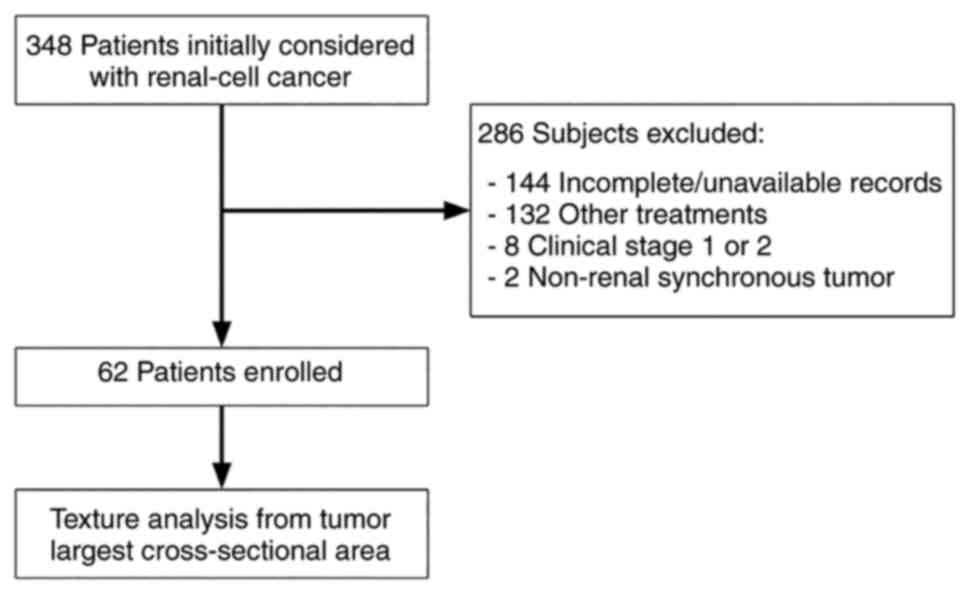
Results
Of 348 patients initially considered, we excluded
those with incomplete or unavailable clinical and imaging records
(n=144), other treatments (n=132), clinical stage 1 and 2 (n=8),
non-renal synchronous tumors (n=2), and baseline CT performed after
one month of treatment (Fig. 2).
The final cohort comprised 62 patients (mean age 57.5, +/- 12.2, 18
women and 44 men) (Table I).
 | Table I.Demographic characteristics of the
study population. |
Table I.
Demographic characteristics of the
study population.
| Variables | Patients (n=62) |
|---|
| Age, mean (SD) | 57.5 (12.2) |
| Sex, n (%) |
|
| Male | 44 (71%) |
|
Female | 18 (29%) |
| Risk, n (%) |
|
|
Favorable | 7 (11%) |
|
Intermediate | 35 (56%) |
| Poor | 20 (32%) |
| ECOG scale, n
(%) |
|
| 0 | 22 (35%) |
| 1 | 24 (39%) |
| 2 | 9 (15%) |
| 3 | 7 (11%) |
| Treatment, n (%) |
|
|
Pazopanib | 36 (58%) |
|
Sunitinib | 26 (42%) |
| Treatment response, n
(%) |
|
| No | 38 (61%) |
| Yes | 24 (39%) |
Most common sites of metastases were the following:
lymph nodes 44/62 (71%), lung 42/62 (68%), adrenal glands 20/62
(32%), brain 18/62 (29%), liver 14/62 (23%), soft tissue 14/62
(23%), and bone 10/62 (16%). The primary tumor was in the right
kidney in 36/62 (58%) and in the left kidney 26/62 (42%) (Table II).
| Table II.Characteristics of the kidney
tumors. |
Table II.
Characteristics of the kidney
tumors.
| Variables | Patients (n=62) |
|---|
| Size in mm, mean
(SD) | 101.0 (32.2) |
| Histological type, n
(%) |
|
|
Renal-cell cancer | 62 (100%) |
| Location, n (%) |
|
| Right
kidney | 36 (58%) |
| Left
kidney | 26 (42%) |
| Site of metastasis, n
(%) |
|
| Lymph
nodes | 44 (71%) |
| Lung | 42 (68%) |
| Adrenal
glands | 20 (32%) |
|
Brain | 18 (29%) |
|
Liver | 14 (23%) |
| Soft
tissue | 14 (23%) |
| Bone | 10 (16%) |
After the stepwise selection, we selected the
following variables to be part of the radiomic features to build
the logistic regression model. We divided the variables into
clinical (sex, age, tumor size, lymph nodes, risk, ECOG scale,
therapy) and radiomic features (glcm_entropy_log2,
conventional_HUmean, and glcm_dissimilarity).
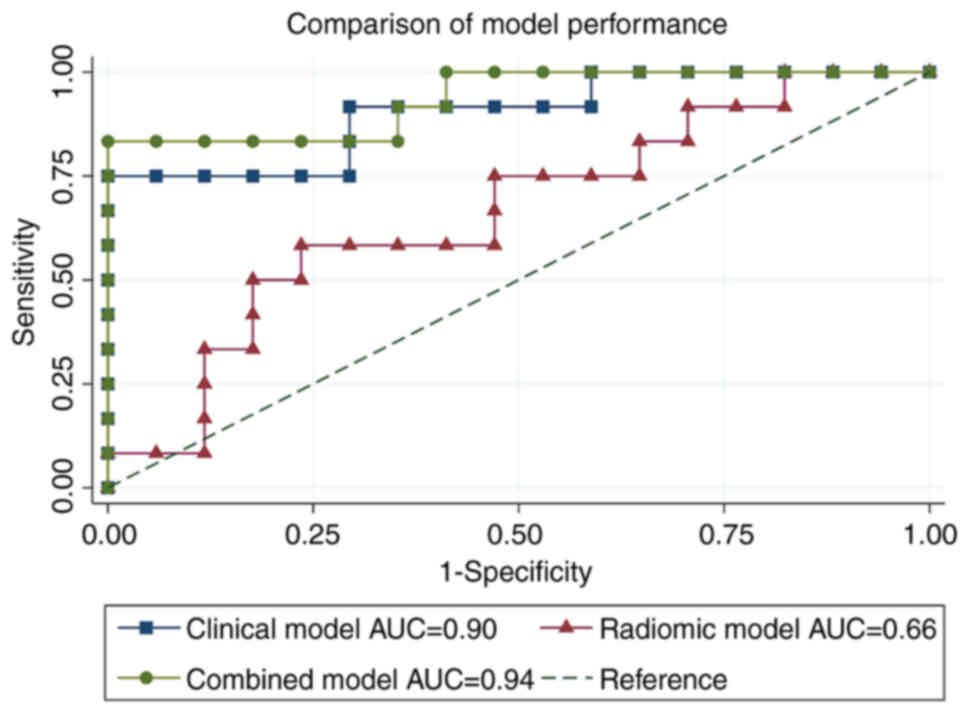
Three different models were tested to predict
response to systemic therapy, i.e., the clinical model (clinical
data alone), the radiomic model (radiomic features alone), and a
combined model (clinical data plus radiomic features). After
performing the ROC curve analysis, the clinical model showed an AUC
of 0.90 with a sensitivity and specificity of 75 and 82.35%
respectively (standard error of 0.06, 95% CI 0.78-1.00), the
radiomic model an AUC of 0.66 with a sensitivity and specificity
16.67 and 89.47% respectively (standard error of 0.11, 95% CI
0.45-0.87), and the combined model an AUC of 0.94 with a
sensitivity and specificity 83.33 and 94.12% respectively (standard
error of 0.04, 95% CI 0.84-1.00) (Fig.
3).
Discussion
Although novel therapies exist, up to 30% of
patients present intrinsic resistance and early treatment failure,
this is a complex problem for which we do not have a prediction
method (23,24). Furthermore, an early progression is
related to lower overall survival and is costlier than a late one
(25).
In this study, we have tested three models to
predict the response to treatment to TKI in advanced renal cancer,
finding that the radiomic information can improve the efficacy of
the algorithm to predict response shifting from an AUC of 0.90 in
the clinical model alone to 0.94 when combining with radiomic
features.
The concept of applying radiomics to predict
response is not new (26–29). Zhi Ji et al predicted
response to immunotherapy utilizing radiomics in 87 patients with
gastrointestinal malignant tumors obtaining a model with an AUC of
0.80 with a sensitivity and specificity of 83.3 and 88.9%
respectively. In this model, they did not combine clinical data
(26). Yang B et al
predicted response to immunotherapy in 92 patients with lung
cancer. The model combined 15 radiomic features and
clinicopathologic data obtaining an AUC of 0.90, a sensitivity of
85.7%, and a specificity of 88.4% (27). We strongly believe that adding
clinical data to the model is paramount to obtaining a robust
model. Park K et al built a Radiomics-based model to predict
response to anti-PD-1/PD-L1 in 62 patients with metastatic
urothelial carcinoma. The AUC of this model was 0.87 (95% CI,
0.65-0.97) and 0.88 (95%CI, 0.67-0.98) for predicting objective
response and disease control, respectively (28). Radiomics has shown a promising
performance regarding renal cell cancer. In respect of RCC
subtypes, Zhang et al built a radiomic model from different
CT phases (non-contrast, corticomedullary, nephrographic, and
excretory phases). With this, they obtained an accuracy of 0.80 and
an AUC of 0.89 for distinguishing clear cell RCC from non-clear
cell RCC. The sensitivity and specificity for clear cell RCC were
0.85 and 0.83; for papillary RCC 0.60 and 0.91; and for chromophobe
RCC 0.66 and 0.91, respectively (29).
Regarding overall survival, Nazari et al
created a combined model (radiomic features and patient stage and
grade) to predict the risk of death in 5 years in patients with
clear cell RCC. This model had an AUC of 0.95-0.98, an accuracy of
0.97-0.98, sensitivity of 0.93-0.98, and specificity of 0.93-0.96
with a 95% confidence interval (~1)’ (30).
Some limitations in our study are that we included a
small number of participants since only a few patients in our
clinic have access to the treatment with TKI, which also affected
the number of features utilized in the model to avoid overfitting.
A critical step for internal and external validation of our models
is to test them with different datasets. Unfortunately, lack of
recruitment and limited access to external databases hampers this
process.
One strength in the study is that this is the first
study aiming to predict response to TKI in advanced Kidney cancer.
To find this type of predictor is paramount to avoid the
expenditure of valuable time and monetary resources on unsuccessful
therapies. Although we found a promising model to predict response
combining radiomic features and clinical information, the mentioned
limitations prevent us from making solid conclusions. Collaborative
efforts should be made between specialties to build robust models
that integrate essential clinical, genetic, and radiological
information. Moreover, the institutions should guarantee the
quality and reproducibility of data to shape accurate
databases.
In summary, models combining clinical data and
radiomics could anticipate response to systemic therapy with TKI in
patients with advanced kidney cancer.
Acknowledgements
Not applicable.
Funding
Funding: No funding was received.
Availability of data and materials
The datasets used and/or analyzed during the current
study are available from the corresponding author on reasonable
request.
Authors' contributions
GE and AAN contributed to the conception and design
of the study. AAN, DAR, GE, CC, AG, and DH collected the data. CC
performed the imaging analysis. AAN and DAR performed the
statistical analysis. All authors contributed to the discussion of
the results, manuscript writing and review. AAN and AG confirm the
authenticity of all the raw data. All authors read and approved the
final manuscript.
Ethics approval and consent to
participate
The study was conducted in accordance with the
Declaration of Helsinki and approved by the Research Ethics
Committee of the University Hospital ‘Dr. José Eleuterio González’
(Monterrey, México) under approval number RA20-00007, which
required no informed consent from the patients.
Patient consent for publication
Not applicable.
Authors' information
ORCID: Dr Adrián A. Negreros-Osuna,
0000-0002-9800-0169; Dr Diego A. Ramírez-Mendoza,
0000-0002-5067-8317; Dr Claudio Casas-Murillo, 0000-0002-4353-6919;
Dr Abraham Guerra-Cepeda, 0000-0002-6408-1116; Dr David
Hernández-Barajas, 0000-0001-8899-000X; Dr Guillermo
Elizondo-Riojas, 0000-0002-9555-430X.
Competing interests
The authors declare that they have no competing
interests.
References
|
1
|
World Health Organization (WHO), . Cancer
Today: GLOBOCAN 2020. International Agency for Research on Cancer.
WHO; Geneva, Switzerland: 2020, https://gco.iarc.fr/today/online-analysis-pieJanuary
05–2022
|
|
2
|
National Cancer Institute (NCI), . Cancer
Stat Facts: Kidney and Renal Pelvis Cancer. Surveilance,
Epidemiology and End Results Program. NCI; https://seer.cancer.gov/statfacts/html/kidrp.htmlJanuary
05–2022
|
|
3
|
Pal S, Gong J, Mhatre SK, Lin SW, Surinach
A, Ogale S, Vohra R, Wallen H and George D: Real-world treatment
patterns and adverse events in metastatic renal cell carcinoma from
a large US claims database. BMC Cancer. 19:5482019. View Article : Google Scholar : PubMed/NCBI
|
|
4
|
Choueiri TK and Motzer RJ: Systemic
therapy for metastatic renal-cell carcinoma. N Engl J Med.
376:354–366. 2017. View Article : Google Scholar : PubMed/NCBI
|
|
5
|
NCCN, . Kidney Cancer version 3.2023,
2022. https://www.nccn.org/professionals/physician_gls/pdf/kidney.pdfOctober
5–2022
|
|
6
|
Escudier B, Porta C, Schmidinger M,
Rioux-Leclercq N, Bex A, Khoo V, Grünwald V, Gillessen S and
Horwich A: Renal cell carcinoma: ESMO clinical practice guidelines
for diagnosis, treatment and follow-up. Ann Oncol. 30:706–720.
2019. View Article : Google Scholar : PubMed/NCBI
|
|
7
|
Morais C: Sunitinib resistance in renal
cell carcinoma. J Kidney Cancer VHL. 1:1–11. 2014. View Article : Google Scholar : PubMed/NCBI
|
|
8
|
Siegel RL, Miller KD and Jemal A: Cancer
statistics, 2019. CA Cancer J Clin. 69:7–34. 2019. View Article : Google Scholar : PubMed/NCBI
|
|
9
|
Motzer RJ, Hutson TE, Tomczak P,
Michaelson MD, Bukowski RM, Rixe O, Oudard S, Negrier S, Szczylik
C, Kim ST, et al: Sunitinib versus interferon alfa in metastatic
renal-cell carcinoma. N Eng J Med. 356:115–124. 2007. View Article : Google Scholar : PubMed/NCBI
|
|
10
|
Sternberg CN, Davis ID, Mardiak J,
Szczylik C, Lee E, Wagstaff J, Barrios CH, Salman P, Gladkov OA,
Kavina A, et al: Pazopanib in locally advanced or metastatic renal
cell carcinoma: Results of a randomized phase III trial. J Clin
Oncol. 28:1061–1068. 2010. View Article : Google Scholar : PubMed/NCBI
|
|
11
|
Motzer RJ, Hutson TE, Cella D, Reeves J,
Hawkins R, Guo J, Nathan P, Staehler M, de Souza P, Merchan JR, et
al: Pazopanib versus sunitinib in metastatic renal-cell carcinoma.
N Eng J Med. 369:722–731. 2013. View Article : Google Scholar : PubMed/NCBI
|
|
12
|
Haralick RM, Shanmugam K and Dinstein I:
Textural features for image classification. IEEE Trans Syst Man
Cybern SMC. 3:610–621. 1973. View Article : Google Scholar
|
|
13
|
Ganeshan B, Miles KA, Young RCD and
Chatwin CR: In search of biologic correlates for liver texture on
portal-phase CT. Acad Radiol. 14:1058–1068. 2007. View Article : Google Scholar : PubMed/NCBI
|
|
14
|
Ng F, Ganeshan B, Kozarski R, Miles KA and
Goh V: Assessment of primary colorectal cancer heterogeneity by
using whole-tumor texture analysis: Contrast-enhanced CT texture as
a biomarker of 5-year survival. Radiology. 266:177–184. 2013.
View Article : Google Scholar : PubMed/NCBI
|
|
15
|
Negreros-Osuna AA, Parakh A, Corcoran RB,
Pourvaziri A, Kambadakone A, Ryan DP and Sahani DV: Radiomics
texture features in advanced colorectal cancer: Correlation with
BRAF Mutation and 5-year overall survival. Radiol Imaging
Cancer. 2:e1900842020. View Article : Google Scholar : PubMed/NCBI
|
|
16
|
Yip C, Landau D, Kozarski R, Ganeshan B,
Thomas R, Michaelidou A and Goh V: Primary esophageal cancer:
Heterogeneity as potential prognostic biomarker in patients treated
with definitive chemotherapy and radiation therapy. Radiology.
270:141–148. 2014. View Article : Google Scholar : PubMed/NCBI
|
|
17
|
Ganeshan B, Abaleke S, Young RCD, Chatwin
CR and Miles KA: Texture analysis of non-small cell lung cancer on
unenhanced computed tomography: Initial evidence for a relationship
with tumour glucose metabolism and stage. Cancer Imaging.
10:137–143. 2010. View Article : Google Scholar : PubMed/NCBI
|
|
18
|
Smith AD, Gray MR, del Campo SM, Shlapak
D, Ganeshan B, Zhang X and Carson WE III: Predicting overall
survival in patients with metastatic melanoma on antiangiogenic
therapy and RECIST stable disease on initial posttherapy images
using CT texture analysis. Am J Roentgenol. 205:W283–W293. 2015.
View Article : Google Scholar : PubMed/NCBI
|
|
19
|
Deng Y, Soule E, Samuel A, Shah S, Cui E,
Asare-Sawiri M, Sundaram C, Lall C and Sandrasegaran K: CT texture
analysis in the differentiation of major renal cell carcinoma
subtypes and correlation with Fuhrman grade. Eur Radiol.
29:6922–6929. 2019. View Article : Google Scholar : PubMed/NCBI
|
|
20
|
Haider MA, Vosough A, Khalvati F, Kiss A,
Ganeshan B and Bjarnason GA: CT texture analysis: A potential tool
for prediction of survival in patients with metastatic clear cell
carcinoma treated with sunitinib. Cancer Imaging. 17:42017.
View Article : Google Scholar : PubMed/NCBI
|
|
21
|
Nioche C, Orlhac F, Boughdad S, Reuzé S,
Goya-Outi J, Robert C, Pellot-Barakat C, Soussan M, Frouin F and
Buvat I: LIFEx: A freeware for radiomic feature calculation in
multimodality imaging to accelerate advances in the
characterization of tumor heterogeneity. Cancer Res. 78:4786–4789.
2018. View Article : Google Scholar : PubMed/NCBI
|
|
22
|
Vittinghoff E, Glidden DV, Shiboski SC and
McCulloch CE: Predictor selection. Regression methods in
biostatistics: Linear, logistic, survival, and repeated measures
models. 1st ed. Dietz K, Gail M, Krickeberg K, Samet J and Tsiatis
A: Springer; New York: pp. 133–156. 2005
|
|
23
|
Harada K, Nozawa M, Uemura M, Tatsugami K,
Osawa T, Yamana K, Kimura G, Fujisawa M, Nonomura N, Eto M, et al:
Treatment patterns and outcomes in patients with unresectable or
metastatic renal cell carcinoma in Japan. Int J Urol. 26:202–210.
2019. View Article : Google Scholar : PubMed/NCBI
|
|
24
|
Goh V, Ganeshan B, Nathan P, Juttla JK,
Vinayan A and Miles KA: Assessment of response to tyrosine kinase
inhibitors in metastatic renal cell cancer: CT texture as a
predictive biomarker. Radiology. 261:165–171. 2011. View Article : Google Scholar : PubMed/NCBI
|
|
25
|
Hutson TE, Liu FX, Dieyi C, Kim R,
Krulewicz S, Kasturi V and Bhanegaonkar A: Effects of early vs
delayed progression on clinical and economic outcomes in patients
with metastatic renal cell carcinoma treated with tyrosine kinase
inhibitors as first-line therapy: Results from the IMPACT RCC
claims data analysis. J Manag Care Spec Pharm. 27:1171–1181.
2021.PubMed/NCBI
|
|
26
|
Ji Z, Cui Y, Peng Z, Gong J, Zhu H, Zhang
X, Li J, Lu M, Lu Z, Shen L and Sun YS: Use of radiomics to predict
response to immunotherapy of malignant tumors of the digestive
system. Med Sci Monit. 26:e9246712020. View Article : Google Scholar : PubMed/NCBI
|
|
27
|
Yang B, Zhou L, Zhong J, Lv T, Li A, Ma L,
Zhong J, Yin S, Huang L, Zhou C, et al: Combination of computed
tomography imaging-based radiomics and clinicopathological
characteristics for predicting the clinical benefits of immune
checkpoint inhibitors in lung cancer. Respir Res. 22:1892021.
View Article : Google Scholar : PubMed/NCBI
|
|
28
|
Park KJ, Lee JL, Yoon SK, Heo C, Park BW
and Kim JK: Radiomics-based prediction model for outcomes of
PD-1/PD-L1 immunotherapy in metastatic urothelial carcinoma. Eur
Radiol. 30:5392–5403. 2020. View Article : Google Scholar : PubMed/NCBI
|
|
29
|
Zhang H, Yin F, Chen M, Qi A, Lai Z, Yang
L and Wen G: A reliable prediction model for renal cell carcinoma
subtype based on radiomic features from 3D multiphase enhanced CT
images. J Oncol. 2021:65952122021.PubMed/NCBI
|
|
30
|
Nazari M, Shiri I and Zaidi H:
Radiomics-based machine learning model to predict risk of death
within 5-years in clear cell renal cell carcinoma patients. Comput
Biol Med. 129:1041352021. View Article : Google Scholar : PubMed/NCBI
|