Introduction
Bile duct cancer (BDC) is a malignant tumor with a
20~30% 5-year survival rate, even after resection, where most
patients who cannot receive resection die within 2 years (1,2).
This is because symptoms occur during the late stages of disease
progression and an early diagnosis prior to metastasis,
particularly to the lymphatic system, is challenging. Non-surgical
palliative chemotherapy and radiation therapy may be considered,
but the results have not been satisfactory (1).
Ursodeoxycholic acid (UDCA), an endogenous
hydrophilic bile acid, protects cells by inhibiting apoptosis in
various cell types, such as hepatocytes. Activation of the
EGFR/MAPK survival pathway, prevention of mitochondrial dysfunction
and apoptosis, and minimization of the pro-apoptotic cascade
activation are all known biological mechanisms that utilize UDCA to
protect cells (3–5). UDCA is known to induce, rather than
inhibit, apoptosis in malignant cells (6). In particular, UDCA induces potent
apoptosis through BAX gene activation and BCL2 inhibition in
hepatoma cells (6). Furthermore, a
mouse model study demonstrated that UDCA inhibited hepatocellular
carcinoma cell growth (7). UDCA
inhibits signaling of EGFR and COX-2, blocking the tumorigenic
effect caused by deoxycholic acid (DCA), thereby inhibiting the
progression of colon cancer cells (4,8,9). A
study was conducted on whether the effects of UDCA on apoptosis and
growth in malignant and normal cells. This study showed that normal
oral epithelial cells were not affected by UDCA treatment up to a
toxic concentration, whereas apoptosis was stimulated in oral
cancer epithelial cells proportional to the treatment concentration
(10). Studies on whether UDCA
decreases the incidence of BDC in high-risk groups are
controversial. However, several epidemiological studies agree that
long-term UDCA treatment lowers the incidence of cancer (11,12).
Epithelial-mesenchymal transition (EMT) is a complex
reversible process wherein epithelial cells increasingly change to
the functional and structural properties of mesenchymal cells
(13–15). Although it is the basis of
physiological biogenesis and wound healing, EMT is also an early
mechanism of metastasis and invasion at the primary site of tumor
cells. The primary EMT mechanism alters gene expression to suppress
the epithelial phenotype, activating the mesenchymal phenotype
(16,17). In other words, the first step of
EMT is the internalization and inhibition of E-cadherin, which
induces the rupture of adherens junctions. After acquiring
mesenchymal traits, EMT-transcriptional factors (ZEB1/2, Slug, Twis
and Snail, etc.) regulate the expression of E-cadherin (14,15,18,19).
Several studies have shown that EMT features was highly associated
with pathological severity in terms of the progression and
metastasis of BDC (20–25). Disappearance of epithelial markers
(such as E-cadherin) and acquisition of mesenchymal markers (such
as N-cadherin, S100A4, and Slug) were associated with aggressive
characteristics of BDC, including metastasis, vascular and neural
invasion, advanced tumor stage, and poor differentiation (20–22,24).
EGFR activation is known to destabilize the
E-cadherin/β-catenin complex in several tumors, thereby interfering
with cell-cell adhesion, promoting EMT, and helping acquire a
motile phenotype (25–27). Additionally, over-expressed EGFR is
correlated with the tumor progression in BDC as well (28–32),
and the EGFR axis triggers EMT in BDC cells, the most crucial step
in the progression of the cancer (33). Recently, our studies demonstrated
that UDCA suppresses the proliferation of BDC cells through the
induction of apoptosis and inhibition of the EGFR-PI3K-Akt
signaling pathway. Moreover, we found that UDCA blocks the
EGFR-MAPK p42/44 (ERK1/2) signaling pathway and inhibits the
invasion of the cancer cells (34).
Accordingly, this study was conducted to determine
whether UDCA inhibits EMT and promotes the expression of E-cadherin
to inhibit the invasion and aggression of BDC. In addition, the
primary mechanism of inhibition of EMT by UDCA, believed to be
related to the EGF/EGFR axis, was investigated.
Materials and methods
Materials
Fetal bovine serum (FBS), Roswell Park Memorial
Institute (RPMI) 1640 medium, penicillin-streptomycin, trypsin, and
sodium bicarbonate were supplied by Gibco. Dimethyl sulfoxide
(DMSO), 3-(4,5-dimethylthiazol-2-yl)-2,5-diphenyltetrazolium
bromide (MTT), and UDCA were procured from Sigma Chemicals. Goat
anti-rabbit IgG-horseradish peroxidase (HRP, Cat# sc2004) and human
EGF were supplied by Santa Cruz Biotechnology. The Western Blot
Hyper HRP substrate (Cat# T7103A) was procured from Takara.
Gefitinib was procured from Roche Diagnostics. E-cadherin (Cat#
3195), N-cadherin (Cat# 4160), FAK (Cat# 3285), phosphorylated FAK
(pFAK, cat# 3283), and β-actin (Cat# 4967) antibodies were
purchased from Cell Signaling Technology.
Cell culture
The Korean Cell Line Bank (KCLB) supplied the
SNU-245 cells (cat. #00245) obtained from distal common BDC
presenting well-differentiation. They reported that the cells did
not have any mutations in the genes of p53, p15, p16, hMLH1, and
K-Ras. Moreover, the gene and mRNA of E-cadherin without mutation
were found. The KCLB authenticated the absence of bacterial or
mycoplasma contamination and the short tandem repeat (35). We cultured the SNU-245 cells in
RPMI 1640 medium supplemented with 2 mM glutamine, 10% FBS, 1.5 g/l
sodium bicarbonate, 100 µg/ml streptomycin, and 100 IU/ml
penicillin. The media was refreshed twice a week and the cells were
incubated at 37°C in a humidified incubator with 5% CO2.
The cells were dislodged from the vessel using EDTA (1 g/l) and
trypsin (2.5 g/l) when the cells were confluent.
MTT assays
MTT assays were performed to estimate cell
proliferation as previously described (36). Briefly, cells were plated at a
density of 5×10⁴ cells/ml in RPMI regular media in
96-wells and incubated for 24 h. The various concentrations of UDCA
then treated the cells within the serum-free medium (SFM) for 24 or
48 h. MTT (0.5 mg/ml) was then loaded in each well, and the cells
were incubated at 37°C for an extra 4 h. After removing of the
culture media, 100 µl of DMSO was added to each well. The
colorimetric response was estimated using an ELX800 (Biotek) at 570
nm.
Cell apoptosis assays
Cell apoptosis was estimated using the Cell Death
Detection ELISA Plus Kit (Roche Molecular Biochemicals) that
detects histone-associated deoxyribonucleic acid (DNA) fragments as
previously described (36). Cells
were plated at a density of 2×10⁴ cells/ml in 96-well
plates and incubated for 24 h. Various concentrations of UDCA were
applied to the cells at 37°C for 24 or 48 h. After removing the
media, 100 µl lysis buffer were loaded onto the cells for 30 min
and followed by centrifugation at 200 × g at 4°C for 10 min. The
supernatant was placed in the wells of a streptavidin-coated plate.
The cell lysate was treated with the antibodies for DNA-peroxidase
and histone-biotin, and then incubated for 2 h. After washing,
2,2′-azinobis-3-ethyl-benzothiazoline-6-sulfonic acid (100 µl) was
incubated with each well for 20 min. A BioTek ELX800 microplate
reader (BioTek Instruments) measured the absorbance at 405 nm.
Flow cytometry analysis
The Annexin V-FITC/PI (fluorescein
isothiocyante/propidium iodide) Apoptosis Detection kit. (Cat.
#ab14085; Abcam) was applied to the identification of apoptotic
cells. Cells were treated with indicated concentrations of UDCA or
gefitinib at 37°C for 48 h. The cells were collected
(2×10⁶ cells) and washed once with PBS, and then,
resuspended in 500 µl binding buffer (1×). The harvested cells were
stained with Annexin V-FITC and PI for 20 min at RT in the dark.
The stained cells were measured by CytoFLEX Flow Cytometer (Beckman
Coulter), and the cell apoptosis rate was analyzed using CytExert
software version 2.4 (Beckman Coulter).
Western blot assays
Western blot assays were conducted as previously
described (36). Briefly, cells
were treated with various concentrations of UDCA, gefitinib, or EGF
when the confluence reached 90% for 24 or 48 h. Cells were
collected and washed with cold PBS (Gibco). Protein samples were
extracted with RIPA buffer (Cat# R0278, Sigma Chemicals) and
centrifuged at 15,000 rpm for 20 min. Bradford assays
(Sigma-Aldrich; Merck KGaA) were used to estimate the amount of
protein content of the cell lysate. Blots were blocked using a
blocking solution at room temperature and incubated overnight at
4°C in 5% bovine serum albumin (BSA) solution with rabbit
polyclonal diluted antibodies for N-cadherin (1:1,000), E-cadherin
(1:1,000), focal adhesion kinase (FAK, 1:1,000), phosphorylated FAK
(pFAK, 1:1,000), and β-actin (1:1,000). The nitrocellulose
membranes were incubated with goat anti-rabbit IgG-HRP (1:8,000
dilution) after rinsing with TBS-T at room temperature for 1 h. The
Luminata Forte Western HRP Western Blotting Detection Kit
(Millipore Sigma) was used to detect the specific bands on the
blots. Amersham image 600 system detected the bands automatically
(Amersham Biosciences-GE Healthcare). The signal intensities of
bands were measured with the ImageJ (Version 1.43; National
Institute of Health).
Reverse transcription-quantitative PCR
(RT-qPCR)
Extraction and quantification of RNA
BDC cells were lysed by adding 1 ml of Tri-reagent
(Sigma-Aldrich; Merck KGaA) over 1 min. The lysate was the treated
with 200 µl chloroform (Sigma-Aldrich; Merck KGaA) and incubated
for 10 min. It was then centrifuged at 12,000 × g at 4°C for 10
min. An equal volume of isopropanol (Sigma-Aldrich; Merck KGaA) was
treated to the supernatant and incubated for 15 min. The final
product was centrifuged again at 12,000 × g at 4°C for 15 min. The
pelleted RNA was rinsed with 70% ethanol and 50 µl
nuclease-free-water (Roche Diagnostics) was added to dissolve the
RNA, which was quantified using ELX800 (Biotek) at 260 nm.
Synthesis of cDNA
After mixing 1 µg of RNA [extracted using RNA to
cDNA EcoDry Premix (Takara)] and 20 µl of RT Master Mix, cDNA was
synthesized under reverse transcription conditions (one cycle at
42°C for 60 min, one cycle at 70°C for 10 min, and 4°C for 10 min).
After completion cDNA synthesis, 20 µl of cDNA was saved at −70°C
until use.
Relative quantitative PCR
Slug and ZEB1 gene expressions in the cDNA of
SNU-245 cells were measured using relative quantitative PCR
(LightCycler 480 using SYBR®-Green I Master, Cat.
#5081963001, Roche Diagnostics). Relative quantitation of
expression was determined by comparative Ct
(2−ΔΔCt) method (37).
PCR was performed under the following conditions: 1 cycle at 50°C
for 2 min, 1 cycle at 95°C for 10 min, and 40 cycles of 95°C for 15
sec and 60°C for 1 min. Primer sequences were as follows:
Slug, forward, 5′-ACACATTAGAACTCACACGG-3′, reverse,
5′-GAGAGACATTCTGGAGAAGG-3′; ZEB1, forward,
5′-ACCTGCCAACAGACCAGACAGTGT-3′, reverse,
5′-GCCCTTCCTTTCTGTCATCCTCCCA-3′; GAPDH, forward,
5′-GAGTCAACGGATTTGGTCGT-3′, reverse,
5′-GACAAGCTTCCCGTTCTCAG-3′.
Immunofluorescence staining
assays
Cells were cultured on glass coverslips and treated
with 250 µM UDCA, 10 nM gefitinib, or 50 nM EGF for 24 h. Cells
were fixed with 4% paraformaldehyde (Sigma-Aldrich; Merck KGaA) for
10 min, and then, cells were permeabilized with 0.3% triton x-100
in PBS for 10 min. Cells were incubated further with 10% goat serum
(Cat. #sc-2043) (Santa Cruz Biotechnology) solution at room
temperature for 1 h. Cells were incubated with an E-cadherin
antibody (1:200 dilution, Cat. #3195; Cell Signaling Technology) in
PBS containing 1% BSA (PBS-A) at room temperature. After reaction,
this was incubated further with 1% albumin for 1 h and then goat
serum solution at room temperature for 1 h. The cells were treated
with a FITC-conjugated secondary antibody (1:500 dilution, Cat.
#sc-36869, Santa Cruz Biotechnology) for 1 h in PBS-A and rinsed
with PBS three times. The cells on coverslips were then treated
with DAPI (0.5 µg/ml) (Sigma-Aldrich; Merck KGaA) for 1 min, and
images were captured (×400 optical and ×3 digital magnification)
using a super-resolution confocal laser microscope (Carl
Zeiss).
Invasion assays
Invasion assays were performed as previously
described to evaluate the invasiveness of cancer cells (34). Briefly, we coated the upper
membranes of cell culture inserts (Cat# 3401, Corning Incorporated)
with Matrigel (Cat# A14132-01, Gibco) for 1 h. Serum-free regular
medium (described in cell culture) of 200 µl was plated to the
upper compartment, and 500 µl regular medium containing 10% FBS was
added to the lower compartment. The cells were plated at a density
of 2×10⁴ cells/ml in the upper inserts and incubated at
37°C for 24 or 48 h. The upper membranes containing invading cells
were fixed using 100% methanol for 20 min and stained for 15 min
with 0.1% crystal violet (Sigma Chemicals) at room temperature. The
upper surface of the inserts was washed in PBS, and noninvasive
cells were wiped with cotton swabs. The membranes containing
invading cells were mounted on slides, and light microscopy (100×,
magnification, Olympus BX51-p polarizing Microscope) was used to
count the number of cells present.
Statistical analysis
All experiments in this study were performed at
least in triplicate. All described results were representative data
and expressed as the means ± SD of duplicate cultures. The data
were considered to follow parametric distribution after performing
normality test (Skewness and Kurtosis statistics). One-way ANOVA
followed by Tukey post hoc test for multiple comparison was used to
compare three or more unpaired groups, and Student's t-test was
used to compare two unpaired groups. P-values of less than 0.05
were considered statistically significant. IBM-SPSS version 27
(Armonk) was used as a statistical software.
Results
UDCA effectively inhibits
proliferation and induces apoptosis in BDC cells
Suppression of BDC cell proliferation by UDCA and
gefitinib, a known EGFR inhibitor, was evaluated by an MTT assay
after incubation for 24 or 48 h. Both gefitinib and UDCA treatment
inhibited the viability of BDC cells in a dose- and time-dependent
manner (Fig. 1A and B). The
combination of UDCA and gefitinib for 24 or 48 h treatment
demonstrated an additive effect, although not synergistic, on the
proliferation of SNU-245 cells (Fig.
1C and D). A Cell Death Detection ELISA assay measured the
effect of UDCA and gefitinib on apoptosis. UDCA and gefitinib
induced significant apoptosis of BDC cells after 24 or 48 h of
incubation in a dose- and time-dependent manner as well (Fig. 2A and B). The combination of UDCA
and gefitinib for 48 h treatment also demonstrated an additive, but
not synergistic, effect on the apoptosis of SNU-245 cells (Fig. 2C). We confirmed that UDCA and
gefitinib induce significant apoptosis in BDC cells using Flow
cytometry assays (Fig. S1). These
results revealed that UDCA induced apoptosis and inhibited cell
proliferation as effectively as gefitinib, and the combination of
UDCA and gefitinib had an additive effect on apoptosis.
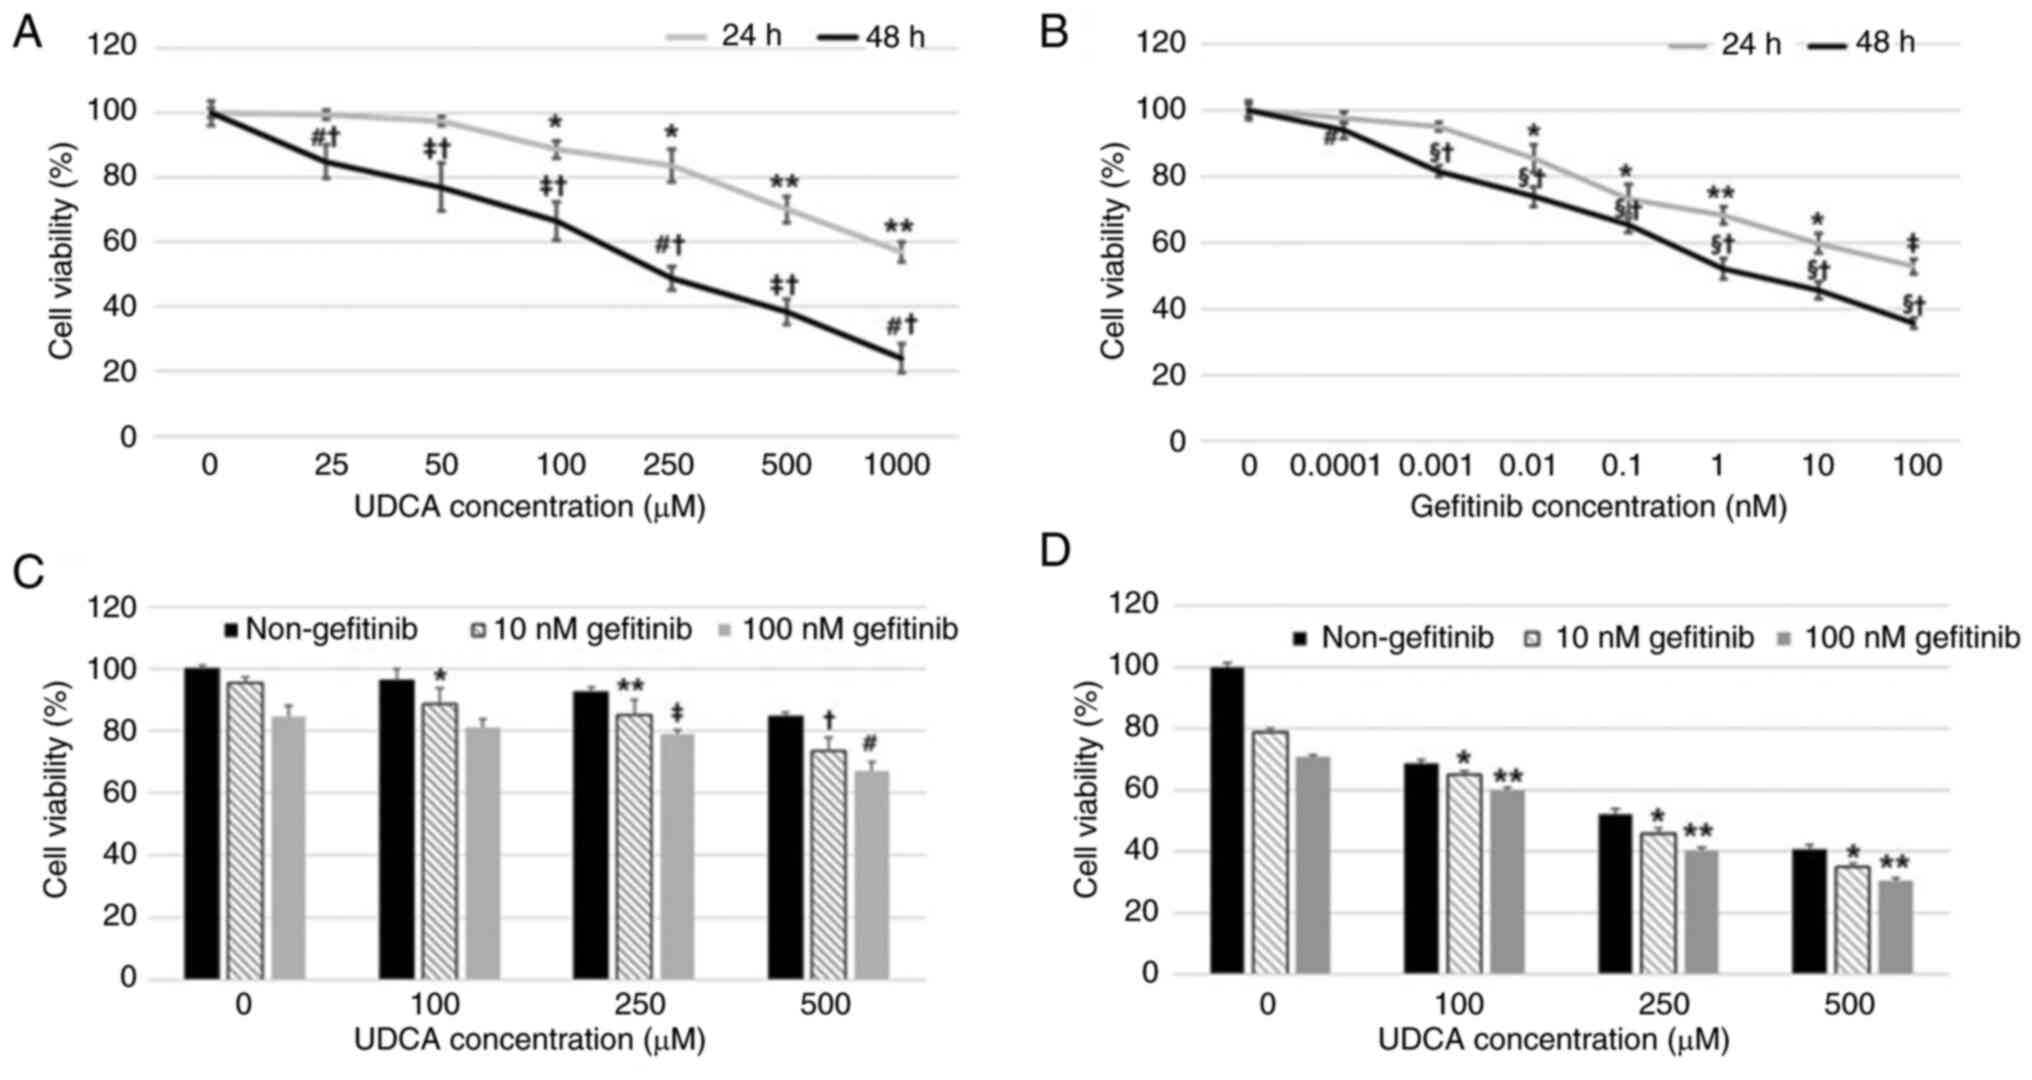 | Figure 1.UDCA inhibits proliferation in BDC
cells as effectively as gefitinib. Suppression of the proliferation
of BDC cells by (A) UDCA and (B) gefitinib was evaluated using an
MTT assay after incubation for 24 or 48 h. Both (B) gefitinib and
(A) UDCA treatment suppressed the viability of BDC cells in a dose-
and time-dependent manner. The combination of UDCA and gefitinib
demonstrated an additive effect on the viability of SNU-245 cells
for (C) 24 or (D) 48 h. The results are presented as the mean ± SD.
(A) *P<0.05 vs. untreated control cells for 24 h, **P<0.001
vs. untreated control and cells treated with all lower
concentrations of UDCA for 24 h, #P<0.001 vs.
untreated control and cells treated with all lower concentrations
of UDCA for 48 h, ‡P<0.01 vs. untreated control and
cells treated with all lower concentrations of UDCA for 48 h,
†P<0.001 vs. cells treated for 24 h with the same
concentration of UDCA. (B) *P<0.001 vs. untreated control and
cells treated with all lower concentrations of gefitinib for 24 h,
**P<0.001 vs. untreated control and cells treated with 0.01 nM
gefitinib for 24 h, ‡P<0.01 vs. untreated control and
cells treated with all lower concentrations of gefitinib for 24 h,
#P<0.01 vs. cells treated for 24 h with the same
concentration of gefitinib, †P<0.001 vs. cells
treated for 24 h with the same concentration of gefitinib,
§P<0.001 vs. untreated control and cells treated with
all lower concentrations of gefitinib for 48 h. (C) *P<0.01 vs.
non-treatment of UDCA (10 nM gefitinib), **P<0.001 vs.
non-treatment of UDCA (10 nM gefitinib), †P<0.001 vs.
non-treatment of UDCA and cells treated with all lower
concentrations of UDCA (co-treated with 10 nM gefitinib),
‡P<0.05 vs. non-treatment of UDCA (co-treated with
100 nM gefitinib), #P<0.001 vs. non-treatment of UDCA
and cells treated with all lower concentrations of UDCA (co-treated
with 100 nM gefitinib). (D) *P<0.001 vs. non-treatment of UDCA
and cells treated with all lower concentrations of UDCA (co-treated
with 10 nM gefitinib), **P<0.001 vs. non-treatment of UDCA
untreated control cells and cells treated with all lower
concentrations of UDCA (co-treated with 100 nM gefitinib). BDC,
bile duct cancer; UDCA, ursodeoxycholic acid. |
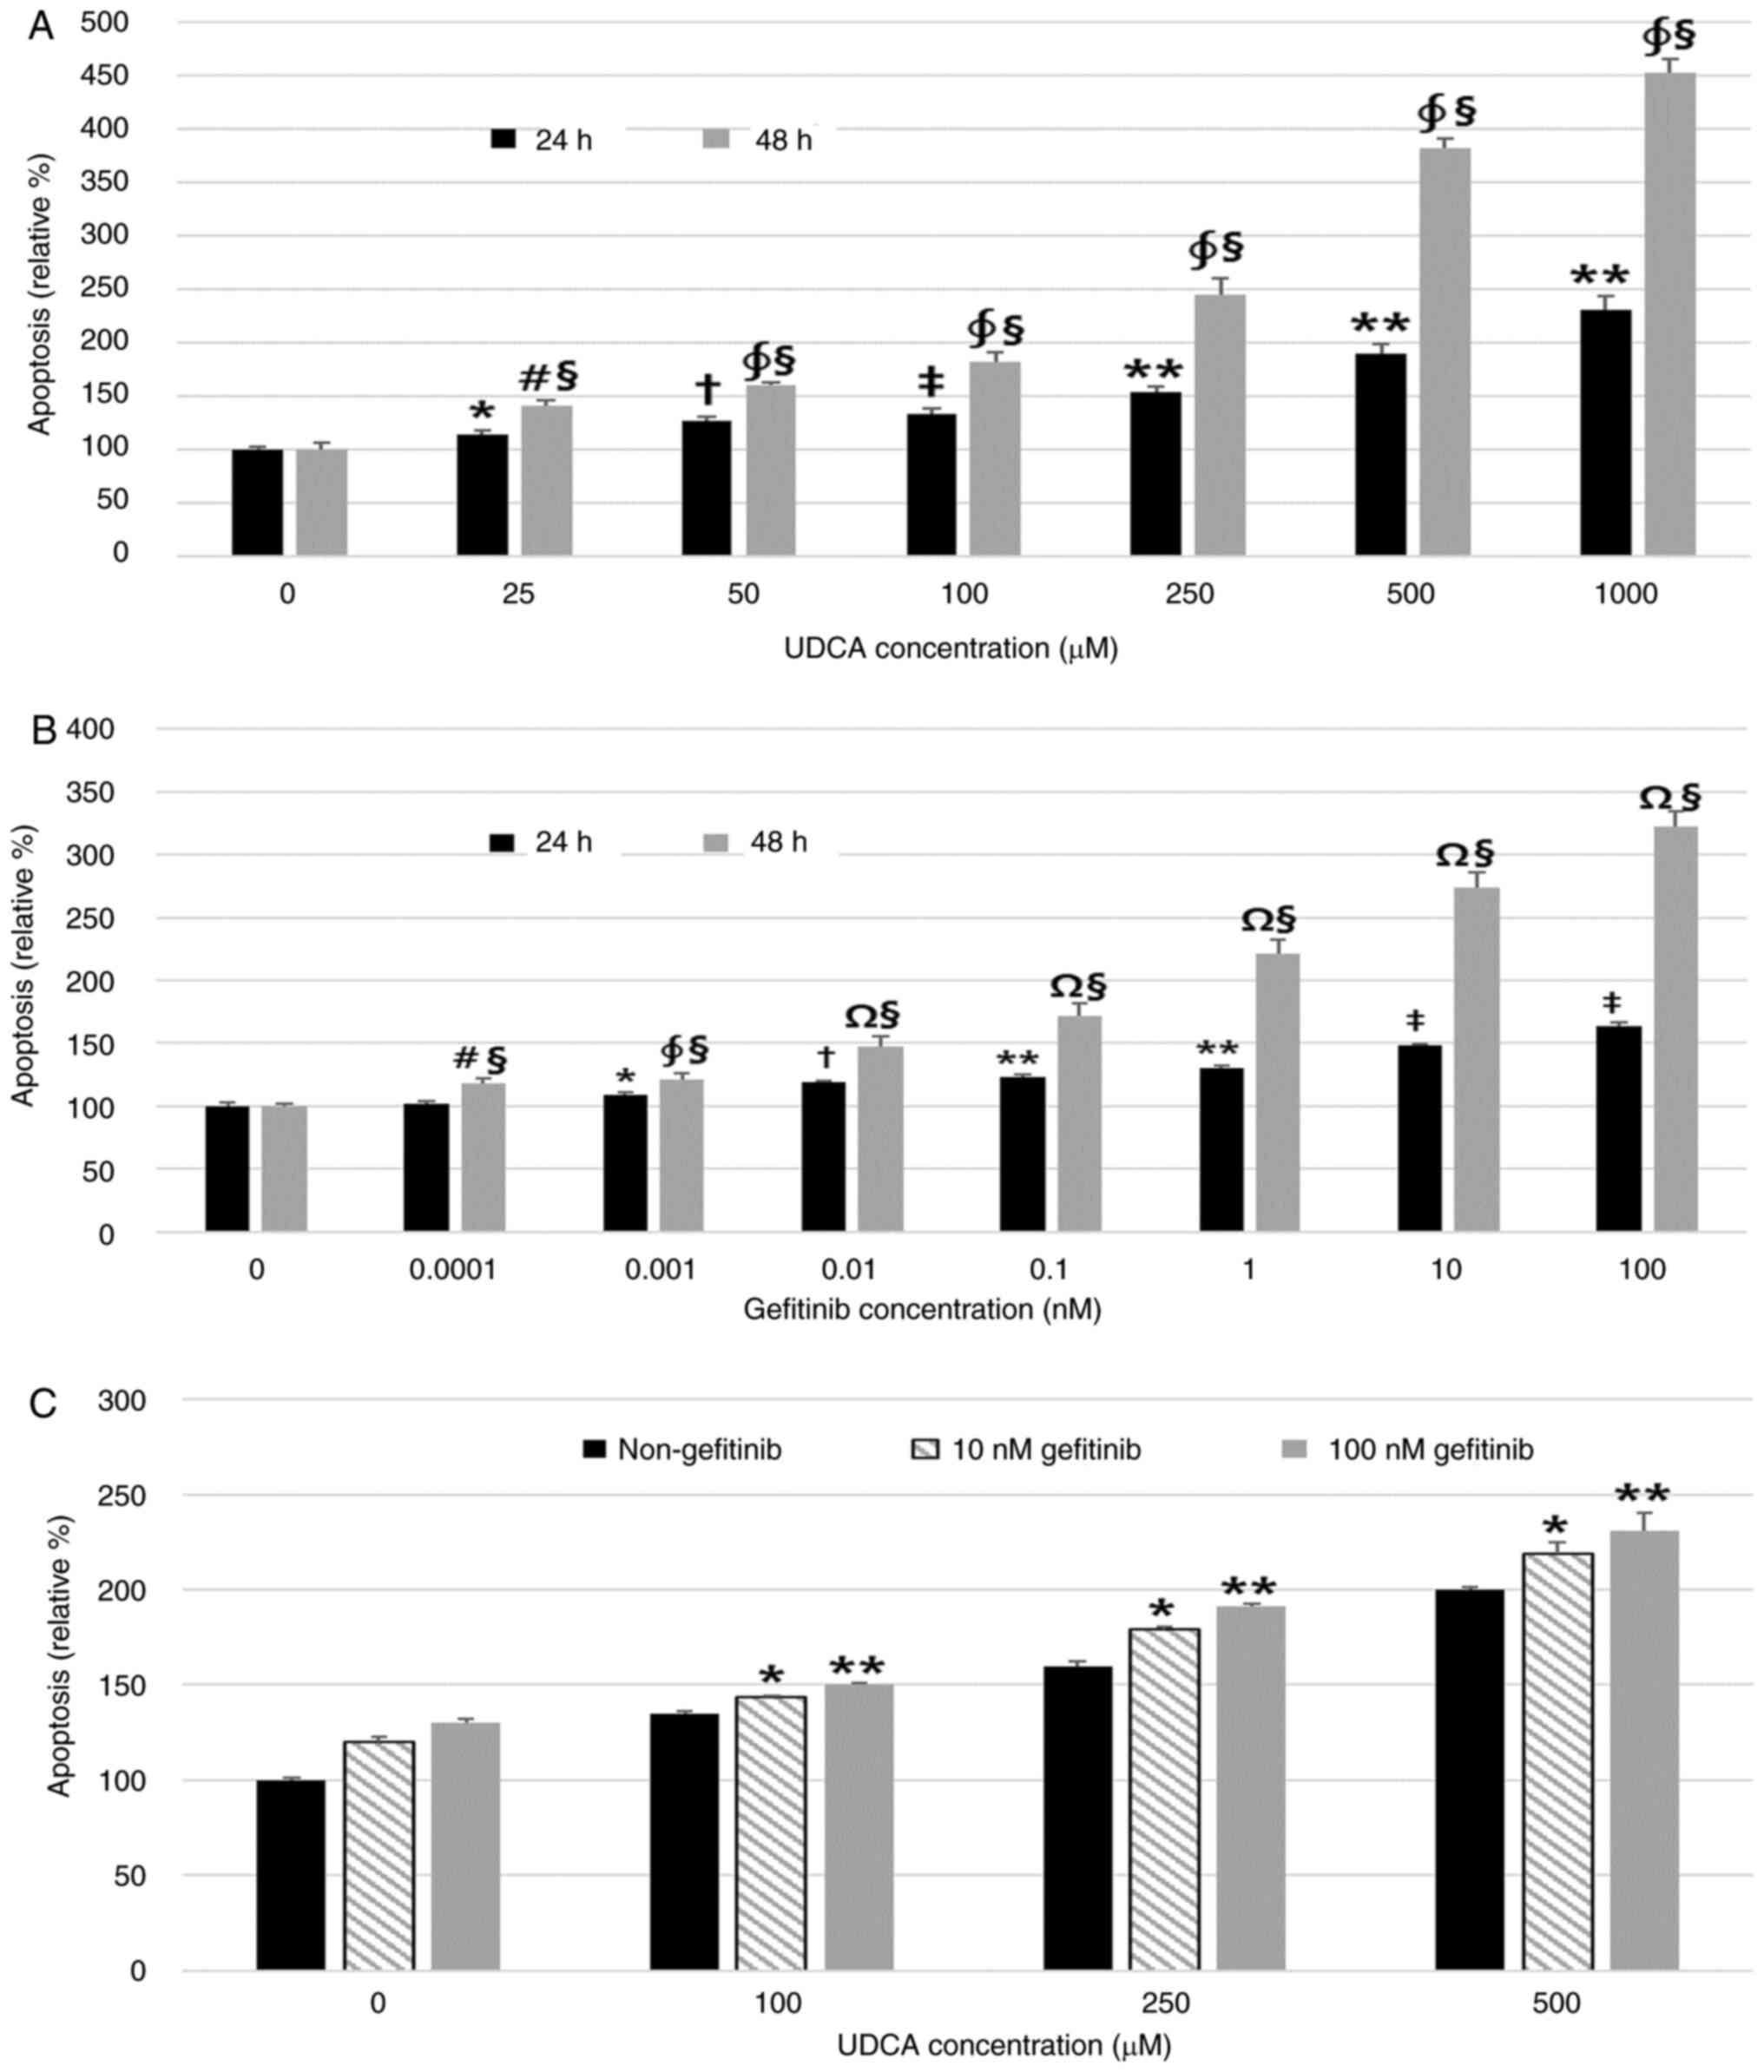 | Figure 2.UDCA induces apoptosis as effectively
as gefitinib in BDC cells. A Cell Death Detection ELISA assay was
used to measure the effect of UDCA and gefitinib on apoptosis. (A)
UDCA and (B) gefitinib dose- and time-dependently induced apoptosis
of BDC cells after incubation for 24 or 48 h. (C) Treatment with a
combination of UDCA and gefitinib for 48 h showed an additive
effect on apoptosis of SNU-245 cells. The results are presented as
the mean ± SD. (A) *P<0.01 vs. untreated control for 24 h,
†P<0.05 vs. cells treated with all lower
concentrations of UDCA and untreated control for 24 h,
‡P<0.001 vs. untreated control and 25 µM UDCA-treated
cells for 24 h, **P<0.001, cells treated with all lower
concentrations of UDCA and untreated control for 24 h,
#P<0.01 vs. untreated control for 48 h,
∮P<0.001 vs. cells treated with all lower
concentrations of UDCA and untreated control for 24 h,
§P<0.001 vs. cells treated with the same
concentration for 24 h. (B) *P<0.05 vs. untreated control for 24
h, †P<0.01 vs. untreated control and cells treated
with all lower concentrations of gefitinib for 24 h, **P<0.001
vs. untreated control and 0.001 nM gefitinib-treated cells for 24
h, ‡P<0.001 vs. untreated control and cells treated
with all lower concentrations of gefitinib for 24 h,
#P<0.05 vs. untreated control for 48 h,
§P<0.001 vs. cells treated with same concentrations
for 24 h, ∮P<0.001 vs. untreated control for 48 h,
ΩP<0.001 vs. untreated control and cells treated with
all lower concentrations of gefitinib for 48 h. (C) *P<0.001 vs.
cells treated with all lower concentrations of UDCA (co-treated
with 10 nM gefitinib), **P<0.001 vs. cells treated with all
lower concentrations of UDCA (co-treated with 100 nM gefitinib).
BDC, bile duct cancer; UDCA, ursodeoxycholic acid. |
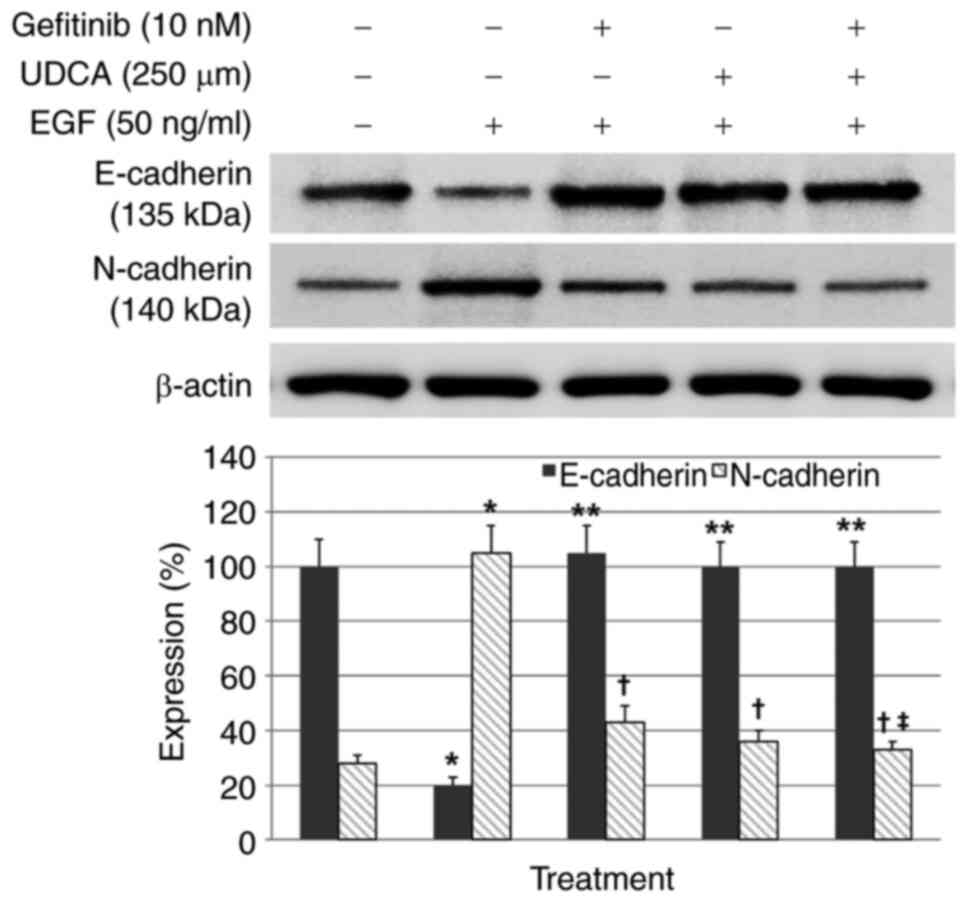
UDCA restored E-cadherin expression
inhibited by EGF and suppressed N-cadherin expression increased by
EGF in BDC cells
Western blot assays were conducted to evaluate
whether UDCA activates E-cadherin (primary epithelial marker) and
suppresses N-cadherin (primary mesenchymal marker) in BDC cells.
The BDC cells were loaded with the indicated concentrations of UDCA
and/or gefitinib and co-treatment with EGF in regular media
containing 1% FBS for 48 h. EGF-only treatment, as a control,
inhibited E-cadherin expression and increased N-cadherin expression
(Fig. S2) in a time and
dose-dependent manner, as was expected. Gefitinib or UDCA treatment
restored the E-cadherin expression inhibited by EGF (50 ng/ml) and
suppressed the N-cadherin expression enhanced by EGF in a
dose-dependent manner as well (Fig.
S3). Even though co-treatment with UDCA (250 µM) and gefitinib
(10 nM) did not show synergistic restoration of E-cadherin
expression decreased by EGF (50 ng/ml), co-treatment with UDCA (250
µM) and gefitinib (10 nM) synergistically suppressed N-cadherin
expression increased by EGF (50 ng/ml) (Fig. 3).
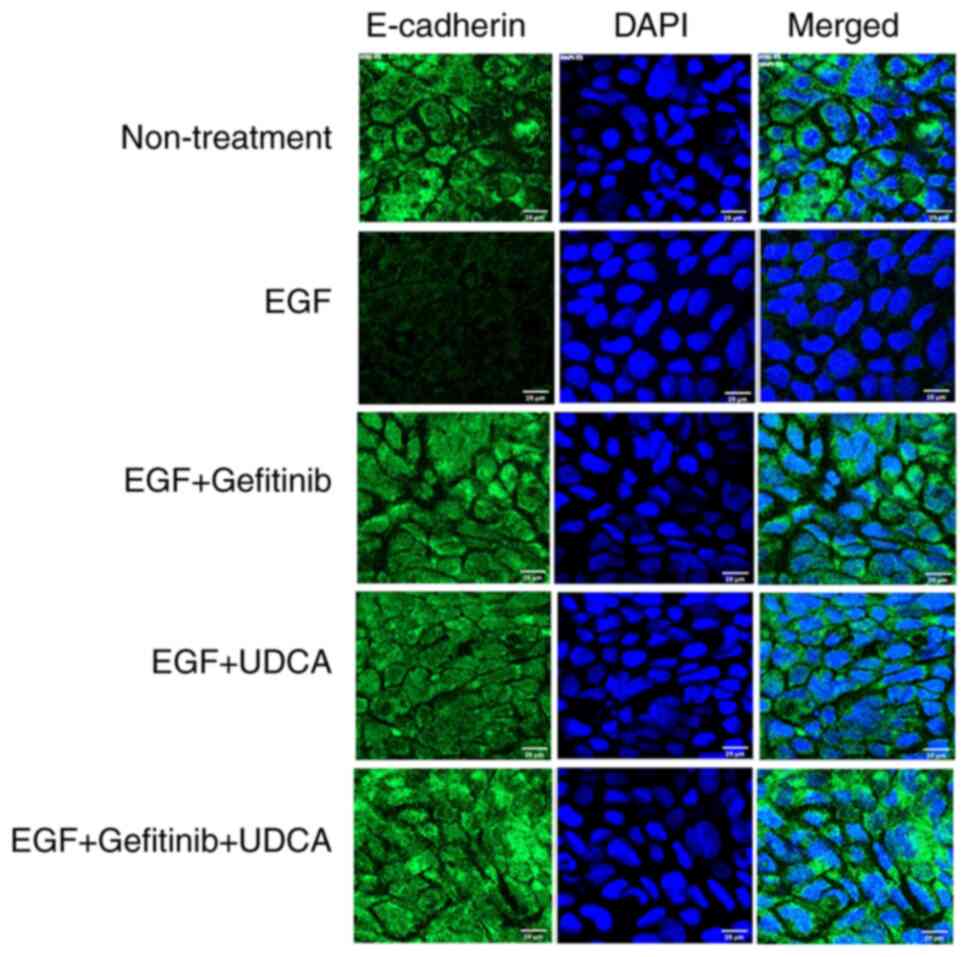
An immunofluorescence staining study was performed
to confirm that UDCA activates E-cadherin expression in BDC cells.
We treated SNU-245 cells with the determined concentrations of UDCA
and/or gefitinib with co-treatment of EGF in regular media
containing 1% FBS for 48 h. UDCA (250 µM) treatment restored
E-cadherin expression inhibited by EGF (50 ng/ml) (Fig. 4), which was similar to what was
observed for the western blot assay.
UDCA suppresses the expression of Slug
and ZEB1 mRNA induced by EGF in BDC cells
Here, we evaluated whether UDCA inhibits the mRNA
expression of Slug and ZEB1, main EMT-transcription factors, using
qPCR. Cells were loaded with the determined concentrations of UDCA
(250 µM) and/or gefitinib (10 nM) with or without co-treatment of
EGF (50 ng/ml) in regular media containing 1% FBS for 24 h. UDCA
treatment significantly inhibited Slug and ZEB1 mRNA expression
slightly less effectively than gefitinib (Fig. 5). Although co-treatment with UDCA
and gefitinib did not show synergistic suppression of Slug mRNA
expression increased by EGF (50 ng/ml), co-treatment with UDCA and
gefitinib synergistically decreased the ZEB1 mRNA expression
enhanced by EGF (Fig. 5).
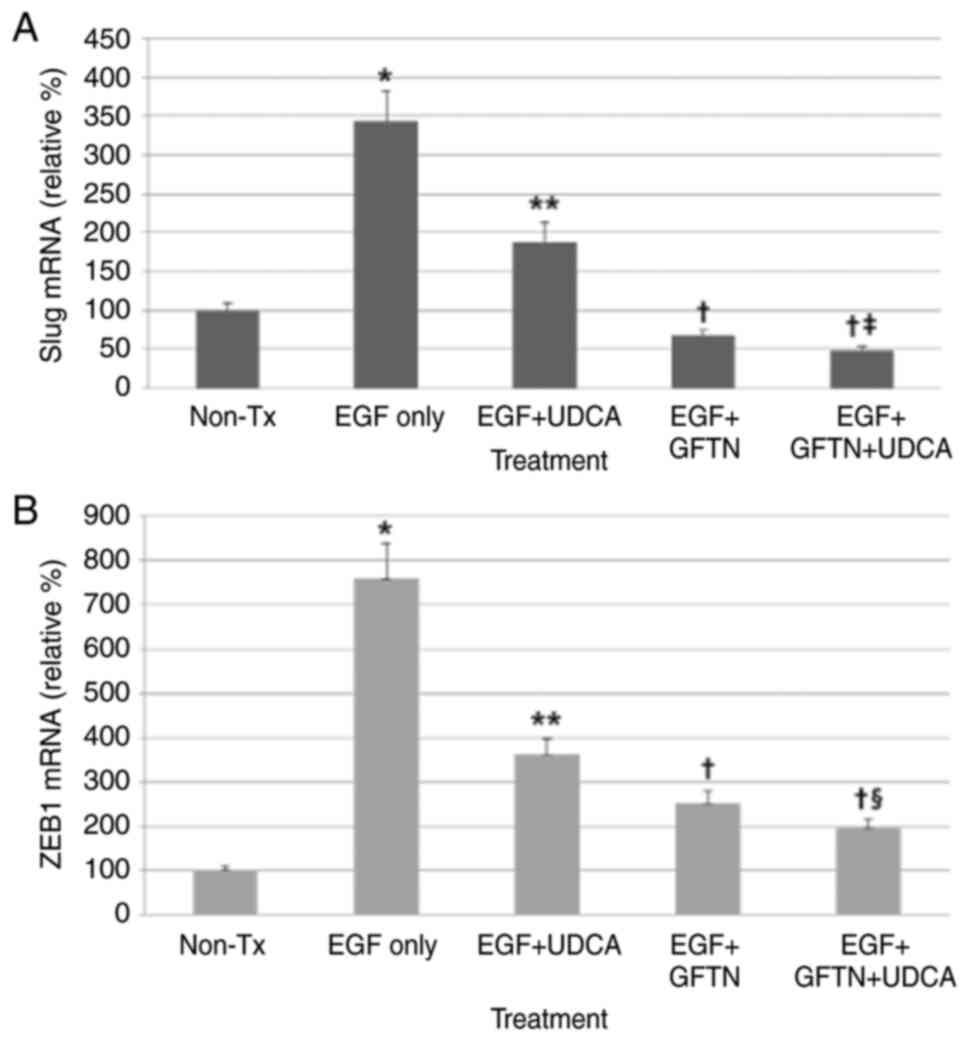 | Figure 5.UDCA suppresses Slug and ZEB1 mRNA
expression induced by EGF in bile duct cancer cells. Cells were
loaded with the determined concentrations of UDCA (250 µM) and/or
gefitinib (10 nM) with or without co-treatment of EGF in regular
media containing 1% FBS for 24 h. mRNA expression levels of Slug
and ZEB1 were measured via quantitative PCR. UDCA treatment
significantly inhibited (A) Slug and (B) ZEB1 mRNA expression but
was less effective than gefitinib. Although co-treatment with UDCA
and gefitinib did not show significant synergistic suppression of
Slug mRNA expression, the co-treatment did synergistically decrease
ZEB1 mRNA expression. *P<0.001 vs. untreated control,
**P<0.001 vs. EGF only-treated group, †P<0.001 vs.
EGF only-treated group and EGF + UDCA-treated group,
‡P<0.05 vs. EGF + GFTN-treated group,
§P<0.01 vs. EGF + GFTN-treated group. GFTN,
gefitinib; Slug, snail family transcriptional repressor 2; UDCA,
ursodeoxycholic acid; ZEB1, zinc finger E-box binding homeobox 1;
Tx, treatment; relative %, target mRNA expression/GAPDH expression
×100. |
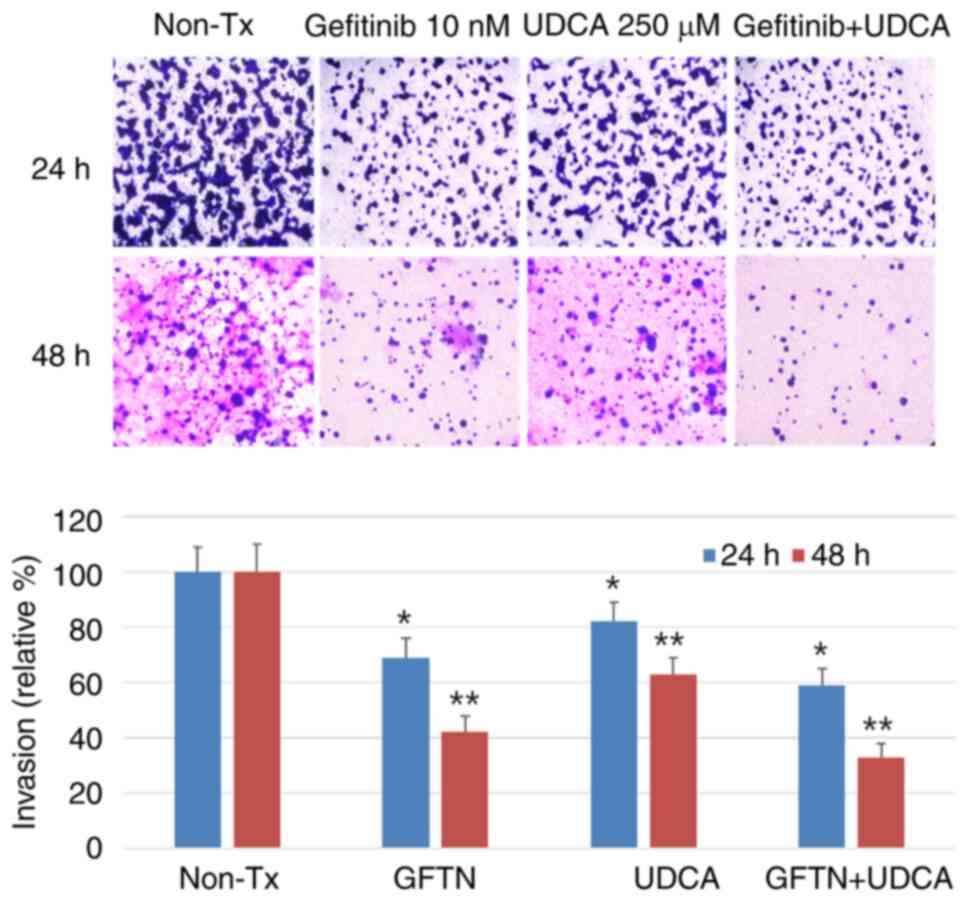
UDCA suppresses the invasiveness of
BDC cells
Invasion assays were conducted to estimate the
effect of UDCA on the aggressiveness on invasion and migration of
BDC cells. The cells were seeded on upper inserts of
Transwell® (Corning Incorporated) and treated with the
indicated concentration of gefitinib (10 nM) and/or UDCA (250 µM)
in SFM for 24 (not shown data) or 48 h. This experiment revealed
that the invasiveness of bile duct cancer cells was significantly
decreased after treatment with UDCA and was just as effective as
gefitinib. In addition, the combination of UDCA and gefitinib had
an additive or synergistic effect on the suppression of
invasiveness of BDC cells (Fig.
6).
Another western blot assay was conducted to evaluate
the expressional change of pFAK, known to be positively associated
with cancer metastasis and invasion (38), following treatment with gefitinib
and/or UDCA in SFM for 24 h with pre-treatment of IGF-1 (100 nM)
for 15 min. Both UDCA and gefitinib treatment inhibited the
expression of pFAK enhanced by IGF. In addition, the combination of
UDCA and gefitinib had an additive or synergistic effect on the
suppression of pFAK induced by IGF (Fig. S4).
Discussion
UDCA shows antineoplastic effects as a result of the
induction of apoptosis, which has been demonstrated in several
studies using cells and xenograft models of malignances (6,7).
Recently, we proved that UDCA suppresses the proliferation of BDC
cells via the induction of apoptosis and inhibition of the pathways
of the EGFR-ERK and the PI3K-AKT, while blocking the invasiveness
(34).
Epidermal growth factor receptors (EGFR, HER-1,
ErbB-1) belong to the tyrosine kinase receptor family. These growth
factors, such as the epidermal growth factor (EGFR), bind at their
extracellular binding domain, initiating intracellular signaling
involved in stimulating cell proliferation, differentiation, and
survival (39). Increased
signaling from EGFR linked to its overexpression and mutation is
associated with various cancers, including breast, colorectal,
lung, head, neck, pancreatic, and BDCs (31,40,41).
Enhanced expression of EGFR is known to contribute to poor
prognosis in these cancers (28,42–45).
EGFR expression in total cholangiocarcinoma ranged from 10.7 to 86%
(31,46–48).
Among them, EGFR in intrahepatic cholangiocarcinoma is positive in
43.3±30.6% (mean ± SD) (46), and
extrahepatic BDC in Korea, where the prevalence rate is high,
showed 86% positivity for EGFR (48). The prognosis in gallbladder cancer
is also influenced by enhanced EGFR expression (49,50).
Therefore, EGFR can be a therapeutic target for
human cancer. ATP-competitive tyrosine kinase inhibitors, such as
erlotinib or gefitinib, have increased the therapeutic efficacy for
colorectal non-small cell lung, and pancreatic cancer treatments
(51–53). In addition, studies have
demonstrated that the inhibition of EGFR signaling by gefitinib
effectively suppressed the proliferation of cholangiocarcinoma
cells (29). The SNU-245 cells
used in this study are extrahepatic bile duct cancer cells that
exhibit EGFR expression (34). The
aim of this study was to evaluate how effectively UDCA inhibits
tumor cell proliferation compared to gefitinib (an EGFR inhibitor)
and determine whether UDCA works synergistically with gefitinib
compared to the monotherapy groups. Our results revealed that
UDCA-induced apoptosis and inhibited cell proliferation as
effectively as gefitinib and the combination of UDCA and gefitinib
had an additive effect on apoptosis. Therefore, UDCA can be
suggested as an antineoplastic agent with or without combination
with known chemotherapeutics in BDC.
EGFR activation is known to destabilize the
E-cadherin/β-catenin complex in several tumors, thereby interfering
with cell-cell adhesion, promoting EMT, and acquiring a motile
phenotype (25–27,54),
through the induction of adherens junction rupture. Once
mesenchymal traits are acquired, EMT-transcriptional factors, such
as ZEB1/2, Slug, Twis and Snail, modulate the expression of
E-cadherin (14). Weakening of
epithelial markers (E-cadherin) and obtainment of mesenchymal
markers (N-cadherin, S100A4, and Slug) were associated with
aggressive characteristics of BDC including metastasis, vascular
and neural invasion, advanced tumor stage, and poor differentiation
(20–24). In addition, Clapéron et al
(33) proved an association
between EGFR and EMT in cholangiocarcinoma by demonstrating that
EGFR is a major factor in cancer progression by triggering EMT. As
UDCA effectively inhibits EGFR in bile duct cancer cells, it has
the potential to also inhibit EMT (34). In addition, if UDCA can properly
inhibit the EGFR axis and EMT, there is a possibility that it may
contribute to the inhibition of BDC progression by suppressing
aggressiveness. In this study, UDCA restored E-cadherin expression
inhibited by EGF and suppressed N-cadherin expression increased by
EGF as effectively as gefitinib. UDCA also suppressed the
expression of Slug and ZEB1 mRNA induced by EGF in
BDC cells. These data implicate that UDCA suppresses EMT as
effectively as gefitinib, through EGF-EGFR axis inhibition.
We demonstrated that UDCA inhibits EMT and EGFR,
which are directly linked to invasiveness and metastasis in BDC
cells. Additionally, we performed invasion assays and western blot
assays to evaluate the expressional change of phosphorylated FAK
for the purpose of verifying the suppression of BDC cell
invasiveness by UDCA. The invasion assays showed that UDCA
suppresses invasiveness, and the combination of UDCA and gefitinib
has a synergistic or additive effect on the suppression of BDC
cells invasiveness. In addition, FAK is a significant regulator of
signals mediated by the growth factor receptor and integrin and
modulates basic processes in cancers. Enhanced FAK expression has
been noted in various metastatic cancers and is associated with a
grave prognosis. Therefore, FAK is regarded as a potential
determinant of aggressiveness and metastasis (38,55).
In this study, both UDCA and gefitinib treatment inhibited
expression of pFAK enhanced by IGF. In addition, the combination of
UDCA and gefitinib had a synergistic or additive effect on the
inhibition of FAK induced by IGF. Accordingly, we suggest that
UDCA-induced EMT suppression can be a significant determinant in
regulating the invasiveness of BDC cells.
As this study was a cellular-level in vitro
study, there is a limitation in proving the actual anticancer
effect of UDCA in animal and human BDC. Accordingly, we intend to
conduct a study to investigate the effect of UDCA, with or without
combination with other existing chemotherapeutics on EGFR/EMT, and
antineoplastic effects using a xenograft animal model for BDC. In
addition, we hope that various future practical studies will reveal
the synergistic or additive effect of UDCA with known
chemotherapeutics for BDC. On the other hand, SNU-245 cells, a
human common BDC cell line presenting well-differentiation, was
chosen for testing in this study although there are more types of
BDC cell lines. which can be another limitation of our study. We
wanted to evaluate wild BDC cells that express E-cadherin and do
not have mutations of p53, p15, p16, hMLH1, and K-Ras to avoid lots
of elements originated from mutations. In the future study, we hope
we examine other BDC cell lines.
In addition, 250 µM UDCA treatment in the media
corresponds to the dose of 98.14 mg/Kg of bodyweight. Usual dose of
UDCA in the patient with primary biliary cirrhosis is up to 15~20
mg/Kg, which means that 250 µM UDCA dose in our experiments was
approximately 4.9-6.5 times higher than general therapeutic dose.
Considering that we had to demonstrate definite change in
experiments for short-term period (24 or 48 h) and prove
anti-neoplastic effects, and that 25 or 50 µM UDCA (0.49~0.98 times
of usual dose) was also effective on suppression of BDC cell
proliferation, the concentrations we loaded may be acceptable.
In conclusion, this study demonstrated that UDCA
enhanced E-cadherin expression and suppressed N-cadherin
expression, contributing to the inhibition of EMT and invasiveness
in BDC cells, through inhibition of EGF-EGFR axis. Accordingly,
UDCA may be applied as an adjuvant or palliative chemotherapeutic
agent and as a therapeutic combination option that enforces the
effect of other antitumor agents in BDC.
Supplementary Material
Supporting Data
Acknowledgements
Not applicable.
Funding
This study was supported by Hallym University
Academic-Industrial Cooperation Program (H20190029, 2019).
Availability of data and materials
The datasets used and/or analyzed during the current
study are available from the corresponding author on reasonable
request.
Authors' contributions
JL performed the study design, data analysis,
statistical analysis, data interpretation and manuscript drafting.
EMH performed the main experiments. JHaK, JHeK and JHJ performed
the data interpretation and critical revision. SWP and DHK
contributed to the study design and statistical analysis. JL and
EMH confirm the authenticity of all the raw data. All authors have
read and approved the final manuscript.
Ethics approval and consent to
participate
Not applicable because this study was performed
using cells purchased from the Korean Cell Line Bank (KCLB).
Patient consent for publication
Not applicable.
Competing interests
The authors declare that they have no competing
interests.
References
|
1
|
Song GW, Lee SG, Lee YJ, Park KM, Hwang S,
Kim KH, Ahn CS, Moon DB, Ha TY and Jung DH: Analysis of survival
and factors affecting the survival after surgical resection of
peripheral cholangiocarcinoma: 318 Cases in single institute.
Korean J Hepatol. 13:208–221. 2007.(In Korean). PubMed/NCBI
|
|
2
|
Blechacz B: Cholangiocarcinoma: Current
knowledge and new developments. Gut Liver. 11:13–26. 2017.
View Article : Google Scholar : PubMed/NCBI
|
|
3
|
Amaral JD, Viana RJ, Ramalho RM, Steer CJ
and Rodrigues CM: Bile acids: Regulation of apoptosis by
ursodeoxycholic acid. J Lipid Res. 50:1721–1734. 2009. View Article : Google Scholar : PubMed/NCBI
|
|
4
|
Guicciardi ME and Gores GJ:
Ursodeoxycholic acid cytoprotection: Dancing with death receptors
and survival pathways. Hepatology. 35:971–973. 2002. View Article : Google Scholar : PubMed/NCBI
|
|
5
|
Amaral JD, Castro RE, Solá S, Steer CJ and
Rodrigues CM: p53 is a key molecular target of ursodeoxycholic acid
in regulating apoptosis. J Biol Chem. 282:34250–34259. 2007.
View Article : Google Scholar : PubMed/NCBI
|
|
6
|
Liu H, Qin CY, Han GQ, Xu HW, Meng M and
Yang Z: Mechanism of apoptotic effects induced selectively by
ursodeoxycholic acid on human hepatoma cell lines. World J
Gastroenterol. 13:1652–1658. 2007. View Article : Google Scholar : PubMed/NCBI
|
|
7
|
Liu H, Xu HW, Zhang YZ, Huang Y, Han GQ,
Liang TJ, Wei LL, Qin CY and Qin CK: Ursodeoxycholic acid induces
apoptosis in hepatocellular carcinoma xenografts in mice. World J
Gastroenterol. 21:10367–10374. 2015. View Article : Google Scholar : PubMed/NCBI
|
|
8
|
Serfaty L, Bissonnette M and Poupon R:
Ursodeoxycholic acid and chemoprevention of colorectal cancer.
Gastroenterol Clin Biol. 34:516–522. 2010. View Article : Google Scholar : PubMed/NCBI
|
|
9
|
Khare S, Mustafi R, Cerda S, Yuan W,
Jagadeeswaran S, Dougherty U, Tretiakova M, Samarel A, Cohen G,
Wang J, et al: Ursodeoxycholic acid suppresses Cox-2 expression in
colon cancer: Roles of Ras, p38, and CCAAT/enhancer-binding
protein. Nutr Cancer. 60:389–400. 2008. View Article : Google Scholar : PubMed/NCBI
|
|
10
|
Pang L, Zhao X, Liu W, Deng J, Tan X and
Qiu L: Anticancer effect of ursodeoxycholic acid in human oral
squamous carcinoma HSC-3 cells through the caspases. Nutrients.
7:3200–3218. 2015. View Article : Google Scholar : PubMed/NCBI
|
|
11
|
Olsson R, Boberg KM, de Muckadell OS,
Lindgren S, Hultcrantz R, Folvik G, Bell H, Gangsøy-Kristiansen M,
Matre J, Rydning A, et al: High-dose ursodeoxycholic acid in
primary sclerosing cholangitis: A 5-year multicenter, randomized,
controlled study. Gastroenterology. 129:1464–1472. 2005. View Article : Google Scholar : PubMed/NCBI
|
|
12
|
Rudolph G, Kloeters-Plachky P, Rost D and
Stiehl A: The incidence of cholangiocarcinoma in primary sclerosing
cholangitis after long-time treatment with ursodeoxycholic acid.
Eur J Gastroenterol Hepatol. 19:487–491. 2007. View Article : Google Scholar : PubMed/NCBI
|
|
13
|
Nieto MA and Cano A: The
epithelial-mesenchymal transition under control: Global programs to
regulate epithelial plasticity. Semin Cancer Biol. 22:361–368.
2012. View Article : Google Scholar : PubMed/NCBI
|
|
14
|
Guarino M, Rubino B and Ballabio G: The
role of epithelial-mesenchymal transition in cancer pathology.
Pathology. 39:305–318. 2007. View Article : Google Scholar : PubMed/NCBI
|
|
15
|
Thiery JP, Acloque H, Huang RY and Nieto
MA: Epithelial-mesenchymal transitions in development and disease.
Cell. 139:871–890. 2009. View Article : Google Scholar : PubMed/NCBI
|
|
16
|
Lamouille S, Subramanyam D, Blelloch R and
Derynck R: Regulation of epithelial-mesenchymal and
mesenchymal-epithelial transitions by microRNAs. Curr Opin Cell
Biol. 25:200–207. 2013. View Article : Google Scholar : PubMed/NCBI
|
|
17
|
Puisieux A, Brabletz T and Caramel J:
Oncogenic roles of EMT-inducing transcription factors. Nat Cell
Biol. 16:488–494. 2014. View
Article : Google Scholar : PubMed/NCBI
|
|
18
|
Firrincieli D, Boissan M and Chignard N:
Epithelial-mesenchymal transition in the liver. Gastroenterol Clin
Biol. 34:523–528. 2010. View Article : Google Scholar : PubMed/NCBI
|
|
19
|
De Craene B and Berx G: Regulatory
networks defining EMT during cancer initiation and progression. Nat
Rev Cancer. 13:97–110. 2013. View
Article : Google Scholar : PubMed/NCBI
|
|
20
|
Ryu HS, Chung JH, Lee K, Shin E, Jing J,
Choe G, Kim H, Xu X, Lee HE, Kim DG, et al: Overexpression of
epithelial-mesenchymal transition-related markers according to cell
dedifferentiation: Clinical implications as an independent
predictor of poor prognosis in cholangiocarcinoma. Hum Pathol.
43:2360–2370. 2012. View Article : Google Scholar : PubMed/NCBI
|
|
21
|
Fabris L, Cadamuro M, Moserle L, Dziura J,
Cong X, Sambado L, Nardo G, Sonzogni A, Colledan M, Furlanetto A,
et al: Nuclear expression of S100A4 calcium-binding protein
increases cholangiocarcinoma invasiveness and metastasization.
Hepatology. 54:890–899. 2011. View Article : Google Scholar : PubMed/NCBI
|
|
22
|
Yao X, Wang X, Wang Z, Dai L, Zhang G, Yan
Q and Zhou W: Clinicopathological and prognostic significance of
epithelial mesenchymal transition-related protein expression in
intrahepatic cholangiocarcinoma. Onco Targets Ther. 5:255–261.
2012. View Article : Google Scholar : PubMed/NCBI
|
|
23
|
Korita PV, Wakai T, Ajioka Y, Inoue M,
Takamura M, Shirai Y and Hatakeyama K: Aberrant expression of
vimentin correlates with dedifferentiation and poor prognosis in
patients with intrahepatic cholangiocarcinoma. Anticancer Res.
30:2279–2285. 2010.PubMed/NCBI
|
|
24
|
Zhang KJ, Zhang BY, Zhang KP, Tang LM, Liu
SS, Zhu DM and Zhang DL: Clinicopathologic significance of slug
expression in human intrahepatic cholangiocarcinoma. World J
Gastroenterol. 16:2554–2557. 2010. View Article : Google Scholar : PubMed/NCBI
|
|
25
|
Dos Santos A, Court M, Thiers V, Sar S,
Guettier C, Samuel D, Bréchot C, Garin J, Demaugre F and Masselon
CD: Identification of cellular targets in human intrahepatic
cholangiocarcinoma using laser microdissection and accurate mass
and time tag proteomics. Mol Cell Proteomics. 9:1991–2004. 2010.
View Article : Google Scholar : PubMed/NCBI
|
|
26
|
Sebastian S, Settleman J, Reshkin SJ,
Azzariti A, Bellizzi A and Paradiso A: The complexity of targeting
EGFR signalling in cancer: From expression to turnover. Biochim
Biophys Acta. 1766:120–139. 2006.PubMed/NCBI
|
|
27
|
Barr S, Thomson S, Buck E, Russo S, Petti
F, Sujka-Kwok I, Eyzaguirre A, Rosenfeld-Franklin M, Gibson NW,
Miglarese M, et al: Bypassing cellular EGF receptor dependence
through epithelial-to-mesenchymal-like transitions. Clin Exp
Metastasis. 25:685–693. 2008. View Article : Google Scholar : PubMed/NCBI
|
|
28
|
Yoshikawa D, Ojima H, Iwasaki M, Hiraoka
N, Kosuge T, Kasai S, Hirohashi S and Shibata T:
Clinicopathological and prognostic significance of EGFR, VEGF, and
HER2 expression in cholangiocarcinoma. Br J Cancer. 98:418–425.
2008. View Article : Google Scholar : PubMed/NCBI
|
|
29
|
Yoon JH, Gwak GY, Lee HS, Bronk SF,
Werneburg NW and Gores GJ: Enhanced epidermal growth factor
receptor activation in human cholangiocarcinoma cells. J Hepatol.
41:808–814. 2004. View Article : Google Scholar : PubMed/NCBI
|
|
30
|
Clapéron A, Guedj N, Mergey M, Vignjevic
D, Desbois-Mouthon C, Boissan M, Saubaméa B, Paradis V, Housset C
and Fouassier L: Loss of EBP50 stimulates EGFR activity to induce
EMT phenotypic features in biliary cancer cells. Oncogene.
31:1376–1388. 2012. View Article : Google Scholar : PubMed/NCBI
|
|
31
|
Ito Y, Takeda T, Sasaki Y, Sakon M, Yamada
T, Ishiguro S, Imaoka S, Tsujimoto M, Higashiyama S, Monden M and
Matsuura N: Expression and clinical significance of the erbB family
in intrahepatic cholangiocellular carcinoma. Pathol Res Pract.
197:95–100. 2001. View Article : Google Scholar : PubMed/NCBI
|
|
32
|
Harder J, Waiz O, Otto F, Geissler M,
Olschewski M, Weinhold B, Blum HE, Schmitt-Graeff A and Opitz OG:
EGFR and HER2 expression in advanced biliary tract cancer. World J
Gastroenterol. 15:4511–4517. 2009. View Article : Google Scholar : PubMed/NCBI
|
|
33
|
Clapéron A, Mergey M, Nguyen Ho-Bouldoires
TH, Vignjevic D, Wendum D, Chrétien Y, Merabtene F, Frazao A,
Paradis V, Housset C, et al: EGF/EGFR axis contributes to the
progression of cholangiocarcinoma through the induction of an
epithelial-mesenchymal transition. J Hepatol. 61:325–332. 2014.
View Article : Google Scholar : PubMed/NCBI
|
|
34
|
Lee J, Hong EM, Kim JH, Kim JH, Jung JH,
Park SW, Koh DH and Jang HJ: Ursodeoxycholic acid shows
antineoplastic effects in bile duct cancer cells via apoptosis
induction; p53 activation; and EGFR-ERK, COX-2, and PI3K-AKT
pathway inhibition. Mol Biol Rep. 48:6231–6240. 2021. View Article : Google Scholar : PubMed/NCBI
|
|
35
|
Ku JL, Yoon KA, Kim IJ, Kim WH, Jang JY,
Suh KS, Kim SW, Park YH, Hwang JH, Yoon YB and Park JG:
Establishment and characterisation of six human biliary tract
cancer cell lines. Br J Cancer. 87:187–193. 2002. View Article : Google Scholar : PubMed/NCBI
|
|
36
|
Lee J, Hong EM, Kim JH, Jung JH, Park SW,
Koh DH, Choi MH, Jang HJ and Kae SH: Metformin induces apoptosis
and inhibits proliferation through the AMP-activated protein kinase
and insulin-like growth factor 1 receptor pathways in the bile duct
cancer cells. J Cancer. 10:1734–1744. 2019. View Article : Google Scholar : PubMed/NCBI
|
|
37
|
Livak KJ and Schmittgen TD: Analysis of
relative gene expression data using real-time quantitative PCR and
the 2(−Delta Delta C(T)) method. Methods. 25:402–408. 2001.
View Article : Google Scholar : PubMed/NCBI
|
|
38
|
Lee BY, Timpson P, Horvath LG and Daly RJ:
FAK signaling in human cancer as a target for therapeutics.
Pharmacol Ther. 146:132–149. 2015. View Article : Google Scholar : PubMed/NCBI
|
|
39
|
Citri A and Yarden Y: EGF-ERBB signalling:
Towards the systems level. Nat Rev Mol Cell Biol. 7:505–516. 2006.
View Article : Google Scholar : PubMed/NCBI
|
|
40
|
Hubbard SR: EGF receptor activation: Push
comes to shove. Cell. 125:1029–1031. 2006. View Article : Google Scholar : PubMed/NCBI
|
|
41
|
Yarden Y and Sliwkowski MX: Untangling the
ErbB signalling network. Nat Rev Mol Cell Biol. 2:127–137. 2001.
View Article : Google Scholar : PubMed/NCBI
|
|
42
|
Quon H, Liu FF and Cummings BJ: Potential
molecular prognostic markers in head and neck squamous cell
carcinomas. Head Neck. 23:147–159. 2001. View Article : Google Scholar : PubMed/NCBI
|
|
43
|
Pawlowski V, Révillion F, Hebbar M, Hornez
L and Peyrat JP: Prognostic value of the type I growth factor
receptors in a large series of human primary breast cancers
quantified with a real-time reverse transcription-polymerase chain
reaction assay. Clin Cancer Res. 6:4217–4225. 2000.PubMed/NCBI
|
|
44
|
Mayer A, Takimoto M, Fritz E, Schellander
G, Kofler K and Ludwig H: The prognostic significance of
proliferating cell nuclear antigen, epidermal growth factor
receptor, and mdr gene expression in colorectal cancer. Cancer.
71:2454–2460. 1993. View Article : Google Scholar : PubMed/NCBI
|
|
45
|
Yamanaka Y, Friess H, Kobrin MS, Buchler
M, Beger HG and Korc M: Coexpression of epidermal growth factor
receptor and ligands in human pancreatic cancer is associated with
enhanced tumor aggressiveness. Anticancer Res. 13:565–569.
1993.PubMed/NCBI
|
|
46
|
Nakazawa K, Dobashi Y, Suzuki S, Fujii H,
Takeda Y and Ooi A: Amplification and overexpression of c-erbB-2,
epidermal growth factor receptor, and c-met in biliary tract
cancers. J Pathol. 206:356–365. 2005. View Article : Google Scholar : PubMed/NCBI
|
|
47
|
Altimari A, Fiorentino M, Gabusi E,
Gruppioni E, Corti B, D'Errico A and Grigioni WF: Investigation of
ErbB1 and ErbB2 expression for therapeutic targeting in primary
liver tumours. Dig Liver Dis. 35:332–338. 2003. View Article : Google Scholar : PubMed/NCBI
|
|
48
|
Lee CS and Pirdas A: Epidermal growth
factor receptor immunoreactivity in gallbladder and extrahepatic
biliary tract tumours. Pathol Res Pract. 191:1087–1091. 1995.
View Article : Google Scholar : PubMed/NCBI
|
|
49
|
Pais-Costa SR, Farah JF, Artigiani-Neto R,
Martins SJ and Goldenberg A: Evaluation of P53, E-cadherin, Cox-2,
and EGFR protein immunoexpression on prognostic of resected
gallbladder carcinoma. Arq Bras Cir Dig. 27:126–132. 2014.(In
English, Portuguese). View Article : Google Scholar : PubMed/NCBI
|
|
50
|
Gwak GY, Yoon JH, Shin CM, Ahn YJ, Chung
JK, Kim YA, Kim TY and Lee HS: Detection of response-predicting
mutations in the kinase domain of the epidermal growth factor
receptor gene in cholangiocarcinomas. J Cancer Res Clin Oncol.
131:649–652. 2005. View Article : Google Scholar : PubMed/NCBI
|
|
51
|
Baselga J and Arteaga CL: Critical update
and emerging trends in epidermal growth factor receptor targeting
in cancer. J Clin Oncol. 23:2445–2459. 2005. View Article : Google Scholar : PubMed/NCBI
|
|
52
|
Rocha-Lima CM, Soares HP, Raez LE and
Singal R: EGFR targeting of solid tumors. Cancer Control.
14:295–304. 2007. View Article : Google Scholar : PubMed/NCBI
|
|
53
|
Xiong HQ, Rosenberg A, LoBuglio A, Schmidt
W, Wolff RA, Deutsch J, Needle M and Abbruzzese JL: Cetuximab, a
monoclonal antibody targeting the epidermal growth factor receptor,
in combination with gemcitabine for advanced pancreatic cancer: A
multicenter phase II Trial. J Clin Oncol. 22:2610–2616. 2004.
View Article : Google Scholar : PubMed/NCBI
|
|
54
|
Henson ES and Gibson SB: Surviving cell
death through epidermal growth factor (EGF) signal transduction
pathways: Implications for cancer therapy. Cell Signal.
18:2089–2097. 2006. View Article : Google Scholar : PubMed/NCBI
|
|
55
|
Zhou J, Yi Q and Tang L: The roles of
nuclear focal adhesion kinase (FAK) on cancer: A focused review. J
Exp Clin Cancer Res. 38:2502019. View Article : Google Scholar : PubMed/NCBI
|