Introduction
Pancreatic cancer (PC) is one of the most fatal
digestive system malignancies; it exhibits the highest mortality
rate and a yearly increase in occurrence throughout the world
(1–3). PC has a clinical characteristic of
‘three highs and three lows’, namely high morbidity, mortality and
recurrence rates, and low early diagnosis, resection and 5-year
survival rates (2,3). In China, it is estimated that were
134,374 new cases of PC and 131,203 deaths attributed to this
disease in 2022 (1). In the United
States, the estimated number of new cases and deaths due to PC in
2022 were 62,210 and 48,830, respectively (2). Despite advances in therapeutic
strategies, the prognosis of PC remains poor, with an overall
5-year survival rate of 11%, which is the lowest amongst all
malignant tumors (2). Diagnosis and
treatment of PC remain a challenge; thus, it is of great importance
to elucidate the underlying molecular mechanisms of PC development
and progression to highlight potential novel targets and
treatments.
The tumor microenvironment (TME) is the environment
where cancer cells exist and absorb nutrients or interact with
other components. The TME encompasses the surrounding immune cells,
lymphocytes, bone marrow-derived inflammatory cells, blood vessels,
extracellular matrix, fibroblasts and other signaling molecules
(4,5). The TME is commonly considered to be a
complex ecosystem with immunosuppressive and tumor-promoting
functions (4–6). The TME of PC consists of a large
number of dense stromal components that can create a favorable
microenvironment for PC cell growth and proliferation, including
activated pancreatic stellate cells, tumor-associated fibroblasts
and other extracellular stroma components (4,6). The
presence of multiple types of immune cells in the TME of PC that is
both quantitatively and functionally imbalanced is usually
characterized by a decrease in the number of cells with antitumor
effects and a non-functional or immature phenotype and state, such
as cluster of differentiation (CD)4+ T cells,
CD8+ T cells and natural killer (NK) cells, while cells
with immunosuppressive effects are functionally active and present
in large numbers, such as regulatory T cells (Tregs),
myeloid-derived suppressor cells (MDSCs) and tumor-associated
macrophages (TAMs) (4,6). For example, hsa_circ_0046523 can
decrease the ratio of CD4+ and CD8+ T cells,
and increase the ratio of Tregs by sponging the miR-148a-3p/PD-L1
axis, while accelerating the apoptosis and failure of
CD8+ T cells (7). Kaneda
et al (8) demonstrated that
activation of PI3Kγ signaling promotes immunosuppression and tumor
growth, while inactivation restores CD8+ T cell
activation and cytotoxicity. The research from Kabashima et
al (9) concluded that patients
with PC co-expressing cGAS and STING showed favorable survival
outcomes, with several cytotoxic CD8+ T cell infiltrates
around the cancer cells, but not in patients with defective
cGAS-STING signaling. Lefler et al (10) found that the STAT3 signaling axis
was disrupted via genetic ablation of STAT3, resulting in a
decreased number of M2 macrophages and an increased number of
CD8+ T cells, as well as a slowing tumor progression.
The PC cells themselves can also promote the activation of
surrounding stromal cells and the accumulation of immunosuppressive
cells at the tumor site by secreting various cytokines, such as
IL-10, TGF-β, chemokines, CXCLl-3 and CXCL5 (5). These multiple factors lead to an
imbalance in the number and function of immune effector cells
together, forming a unique immunosuppressive microenvironment in
PC. A number of emerging studies have revealed that the
heterogeneity and complexity of the TME are responsible not only
for the growth, invasion and metastasis of PC, but also for its
recurrence and resistance to chemotherapy and immunotherapy.
Tumor-infiltrating lymphocytes (TILs) are considered
to be one of the major components present in the TME, which
primarily includes immune cells, such as T lymphocytes, B
lymphocytes and NK cells. As these TILs with different phenotypes
exhibit an imbalance in their quantity and function, the
interaction of cancer cells, immune cells and cytokines results in
a TME that is conducive to tumor cell proliferation, migration and
evasion of immune surveillance, which leads to enhanced
proliferation and metastasis of PC cells, and increased
differentiation and malignancy (5,6).
Moreover, TILs can also be used to predict the prognosis and
response to immunotherapy in patients with PC (11). Cluster of differentiation
(CD)8+ cytotoxic T lymphocytes (CTLs) are considered to
be a common type of T lymphocytes present in the TME, which
contribute to an excellent cancer prognosis by killing tumor cells
(12). CD8+ CTLs cells
in the TME are usually supported by CD4+ T helper 1
cells (CD4+ Th1) that release IFN-γ and IL-2 (13). Recently, a systematic review and
meta-analysis demonstrated that a high infiltration of
CD8+ lymphocytes, CD3+ T cells and
CD4+ lymphocytes indicated improved overall survival
(OS) rate and disease-free survival (DFS) rate of patients with
pancreatic ductal adenocarcinoma (14). Tregs are a specific class of
CD4+ T cells that are considered to promote tumor growth
and invasion by inhibiting the host's immune response (15). Forkhead box P3 (FOXP3) is one of the
most specific markers of Tregs; its elevated expression in Tregs is
associated with poor OS and recurrence rates in patients with PC
(14,16). By contrast, as a co-stimulatory
signaling pathway of the T-cell immune response, the programmed
cell death protein 1/programmed cell death ligand 1 (PD-1/PD-L1)
pathway plays a crucial role in the immune escape of tumor cells.
Previous studies have shown that PD-1 expression is upregulated in
tumor-infiltrating CD8+ T cells in several types of
solid tumors, and PD-1+ CD8+ T cells
contribute to impaired antitumor immune responses and poor survival
outcomes (17,18). Nomi et al (19) reported that the positive rate of
PD-L1 protein expression was 39.2% in PC tissues and that the
expression levels of PD-L1 were inversely correlated with the
number of TILs, notably with regard to CD8+ T cells.
More importantly, the OS rate of PD-L1-positive patients was
significantly lower than that of PD-L1-negative patients.
Apparently, the different phenotypes and locations of TILs indicate
different survival outcomes. However, the distribution
characteristics and the significance of TILs in PC remain largely
unexplored.
In the current study, the levels of TILs, including
the total number of T cells, CD4+ T cells,
CD8+ CTL, Tregs, PD-1+ T cells and
PD-L1+ T cells, were detected in the TME of patients
with PC using multiple fluorescence immunohistochemistry (mFIHC).
Furthermore, the relationships between TILs and the
clinicopathological features were investigated. Finally, the
prognostic value of these TILs was assessed in patients with PC.
These findings may provide novel insights into the prognostic
evaluation and therapy of PC.
Materials and methods
PC tissue microarrays (TMAs)
A commercially available PC TMA was obtained from
Shanghai Outdo Biotech Co., Ltd., (https://www.superchip.com.cn/biology/tissue.html;
cat no. HPanA150Su01), which contained tumor tissues from 90
patients with PC. This TMA had a total number of 150 points,
including 60 pairs of PC tissues and matched paracancerous tissues,
and 30 solitary PC tissues. All patients underwent radical
resection between September 2004 and December 2008, and were
followed up until December 2011.
mFIHC
The Opal 7-Color Manual IHC Kit (PerkinElmer, Inc.)
was used for mFIHC staining, which enables the simultaneous
visualization of six markers and a nuclear counterstain in the same
section. The detection panel included CD3, CD4, CD8, FOXP3, PD-1
and PD-L1. Briefly, the TMA was deparaffinized and rehydrated with
serial dilution solutions following washing in xylene and graded
ethanol. Antigen retrieval was performed by boiling in the antigen
retrieval solution (Tris-EDTA Buffer, pH 9.0). Subsequently, the
TMA was incubated in 3% hydrogen peroxide solution for 15 min at
room temperature to block endogenous peroxidase activity, followed
by washing in PBS and incubation with 10% goat serum for 30 min at
room temperature. Subsequently, the TMA was incubated with primary
antibody (Table I) at 4°C for 15 h,
followed by the addition of horseradish peroxidase (HRP)-conjugated
secondary antibodies (Table I) for
30 min at 37°C. Subsequently, the TMA was incubated with Tyramide
signal amplification (TSA)-Opal fluorophores for 10 min at 37°C and
prepared for the next round of staining (the fluorescent markers
and corresponding colors are shown in Table I). Between each round of staining,
the antibody-TSA complex was removed from the antigen retrieval
buffer solution (pH 9) and boiled. Following the last round of
antibody staining, the TMA was counterstained with
4′,6-diamidino-2-phenylindole (DAPI) for 5 min at room temperature
and incubated with ProLong Gold Antifade Reagent (Thermo Fisher
Scientific, Inc.). TSA technology was applied to mFIHC in this
process, in which the HRP conjugated to the secondary antibody
catalyzes the addition of fluorescein substrate to the system, and
the production of activated fluorescent substrate that can
covalently bind to tyrosine in the vicinity of the antigen,
generating a large number of stable fluorescent compounds for
signal amplification. Finally, the stained TMA was scanned using
the PerkinElmer Vectra (PerkinElmer, Inc.) multispectral imaging
platform.
 | Table I.Primary and secondary antibodies, and
fluorescent dyes used in the present study. |
Table I.
Primary and secondary antibodies, and
fluorescent dyes used in the present study.
| A, Primary
antibodies |
|---|
|
|---|
| Antibodies | Dilution | Fluorescent
dye | Deposition
color | Species | Supplier | Cat. no. |
|---|
| CD3 | 1:500 | Opal 520 | Green | Mouse | Abcam | Ab135372 |
| CD4 | 1:5 | Opal 570 | Cyan | Mouse | Abcam | Ab183685 |
|
| (ready to use) |
|
|
|
|
|
| CD8 | 1:300 | Opal 650 | Red | Mouse | Abcam | Ab217344 |
| FOXP3 | 1:500 | Opal 690 | Pink | Rabbit | Cell Signaling
Technology, Inc. | 98377s |
| PD-1 | 1:500 | Opal 540 | Yellow | Mouse | Cell Signaling
Technology, Inc. | 86163T |
| PD-L1 | 1:300 | Opal 620 | Magenta | Mouse | Cell Signaling
Technology, Inc. | 13684T |
| B, Secondary
antibodies |
|
|
Antibodies |
Dilution | Fluorescent
dye | Deposition
color | Species |
Supplier | Cat.
no. |
|
| HRP-Conjugated | 1:10,000 |
|
|
| Wuhan Bode
Bioengineering | BA1051 |
| AffiniPure Goat
IgG |
|
|
|
| Co., Ltd. |
|
| Anti-rabbit |
|
|
|
|
|
|
| (H+L) |
|
|
|
|
|
|
| HRP-Conjugated | 1:10,000 |
|
|
| Wuhan Bode
Bioengineering | BA1056 |
| AffiniPure
Goat |
|
|
|
| Co., Ltd. |
|
| Anti-mouse IgG |
|
|
|
|
|
|
| (H+L) |
|
|
|
|
|
|
TIL markers and mFIHC analysis
The phenotype markers used for targeting TILs were
as follows: Total T cells, CD3+; CD4+ T
cells, CD3+CD4+; CD8+ CTLs,
CD3+CD8+; Tregs,
CD3+CD4+FOXP3+; PD-1+ T
cells, CD3+PD-1+; and PD-L1+ T
cells, CD3+PD-L1+. At a magnification of
×200, one image was captured for each core. The collected original
mFIHC images were imported into the inForm image analysis software
(version 2.1; PerkinElmer, Inc.), and the colors of the
corresponding antibody marker were added; all photos were segmented
and the resulting fluorescent images were exported. Subsequently,
different antibody markers were labeled, the software automatically
identified tissue areas on the image as well as fluorescence, while
adjusting the threshold to the optimal value. The corresponding T
cell number was then obtained by counting the double or
triple-stained cells and the total number of DAPI-labeled nuclei
for the total number of cells. Based on the results of the image
analysis, the percentage of total T cells, CD4+ T cells,
CD8+ CTL, Tregs, PD-1+ T cells and
PD-L1+ T cells in the PC tissues and paracancerous
tissues was calculated, as well as the percentage of
CD4+ T cells, CD8+ CTL, Tregs,
PD-1+ T cells and PD-L1+ T cells over the
total percentage of T cells.
Statistical analysis
SPSS version 24.0 (IBM Corp.) and GraphPad Prism
version 8.0 (GraphPad Software; Dotmatics) software were used for
statistical analysis. The data are presented as the mean ± standard
deviation and compared using an unpaired Student's t-test. The
association between the number of TILs and the clinicopathological
characteristics was analyzed using a χ2 test. A
Kaplan-Meier survival curve was used to evaluate the relationship
between the expression levels of TIL-specific markers and the OS
rate, followed by the log-rank test. The forward stepwise Cox
regression model was used to perform univariate and multivariate
analyses for the assessment of disease prognosis. P<0.05 was
considered to indicate a statistically significant difference.
Results
Patient characteristics
The results of mFIHC indicated that 57 pairs of PC
and matched paracancerous tissues and 25 cases of solitary PC
tissues with complete tissue structure and no loss in the TMA were
successfully stained. The dots circled highlighted in red in
Fig. S1 were unsuccessfully
stained due to incomplete tissue structure or severe loss. A total
of 82 patients with PC were therefore included in the present
study, consisting of 53 males and 29 females with a median age of
62 years (34–83 years). Among these cases, 46 of the tumors were
located in the head, 31 in the body or tail, and 5 were of unknown
location due to a lack of information. The average maximum diameter
of the tumors was 4.7±2.1 cm. According to TNM stage classification
for PC (eighth edition) (20), 36
tumors were categorized as stage I, 40 as stage II, 1 as stage IV
and 5 as unknown due to a lack of information. The patients were
followed up for 0.6–87 months until December 2011. At the end of
the follow-up, 61 patients succumbed to the disease and 21 patients
survived. The average survival time was 21.4±22.7 months (Table II).
| Table II.Information on 82 cases of patients
with pancreatic cancer. |
Table II.
Information on 82 cases of patients
with pancreatic cancer.
| Variables | Value |
|---|
| Median age (range),
years | 62 (34–83) |
| Sex, n |
|
|
Male | 53 |
|
Female | 29 |
| Surgical method,
n |
|
|
Pancreatoduodenectomy | 47 |
| Distal
pancreatectomy | 30 |
| Tumor
enucleation | 5 |
| Tumor
locationa, n |
|
|
Head | 46 |
| Body or
tail | 31 |
| Mean tumor size ±
SD, cm | 4.7±2.1 |
| T
stageb, n |
|
|
T1/T2 | 65 |
| T3 | 16 |
| N
stagea, n |
|
| N0 | 45 |
| N1 | 32 |
| TNM
stagea, n |
|
| I | 36 |
| II | 40 |
|
III | 0 |
| IV | 1 |
| Survival, average
(range), months | 20.9 (0.6-81) |
Distribution characteristics of TILs
in the TME of PC
Fig. 1 represents
the mFIHC staining pattern of CD3, CD4, CD8, PD-1, PD-L1 and FOXP3
in PC and matched paracancerous tissues. As shown in Table III, the percentage of total T
cells (Fig. 2A), CD4+ T
cells (Fig. 2B) and CD8+
CTLs (Fig. 2C) in the PC tissues
was significantly lower compared with that noted in the
paracancerous tissues, while the percentage of Tregs (Fig. 2D) and PD-L1+ T (Fig. 2F) cells in PC tissues was
significantly increased. However, the percentage of
PD-1+ T cells demonstrated no significant difference
between PC and paracancerous tissues (Fig. 2E). Moreover, the proportion of
CD8+ CTLs in the total number of T cells was
significantly reduced (Fig. 2H),
while the proportion of Tregs (Fig.
2I) and PD-L1+ T (Fig.
2K) cells in the total number of T cells was significantly
increased in PC tissues. Finally, the proportion of CD4+
T (Fig. 2G) cells and
PD-1+ T (Fig. 2J) cells
in the total number of T cells was comparable between PC and
paracancerous tissues (Table
IV).
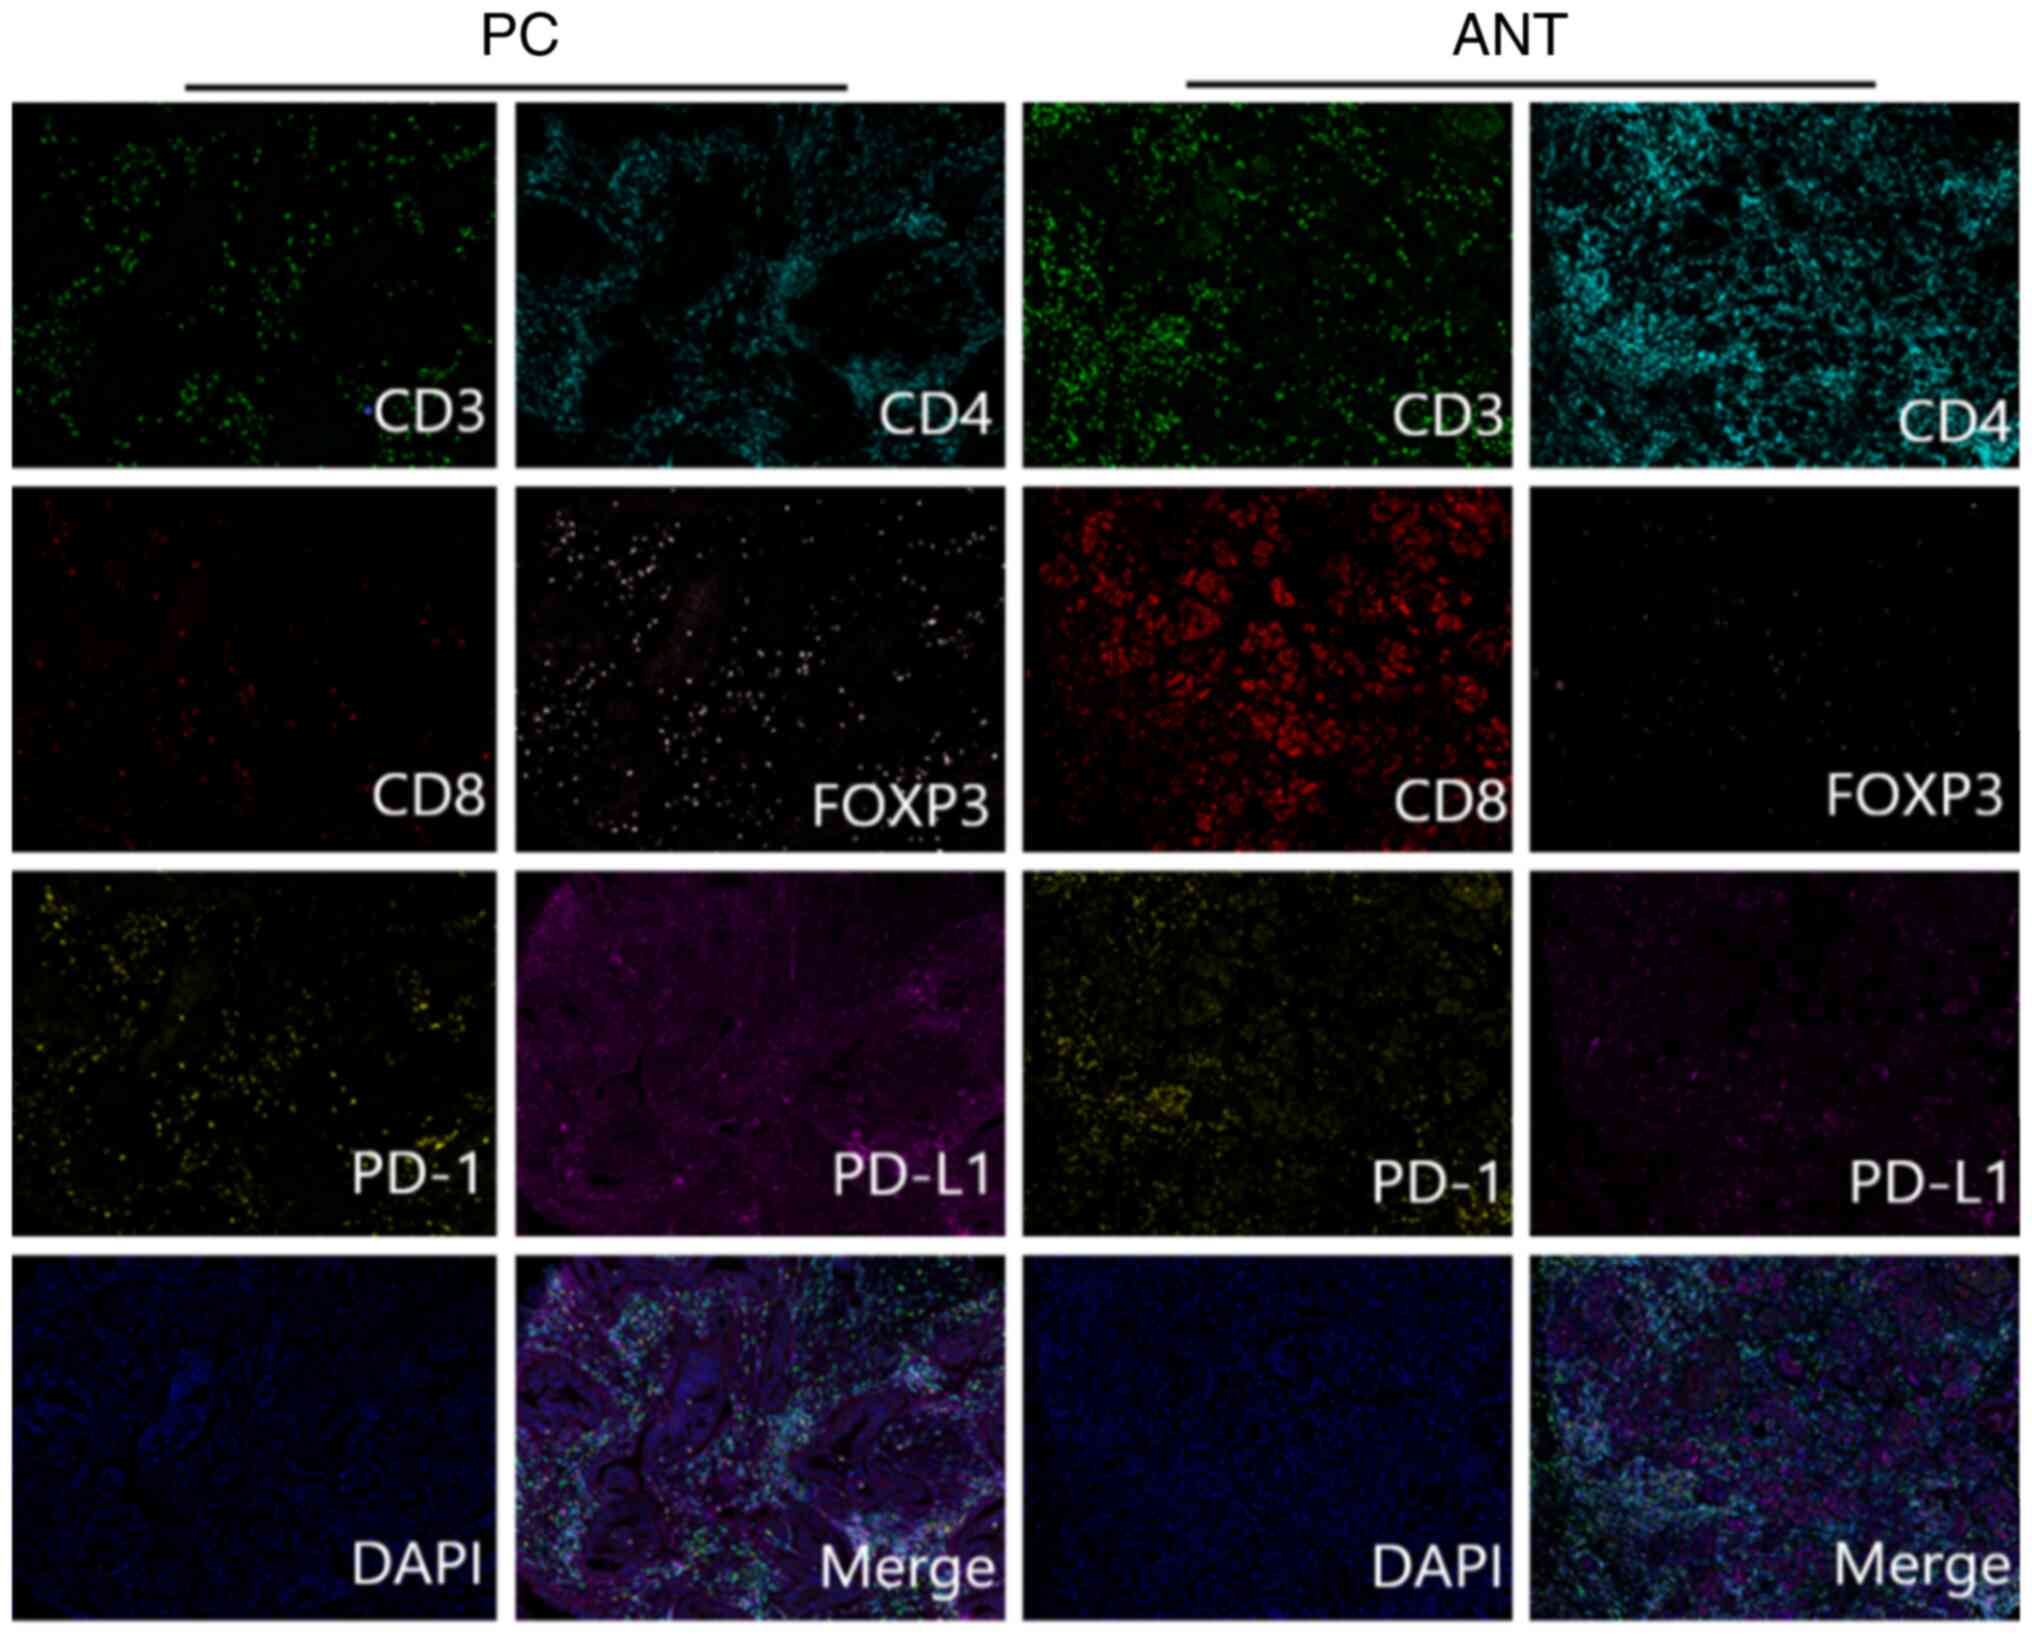 | Figure 1.Multiplex fluorescence
immunohistochemistry staining of CD3 (green), CD4 (cyan), CD8
(red), PD-1 (yellow), PD-L1 (magenta), FOXP3 (pink) and DAPI (blue)
in PC tissues and ANT. Representative merged images of the PC
tissues and ANT, respectively, are shown from 1 patient following
multispectral merging. Scale bar, 200 µm. CD, cluster of
differentiation; PD-1, programmed cell death protein 1; PD-L1,
programmed cell death ligand 1; FOXP3, forkhead box P3; DAPI,
4′,6-diamidino-2-phenylindole; PC, pancreatic cancer; ANT, adjacent
normal tissues. |
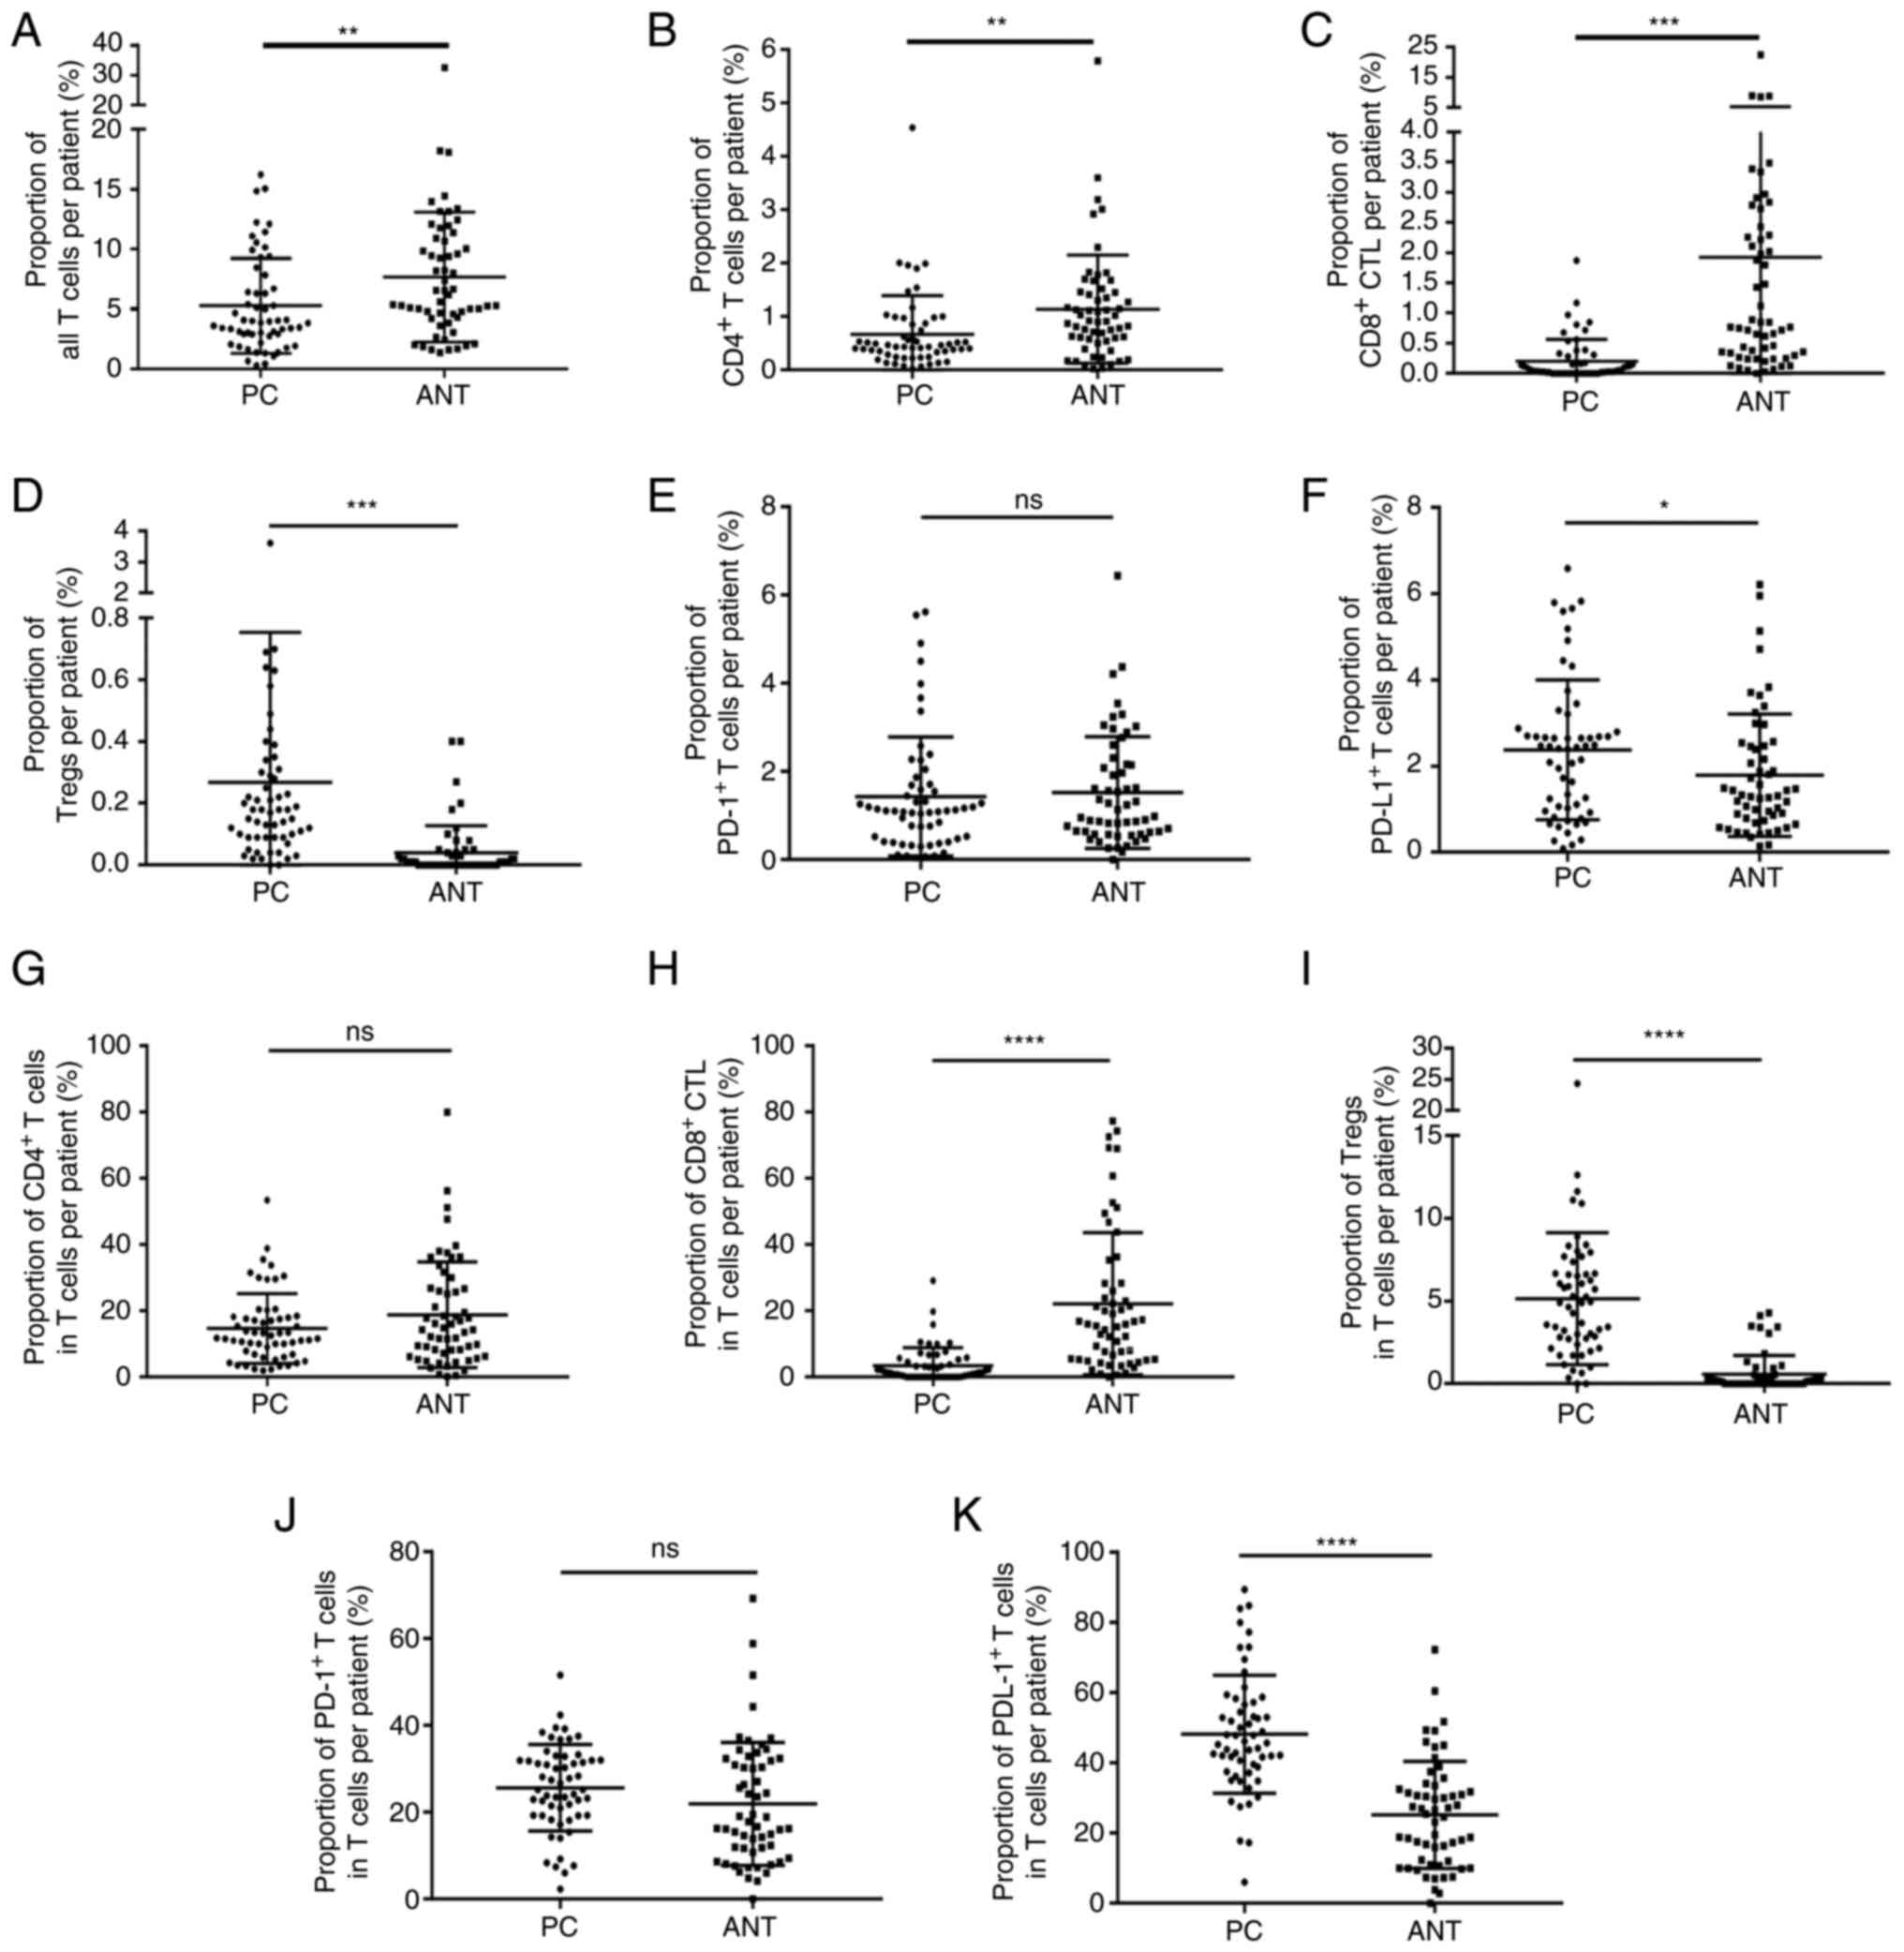 | Figure 2.Percentage of TILs and the percentage
of TILs over the total percentage of T cells in the PC tissues and
ANT. (A-F) The percentage of (A) total T cells, (B) CD4+
T cells and (C) CD8+ CTLs in PC tissues were
significantly reduced compared with those in ANTs, while those of
(D) Tregs and (F) PD-L1+ T cells in the PC tissues were
significantly increased; in (E) PD-1+ T cells no
significant difference was noted. (G-K) The percentage of (H)
CD8+ CTLs as a percentage of total T cells was
significantly reduced, while the percentage of (I) Tregs and (K)
PD-L1+ T cells was markedly increased in PC tissues; the
proportion of (G) CD4+ T cells and (J) PD-1+
T cells did not differ significantly. *P<0.05, **P<0.01,
***P<0.001, ****P<0.0001. ns, not significant; TILs,
tumor-infiltrating lymphocytes; PC, pancreatic cancer; ANTs,
adjacent normal tissues; CD, cluster of differentiation; CTLs,
cytotoxic T lymphocytes; Tregs, T regulatory cells; PD-L1,
programmed cell death ligand 1; PD-1, programmed cell death protein
1. |
| Table III.Percentage of tumor-infiltrating
lymphocytes in 57 pairs of PC and matched paracancerous
tissuesa. |
Table III.
Percentage of tumor-infiltrating
lymphocytes in 57 pairs of PC and matched paracancerous
tissuesa.
| Variable | Mean | SD | P-value |
|---|
| Total T cells |
|
| 0.008b |
| Tumor
tissues | 5.27 | 4.0 |
|
|
Paracancerous tissues | 7.69 | 5.4 |
|
| CD4+ T
cells |
|
| 0.005b |
| Tumor
tissues | 0.67 | 0.7 |
|
|
Paracancerous tissues | 1.14 | 1.0 |
|
| CD8+
CTLs |
|
|
<0.001c |
| Tumor
tissues | 0.21 | 0.4 |
|
|
Paracancerous tissues | 1.93 | 3.4 |
|
| Tregs |
|
| 0.001c |
| Tumor
tissues | 0.27 | 0.5 |
|
|
Paracancerous tissues | 0.04 | 0.1 |
|
| PD-1+ T
cells |
|
| 0.712 |
| Tumor
tissues | 1.43 | 1.4 |
|
|
Paracancerous tissues | 1.52 | 1.3 |
|
| PD-L1+ T
cells |
|
| 0.032d |
| Tumor
tissues | 2.38 | 1.6 |
|
|
Paracancerous tissues | 1.76 | 1.4 |
|
| Table IV.Percentage of different
tumor-infiltrating lymphocytes over the number of total T cells in
57 pairs of pancreatic cancer and matched paracancerous
tissuesa. |
Table IV.
Percentage of different
tumor-infiltrating lymphocytes over the number of total T cells in
57 pairs of pancreatic cancer and matched paracancerous
tissuesa.
| Variables | Mean | SD | P-value |
|---|
| CD4+ T
cells |
|
| 0.104 |
| Tumor
tissues | 14.7 | 10.5 |
|
|
Paracancerous tissues | 18.8 | 16.0 |
|
| CD8+
CTLs |
|
|
<0.001b |
| Tumor
tissues | 3.5 | 5.4 |
|
|
Paracancerous tissues | 22.2 | 21.5 |
|
| Tregs |
|
|
<0.001b |
| Tumor
tissues | 5.2 | 4.0 |
|
|
Paracancerous tissues | 0.6 | 1.1 |
|
| PD-1+ T
cells |
|
| 0.110 |
| Tumor
tissues | 25.6 | 10.0 |
|
|
Paracancerous tissues | 22.0 | 14.2 |
|
| PD-L1+ T
cells |
|
|
<0.001b |
| Tumor
tissues | 48.2 | 16.8 |
|
|
Paracancerous tissues | 25.2 | 15.3 |
|
Association of TILs with
clinicopathological characteristics
The median number of each TIL type was used as a
cut-off point to classify the patients included in the study into
low- and high-infiltration groups. The associations of TILs with
clinicopathological characteristics were analyzed. As shown in
Table V, Table VI, Table VII, the extent of infiltration of
the total number of T cells was closely associated with the tumor
differentiation and T stage, but not with sex, age, tumor diameter,
N stage and TNM stage. The infiltrates of CD4+ T cells
and CD8+ CTLs were inversely associated with tumor
differentiation. Higher infiltrates of Tregs and PD-L1+
T cells were closely associated with advanced N and TNM stages. The
levels of PD-1+ T cell infiltration were closely
associated with tumor differentiation and T stage, and were not
associated with sex, age, tumor diameter, N stage and TNM
stage.
| Table V.Associations of total number of T
cells and CD4+ T cells with clinicopathological
characteristics in 82 cases of pancreatic cancer. |
Table V.
Associations of total number of T
cells and CD4+ T cells with clinicopathological
characteristics in 82 cases of pancreatic cancer.
|
| Total T cells, n
(%) |
| CD4+ T
cells, n (%) |
|
|---|
|
|
|
|
|
|
|---|
| Variables | Low (n=41) | High (n=41) | P-value | Low (n=41) | High (n=41) | P-value |
|---|
| Sex |
|
| 0.106 |
|
| 0.817 |
|
Male | 30 (56.60) | 23 (43.40) |
| 27 (50.94) | 26 (49.06) |
|
|
Female | 11 (37.93) | 18 (62.07) |
| 14 (48.28) | 15 (51.72) |
|
| Age, years |
|
| 0.267 |
|
| 0.506 |
|
≤60 | 16 (43.24) | 21 (56.76) |
| 17 (45.95) | 20 (54.05) |
|
|
>60 | 25 (55.56) | 20 (44.44) |
| 24 (53.33) | 21 (46.67) |
|
| Diameter,
cma |
|
| 0.860 |
|
| 0.503 |
| ≤3 | 12 (52.17) | 11 (47.83) |
| 13 (56.52) | 10 (43.48) |
|
|
>3 | 29 (50.00) | 29 (50.00) |
| 28 (48.28) | 30 (51.72) |
|
|
Differentiation |
|
| 0.040b |
|
| 0.012b |
|
Well/moderately
differentiated | 21 (41.18) | 30 (58.82) |
| 20 (39.22) | 31 (60.78) |
|
|
Poor | 20 (64.52) | 11 (35.48) |
| 21 (67.74) | 10 (32.26) |
|
| T
stagea |
|
| 0.049b |
|
| 0.615 |
|
T1/T2 | 29 (44.62) | 36 (55.38) |
| 32 (49.23) | 33 (50.77) |
|
| T3 | 12 (75.00) | 4 (25.00) |
| 9 (56.25) | 7 (43.75) |
|
| N
stagec |
|
| 0.271 |
|
| 0.271 |
| N0 | 24 (53.33) | 21 (46.67) |
| 24 (53.33) | 21 (46.67) |
|
| N1 | 13 (40.63) | 19 (59.37) |
| 13 (40.63) | 19 (59.37) |
|
| TNM
stagec |
|
| 0.891 |
|
| 0.749 |
| I | 17 (47.22) | 19 (52.78) |
| 18 (50.00) | 18 (50.00) |
|
|
II–IV | 20 (48.78) | 21 (51.22) |
| 19 (46.34) | 22 (53.66) |
|
| Table VI.Association between the percentage of
CD8+ CTLs and Tregs with the clinicopathological
characteristics in the 82 cases of pancreatic cancer. |
Table VI.
Association between the percentage of
CD8+ CTLs and Tregs with the clinicopathological
characteristics in the 82 cases of pancreatic cancer.
|
| CD8+
CTLs, n (%) |
| Tregs, n (%) |
|
|---|
|
|
|
|
|
|
|---|
| Variables | Low (n=41) | High (n=41) | P-value | Low (n=41) | High (n=41) | P-value |
|---|
| Sex |
|
| 0.817 |
|
| 0.488 |
|
Male | 26 (49.06) | 27 (50.94) |
| 28 (52.83) | 25 (47.17) |
|
|
Female | 15 (51.72) | 14 (48.28) |
| 13 (44.83) | 16 (55.17) |
|
| Age, years |
|
| 0.824 |
|
| 0.824 |
|
≤60 | 19 (51.35) | 18 (48.65) |
| 19 (51.35) | 18 (48.65) |
|
|
>60 | 22 (48.89) | 23 (51.11) |
| 22 (48.89) | 23 (51.11) |
|
| Diameter,
cma |
|
| 0.245 |
|
| 0.418 |
| ≤3 | 14 (60.87) | 9 (39.13) |
| 10 (43.48) | 13 (56.52) |
|
|
>3 | 27 (46.55) | 31 (53.45) |
| 31 (53.45) | 27 (46.55) |
|
|
Differentiation |
|
| 0.012b |
|
| 0.111 |
| Well,
moderately, and highly differentiated' | 20 (39.22) | 31 (60.78) |
| 22 (43.14) | 29 (56.86) |
|
| Poorly
differentiated | 21 (67.74) | 10 (32.26) |
| 19 (61.29) | 12 (38.71) |
|
| T
stagea |
|
| 0.162 |
|
| 0.615 |
|
T1/T2 | 30 (46.15) | 35 (53.85) |
| 32 (49.23) | 33 (50.77) |
|
| T3 | 11 (68.75) | 5 (31.25) |
| 9 (56.25) | 7 (43.75) |
|
| N
stagec |
|
| 0.307 |
|
| 0.004d |
| N0 | 25 (55.56) | 20 (44.44) |
| 29 (64.44) | 16 (35.56) |
|
| N1 | 14 (43.75) | 18 (56.25) |
| 10 (31.25) | 22 (68.75) |
|
| TNM
stagec |
|
| 0.915 |
|
| 0.029b |
| I | 18 (50.00) | 18 (50.00) |
| 23 (63.89) | 13 (36.11) |
|
|
II–IV | 21 (51.22) | 20 (48.78) |
| 16 (39.02) | 25 (60.98) |
|
| Table VII.Association between the percentage of
PD-1+ T cells and PD-L1+ T cells with the
clinicopathological characteristics in the 82 cases of pancreatic
cancer. |
Table VII.
Association between the percentage of
PD-1+ T cells and PD-L1+ T cells with the
clinicopathological characteristics in the 82 cases of pancreatic
cancer.
|
| PD-1+ T
cells, n (%) |
| PD-L1+ T
cells, n (%) |
|
|---|
|
|
|
|
|
|
|---|
| Variables | Low (n=41) | High (n=41) | P-value | Low (n=41) | High (n=41) | P-value |
|---|
| Sex |
|
| 0.488 |
|
| 0.488 |
|
Male | 25 (47.17) | 28 (52.83) |
| 28 (52.83) | 25 (47.17) |
|
|
Female | 16 (55.17) | 13 (44.83) |
| 13 (44.83) | 16 (55.17) |
|
| Age, years |
|
| 0.824 |
|
| 0.824 |
|
≤60 | 18 (48.65) | 19 (51.35) |
| 19 (51.35) | 18 (48.65) |
|
|
>60 | 23 (51.11) | 22 (48.89) |
| 22 (48.89) | 23 (51.11) |
|
| Diameter,
cma |
|
| 0.245 |
|
| 0.752 |
| ≤3 | 9 (39.13) | 14 (60.87) |
| 11 (47.83) | 12 (52.17) |
|
|
>3 | 31 (53.45) | 27 (46.55) |
| 30 (51.72) | 28 (48.28) |
|
|
Differentiation |
|
| 0.012b |
|
| 0.494 |
| Well,
moderately and highly differentiated | 20 (39.22) | 31 (60.78) |
| 24 (47.06) | 27 (52.94) |
|
| Poorly
differentiated | 21 (67.74) | 10 (32.26) |
| 17 (54.84) | 14 (45.16) |
|
| T
stagea |
|
| 0.027 |
|
| 0.615 |
|
T1/T2 | 28 (43.08) | 37 (56.92) |
| 32 (49.23) | 33 (50.77) |
|
| T3 | 12 (75.00) | 4 (25.00) |
| 9 (56.25) | 7 (43.75) |
|
| N
stagec |
|
| 0.079 |
|
| 0.002d |
| N0 | 26 (57.78) | 19 (42.22) |
| 30 (66.67) | 15 (33.33) |
|
| N1 | 12 (37.50) | 20 (62.50) |
| 10 (31.25) | 22 (68.75) |
|
| TNM
stagec |
|
| 0.726 |
|
| 0.015b |
| I | 17 (47.22) | 19 (52.78) |
| 24 (66.67) | 12 (33.33) |
|
|
II–IV | 21 (51.22) | 20 (48.78) |
| 16 (39.02) | 25 (60.98) |
|
Association of TILs with
prognosis
Kaplan-Meier analysis indicated that patients with
high levels of total T cell (Fig.
3A, P=0.010), CD4+ T cell (Fig. 3B, P=0.021), and CD8+ CTL
(Fig. 3C, P=0.015) infiltrates
exhibited a significantly higher OS rate than those with low levels
of infiltrates. However, the OS rate of patients with high levels
of Treg (Fig. 3D, P=0.036) and
PD-L1+ T cell (Fig. 3F,
P=0.005) infiltrates was significantly lower than that of patients
with low levels of Treg and PD-L1+ T cell infiltrates.
In addition, the infiltrate levels of PD-1+ T cells
exhibited no significant effect on the OS rate (Fig. 3E, P=0.677).
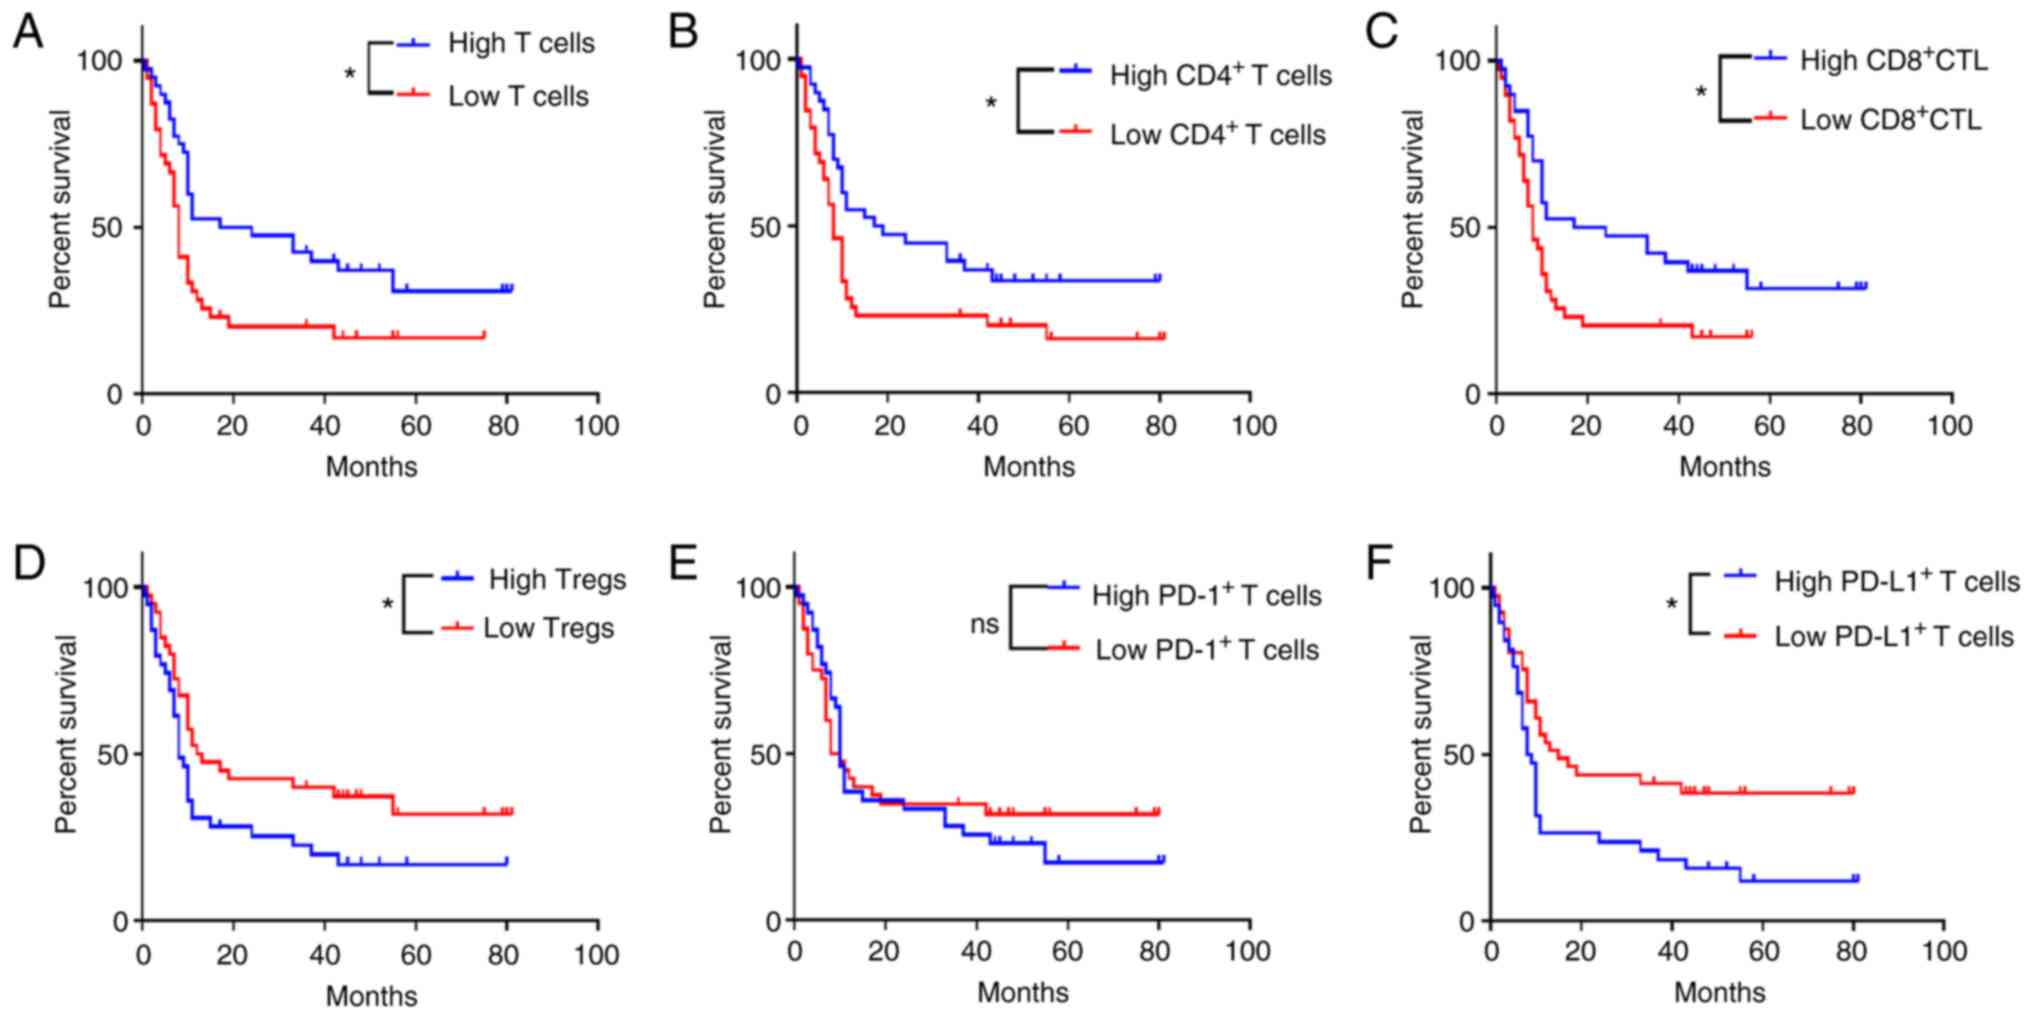 | Figure 3.Associations of TIL types with
disease prognosis. Kaplan-Meier analysis (A-F) indicated that
patients with high infiltrates of (A) total T cells, (B)
CD4+ T cells and (C) CD8+ CTLs exhibited a
significantly longer OS time than those with low levels of
infiltrates. By contrast, the OS times of patients with low levels
of (D) Tregs and (F) PD-L1+ T cell infiltrates was
significantly shorter; the infiltrate levels of (E)
PD-1+ T cells exhibited no significant effect on the OS.
*P<0.05. ns, no significance; TIL, tumor-infiltrating
lymphocyte; CD, cluster of differentiation; CTLs, cytotoxic T
lymphocytes; OS, overall survival; Treg, T regulatory cell; PD-L1,
programmed cell death ligand 1; PD-1, programmed cell death protein
1. |
Multivariate analysis of prognosis in
patients with PC
Univariate analysis indicated that tumor
differentiation (P=0.010), N stage (P=0.007), TNM stage (P=0.004),
total number of T cells (P=0.010), CD4+ T cells
(P=0.021), CD8+ CTLs (P=0.015), Tregs (P=0.036) and
PD-L1+ T cells (P=0.005) were associated with the OS
rate of patients with PC (Table
VIII). Subsequently, these variables were included in a
multivariate Cox regression model. Multivariate analysis revealed
that tumor differentiation [hazard ratio (HR), 2.733; P=0.001], TNM
stage (HR, 2.364; P=0.005), total number of T cells (HR, 0.323;
P=0.001), CD4+ T cells (HR, 0.393; P=0.003),
PD-L1+ T cells (HR, 2.305; P=0.012) and Tregs (HR,
2.786; P=0.003) were independent risk factors of OS rate in
patients with PC (Table IX).
| Table VIII.Single factor analysis of prognosis
in the 82 cases of pancreatic cancer. |
Table VIII.
Single factor analysis of prognosis
in the 82 cases of pancreatic cancer.
| Clinicopathological
parameters | n | Hazard ratio | 95% confidence
interval | P-value |
|---|
| Sex |
| 1.037 | 0.557-4.248 | 0.409 |
|
Male | 53 |
|
|
|
|
Female | 29 |
|
|
|
| Age, years |
| 1.149 | 0.474-3.516 | 0.369 |
|
≤60 | 37 |
|
|
|
|
>60 | 45 |
|
|
|
| Diameter,
cma |
| 1.391 | 0.301-8.419 | 0.540 |
| ≤3 | 23 |
|
|
|
|
>3 | 58 |
|
|
|
|
Differentiation |
| 2.354 | 1.046-15.924 | 0.010b |
|
Well/moderately
differentiated | 51 |
|
|
|
| Poorly
differentiated | 31 |
|
|
|
|
T-stagea |
| 0.233 | 0.043-1.260 | 0.996 |
|
T1/T2 | 65 |
|
|
|
| T3 | 16 |
|
|
|
|
N-stagec |
| 5.869 | 1.548-22.251 | 0.007b |
| N0 | 45 |
|
|
|
| N1 | 32 |
|
|
|
| TNM
stagec |
| 3.712 | 1.242-11.096 | 0.004b |
| I | 36 |
|
|
|
|
II–IV | 41 |
|
|
|
| Total T cells |
| 2.634 | 1.347-18.354 | 0.010b |
|
High | 41 |
|
|
|
|
Low | 41 |
|
|
|
| CD4+ T
cells |
| 1.926 | 1.152-16.327 | 0.021d |
|
High | 41 |
|
|
|
|
Low | 41 |
|
|
|
| CD8+
CTLs |
| 2.015 | 1.065-19.083 | 0.015d |
|
High | 41 |
|
|
|
|
Low | 41 |
|
|
|
| Tregs |
| 1.375 | 1.013-8.419 | 0.036d |
|
High | 41 |
|
|
|
|
Low | 41 |
|
|
|
| PD-1+ T
cells |
| 0.915 | 0.694-5.282 | 0.677 |
|
High | 41 |
|
|
|
|
Low | 41 |
|
|
|
| PD-L1+ T
cells |
| 4.608 | 1.494-34.213 | 0.005b |
|
High | 41 |
|
|
|
|
Low | 41 |
|
|
|
| Table IX.Multivariate analysis of prognosis in
82 cases of pancreatic cancer. |
Table IX.
Multivariate analysis of prognosis in
82 cases of pancreatic cancer.
| Clinicopathological
parameters | n | Hazard ratio | 95% confidence
interval | P-value |
|---|
|
Differentiation |
| 2.733 | 1.491-5.009 | 0.001a |
|
Well | 51 |
|
|
|
|
Moderately | 31 |
|
|
|
| N
stageb |
| 2.243 | 0.794-6.332 | 0.127 |
| N0 | 45 |
|
|
|
| N1 | 32 |
|
|
|
| TNM
stageb |
| 2.364 | 1.297-4.308 | 0.005c |
| I | 36 |
|
|
|
|
II–IV | 41 |
|
|
|
| Total T cells |
| 0.323 | 0.169-0.618 | 0.001a |
|
High | 41 |
|
|
|
|
Low | 41 |
|
|
|
| CD4+ T
cells |
| 0.393 | 0.214-0.722 | 0.003c |
|
High | 41 |
|
|
|
|
Low | 41 |
|
|
|
| CD8+
CTLs |
| 0.587 | 0.303-1.137 | 0.114 |
|
High | 41 |
|
|
|
|
Low | 41 |
|
|
|
| Tregs |
| 2.786 | 1.426-5.445 | 0.003c |
|
High | 41 |
|
|
|
|
Low | 41 |
|
|
|
| PD-L1+ T
cells |
| 2.305 | 1.205-4.409 | 0.012d |
|
High | 41 |
|
|
|
|
Low | 41 |
|
|
|
Discussion
Despite the improvements in the survival times of
patients with PC due to radical resection combined with adjuvant
chemotherapy, the prognosis of patients with PC remains extremely
poor, as ~50% of patients are diagnosed in the first instance with
advanced-stage disease. In recent years, immunotherapy consisting
of PD-1 and PD-L1 inhibitors has been shown to be highly effective
in the treatment of melanoma, non-small cell lung cancer and
hepatocellular carcinoma (21,22).
However, the treatment of PC remains a challenge due
to the disappointing results derived from immunotherapy (5). This failure is likely due to a highly
immunosuppressive TME state present in PC. TILs are important
components of the TME and their composition reflects the
confrontation between the host immune system and the tumor cells
(23). Among these TILs,
CD4+ T cells and CD8+ CTLs are the primary
antitumor effector T cells, and they can inhibit the occurrence and
progression of cancer through various mechanisms. Upon activation,
CD4+ T cells can differentiate into CD4+ Th1
cells and secrete IL-2 to activate CD8+ CTLs.
Subsequently, cytokines, such as IFN-γ, TNF-β, IL-4, IL-5 and IL-10
are secreted by CD8+ CTLs, and regulate cellular and
humoral immunity for killing or inhibiting the progression of PC
tumor cells (24,25). Previous studies have shown that
patients with PC and high levels of infiltrating CD4+ T
cells and CD8+ CTLs in tumor tissues present with an
improved prognosis (23,26). Recently, spatial computational
analysis revealed that the density of CD8+ cells
throughout the tumor and tumor center was associated with higher
survival rates in patients with PC (27). Moreover, evidence has also indicated
that patients with PC with a substantial level of CD8+
CTL infiltrate exhibit an improved response to chemotherapy
(28). Similarly, TILs are present
in the TME of other malignancies. For example, higher levels of
CD8+ CTLs were observed in the tumor tissues of patients
with cervical and ovarian cancer, and were associated with improved
patient prognosis (29,30). The increase in the Treg count was
associated with colorectal cancer tumor progression, immunotherapy
failure and a poorer prognosis (31,32).
In the present study, the distribution characteristics of six types
of TILs were investigated in PC tissues using mFIHC. The results
demonstrated that the infiltrate levels of the total number of T
cells, CD4+ T cells and CD8+ CTLs were
significantly reduced, while the number of Tregs and
PD-L1+ T cells was significantly increased in PC
tissues. Moreover, higher levels of total T cells, and
CD4+ T cell and CD8+ CTL infiltrates were
associated with an improved prognosis, whereas higher levels of
Treg and PD-L1+ T cell infiltrates in the tumor tissues
were indicative of a poorer prognosis in the patients with PC. The
Cox regression model with multivariate analysis indicated that the
levels of total T cells, and CD4+ T cell, Treg and
PD-L1+ T cell infiltrates, as well as the tumor
differentiation and TNM stage, were independent risk factors for
the OS rate of patients with PC. These results suggested that the
decreased number of CD4+ T cells and CD8+
CTLs, as well as the increased number of Tregs and
PD-L1+ T cells in the tumor tissues, contributed to the
formation of an immunosuppressive TME state in patients with
PC.
Tregs are a subgroup of CD4+ T cells,
which are one of the most important immunosuppressive cells present
in the TME (33). Accumulating
evidence has shown that Tregs are involved in multiple
immunoregulatory mechanisms and execute functions of the host
immune response (33,34). Tregs mediate tumor cells to evade
immune surveillance and immune elimination, and to promote the
progression of malignant tumors (26,33,34).
The FOXP3+ Treg infiltrate in the TME can inhibit the
function of effector T cells and dendritic cells by secreting
suppressive cytokines, such as IL-10 and TGF-β, or via the
cell-mediated involvement of inhibitory receptors, promoting the
exhaustion of effector T cells (35). Previous studies revealed that the
number of Tregs was significantly increased in a variety of tumor
tissues, including ovarian, colorectal and lung cancer (31,36,37).
In the case of PC, the density of Tregs was significantly higher in
tumor tissues than that noted in the paratumoral pancreatic
tissues. The density of Tregs was significantly correlated with the
histological grade and lymph node metastasis (38). In a consecutive series of 92
patients with PC resection, Liu et al (39) demonstrated that patients with higher
levels of intratumoral Tregs exhibited shorter DFS times than those
with lower levels of Tregs (11.2 vs. 22.2 months; P<0.001). In
the current study, the data confirmed that the number of Tregs in
PC tissues was significantly higher than that noted in
paracancerous tissues; patients with lymph node metastasis and
advanced TNM stage exhibited a higher level of Treg infiltrate in
tumor tissues. Furthermore, higher Treg infiltrate was associated
with a poorer prognosis in patients with PC, suggesting that this
marker is an independent risk factor for the prognosis of this
disease.
It is well established that immune checkpoints are
important mechanisms for tumor immune escape (40,41).
The PD-1/PD-L1 pathway is a major immune checkpoint for the
tumor-suppressing function of the lymphocytes present within the
TME (42). The PD-1/PD-L1 axis is
an important target for tumor immunotherapy and PD-1/PD-L1 blockade
has shown favorable therapeutic effects in a variety of cancer
types (21,42,43).
PD-1 is primarily expressed in activated CD4+ T cells,
CD8+ T and B cells (44). However, PD-L1 is not only expressed
in various immune cells, including activated CD4+ T
cells and Treg subsets, but also in tissue cells, including cancer
cells (45,46). Previous studies have demonstrated
that tumor cells and the TME can upregulate PD-L1 expression,
activate PD-1/PD-L1 signaling pathways, and inhibit the activation
and proliferation of CD4+ and CD8+ T cells.
In addition, PD-1 binds to PD-L1 and acts on several key molecules
in the T cell receptor-signaling pathway to inhibit the
transcription and translation of genes and cytokines required for
T-cell activation. Moreover, it induces T-cell apoptosis, thereby
negatively regulating the body's immune response (47,48).
Moreover, activation of the PD-1/PD-L1 signaling pathway can also
maintain the function of the Tregs and promote their development
(49,50). Wang et al (51) indicated that high expression of PD-1
on the membranes of T cells was significantly correlated with
optimal differentiation and advanced T stage in PC, whereas high
expression of PD-1 indicated a significantly superior OS rate.
Nevertheless, in the current study, it was found that the number of
PD-1+ T cells exhibited no significant difference
between PC and paracancerous tissues. Although the infiltrate level
of PD-1+ T cells was lower in patients with poor
differentiation and advanced T stage, it did not cause a
significant effect on the OS rate of patients with PC. PD-1 is
expressed on the surface of activated T cells in PC tissues, mostly
CD4+ T cells and CD8+ T cells, as well as B
cells and monocytes. At the same time, activated T cells are
inhibited in the tumor immune microenvironment, and PD-L1 expressed
in PC cells can transmit negative regulatory signals after binding
with PD-1, which leads to a reduction in T-cell proliferation or
apoptosis while cancer cells exhibit rapid growth (5). This may well explain why there was no
significant difference in PD-1 expression between PC and adjacent
normal tissues in the present study. Previous studies indicated
that PD-L1 was abnormally upregulated in tumor tissues of lung
cancer and melanoma, while PD-L1 expression was significantly
associated with improved outcomes and therapeutic responses to
anti-PD-L1 antibody treatments (52,53).
Based on the mRNA expression data from TCGA and the
immunohistochemical protein expression data derived from 33 cases
of PC, Danilova et al (54)
indicated that PD-L1 expression in PC was associated with CD8A
expression, IDO1 expression and the Th1/IFN-γ gene signature.
Moreover, high PD-L1 expression was associated with poor patient
survival in patients with PC. The results of the present study
suggested that the number of PD-L1+ T cells was markedly
higher in PC tissues than that noted in paracancerous tissues. A
higher infiltrate of PD-L1+ T cells was noted in
patients with positive lymph nodes and advanced TNM stage, which
supported a lower survival time for patients with PC and a higher
PD-L1+ T cell infiltrate.
Undoubtedly, the present study has certain
limitations. Firstly, not all types of TILs were investigated, the
spatial distribution characteristics of TILs were not described and
the results of RT-qPCR for TIL expression are lacking. Secondly,
the detection of TILs was based on a commercial TMA with limited
cases, and certain clinicopathological data were omitted, such as
pancreatolithiasis, drinking habits, and history of chronic
pancreatitis and type 2 diabetes. Thirdly, other immunosuppressive
cells that regulate the infiltration of TILs in the pancreatic TME,
such as M2-like TAMs, MDSCs and cancer-associated fibroblasts, were
not involved in the present study. Therefore, additional
large-scale studies are required to further improve these
limitations.
In summary, the results of the present study
demonstrated that patients with PC had an immunosuppressive TME,
with reduced numbers of CD4+ T cells and reduced levels
of CD8+ CTL infiltrates, as well as increased numbers of
Tregs and PD-L1+ T cells. The infiltrates of total T
cells, CD4+ T cells, Tregs and PD-L1+ T cells
in the TME were independent risk factors for the prognosis of PC.
These TILs are expected to be novel targets for remodeling the TME
of PC.
Supplementary Material
Supporting Data
Acknowledgements
Not applicable.
Funding
The present study was supported by the National Natural Science
Foundation of China (grant no. 81860418), the Natural Science
Foundation of Jiangxi Province (grant no. 20202ACB206007), and the
Key Research and Development Program of Jiangxi Province (grant no.
20192BBG70035).
Availability of data and materials
The datasets used and/or analyzed during the
current study are available from the corresponding author on
reasonable request.
Authors' contributions
WX conceived and designed the study. GS, ZY, KF and
ST performed the experiments and wrote the manuscript. YX and SY
acquired and analyzed the data. GS and WX edited and revised the
manuscript. All authors have read and approved the final
manuscript.
Ethics approval and consent to
participate
The present study was approved by the Ethics
Committee of the First Affiliated Hospital of Nanchang University
[approval no. (2021) 42; Nanchang, China].
Patient consent for publication
The creation and use of TMA were approved by the
Ethics Committee of Shanghai Outdo Biotech Co., Ltd. (approval no.
YB M-05-02).
Competing interests
The authors declare that they have no competing
interests.
References
|
1
|
Xia C, Dong X, Li H, Cao M, Sun D, He S,
Yang F, Yan X, Zhang S, Li N and Chen W: Cancer statistics in China
and United States, 2022: Profiles, trends, and determinants. Chin
Med J (Engl). 135:584–590. 2022. View Article : Google Scholar : PubMed/NCBI
|
|
2
|
Siegel RL, Miller KD, Fuchs HE and Jemal
A: Cancer statistics, 2022. CA Cancer J Clin. 72:7–33. 2022.
View Article : Google Scholar : PubMed/NCBI
|
|
3
|
Rahib L, Smith BD, Aizenberg R, Rosenzweig
AB, Fleshman JM and Matrisian LM: Projecting cancer incidence and
deaths to 2030: The unexpected burden of thyroid, liver, and
pancreas cancers in the United States. Cancer Res. 74:2913–2921.
2014. View Article : Google Scholar : PubMed/NCBI
|
|
4
|
Spill F, Reynolds DS, Kamm RD and Zaman
MH: Impact of the physical microenvironment on tumor progression
and metastasis. Curr Opin Biotechnol. 40:41–48. 2016. View Article : Google Scholar : PubMed/NCBI
|
|
5
|
Wang S, Li Y, Xing C, Ding C, Zhang H,
Chen L, You L, Dai M and Zhao Y: Tumor microenvironment in
chemoresistance, metastasis and immunotherapy of pancreatic cancer.
Am J Cancer Res. 10:1937–1953. 2020.PubMed/NCBI
|
|
6
|
Hinshaw DC and Shevde LA: The tumor
microenvironment innately modulates cancer progression. Cancer Res.
79:4557–4566. 2019. View Article : Google Scholar : PubMed/NCBI
|
|
7
|
Fu X, Sun G, Tu S, Fang K, Xiong Y, Tu Y,
Zha M, Xiao T and Xiao W: Hsa_circ_0046523 mediates an
immunosuppressive tumor microenvironment by regulating
MiR-148a-3p/PD-L1 axis in pancreatic cancer. Front Oncol.
12:8773762022. View Article : Google Scholar : PubMed/NCBI
|
|
8
|
Kaneda MM, Messer KS, Ralainirina N, Li H,
Leem CJ, Gorjestani S, Woo G, Nguyen AV, Figueiredo CC, Foubert P,
et al: PI3Kγ is a molecular switch that controls immune
suppression. Nature. 539:437–442. 2016. View Article : Google Scholar : PubMed/NCBI
|
|
9
|
Kabashima A, Matsuo Y, Ito S, Akiyama Y,
Ishii T, Shimada S, Masamune A, Tanabe M and Tanaka S: cGAS-STING
signaling encourages immune cell overcoming of fibroblast
barricades in pancreatic cancer. Sci Rep. 12:104662022. View Article : Google Scholar : PubMed/NCBI
|
|
10
|
Lefler JE, MarElia-Bennett CB, Thies KA,
Hildreth BE III, Sharma SM, Pitarresi JR, Han L, Everett C,
Koivisto C, Cuitino MC, et al: STAT3 in tumor fibroblasts promotes
an immunosuppressive microenvironment in pancreatic cancer. Life
Sci Alliance. 5:e2022014602022. View Article : Google Scholar : PubMed/NCBI
|
|
11
|
Nejati R, Goldstein JB, Halperin DM, Wang
H, Hejazi N, Rashid A, Katz MH, Lee JE, Fleming JB,
Rodriguez-Canales J, et al: Prognostic significance of
tumor-infiltrating lymphocytes in patients with pancreatic ductal
adenocarcinoma treated with neoadjuvant chemotherapy. Pancreas.
46:1180–1187. 2017. View Article : Google Scholar : PubMed/NCBI
|
|
12
|
Hivroz C, Chemin K, Tourret M and
Bohineust A: Crosstalk between T lymphocytes and dendritic cells.
Crit Rev Immunol. 32:139–155. 2012. View Article : Google Scholar : PubMed/NCBI
|
|
13
|
Wang T, Niu G, Kortylewski M, Burdelya L,
Shain K, Zhang S, Bhattacharya R, Gabrilovich D, Heller R, Coppola
D, et al: Regulation of the innate and adaptive immune responses by
Stat-3 signaling in tumor cells. Nat Med. 10:48–54. 2004.
View Article : Google Scholar : PubMed/NCBI
|
|
14
|
Orhan A, Vogelsang RP, Andersen MB, Madsen
MT, Hölmich ER, Raskov H and Gögenur I: The prognostic value of
tumour-infiltrating lymphocytes in pancreatic cancer: a systematic
review and meta-analysis. Eur J Cancer. 132:71–84. 2020. View Article : Google Scholar : PubMed/NCBI
|
|
15
|
Biswas SK and Mantovani A: Macrophage
plasticity and interaction with lymphocyte subsets: Cancer as a
paradigm. Nat Immunol. 11:889–896. 2010. View Article : Google Scholar : PubMed/NCBI
|
|
16
|
Hu L, Zhu M, Shen Y, Zhong Z and Wu B: The
prognostic value of intratumoral and peritumoral tumor-infiltrating
FoxP3+Treg cells in of pancreatic adenocarcinoma: A meta-analysis.
World J Surg Oncol. 19:3002021. View Article : Google Scholar : PubMed/NCBI
|
|
17
|
Thompson RH, Dong H, Lohse CM, Leibovich
BC, Blute ML, Cheville JC and Kwon ED: PD-1 is expressed by
tumor-infiltrating immune cells and is associated with poor outcome
for patients with renal cell carcinoma. Clin Cancer Res.
13:1757–1761. 2007. View Article : Google Scholar : PubMed/NCBI
|
|
18
|
Ahmadzadeh M, Johnson LA, Heemskerk B,
Wunderlich JR, Dudley ME, White DE and Rosenberg SA: Tumor
antigen-specific CD8 T cells infiltrating the tumor express high
levels of PD-1 and are functionally impaired. Blood. 114:1537–1544.
2009. View Article : Google Scholar : PubMed/NCBI
|
|
19
|
Nomi T, Sho M, Akahori T, Hamada K, Kubo
A, Kanehiro H, Nakamura S, Enomoto K, Yagita H, Azuma M and
Nakajima Y: Clinical significance and therapeutic potential of the
programmed death-1 ligand/programmed death-1 pathway in human
pancreatic cancer. Clin Cancer Res. 13:2151–2157. 2007. View Article : Google Scholar : PubMed/NCBI
|
|
20
|
Court CM and Hines OJ: The new American
joint committee on cancer TNM staging system for pancreatic
cancer-balancing usefulness with prognostication. JAMA Surg.
153:e1836292018. View Article : Google Scholar : PubMed/NCBI
|
|
21
|
Wang X, Teng F, Kong L and Yu J: PD-L1
expression in human cancers and its association with clinical
outcomes. Onco Targets Ther. 12:5023–5039. 2016.PubMed/NCBI
|
|
22
|
Shi F, Shi M, Zeng Z, Qi RZ, Liu ZW, Zhang
JY, Yang YP, Tien P and Wang FS: PD-1 and PD-L1 upregulation
promotes CD8(+) T-cell apoptosis and postoperative recurrence in
hepatocellular carcinoma patients. Int J Cancer. 128:887–896. 2011.
View Article : Google Scholar : PubMed/NCBI
|
|
23
|
Ino Y, Yamazaki-Itoh R, Shimada K, Iwasaki
M, Kosuge T, Kanai Y and Hiraoka N: Immune cell infiltration as an
indicator of the immune microenvironment of pancreatic cancer. Br J
Cancer. 108:914–923. 2013. View Article : Google Scholar : PubMed/NCBI
|
|
24
|
Reading JL, Gálvez-Cancino F, Swanton C,
Lladser A, Peggs KS and Quezada SA: The function and dysfunction of
memory CD8+ T cells in tumor immunity. Immunol Rev.
283:194–212. 2018. View Article : Google Scholar : PubMed/NCBI
|
|
25
|
Shrihari TG: Innate and adaptive immune
cells in Tumor microenvironment. Gulf J Oncolog. 1:77–81. 2021.
|
|
26
|
Tang Y, Xu X, Guo S, Zhang C, Tang Y, Tian
Y, Ni B, Lu B and Wang H: An increased abundance of
tumor-infiltrating regulatory T cells is correlated with the
progression and prognosis of pancreatic ductal adenocarcinoma. PLoS
One. 9:e915512014. View Article : Google Scholar : PubMed/NCBI
|
|
27
|
Masugi Y, Abe T, Ueno A, Fujii-Nishimura
Y, Ojima H, Endo Y, Fujita Y, Kitago M, Shinoda M, Kitagawa Y and
Sakamoto M: Characterization of spatial distribution of
tumor-infiltrating CD8+ T cells refines their prognostic
utility for pancreatic cancer survival. Mod Pathol. 32:1495–1507.
2019. View Article : Google Scholar : PubMed/NCBI
|
|
28
|
Karakhanova S, Ryschich E, Mosl B, Harig
S, Jäger D, Schmidt J, Hartwig W, Werner J and Bazhin AV:
Prognostic and predictive value of immunological parameters for
chemoradioimmunotherapy in patients with pancreatic adenocarcinoma.
Br J Cancer. 112:1027–1036. 2015. View Article : Google Scholar : PubMed/NCBI
|
|
29
|
de Vos van Steenwijk PJ, Ramwadhdoebe TH,
Goedemans R, Doorduijn EM, van Ham JJ, Gorter A, van Hall T,
Kuijjer ML, van Poelgeest MI, van der Burg SH and Jordanova ES:
Tumor-infiltrating CD14-positive myeloid cells and CD8-positive
T-cells prolong survival in patients with cervical carcinoma. Int J
Cancer. 133:2884–2894. 2013.PubMed/NCBI
|
|
30
|
Preston CC, Maurer MJ, Oberg AL, Visscher
DW, Kalli KR, Hartmann LC, Goode EL and Knutson KL: The ratios of
CD8+ T cells to CD4+CD25+
FOXP3+ and FOXP3-T cells correlate with poor clinical
outcome in human serous ovarian cancer. PLoS One. 8:e800632013.
View Article : Google Scholar : PubMed/NCBI
|
|
31
|
Timperi E, Pacella I, Schinzari V,
Focaccetti C, Sacco L, Farelli F, Caronna R, Del Bene G, Longo F,
Ciardi A, et al: Regulatory T cells with multiple suppressive and
potentially pro-tumor activities accumulate in human colorectal
cancer. Oncoimmunology. 5:e11758002016. View Article : Google Scholar : PubMed/NCBI
|
|
32
|
Revilla SA, Kranenburg O and Coffer PJ:
Colorectal cancer-infiltrating regulatory T cells: Functional
heterogeneity, metabolic adaptation, and therapeutic targeting.
Front Immunol. 13:9035642022. View Article : Google Scholar : PubMed/NCBI
|
|
33
|
Itahashi K, Irie T and Nishikawa H:
Regulatory T-cell development in the tumor microenvironment. Eur J
Immunol. 52:1216–1227. 2022. View Article : Google Scholar : PubMed/NCBI
|
|
34
|
Zhang Y, Lazarus J, Steele NG, Yan W, Lee
HJ, Nwosu ZC, Halbrook CJ, Menjivar RE, Kemp SB and Sirihorachai
VR: Regulatory T-cell depletion alters the tumor microenvironment
and accelerates pancreatic carcinogenesis. Cancer Discov.
10:422–439. 2020. View Article : Google Scholar : PubMed/NCBI
|
|
35
|
Saka D, Gökalp M, Piyade B, Cevik NC,
Sever EA, Unutmaz D, Ceyhan GO, Demir IE and Asimgil H: Mechanisms
of T-cell exhaustion in pancreatic cancer. Cancers (Basel).
12:22742020. View Article : Google Scholar : PubMed/NCBI
|
|
36
|
Kampan NC, Madondo MT, McNally OM,
Stephens AN, Quinn MA and Plebanski M: Interleukin 6 present in
inflammatory ascites from advanced epithelial ovarian cancer
patients promotes tumor necrosis factor receptor 2-expressing
regulatory T cells. Front Immunol. 8:14822017. View Article : Google Scholar : PubMed/NCBI
|
|
37
|
Woo EY, Chu CS, Goletz TJ, Schlienger K,
Yeh H, Coukos G, Rubin SC, Kaiser LR and June CH: Regulatory
CD4(+)CD25(+) T cells in tumors from patients with early-stage
non-small cell lung cancer and late-stage ovarian cancer. Cancer
Res. 61:4766–4772. 2001.PubMed/NCBI
|
|
38
|
Jiang Y, Du Z, Yang F, Di Y, Li J, Zhou Z,
Pillarisetty VG and Fu D: FOXP3+ lymphocyte density in pancreatic
cancer correlates with lymph node metastasis. PLoS One.
9:e1067412014. View Article : Google Scholar : PubMed/NCBI
|
|
39
|
Liu L, Zhao G, Wu W, Rong Y, Jin D, Wang
D, Lou W and Qin X: Low intratumoral regulatory T cells and high
peritumoral CD8(+) T cells relate to long-term survival in patients
with pancreatic ductal adenocarcinoma after pancreatectomy. Cancer
Immunol Immunother. 65:73–82. 2016. View Article : Google Scholar : PubMed/NCBI
|
|
40
|
Steele NG, Carpenter ES, Kemp SB,
Sirihorachai VR, The S, Delrosario L, Lazarus J, Amir ED, Gunchick
V, Espinoza C, et al: Multimodal mapping of the tumor and
peripheral blood immune landscape in human pancreatic cancer. Nat
Cancer. 1:1097–1112. 2020. View Article : Google Scholar : PubMed/NCBI
|
|
41
|
Schizas D, Charalampakis N, Kole C,
Economopoulou P, Koustas E, Gkotsis E, Ziogas D, Psyrri A and
Karamouzis MV: Immunotherapy for pancreatic cancer: A 2020 update.
Cancer Treat Rev. 86:1020162020. View Article : Google Scholar : PubMed/NCBI
|
|
42
|
Feng M, Xiong G, Cao Z, Yang G, Zheng S,
Song X, You L, Zheng L, Zhang T and Zhao Y: PD-1/PD-L1 and
immunotherapy for pancreatic cancer. Cancer Lett. 407:57–65. 2017.
View Article : Google Scholar : PubMed/NCBI
|
|
43
|
Liang X, Sun J, Wu H, Luo Y, Wang L, Lu J,
Zhang Z, Guo J, Liang Z and Liu T: PD-L1 in pancreatic ductal
adenocarcinoma: A retrospective analysis of 373 Chinese patients
using an in vitro diagnostic assay. Diagn Pathol. 13:52018.
View Article : Google Scholar : PubMed/NCBI
|
|
44
|
Ishida Y, Agata Y, Shibahara K and Honjo
T: Induced expression of PD-1, a novel member of the immunoglobulin
gene superfamily, upon programmed cell death. EMBO J. 11:3887–3895.
1992. View Article : Google Scholar : PubMed/NCBI
|
|
45
|
Ishida M, Iwai Y, Tanaka Y, Okazaki T,
Freeman GJ, Minato N and Honjo T: Differential expression of PD-L1
and PD-L2, ligands for an inhibitory receptor PD-1, in the cells of
lymphohematopoietic tissues. Immunol Lett. 84:57–62. 2002.
View Article : Google Scholar : PubMed/NCBI
|
|
46
|
Eppihimer MJ, Gunn J, Freeman GJ,
Greenfield EA, Chernova T, Erickson J and Leonard JP: Expression
and regulation of the PD-L1 immunoinhibitory molecule on
microvascular endothelial cells. Microcirculation. 9:133–145. 2002.
View Article : Google Scholar : PubMed/NCBI
|
|
47
|
Zhou WY, Zhang MM, Liu C, Kang Y, Wang JO
and Yang XH: Long noncoding RNA LINC00473 drives the progression of
pancreatic cancer via upregulating programmed death-ligand 1 by
sponging microRNA-195-5p. J Cell Physiol. 234:23176–23189. 2019.
View Article : Google Scholar : PubMed/NCBI
|
|
48
|
Lee A, Lim S, Oh J, Lim J, Yang Y, Lee MS
and Lim JS: NDRG2 expression in breast cancer cells downregulates
PD-L1 expression and restores T cell proliferation in
tumor-coculture. Cancers (Basel). 13:61122021. View Article : Google Scholar : PubMed/NCBI
|
|
49
|
Que Y, Xiao W, Guan YX, Liang Y, Yan SM,
Chen HY, Li QQ, Xu BS, Zhou ZW and Zhang X: PD-L1 expression is
associated with FOXP3+ regulatory T-cell infiltration of soft
tissue sarcoma and poor patient prognosis. J Cancer. 8:2018–2025.
2017. View Article : Google Scholar : PubMed/NCBI
|
|
50
|
Chen JX, Yi XJ, Gao SX and Sun JX: The
possible regulatory effect of the PD-1/PD-L1 signaling pathway on
Tregs in ovarian cancer. Gen Physiol Biophys. 39:319–330. 2020.
View Article : Google Scholar : PubMed/NCBI
|
|
51
|
Wang Y, Lin J, Cui J, Han T, Jiao F, Meng
Z and Wang L: Prognostic value and clinicopathological features of
PD-1/PD-L1 expression with mismatch repair status and desmoplastic
stroma in Chinese patients with pancreatic cancer. Oncotarget.
8:9354–9365. 2017. View Article : Google Scholar : PubMed/NCBI
|
|
52
|
Velcheti V, Schalper KA, Carvajal DE,
Anagnostou VK, Syrigos KN, Sznol M, Herbst RS, Gettinger SN, Chen L
and Rimm DL: Programmed death ligand-1 expression in non-small cell
lung cancer. Lab Invest. 94:107–116. 2014. View Article : Google Scholar : PubMed/NCBI
|
|
53
|
Soliman H, Khalil F and Antonia S: PD-L1
expression is increased in a subset of basal type breast cancer
cells. PLoS One. 9:e885572014. View Article : Google Scholar : PubMed/NCBI
|
|
54
|
Danilova L, Ho WJ, Zhu Q, Vithayathil T,
De Jesus-Acosta A, Azad NS, Laheru DA, Fertig EJ, Anders R, Jaffee
EM and Yarchoan M: Programmed cell death ligand-1 (PD-L1) and CD8
expression profiling identify an immunologic subtype of pancreatic
ductal adenocarcinomas with favorable survival. Cancer Immunol Res.
7:886–895. 2019. View Article : Google Scholar : PubMed/NCBI
|


