Introduction
Glioma is the most commonly occurring primary
malignant brain tumor, with a frequency of 80% of all malignant
brain cancers (1). The World Health
Organization classifies gliomas into grades I–IV, of which grades I
and II are defined as low-grade gliomas (LGGs) and grades III and
IV as high-grade gliomas (HGGs) (1). LGGs have a long survival period,
whereas HGGs are highly aggressive and have a poor prognosis
(2). Most gliomas are treated with
surgery, and HGGs often require adjuvant radiation therapy or
chemotherapy after surgery to prevent short-term recurrence,
whereas LGGs require close observation (3). Therefore, it is important to
accurately grade tumors prior to surgery. Pathology is currently
the gold standard for glioma grading; however, it is an invasive
method and usually performed postoperatively. A growing body of
research has focused on noninvasive methods for accurate tumor
grading.
Magnetic resonance imaging (MRI) is an important
method for the diagnosis of gliomas, and a variety of MRI
techniques, including magnetic resonance spectroscopy (MRS),
diffusion-weighted imaging (DWI) and pulse-weighted imaging, are
used to grade gliomas (4,5). Diagnostic imaging relies heavily on
the subjective experience the radiologist has with imaging data. By
contrast, radiomics involves the transformation of medical images
into quantitative, extractable and high-dimensional data, which
include histograms, texture features and shape features (6). Radiomics has been primarily used in
tumor research and has gradually become a tool for the extraction
of diagnostic and prognostic information from conventional images.
There has been a considerable amount of research on the association
between MRI radiomics and lesion features, survival and
perioperative outcomes in various malignancies (7). However, no clear conclusions have yet
been reached regarding the accuracy of MRI radiomics in
distinguishing HGG from LGG. Therefore, MRI radiomics has not been
widely used in clinical practice. To the best of our knowledge, the
present study is the first meta-analysis to examine the diagnostic
value of MRI radiomics in the differentiation of HGG from LGG to
guide the clinical diagnosis of glioma.
Materials and methods
Literature inclusion and exclusion
criteria
The inclusion criteria were as follows: i)
Retrospective or prospective studies evaluating the efficacy of
radiomics in differentiating between LGG and HGG; ii) use of
histopathology as the gold standard; and iii) the true-positive
(TP), true-negative (TN), false-positive (FP) and false-negative
(FN) values were either stated directly or could be indirectly
extracted from the retrieved literature.
The exclusion criteria were as follows: i) small
sample size (n<10), animal experiments, reviews, systematic
reviews, case reports and conference papers; ii) studies for which
no data were available; and iii) duplicate reports or studies based
on the same data.
Search strategy
PubMed (https://pubmed.ncbi.nlm.nih.gov/), Embase (https://www.embase.com/) and the Cochrane Library
(https://www.cochranelibrary.com/) were
used in this meta-analysis. They were searched between their
formation and November 2022. The search terms were: (‘glioma’ OR
‘gliomas’) AND (‘radiomics’ OR ‘texture features’ OR ‘texture
analysis’ OR ‘histogram’) AND (‘magnetic resonance imaging’ OR
‘magnetic resonance image’ OR ‘MRI’).
Literature screening and data
extraction
Two researchers conducted the literature search,
screened the literature and extracted relevant materials. When
questions or conflicts arose, a third individual was consulted
prior to a decision being made. The data extraction content
included the author, year of publication, sample size, sex, age and
the values of TP, FP, TN and FN used in the differentiation of HGG
from LGG and the definition of HGG as positive and LGG as negative.
If no TP, FP, TN or FN results were reported, data such as
sensitivity, specificity and positive and negative predictive
values were subjected to retrograde extrapolation to calculate
these results.
Literature quality assessment
The QUADAS-2 tool for evaluating the quality of
published literature (8) was used
separately by two academics, and RevMan 5.3 (Cochrane) was used to
construct a quality evaluation map.
Data synthesis and statistical
analysis
The Cochran Q test and I2 value were used
to investigate heterogeneity among studies, and meta-analyses were
performed using a random-effects model when significant
heterogeneity was identified (I2>50%, P<0.05) and
a fixed-effects model when no significant heterogeneity was
detected. Sensitivity analysis was performed by eliminating each
included study one by one, and performing a summary analysis of the
remaining studies. The ROC curve is plotted with sensitivity as the
vertical coordinate and (1-specificity) as the horizontal
coordinate. The larger the area under the curve (AUC), the higher
the diagnostic accuracy. AUC values were calculated and were
considered to indicate the following: 0.5<AUC≤0.6, ineffective;
0.6<AUC≤0.7, poor; 0.7<AUC≤0.8, average; 0.8<AUC≤0.9,
good; and 0.9<AUC≤1.0, excellent. A Deeks' funnel plot was
generated using Stata 15.1 software (StataCorp LP) to assess
publication bias.
Results
Literature search
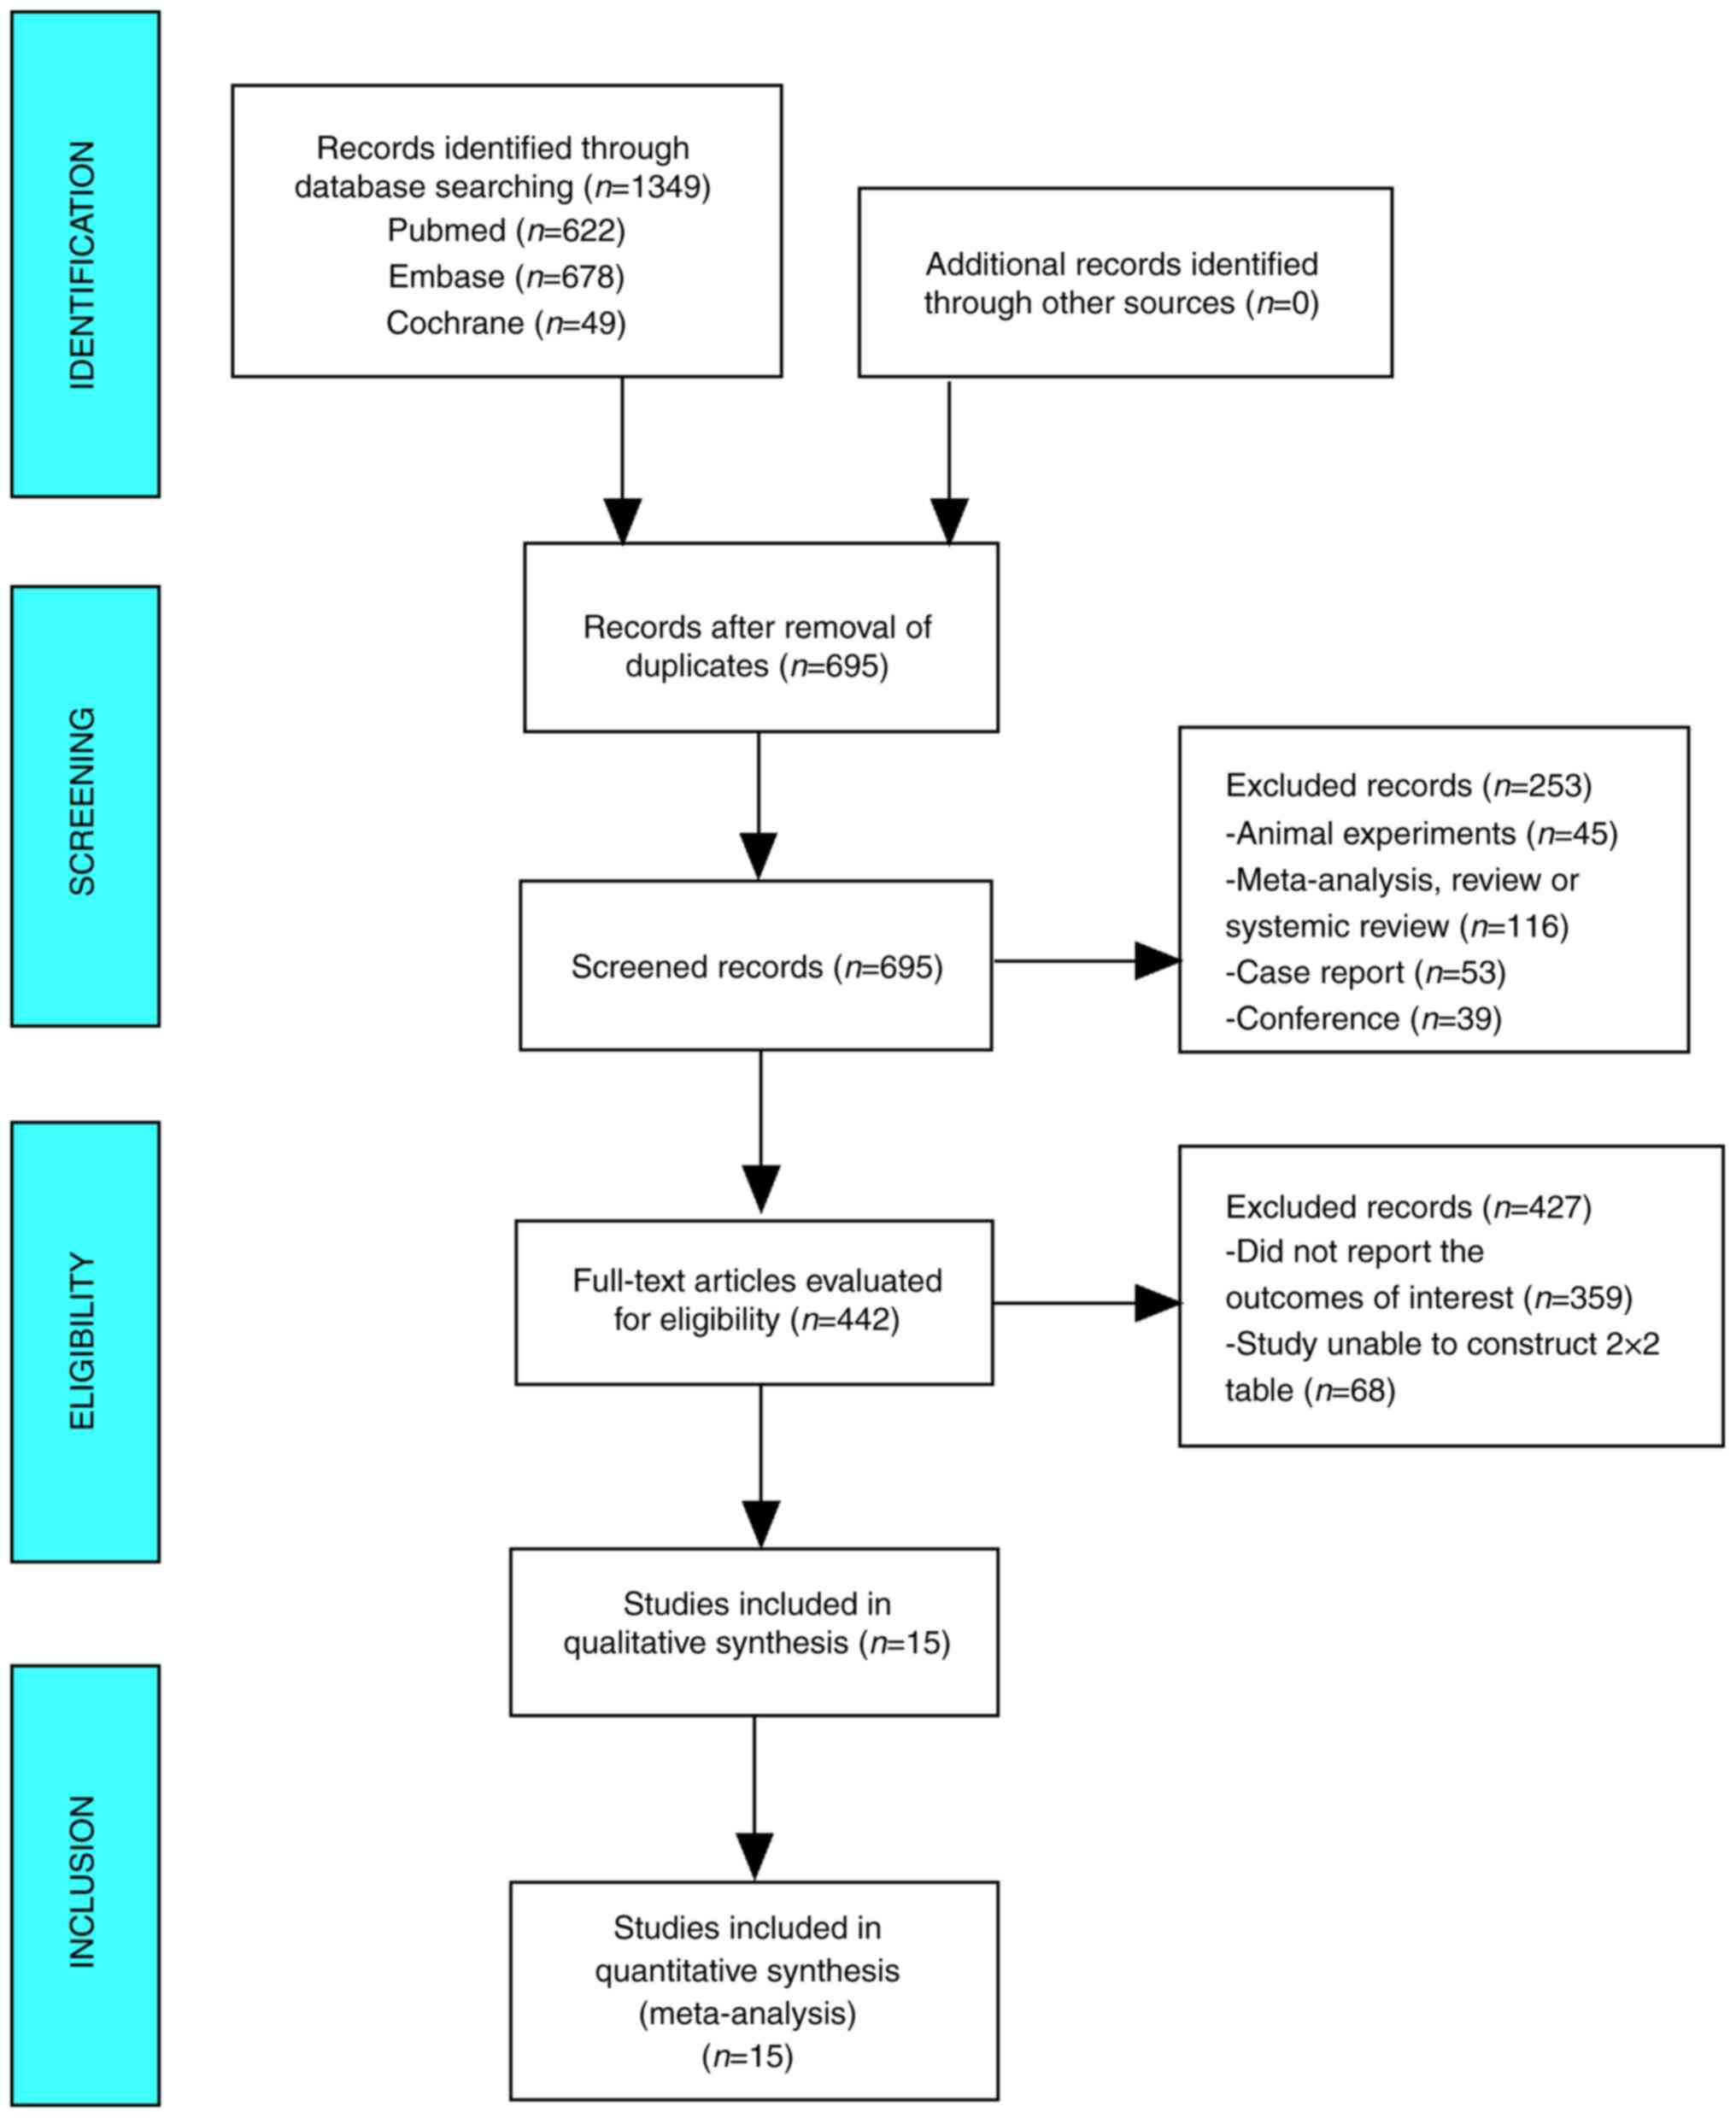
The database yielded 1,349 studies on this topic
which were reduced to 695 following the exclusion of duplicates. Of
these, 442 studies were selected after the examination of titles
and abstracts indicated studies that included animal experiments
(n=45), or were meta-analyses, reviews, systemic reviews (n=116),
case reports (n=53) or conference reports (n=39). After reading the
full text, 359 studies that did not report the outcomes of interest
and 68 studies for which it was not possible to construct 2×2
tables were excluded. Finally, 15 papers that were read in their
entirety were subjected to meta-analysis (Fig. 1).
Baseline characteristics and quality assessment
of the included studies
Baseline characteristics
The 15 publications evaluated in the present
meta-analysis included a total of 1,124 patients, of which 701 had
HGG and 423 had LGG. The age of the patients in the HGG group
ranged from 43.0 to 66.0 years, while the age of the patients in
the LGG group ranged from 34.6 to 63.2 years, which was considered
comparable. Seven studies included patients from Asia, whereas the
remaining studies included patients from Europe and the USA
(Table I) (9–23).
 | Table I.Baseline characteristics of the
included studies. |
Table I.
Baseline characteristics of the
included studies.
|
|
| Sample size |
|
|
|
|
|
|
|
|
|
|---|
|
|
|
|
|
|
|
|
|
|
|
|
|
|---|
| First author/s,
year | Country | HGG | LGG | Age, years | Sex, male/female | TP | FP | FN | TN | Sensitivity (%) | Specificity (%) | (Refs.) |
|---|
| Law et al,
2007 | USA | 61 | 31 | 43.0 (4.0–85.0) | 61/31 | 58 | 4 | 3 | 27 | 95.1 | 87.0 | (9) |
| Jakab et al,
2011 | Hungary | 14 | 26 | HGG, 47.3±15.4; LGG,
34.6±15.9 | HGG, 5/9; LGG,
13/13 | 12 | 3 | 2 | 23 | 85.7 | 88.5 | (10) |
| Kang et al,
2011 | Korea | 21 | 6 | - | - | 18 | 0 | 3 | 6 | 85.7 | 100.0 | (11) |
| Kim et al,
2013 | Korea | 54 | 9 | - | - | 46 | 0 | 8 | 9 | 85.2 | 100.0 | (12) |
| Santarosa et
al, 2016 | Italy | 17 | 9 | 55.4
(22.0–79.0) | 15/11 | 17 | 0 | 0 | 9 | 100.0 | 100.0 | (13) |
| Skogen et
al, 2016 | Norway | 68 | 27 | HGG, 44.0 | - | 63 | 5 | 5 | 22 | 93.0 | 81.0 | (14) |
|
|
|
|
| (21.0–70.0); LGG,
56.0 (24.0–81.0) |
|
|
|
|
|
|
|
|
| Hsieh et al,
2017 | China | 34 | 73 | - | - | 33 | 6 | 1 | 67 | 97.0 | 92.0 | (15) |
| Cho and Park,
2017 | Korea | 54 | 54 | - | - | 48 | 5 | 6 | 49 | 89.0 | 91.0 | (16) |
| Bisdas et
al, 2018 | UK | 18 | 19 | 63.2±7.6 | 21/16 | 14 | 4 | 4 | 15 | 77.0 | 79.0 | (17) |
| Ditmer et
al, 2018 | USA | 80 | 14 | 52.0
(10.0–84.0) | 59/35 | 74 | 2 | 6 | 12 | 93.0 | 86.0 | (18) |
| Su et al,
2018 | China | 30 | 10 | - | - | 29 | 1 | 1 | 9 | 96.7 | 90.0 | (19) |
| Tian et al,
2018 | China | 111 | 42 | HGG, 51.2±13.3;
LGG, 39.0±13.2 | HGG, 63/48; LGG,
18/24 | 108 | 5 | 3 | 37 | 97.3 | 88.1 | (20) |
| Alis et al,
2020 | Turkey | 32 | 28 | HGG, 66.0 | - | 28 | 3 | 4 | 25 | 87.5 | 89.2 | (21) |
|
|
|
|
| (33.0–78.0); LGG,
46.0 (27.0–68.0) |
|
|
|
|
|
|
|
|
| Zhang et al,
2020 | China | 65 | 43 | HGG, 51.3
(21.0–78.0); LGG, 43.2 (24.0–66.0) | HGG, 36/29; LGG,
25/18 | 62 | 5 | 3 | 38 | 95.0 | 88.0 | (22) |
| Malik et al,
2021 | USA | 42 | 32 | HGG, 62.0
(46.0–79.0); LGG, 41.0 (22.0–71.0) | HGG, 28/14; LGG,
24/12 | 38 | 4 | 4 | 28 | 91.0 | 86.0 | (23) |
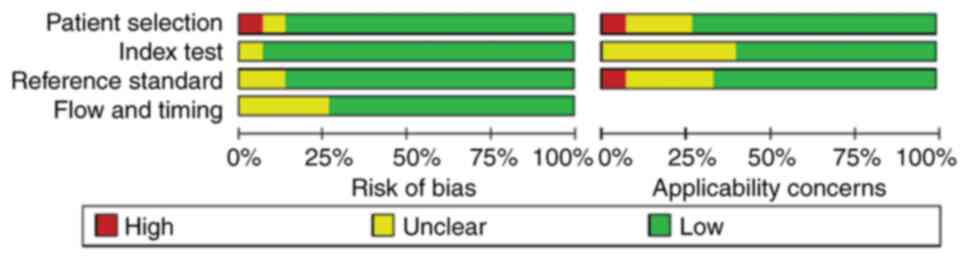
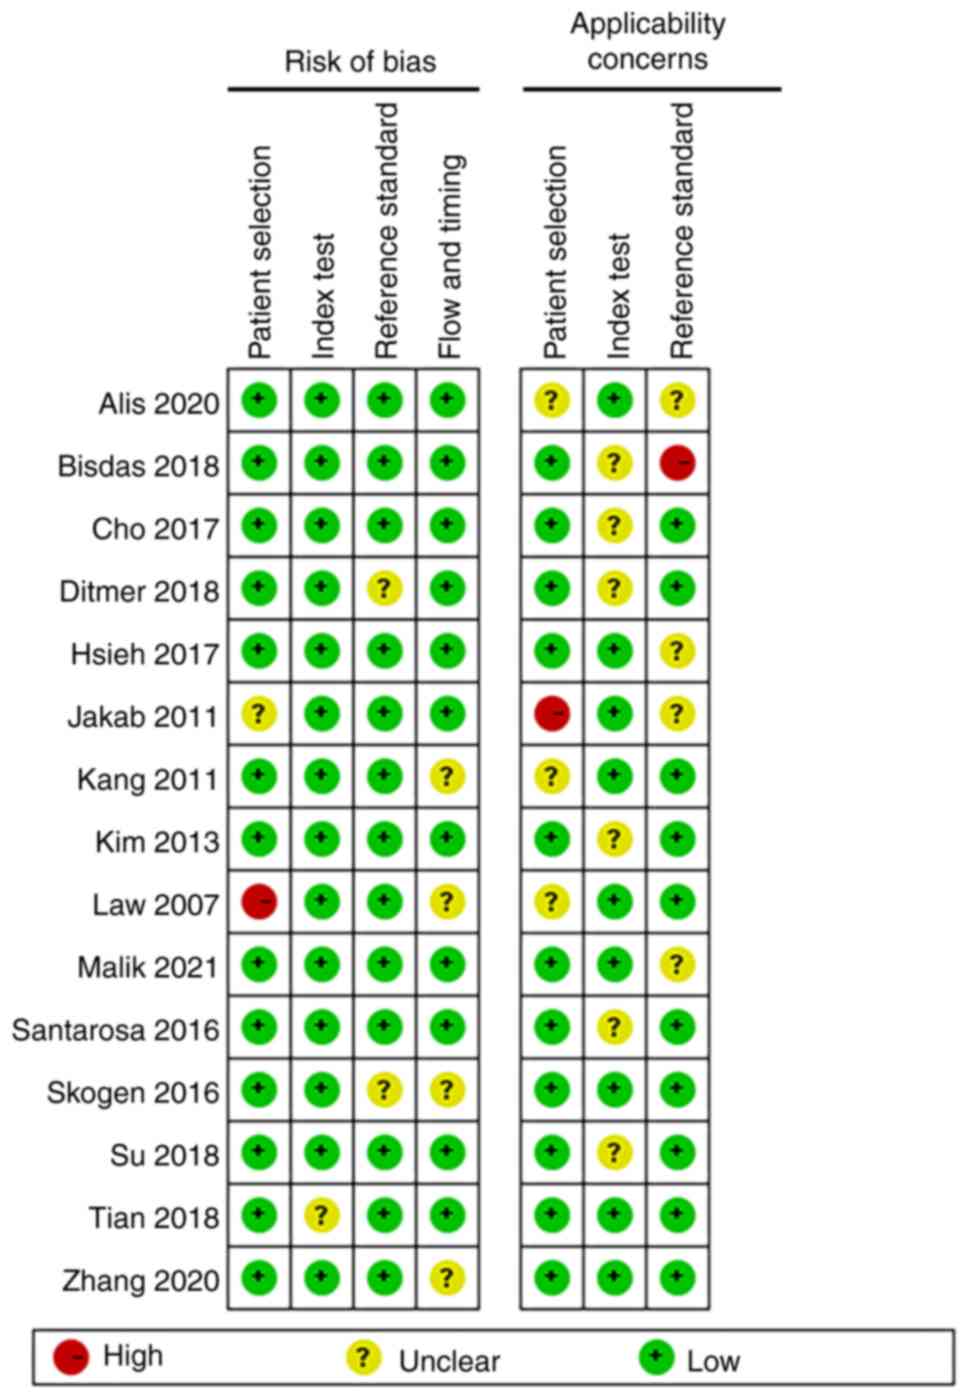
Quality assessment
In the assessment of patient selection, only one
study was found to have a high risk of bias and the remainder had
an unclear or low risk of bias. In the remaining three QUADAS-2
domains, namely index test, reference standard, flow and timing,
most studies were found to be of low risk. Patient selection, index
test and reference standard were also evaluated for applicability
concerns. With regard to the reference standard domain, one study
was high-risk and the rest were unclear or low risk. As for
applicability concern, only one study showed high risk in ‘patient
selection’ and no high risk in ‘index test’. Overall, the quality
of the studies included in this review was indicated to be
acceptable (Figs. 2 and 3).
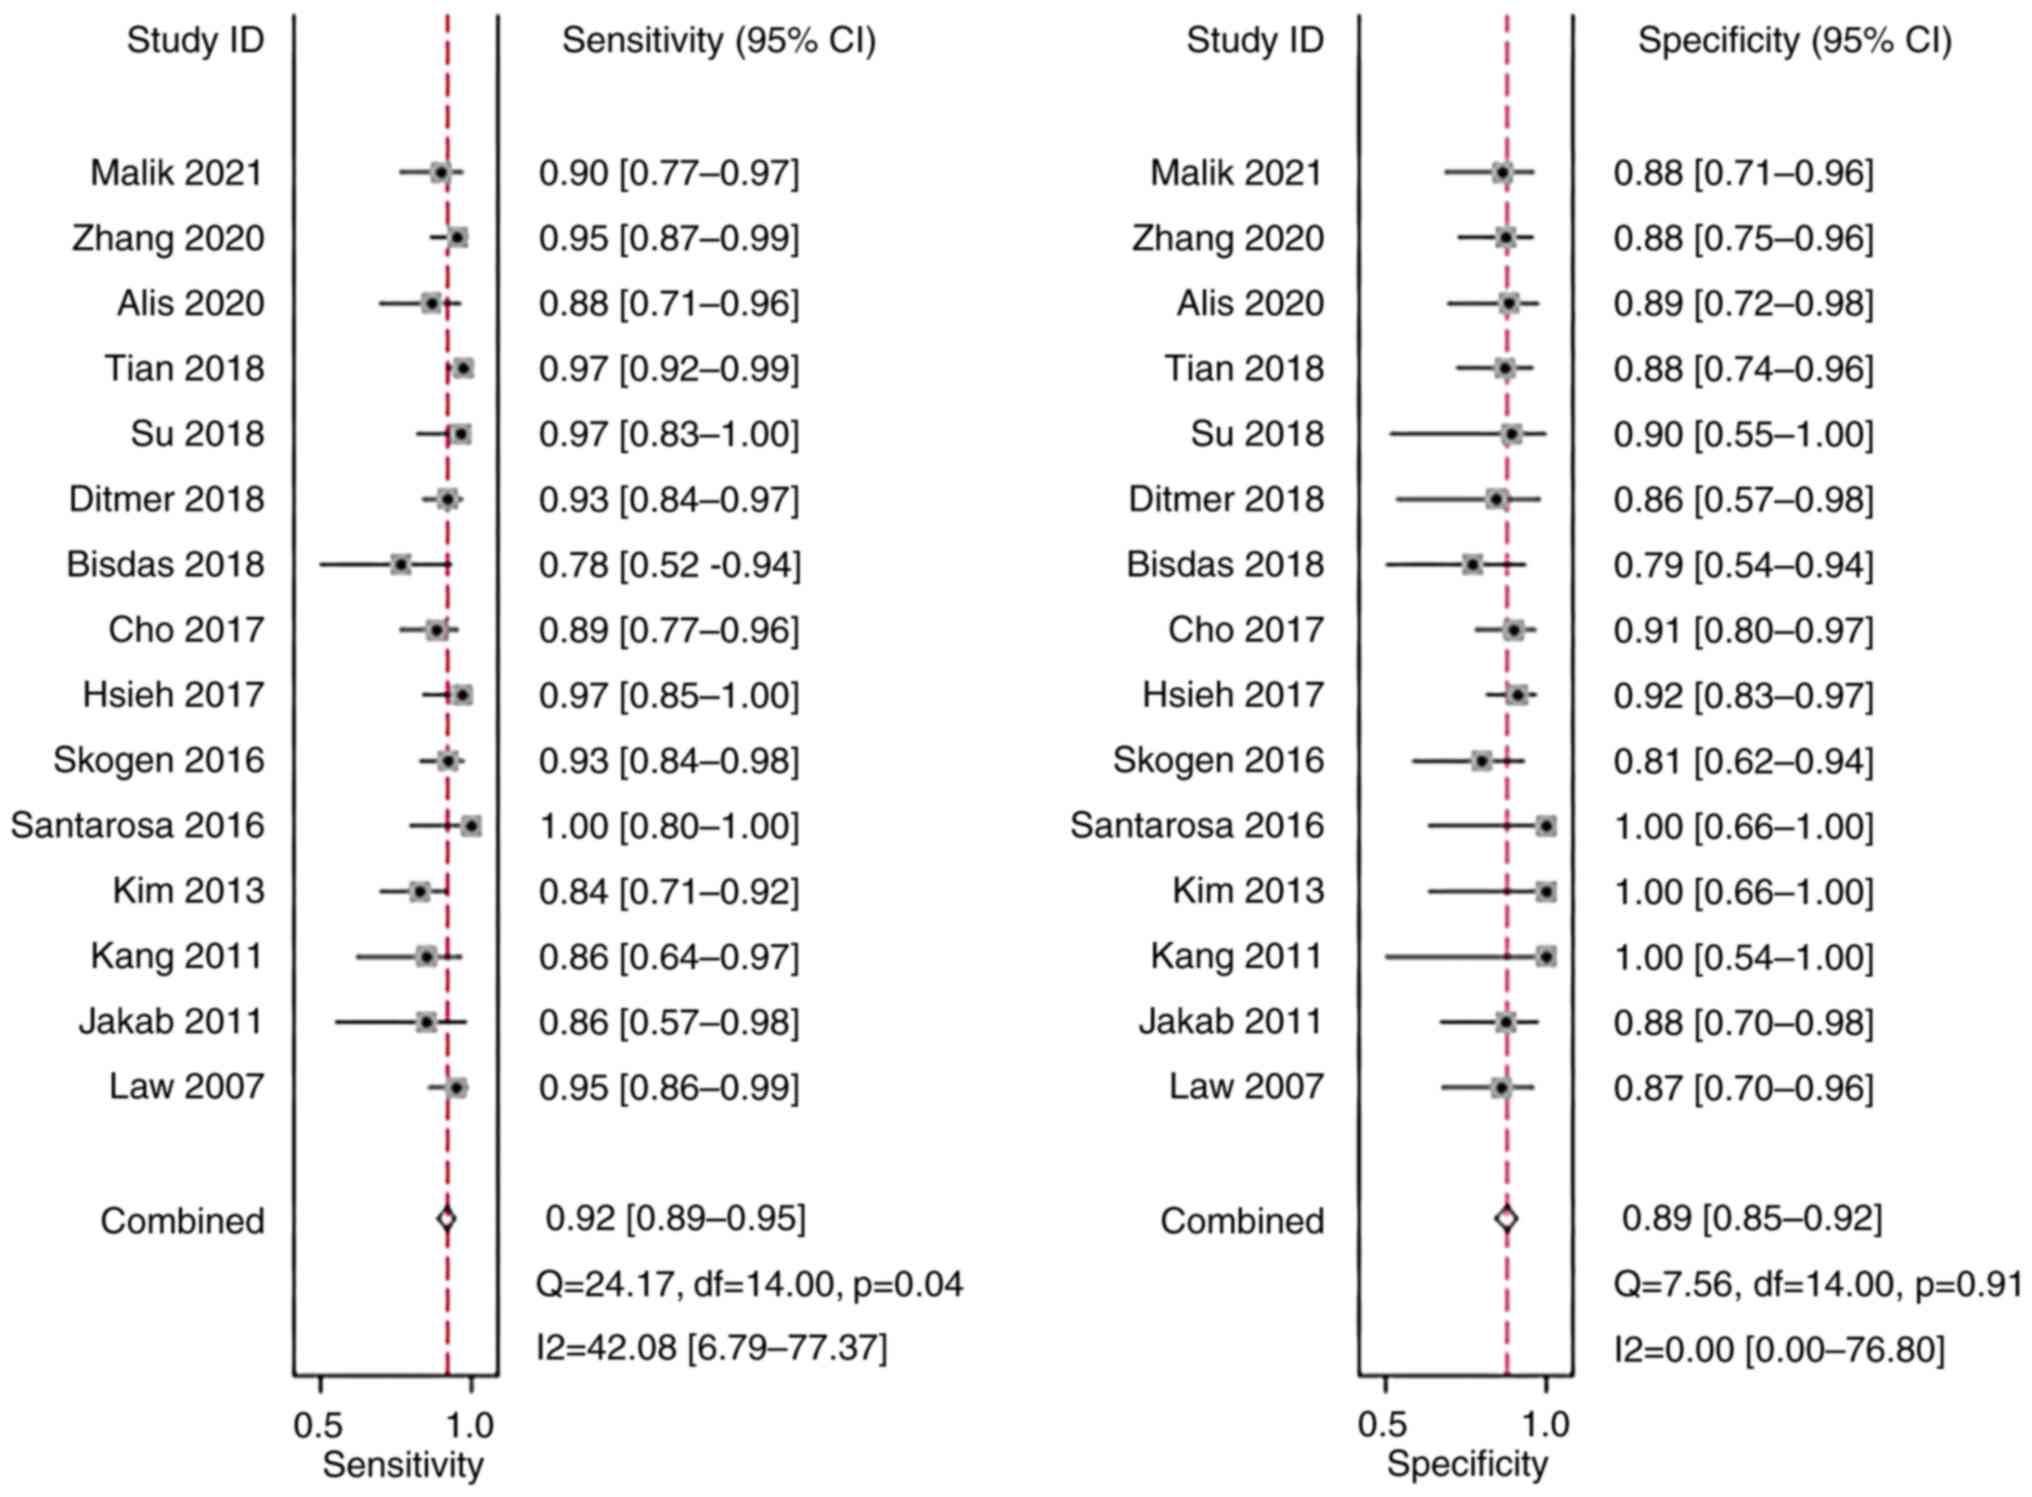
Sensitivity and specificity
A meta-analysis was performed using a fixed-effects
model due to the low heterogeneity in sensitivity
(I2=42.08%) and specificity (I2=0.00%). The
pooled sensitivity and specificity of the studies overall were 0.92
(95% CI: 0.89–0.95) and 0.89 (95% CI: 0.85–0.92), respectively
(Fig. 4).
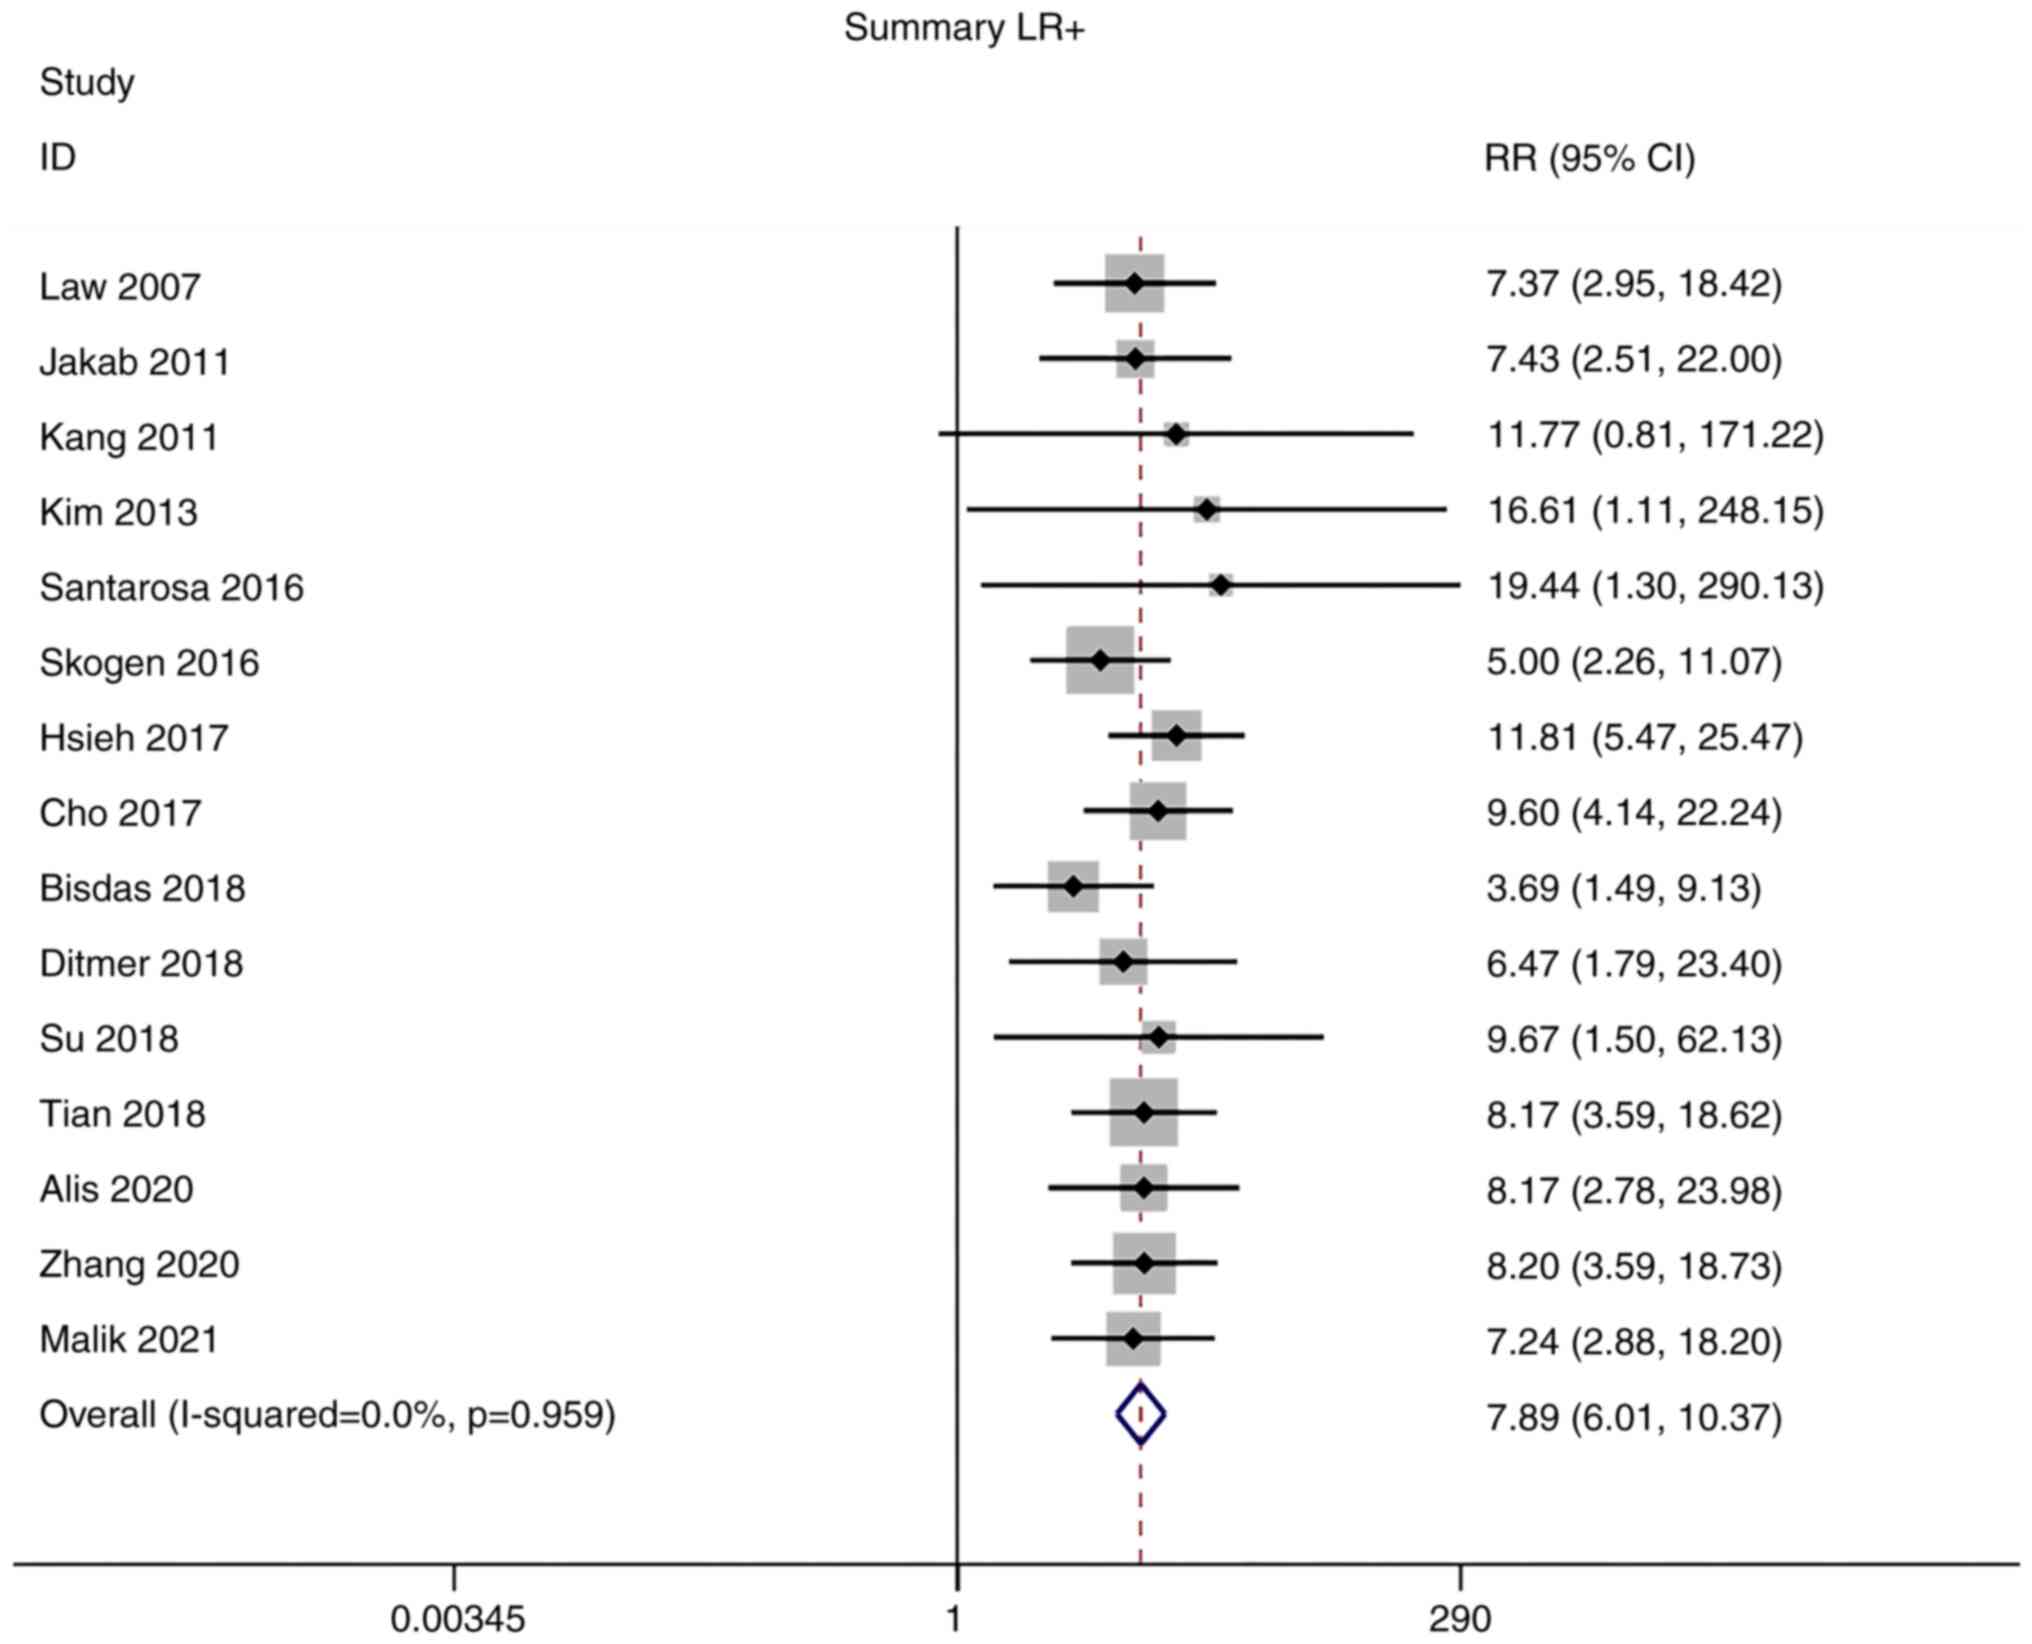
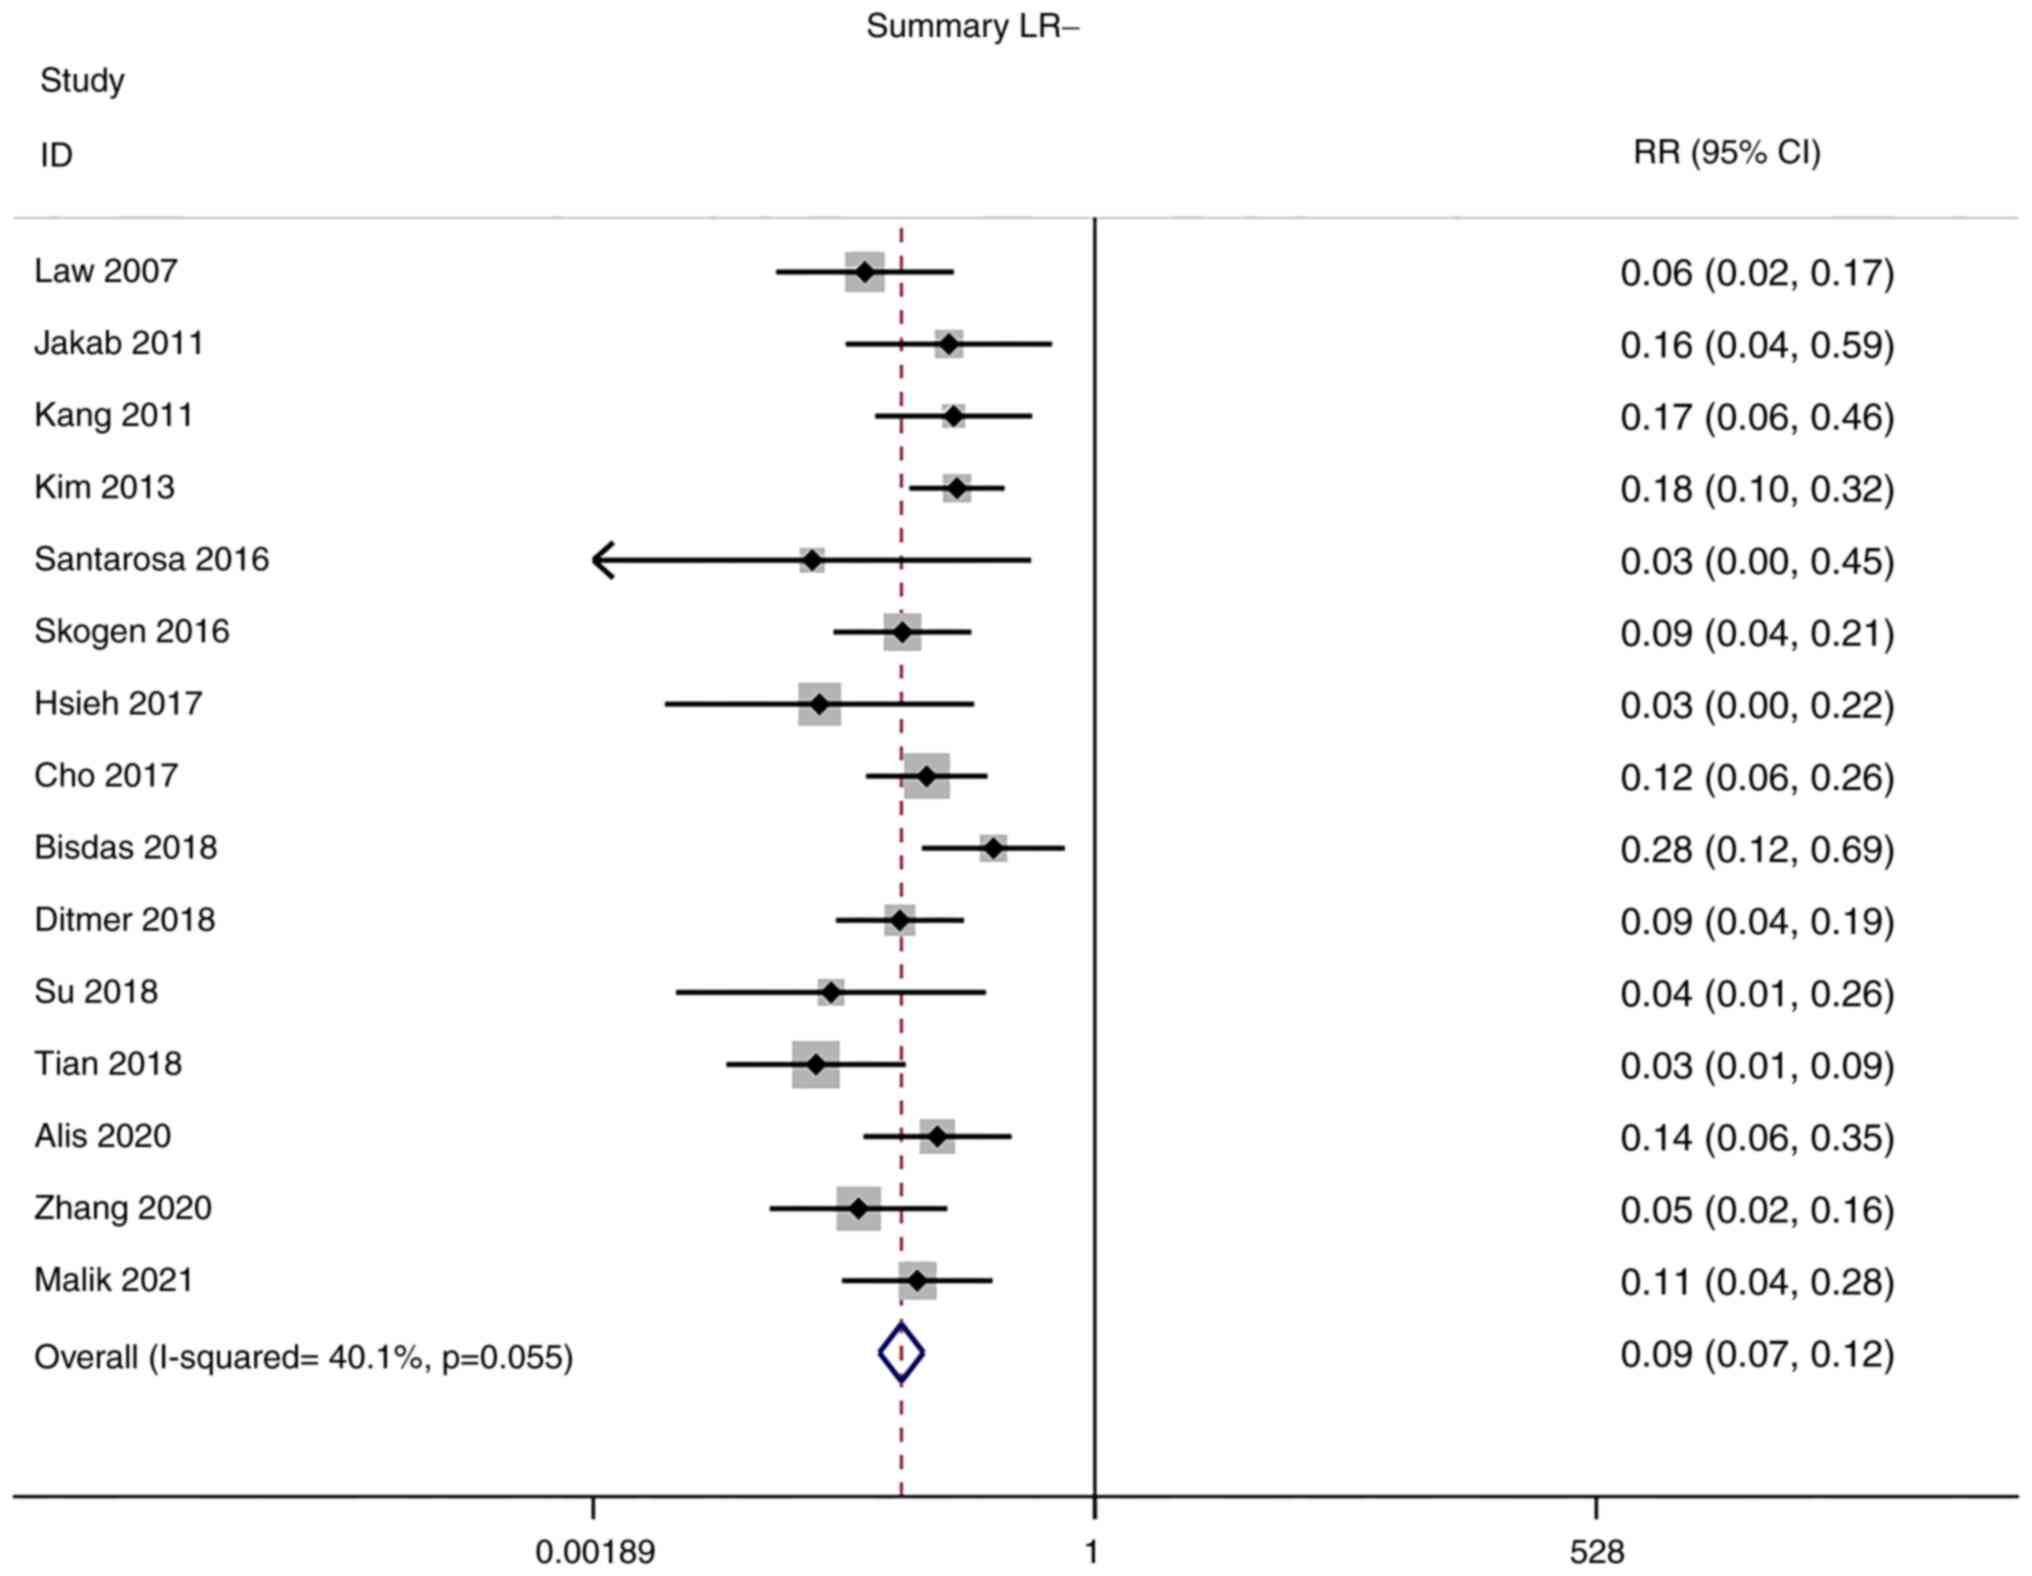
Positive and negative likelihood
ratios (LRs)
Owing to the low heterogeneity in positive LR
(I2=0.0%) and negative LR (I2=40.1%),
meta-analyses were performed using a fixed-effects model. The
pooled positive and negative LRs of the studies overall were 7.89
(95% CI: 6.01–10.37) and 0.09 (95% CI: 0.07–0.12), respectively
(Figs. 5 and 6).
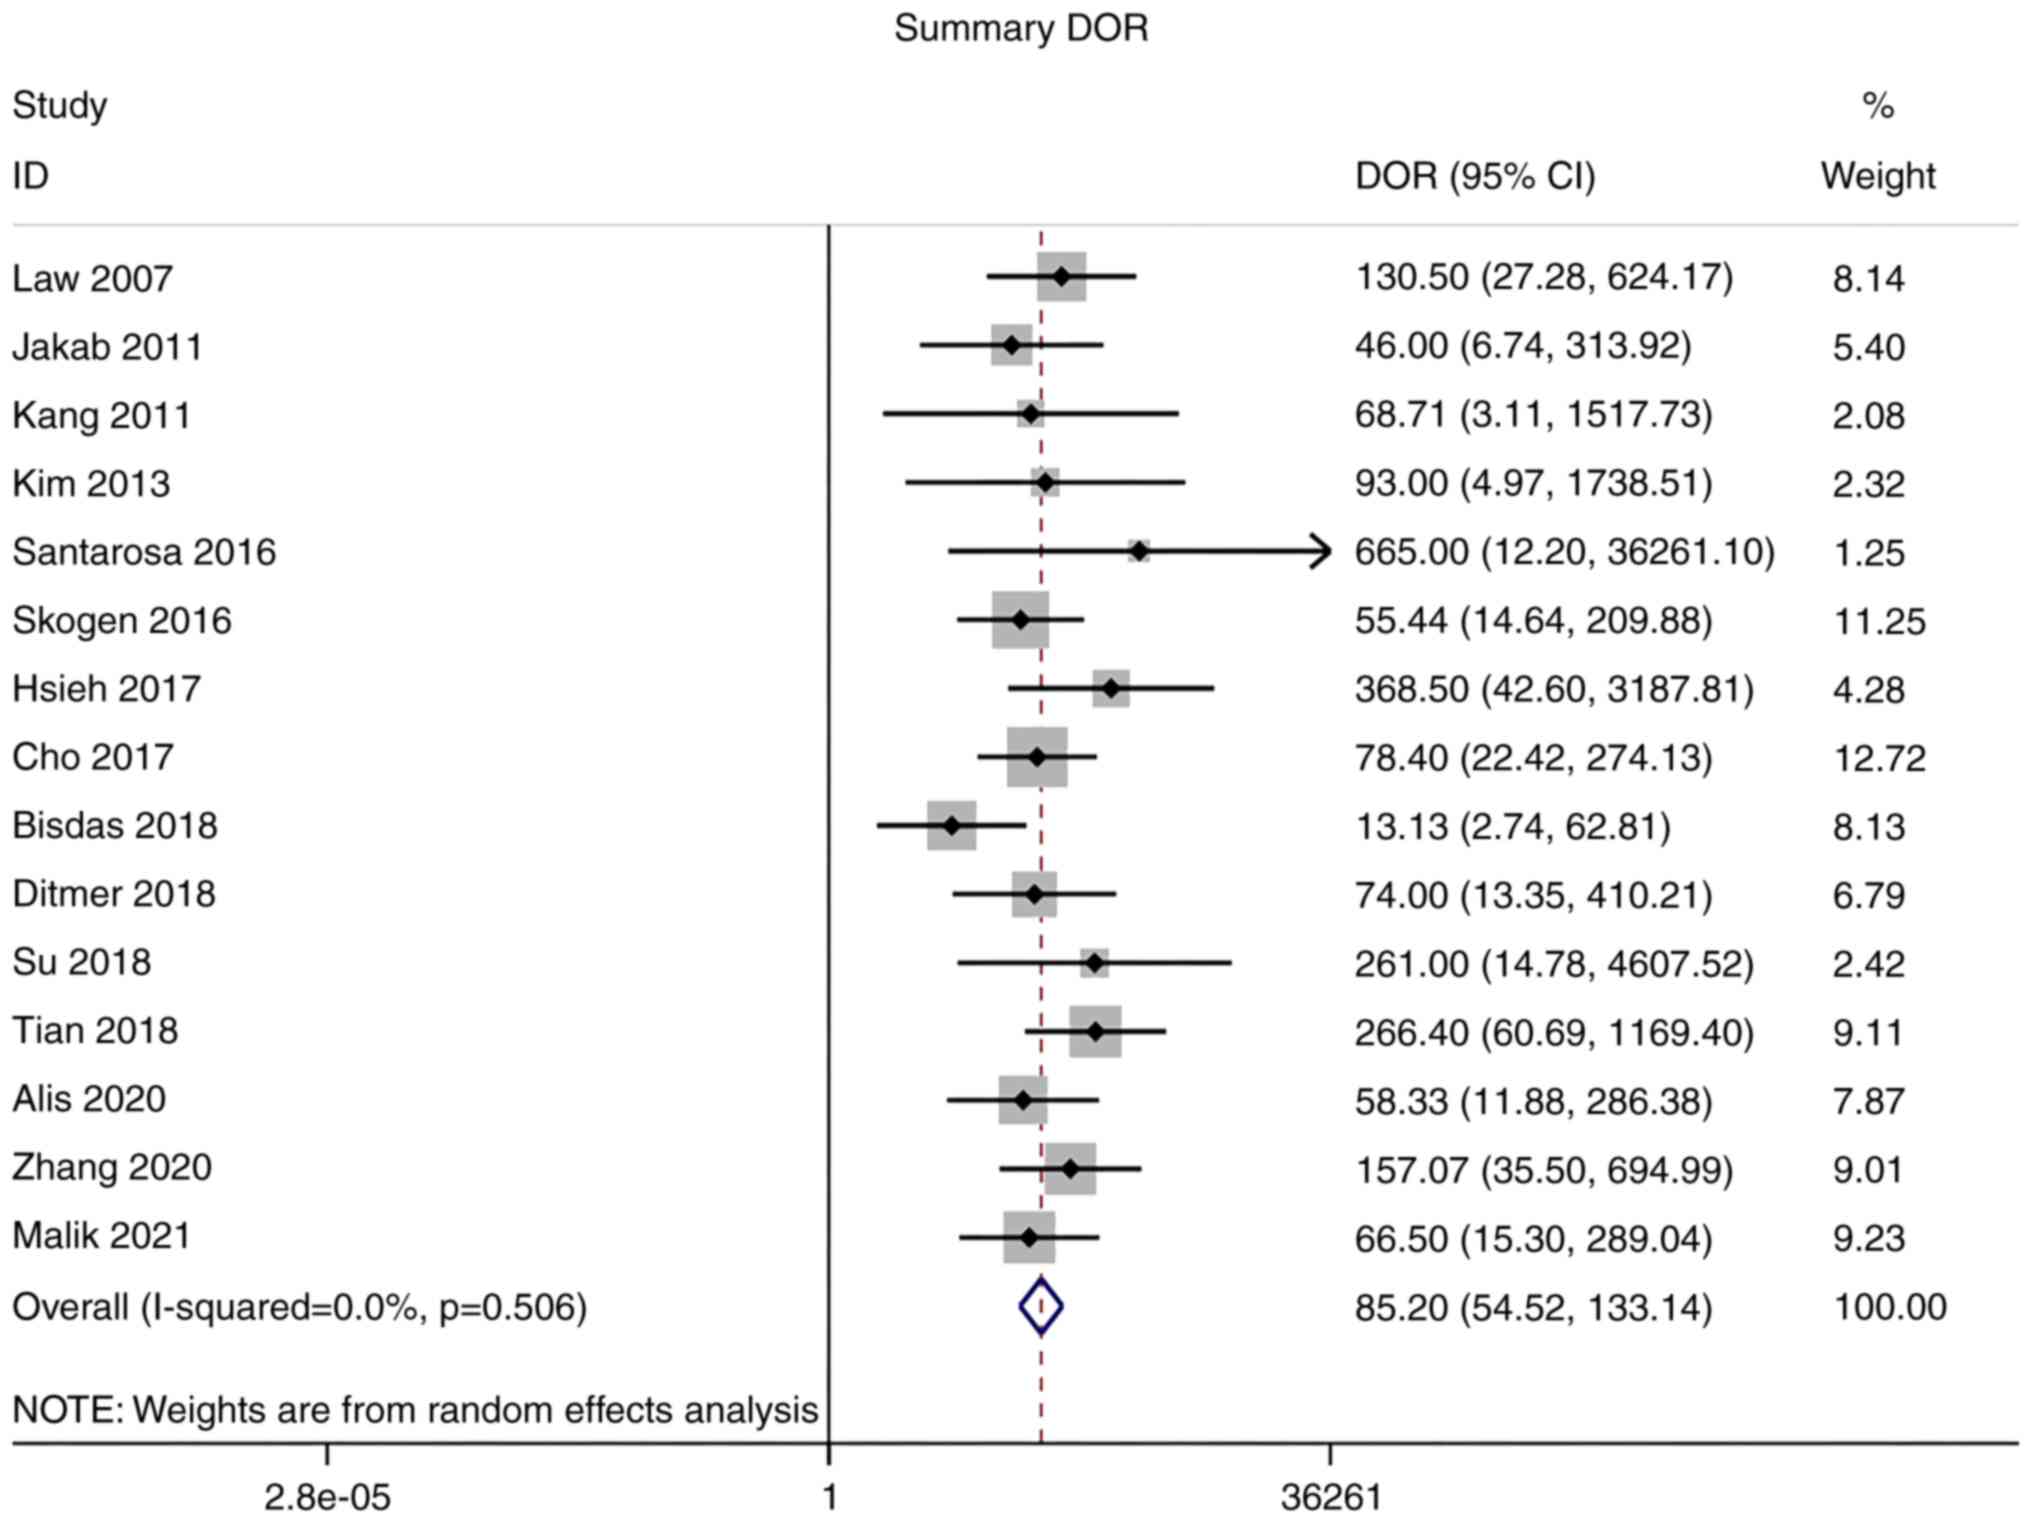
Diagnostic odds ratio (DOR)
As there was no significant heterogeneity in DOR
(I2=0.0%), a meta-analysis of DOR was conducted using a
fixed-effects model. The overall pooled DOR of the studies was
85.20 (95% CI: 54.52–133.14; Fig.
7).
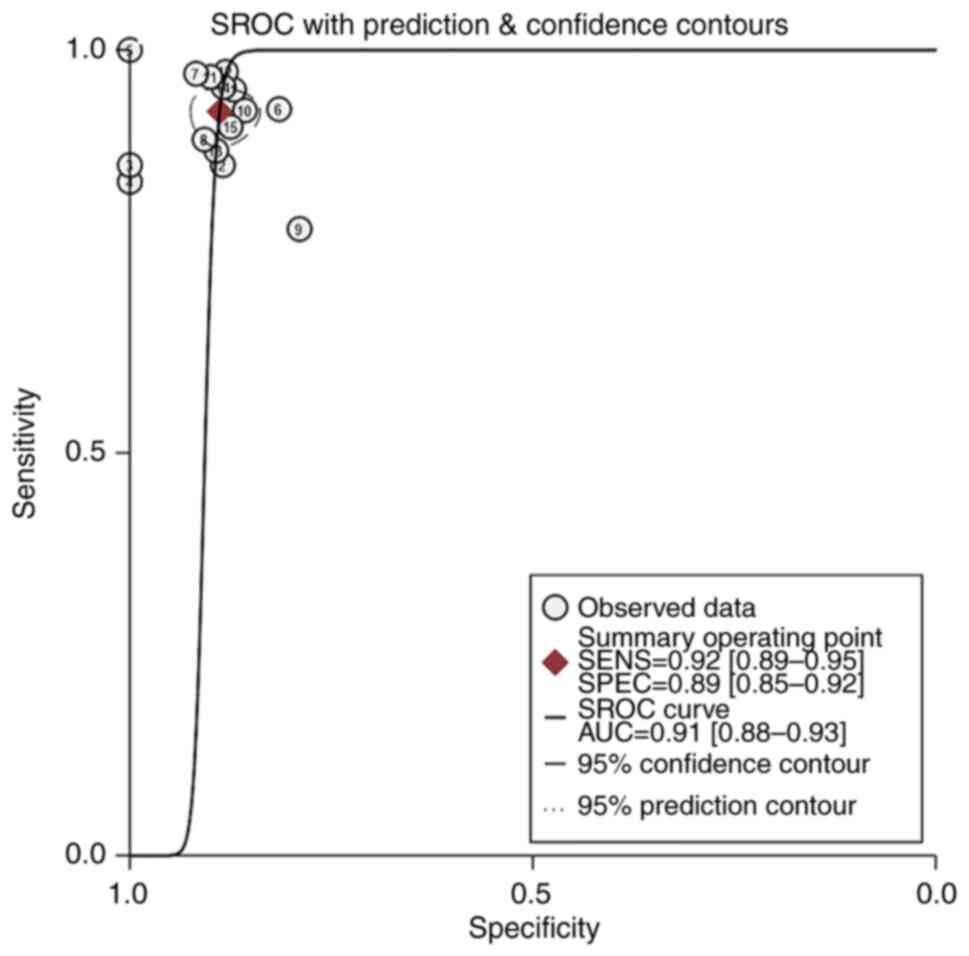
Summary receiver operating
characteristic (SROC) curve analysis
An SROC curve analysis was performed, and the AUC of
the SROC curve was calculated to be 0.91. This indicates the high
diagnostic value of MRI radiomics for gliomas (Fig. 8).
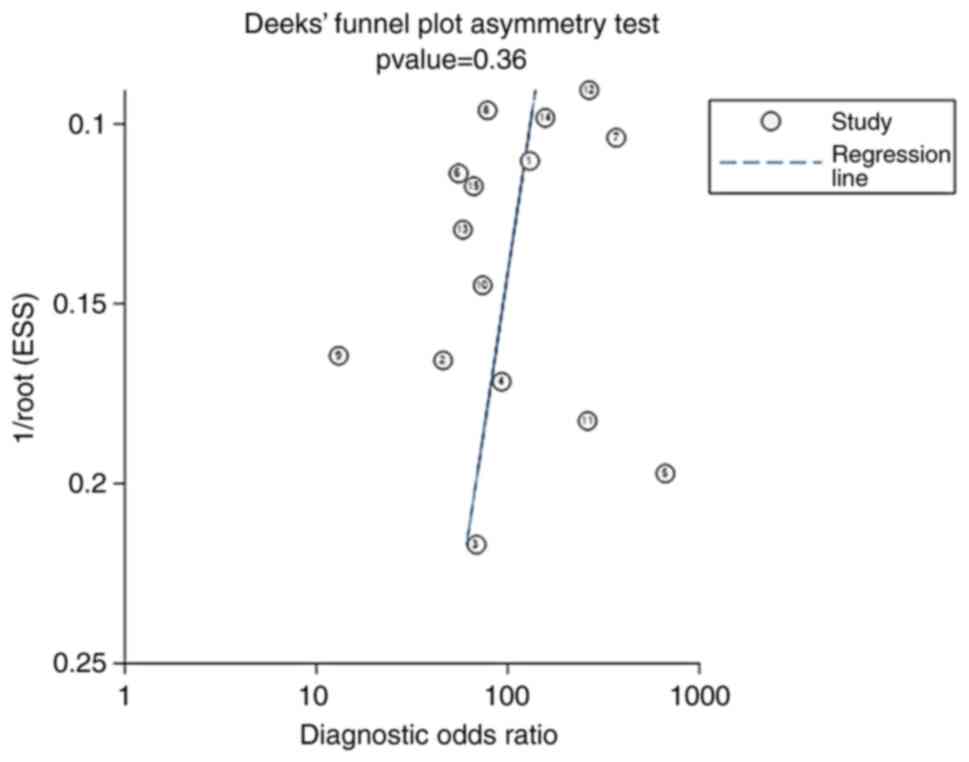
Publication bias
The Deeks' funnel plot for the studies of MRI
radiomics in the diagnosis of glioma had a P-value of 0.36,
indicating no significant publication bias in the studies included
in the present meta-analysis (Fig.
9).
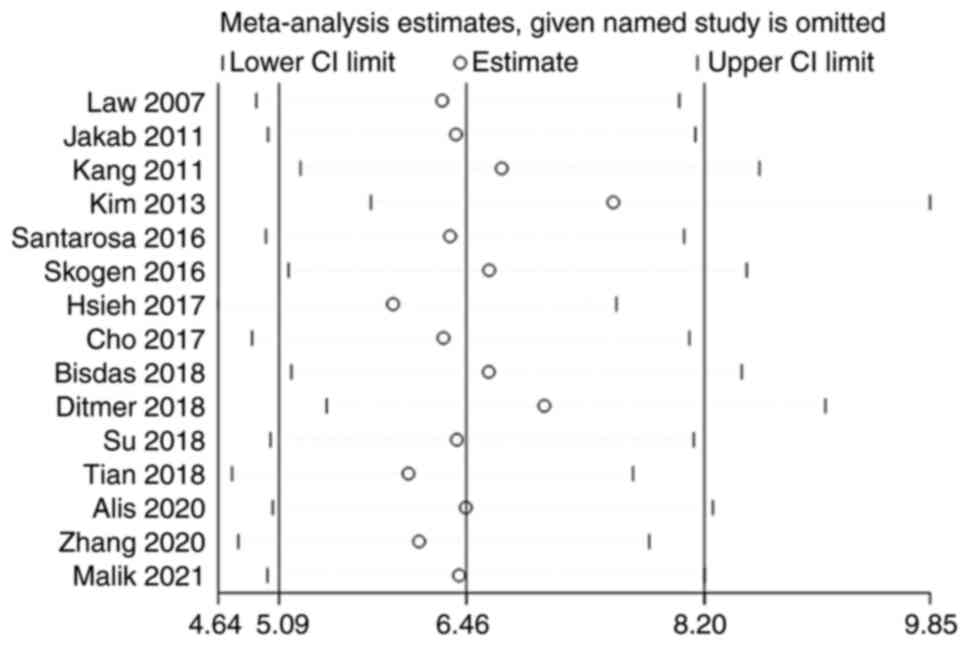
Sensitivity analysis
The 15 studies were subjected to a pooled analysis
to determine whether any of the included studies had a
disproportionate influence on the meta-analysis results. This was
accomplished using sensitivity analyses that eliminated each study
individually. According to the meta-analysis, no specific study
substantially influenced the results, suggesting that the findings
were consistent and credible (Fig.
10).
Discussion
Histopathology is the gold standard for the
diagnosis of gliomas; however, it is an invasive method in which
tissue collection is necessary and can be harmful. However, MRI is
also able to provide accurate information while avoiding
unnecessary surgery. With the development of technology, an
increasing number of metabolic and physiological MRI techniques,
including diffusion tensor imaging, MRS, DWI and MRI are being used
for glioma grading. These tests assess the malignancy of a tumor by
identifying differences in the grayscale brightness and contrast of
the pixels in an image (6).
Radiomics uses tools such as MaZda, MATLAB, TexRAD, MISSTA, CAD and
FireVoxel to identify new quantitative imaging markers without the
need for additional acquisition equipment or tracers, thereby
providing greater diagnostic capabilities than commonly used
examination methods (24). In the
present study, a meta-analysis was performed to systematically
review the accuracy of radiomics in differentiating between LGG and
HGG.
The pooled sensitivity and specificity of the
studies overall were 0.92 (95% CI: 0.89–0.95) and 0.89 (95% CI:
0.85–0.92), respectively. Although the result of this study
suggested that specificity was lower than sensitivity, a
specificity of 0.89 indicated a low probability of missed
diagnosis. In addition, positive and negative LRs of the studies
were 7.89 (95% CI: 6.01–10.37) and 0.09 (95% CI: 0.07–0.12),
respectively. The pooled DOR of the studies was 85.20 (95% CI:
54.52–133.14) and the area under the ROC curve was 0.91. AUC values
were calculated an AUC of 0.9–1.0 was considered an ‘excellent’
diagnostic accuracy. Thus, an AUC of 0.91 suggests that MRI
radiomics has high accuracy in distinguishing high-grade glioma
from low-grade glioma. These results demonstrate that radiomics has
high diagnostic value for glioma grading. A previous meta-analysis
by Sohn and Bisdas (25) explored
the diagnostic accuracy of machine learning-based radiomics in
grading gliomas, and the pooled results also showed that
sensitivity when diagnosing HGG was higher (96%; 95% CI: 0.93–0.98)
than the specificity when diagnosing LGG (90%; 95% CI: 0.85-.93)
(25). By contrast, the present
study focuses on MRI-based imaging radiomics in grading gliomas.
The results of this study further complement those of previous
studies and highlight the diagnostic value of MRI-based imaging
radiomics. A number of studies have shown the good prospects of
radiomics for the resolution of clinical issues that cannot be
addressed using conventional radiological diagnosis, and indicate
that radiomics has stronger diagnostic capabilities than ordinary
examination methods, suggesting that further consideration should
be given to the standardization of its use in clinical practice
(21,26,27).
However, current studies rarely provide open access to the coding
used for imaging data, feature extraction and model building, which
makes it difficult to obtain open MRI radiomics data for secondary
analysis and validation. In addition, if the sample size of the
study is limited, it has been recommended that the number of
feature parameters should be reduced to reduce the risk of
overfitting (28).
The present review has certain limitations. First,
most of the included studies were retrospective. Second, the
majority of the studies were single-center studies involving
patients who had undergone surgery, and there may have been
admission and selection biases.
In conclusion, the present meta-analysis indicates
that radiomics may be an accurate tool for the differentiation of
glioma grades; however, further research is required to verify the
most appropriate of these technologies.
Acknowledgements
Not applicable.
Funding
Funding: Not applicable.
Availability of data and materials
The datasets used and/or analyzed during the current
study are available from the corresponding author on reasonable
request.
Authors' contributions
JW conceived the study and wrote the manuscript. ZC
and JC participated in searching and screening the studies, and
performing data analysis. JW and JC confirm the authenticity of all
the raw data. All authors read and approved the final version of
the manuscript.
Ethics approval and consent to
participate
Not applicable.
Patient consent for publication
Not applicable.
Competing interests
The authors declare that they have no competing
interests.
References
|
1
|
Louis DN, Perry A, Reifenberger G, von
Deimling A, Figarella-Branger D, Cavenee WK, Ohgaki H, Wiestler OD,
Kleihues P and Ellison DW: The 2016 world health organization
classification of tumors of the central nervous system: A summary.
Acta Neuropathol. 131:803–820. 2016. View Article : Google Scholar : PubMed/NCBI
|
|
2
|
Helseth R, Helseth E, Johannesen TB,
Langberg CW, Lote K, Rønning P, Scheie D, Vik A and Meling TR:
Overall survival, prognostic factors, and repeated surgery in a
consecutive series of 516 patients with glioblastoma multiforme.
Acta Neurol Scand. 122:159–167. 2010. View Article : Google Scholar : PubMed/NCBI
|
|
3
|
Woodworth GF, McGirt MJ, Samdani A,
Garonzik I, Olivi A and Weingart JD: Frameless image-guided
stereotactic brain biopsy procedure: Diagnostic yield, surgical
morbidity, and comparison with the frame-based technique. J
Neurosurg. 104:233–237. 2006. View Article : Google Scholar : PubMed/NCBI
|
|
4
|
Ryu YJ, Choi SH, Park SJ, Yun TJ, Kim JH
and Sohn CH: Glioma: Application of whole-tumor texture analysis of
diffusion-weighted imaging for the evaluation of tumor
heterogeneity. PLoS One. 9:e1083352014. View Article : Google Scholar : PubMed/NCBI
|
|
5
|
Jackson A, O'Connor JP, Parker GJ and
Jayson GC: Imaging tumor vascular heterogeneity and angiogenesis
using dynamic contrast-enhanced magnetic resonance imaging. Clin
Cancer Res. 13:3449–3459. 2007. View Article : Google Scholar : PubMed/NCBI
|
|
6
|
Gillies RJ, Kinahan PE and Hricak H:
Radiomics: Images are more than pictures, they are data. Radiology.
278:563–577. 2016. View Article : Google Scholar : PubMed/NCBI
|
|
7
|
Lubner MG, Smith AD, Sandrasegaran K,
Sahani DV and Pickhardt PJ: CT texture analysis: Definitions,
applications, biologic correlates, and challenges. Radiographics.
37:1483–1503. 2017. View Article : Google Scholar : PubMed/NCBI
|
|
8
|
Lee J, Mulder F, Leeflang M, Wolff R,
Whiting P and Bossuyt PM: QUAPAS: An adaptation of the QUADAS-2
tool to assess prognostic accuracy studies. Ann Intern Med.
175:1010–1018. 2022. View
Article : Google Scholar : PubMed/NCBI
|
|
9
|
Law M, Young R, Babb J, Pollack E and
Johnson G: Histogram analysis versus region of interest analysis of
dynamic susceptibility contrast perfusion MR imaging data in the
grading of cerebral gliomas. AJNR Am J Neuroradiol. 28:761–766.
2007.PubMed/NCBI
|
|
10
|
Jakab A, Molnár P, Emri M and Berényi E:
Glioma grade assessment by using histogram analysis of diffusion
tensor imaging-derived maps. Neuroradiology. 53:483–491. 2011.
View Article : Google Scholar : PubMed/NCBI
|
|
11
|
Kang Y, Choi SH, Kim YJ, Kim KG, Sohn CH,
Kim JH, Yun TJ and Chang KH: Gliomas: Histogram analysis of
apparent diffusion coefficient maps with standard-or high-b-value
diffusion-weighted MR imaging-correlation with tumor grade.
Radiology. 261:882–890. 2011. View Article : Google Scholar : PubMed/NCBI
|
|
12
|
Kim H, Choi SH, Kim JH, Ryoo I, Kim SC,
Yeom JA, Shin H, Jung SC, Lee AL, Yun TJ, et al: Gliomas:
Application of cumulative histogram analysis of normalized cerebral
blood volume on 3 T MRI to tumor grading. PLoS One. 8:e634622013.
View Article : Google Scholar : PubMed/NCBI
|
|
13
|
Santarosa C, Castellano A, Conte GM,
Cadioli M, Iadanza A, Terreni MR, Franzin A, Bello L, Caulo M,
Falini A and Anzalone N: Dynamic contrast-enhanced and dynamic
susceptibility contrast perfusion MR imaging for glioma grading:
Preliminary comparison of vessel compartment and permeability
parameters using hotspot and histogram analysis. Eur J Radiol.
85:1147–1156. 2016. View Article : Google Scholar : PubMed/NCBI
|
|
14
|
Skogen K, Schulz A, Dormagen JB, Ganeshan
B, Helseth E and Server A: Diagnostic performance of texture
analysis on MRI in grading cerebral gliomas. Eur J Radiol.
85:824–829. 2016. View Article : Google Scholar : PubMed/NCBI
|
|
15
|
Hsieh KLC, Chen CY and Lo CM: Quantitative
glioma grading using transformed gray-scale invariant textures of
MRI. Comput Biol Med. 83:102–108. 2017. View Article : Google Scholar : PubMed/NCBI
|
|
16
|
Cho HH and Park H: Classification of
low-grade and high-grade glioma using multi-modal image radiomics
features. Annu Int Conf IEEE Eng Med Biol Soc. 2017:3081–3084.
2017.PubMed/NCBI
|
|
17
|
Bisdas S, Shen H, Thust S, Katsaros V,
Stranjalis G, Boskos C, Brandner S and Zhang J: Texture
analysis-and support vector machine-assisted diffusional kurtosis
imaging may allow in vivo gliomas grading and IDH-mutation status
prediction: A preliminary study. Sci Rep. 8:61082018. View Article : Google Scholar : PubMed/NCBI
|
|
18
|
Ditmer A, Zhang B, Shujaat T, Pavlina A,
Luibrand N, Gaskill-Shipley M and Vagal A: Diagnostic accuracy of
MRI texture analysis for grading gliomas. J Neurooncol.
140:583–589. 2018. View Article : Google Scholar : PubMed/NCBI
|
|
19
|
Su CQ, Lu SS, Han QY, Zhou MD and Hong XN:
Intergrating conventional MRI, texture analysis of dynamic
contrast-enhanced MRI, and susceptibility weighted imaging for
glioma grading. Acta Radiol. 2019 Jun;60((6)): 777–787. View Article : Google Scholar : PubMed/NCBI
|
|
20
|
Tian Q, Yan LF, Zhang X, Zhang X, Hu YC,
Han Y, Liu ZC, Nan HY, Sun Q, Sun YZ, et al: Radiomics strategy for
glioma grading using texture features from multiparametric MRI. J
Magn Reson Imaging. 48:1518–1528. 2018. View Article : Google Scholar : PubMed/NCBI
|
|
21
|
Alis D, Bagcilar O, Senli YD, Isler C,
Yergin M, Kocer N, Islak C and Kizilkilic O: The diagnostic value
of quantitative texture analysis of conventional MRI sequences
using artificial neural networks in grading gliomas. Clin Radiol.
75:351–357. 2020. View Article : Google Scholar : PubMed/NCBI
|
|
22
|
Zhang Z, Xiao J, Wu S, Lv F, Gong J, Jiang
L, Yu R and Luo T: Deep convolutional radiomic features on
diffusion tensor images for classification of glioma grades. J
Digit Imaging. 33:826–837. 2020. View Article : Google Scholar : PubMed/NCBI
|
|
23
|
Malik N, Geraghty B, Dasgupta A, Maralani
PJ, Sandhu M, Detsky J, Tseng CL, Soliman H, Myrehaug S, Husain Z,
et al: MRI radiomics to differentiate between low grade glioma and
glioblastoma peritumoral region. J Neurooncol. 155:181–191. 2021.
View Article : Google Scholar : PubMed/NCBI
|
|
24
|
Lambin P, Rios-Velazquez E, Leijenaar R,
Carvalho S, van Stiphout RG, Granton P, Zegers CM, Gillies R,
Boellard R, Dekker A and Aerts HJ: Radiomics: Extracting more
information from medical images using advanced feature analysis.
Eur J Cancer. 48:441–446. 2012. View Article : Google Scholar : PubMed/NCBI
|
|
25
|
Sohn CK and Bisdas S: Diagnostic accuracy
of machine learning-based radiomics in grading gliomas: systematic
review and meta-analysis. Contrast Media Mol Imaging.
2020:21270622020. View Article : Google Scholar : PubMed/NCBI
|
|
26
|
Liu C, Zhao W, Xie J, Lin H, Hu X, Li C,
Shang Y, Wang Y, Jiang Y, Ding M, et al: Development and validation
of a radiomics-based nomogram for predicting a major pathological
response to neoadjuvant immunochemotherapy for patients with
potentially resectable non-small cell lung cancer. Front Immunol.
14:11152912023. View Article : Google Scholar : PubMed/NCBI
|
|
27
|
Li J, Xia F, Wang X, Jin Y, Yan J, Wei X
and Zhao Q: Multiclassifier radiomics analysis of ultrasound for
prediction of extrathyroidal extension in papillary thyroid
carcinoma in children. Int J Med Sci. 20:278–286. 2023. View Article : Google Scholar : PubMed/NCBI
|
|
28
|
Berenguer R, Pastor-Juan MDR,
Canales-Vázquez J, Castro-García M, Villas MV, Mansilla Legorburo F
and Sabater S: Radiomics of CT features may be nonreproducible and
redundant: influence of CT acquisition parameters. Radiology.
288:407–415. 2018. View Article : Google Scholar : PubMed/NCBI
|