Introduction
Lung cancer is a major contributor to cancer
mortality trends, with 340 people succumbing each day from lung
cancer in the United States, and despite notable reductions in lung
cancer-associated mortality due to early detection and therapeutic
advancements, the annual mortality rate from lung cancer remains
substantially higher compared with colorectal cancer, breast cancer
and prostate cancer (1).
Non-small-cell lung cancer (NSCLC) accounts for approximately
four-fifths of all lung cancer cases (2). Lung adenocarcinoma (LUAD) is the
primary histological subtype of NSCLC in terms of prevalence,
followed by squamous cell carcinoma (2). Continuous advancements and innovations
in medical technology have markedly improved treatment outcomes for
patients with LUAD. However, when most patients are diagnosed, the
disease has developed to the middle and late stages; due to the
spread and metastasis of the tumor, it is difficult to achieve the
ideal treatment effect, and the 5-year survival rate remains
relatively low (3). Previous
research has indicated that the identification and utilization of
molecular biomarkers hold potential for predicting patient
prognosis (4). However, a consensus
on the primary drivers of LUAD has yet to be reached, and an
in-depth examination into the biological characteristics and
mechanisms underlying LUAD-associated genes is necessary.
Increased glycolysis in tumor cells may promote
tumor growth, progression and metastasis (5). The acceleration of glucose metabolism,
known as the ‘Warburg effect’, is crucial for the conversion of
pyruvic acid into lactate, and lactate derived from tumors can
inhibit the tumor surveillance function of T cells and natural
killer cells (5). Aerobic
glycolysis and abnormal choline phospholipid metabolism are also
hallmarks of cancer, and inhibiting glycolysis and choline
metabolism can suppress tumor growth; regulation of cancer
metabolism can occur through the crosstalk between glycolytic
enzymes and phospholipid synthetases (6). Cells dependent on mitochondrial
respiration are more sensitive to copper ionophores than those
relying on glycolysis. Glycolysis is essential for the growth and
proliferation of cancer cells; therefore, inhibiting glucose
metabolism not only makes them more susceptible to treatment with
the copper ionophore elesclomol (ES) but also reduces the malignant
potential of these cells (7).
Tsvetkov et al (8) proposed a novel metal ion-mediated cell
death mechanism similar to ferroptosis (9), termed copper-dependent cell death.
This mechanism differs from other cell death pathways, such as
apoptosis (10), pyroptosis
(11) and necroptosis (12). Characterized by excessive copper
binding directly to lipid-acetylated proteins of the tricarboxylic
acid (TCA) cycle, this mode of cell death leads to the aggregation
of lipid-acetylated proteins and subsequent destabilization of
iron-sulfur (Fe-S) cluster proteins, resulting in increased protein
toxic stress and ultimately cell death (8). Previous studies have reported that the
direct binding of copper to the lipid-acylated components of the
TCA cycle leads to TCA inhibition after pulsing with the copper
ionophore ES. Metabolites related to the TCA cycle, such as
citrate, cis-aconitate and guanosine diphosphate, exhibit
time-dependent maladaptation, with their contents decreasing over
time after ES treatment (8,13).
Previous studies have highlighted the critical role
of cuproptosis-related genes (CRGs) in human cancer (8,14,15).
These genes regulate copper ion transport and metabolism to
maintain stable intracellular copper levels. Due to the promoting
effects of copper on malignant biological behaviors, such as cell
proliferation, neovascularization and tumor metastasis, the
potential role of CRGs is particularly notable (16). However, the specific regulatory
mechanisms of CRGs, and their effects on the progression and
prognosis of LUAD remain unclear. Investigating CRGs as potential
therapeutic targets may provide novel options for cancer treatment,
and provides valuable insights into the molecular mechanisms
underlying cancer initiation and progression.
CDK inhibitor 2A (CDKN2A) is highly expressed in
most cancer types, with several genetic variations associated with
patient survival and its expression (17). It resides on the p21.3 band of the
short arm of human chromosome 9, exhibiting ubiquitous expression
across diverse cells and tissues. It is transcribed from four exons
(1α, 1β, 2 and 3), directing the synthesis of two proteins:
p16INK4a (p16) and p14ARF (p14). These proteins are translated via
alternative reading frames, each serving as a crucial regulator of
the cell cycle (18). p16 exerts
its anticancer function by maintaining the retinoblastoma protein
in a hypophosphorylated state, thereby blocking cell entry into the
S phase of DNA synthesis. Additionally, p14 acts as a positive
regulator of p53, inhibiting MDM2 proto-oncogene (MDM2)-mediated
degradation of p53. Disruption of the ability of p14 to bind MDM2
leads to MDM2-mediated degradation of p53, enabling cells to evade
senescence barriers, accumulate DNA damage and facilitate
tumorigenesis (19). In summary,
the CDKN2A gene serves a vital role in regulating cell cycle
progression and tumor suppression through its encoded proteins p16
and p14. Genetic alterations that compromise the normal functions
of these proteins may disrupt cellular homeostasis and increase the
risk of tumorigenesis.
As a CRG, CDKN2A, identified through whole-genome
CRISPR/Cas9 knockout screens, may function as an anti-cuproptosis
gene that contributes to tumor initiation and progression (8,20,21).
CDKN2A acts as a negative regulator among CRGs, and its mechanism
for influencing poor prognosis indicates its potential involvement
in regulating cuproptosis activity (20,22).
Shi et al (22) speculated
that this might be related to the involvement of CDKN2A in the EMT
process. The association of CDKN2A with most CRGs in adrenocortical
carcinoma, kidney renal clear cell carcinoma, prostate
adenocarcinoma and thyroid carcinoma highlights its pivotal role in
cuproptosis. Pan-cancer analysis has reveal that CDKN2A expression
is associated with pathological stages across multiple tumor types
and is closely associated with immune infiltration, emphasizing its
potential as a biomarker (23). In
addition, the loss of CDKN2A function is strongly associated with
the progression, prognosis and treatment of lung cancer; however,
the specific mechanisms by which CDKN2A modulates cuproptosis in
lung cancer remain to be clarified (24). The current lack of research
elucidating the detailed mechanisms of CDKN2A in cancer cell
cuproptosis presents a novel research direction for anticancer
therapy and offers broad avenues for future treatment
strategies.
The present study aimed to identify the hub genes
associated with cuproptosis in patients with LUAD by integrating
transcriptomics and clinical data from The Cancer Genome Atlas
(TCGA) database. The present study aimed to comprehensively
evaluate the molecular mechanisms and clinical importance of these
hub genes in LUAD cuproptosis. Furthermore, validation of the
findings through in vitro cellular experiments was
performed, thereby providing novel therapeutic targets for the
treatment of LUAD.
Materials and methods
Data source and preprocessing
The RNA-sequencing (RNA-seq) expression profiles of
LUAD were downloaded from TCGA database (https://portal.gdc.cancer.gov) (25), comprising 530 LUAD tissue samples
(T) and adjacent tissues samples from 59 patients with LUAD (N).
Utilizing the rjson R package (https://github.com/alexcb/rjson) through R studio
(2023.09.1 494) (26), the gene
expression matrices were integrated, duplicate data were removed
and gene names were converted to common identifiers, thereby
acquiring LUAD-associated genes. CRGs were sourced from prior
literature studies (9,14,15).
SangerBox 3.0 (http://vip.sangerbox.com/) is a comprehensive,
user-friendly bioinformatics analysis platform; this software was
used to perform image visualization (27).
Differential expression analysis and
identification of candidate LUAD CRGs
To analyze TCGA data (T=530; N=59), differential
expression analysis was performed using R packages limma-voom
(28), DESeq2 (https://bioconductor.org/packages/release/bioc/html/DESeq2.html)
and edgeR (https://bioconductor.org/packages/release/bioc/html/edgeR.html)
to identify differentially expressed genes (DEGs) between the
selected groups and their respective controls. Genes with
expression values of zero in >50% of samples were excluded. To
perform differential expression analysis using DESeq2 on the
obtained TCGA expression dataset, the DESeqDataSetFromMatrix and
DESeq functions were utilized to input the matrix and normalize the
data, followed by the results function to determine the
significance of differential expression for each gene. For
differential expression analysis using edgeR, the DGEList and
calcNormFactors functions were adopted to input the matrix and
normalize the data, with the exactTest function used to assess the
significance of differential expression for each gene. In the limma
approach for differential expression analysis, the data were
transformed using the voom function, and multivariate linear
regression analysis was performed using the lmFit function. The
eBayes function was then applied to calculate moderated statistical
values, yielding the significance of differential expression for
each gene. Hypothesis testing approaches were utilized to set
P-values, false discovery rate (FDR) values and fold changes for
screening DEGs. In the present study, P<0.05, FDR <0.05 and
fold change >1.5 were applied to obtain statistically
significant differences for each gene. Common DEGs from the three
methods were intersected using Venn diagrams to ensure accuracy.
These DEGs were then intersected with CRGs to identify 10 candidate
LUAD CRGs.
Construction of protein-protein
interaction (PPI) network and identification of hub genes
The STRING database (version 11.5; http://string-db.org/) (29) was employed to construct a PPI
network among the differentially co-expressed genes. When
constructing the gene interaction network using STRING to
illustrate the PPI associations among the 10 selected genes, a
confidence score of ≥0.150 was applied as the threshold. The
resulting network was visualized using Cytoscape (v3.9.1) (30). Among the network analysis methods,
node degree and maximal clique centrality (MCC) algorithms were
applied via the cytoHubba plug-in in Cytoscape to identify
potential hub nodes (31). Based on
these analyses, CDKN2A, a LUAD CRG, was selected as the most
credible hub gene.
Prediction of transcription factors
(TFs) for target genes
A total of five databases were used to predict the
potential TFs for CDKN2A and the nine other LUAD CRGs identified
(AOC3, ULK2, SLC31A2, PDK1, CP, GCSH, COA6, LOXL2 and H3C1): ENCODE
(https://www.encodeproject.org/),
hTFtarget (http://bioinfo.life.hust.edu.cn/hTFtarget), Cistrome
(http://cistrome.org/db/), TCGA-LUAD (https://portal.gdc.cancer.gov) and Genotype-Tissue
Expression (GTEx) Lung (https://gtexportal.org/home). Based on Pearson
correlation analysis, the correlation was calculated between the
expression of target genes and TFs to ultimately obtain the
required TFs. In the present study, the prediction of target gene
TFs across multiple databases was performed using the website
https://jingege.shinyapps.io/TF_predict/.
Subsequently, the overlapping TFs predicted by ≥2 databases were
identified through Venn diagrams. Among them, Spi-1 proto-oncogene
(SPI1) was selected for prognostic analysis based on its prognostic
significance.
Validation of gene and protein
expression levels and prognostic survival value
The Gene Expression Profiling Interactive Analysis
(GEPIA) 2.0 database (http://gepia.cancer-pku.cn/) (32) encapsulates a vast collection of data
from 9,736 tumor samples and 8,587 normal samples sourced from TCGA
and GTEx projects. In the present study, the GEPIA 2.0 database
facilitated the analysis of differential gene expression levels
between LUAD tissues and normal lung tissues, as well as
correlations among genes. The Human Protein Atlas 24.0 (HPA 24.0;
images available from v24.proteinatlas.org) (33) was utilized to further corroborate
the protein expression levels of specific genes in LUAD vs. normal
lung tissues by visually inspecting the protein expression of
relevant genes in pathological sections of normal lung and LUAD
tissues, thereby verifying the differences in protein
expression.
The UALCAN database (http://ualcan.path.uab.edu/) (34), an online analysis and mining tool
based on TCGA data, was used to verify the reliability of hub genes
by analyzing the differences in mRNA expression levels between LUAD
tissues and normal tissues, as well as their prognostic
significance. Additionally, the Kaplan-Meier (KM) plotter database
(http://kmplot.com/analysis/) (35) was employed to examine the effect of
gene expression on overall survival (OS), first progression (FP)
and post-progression survival (PPS) in patients with LUAD; the
patients were divided according to median values, and the dataset
names were 211156-at, 207039-at and 209644-at. The test method used
log-rank test to compare between groups and to calculate P-values,
and then Cox multivariate analysis was performed to calculate the
hazard ratio to determine the independent prognostic role of genes;
the follow-up threshold was 120 months.
Exploration of co-expression networks
and gene enrichment analysis
LinkedOmics 1.2 (http://www.linkedomics.org/login.php) (36), a visualization platform, was used to
explore gene expression profiles. Using LinkedOmics, co-expressed
genes of CDKN2A were identified through Spearman's correlation
coefficient analysis. The results were visualized using heatmaps
and volcano plots. Subsequently, Gene Set Enrichment Analysis was
performed to investigate the Gene Ontology (GO) terms and Kyoto
Encyclopedia of Genes and Genomes (KEGG) pathways associated with
CDKN2A and its co-expressed genes. The data were downloaded from
LinkedOmics and used HelixLife 2.0.28 (https://www.helixlife.cn/) to visualize the GO graph.
The KEGG database (https://www.genome.jp/kegg/) (37), which interconnects disease genes,
pathways, drugs and diagnostic markers, served as the primary
resource for signal pathway enrichment analysis.
Evaluation of the statistical
significance of core genes
To assess the credibility of core genes, the normal
dataset (accession number: 000319563900002) from GTEx was
incorporated into the present analysis. A comprehensive analysis of
RNA-seq data in transcripts per million format was performed from
TCGA and GTEx, which were uniformly processed using the Toil
pipeline, in the University of California Santa Cruz Xena database
(https://xenabrowser.net/datapages/)
(38). The final analysis included
515 LUAD samples from TCGA, as well as 59 normal tissue samples
from TCGA and an additional 288 normal tissue samples from GTEx.
The Wilcoxon rank-sum test was selected for statistical analysis,
and the ggplot2 3.4.4 package (https://ggplot2.tidyverse.org) was utilized for data
visualization to validate the significance of the core genes.
Cell transfection
The normal human lung epithelial BEAS-2B cell line
and the LUAD H1975 cell line were obtained from The Cell Bank of
Type Culture Collection of The Chinese Academy of Sciences. Cells
in the logarithmic growth phase were seeded into 6-well plates
containing RPMI-1640 (cat. no. PM150110; Wuhan Pricella
Biotechnology Co., Ltd.; Wuhan Elabscience Biotechnology Co., Ltd.)
medium supplemented with 10% fetal bovine serum (Wuhan Pricella
Biotechnology Co., Ltd.; Wuhan Elabscience Biotechnology Co., Ltd.)
and 1% penicillin-streptomycin (Beyotime Institute of
Biotechnology). When the cells reached 60–70% confluence, plasmids
(1.5 µg) were transfected into the cells using
Lipofectamine® 2000 (Thermo Fisher Scientific, Inc.).
The transfection ratio was 1:1.5, Lipofectamine 2000:plasmid. The
plasmid backbone names and sequences are presented in Table I. The short hairpin (sh)RNA-CDKN2A
(sh-CDKN2A), sh-negative control (NC; empty plasmid),
overexpression (oe)-SPI1 and oe-NC (empty plasmid) plasmids (1.5
µg) were transfected into the H1975 cell line and cultured at 37°C
in a 5% CO2 incubator for 48 h. The transfection
efficiency was assessed by reverse transcription-quantitative
polymerase chain reaction (RT-qPCR).
 | Table I.Plasmid information. |
Table I.
Plasmid information.
| Transfection
vector | Plasmid backbone
and catalog number | Sequence,
5′-3′ |
|---|
| sh-CDKN2A |
pLV3-U6-CDKN2A(human)-shRNA1-Puro |
GCUCUGAGAAACCUCGGGAAACUC |
|
| (cat. no.
P49363) |
GAGUUUCCCGAGGUUUCUCAGAGC |
| sh-NC | pLKO.1-puro (cat.
no. P0258) |
|
| oe-SPI1 |
pCMV-3×FLAG-SPI1(human)-EGFP-Neo (cat. no.
P52919) |
|
| oe-NC |
pCMV-3×FLAG-MCS-EGFP-Neo (cat. no.
P46073) |
|
RT-qPCR analysis
Total RNA was extracted from BEAS-2B and H1975 cells
using RNAiso Plus (cat. no. 9109; Takara Bio, Inc.) and RNA
concentrations were quantified with an ultra-micro
spectrophotometer. According to the manufacturer's protocol, RT of
RNA was performed using HiScript II Q RT SuperMix for qPCR (+gDNA
wiper; cat. no. R223; Vazyme Biotech Co., Ltd.). SYBR qPCR Master
Mix (cat. no. Q311; Vazyme Biotech Co., Ltd.) was used for qPCR
analysis. According to the manufacturer's protocol the following
thermocycling conditions were performed: Pre-denaturation at 95°C
for 30 sec; followed by 40 cycles of denaturation at 95°C for 10
sec, annealing at 60°C for 30 sec and extension at 72°C for 30 sec.
Relative gene expression levels were analyzed using the
2−ΔΔCt method (39).
GAPDH served as the internal reference gene with the following
primer sequences: Forward, 5′-TGCACCACCAACTGCTTAGC-3′ and reverse,
5′-GGCATGGACTGTGGTCATGAG-3′. The primer sequences for CDKN2A were:
Forward, 5′-CTTCCTCGGGTGCCGATAC-3′ and reverse,
5′-ACCCCTTCATTGCTACTCGAT-3′. For SPI1, the primer sequences were:
Forward, 5′-GTGCCCTATGACACGGATCTA-3′ and reverse,
5′-AGTCCCAGTAATGGTCGCTAT-3′.
Western blot analysis
Transfected cells were lysed on ice using RIPA lysis
buffer (Beyotime Institute of Biotechnology) to extract proteins,
and protein concentration was determined using the BCA kit (cat.
no. P0012; Beyotime Institute of Biotechnology). Proteins (20 µg)
were subjected to sodium dodecyl sulfate-polyacrylamide gel
electrophoresis on a 12% gel and transferred to a PVDF membrane
using conventional wet transfer methods. The membrane was blocked
with 5% skimmed milk powder in TBS-0.1% Tween (TBST) at room
temperature for 2 h. An overnight incubation with primary
antibodies at 4°C followed. The next day, the membrane was washed
three times with TBST and incubated with secondary antibodies for 2
h at 4°C. After another three washes with TBST, enhanced
chemiluminescence solution (Biosharp Life Sciences) was added for
exposure. ImageJ software (1.54f; National Institutes of Health)
was used to measure the gray values of each band, with GAPDH
serving as the internal control. Relative protein expression levels
were semi-quantified as the ratio of gray values of the target
protein to gray values of GAPDH. The antibodies used were in the
present study were as follows: Rabbit anti-CDKN2A antibody
(1:1,000; cat. no. BS40808; Bioworld Technology, Inc.), rabbit
anti-p53 antibody (1:2,000; cat. no. 21891-1-AP; Proteintech Group,
Inc.), rabbit anti-GAPDH antibody (1:3,000; cat. no. AP0063;
Bioworld Technology, Inc.) and a Goat Anti-Rabbit IgG secondary
antibody (1:6,000; cat. no. BS13278; Bioworld Technology,
Inc.).
Cell Counting Kit-8 (CCK-8) assay
Cell viability was assessed using the CCK-8 assay
kit (Wuhan Elabscience Biotechnology Co., Ltd.). Transfected H1975
cells (sh-NC, sh-CDKN2A, oe-NC and oe-SPI1) were seeded into
96-well plates at a density of 2×10³ cells/well and
incubated at 37°C. Each group contained four replicate wells. The
cells were incubated for 0, 24, 48 and 72 h, with 10 µl CCK-8
solution added to each well at each time point, followed by 2 h
incubation. Absorbance at 450 nm was measured using a microplate
reader.
Wound healing assay for cell
migration
Cells transfected with sh-NC, sh-CDKN2A, oe-NC and
oe-SPI1 were seeded into 6-well plates at a density of
5×10⁵ cells/well and cultured to form a monolayer. A
scratch was created using a 10-µl pipette tip, and the cells were
maintained in RPMI-1640 medium containing 1% FBS. The scratch area
was observed and images were captured using an optical microscope
at 0, 24 and 48 h. The scratch areas were marked using Photoshop
software (version 23.0.0; Adobe Systems, Inc.).
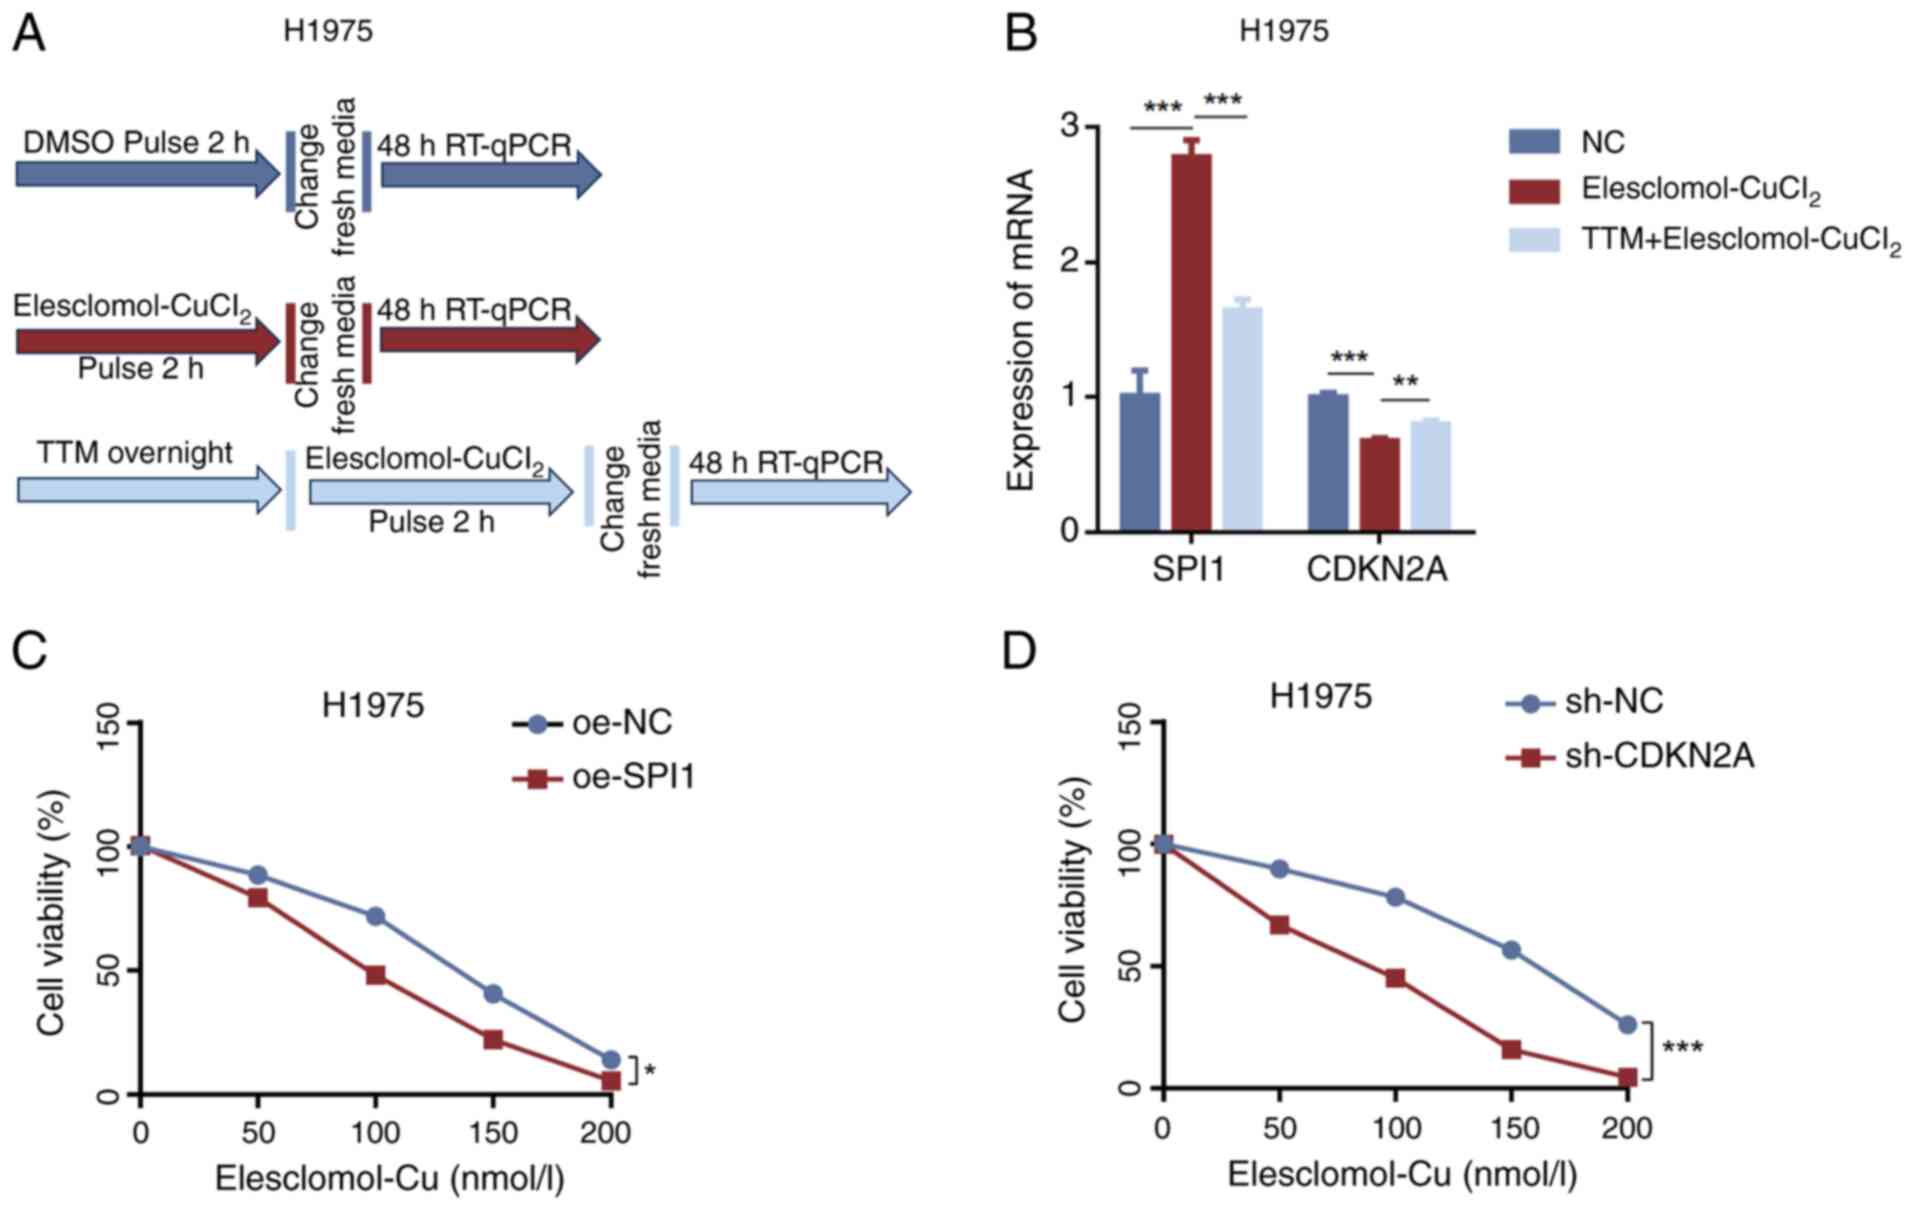
Establishment of a cuproptosis
model
The LUAD cell line H1975 was selected and maintained
in RPMI-1640 medium under standard humidified incubator conditions
at 37°C with 5% CO2. Three distinct groups were
established within the experiment: A control group, an
ES-CuCl2 group and a tetrathiomolybdate
(TTM)-ES-CuCl2 group. ES, an efficacious Cu2+
ionophore that enhances cellular apoptosis, was sourced from
MedChemExpress. TTM, a copper chelator that functions as a copper
antagonist, was procured from Shanghai Yuanye Biotechnology Co.,
Ltd. ES was dissolved in 100% dimethyl sulfoxide (Beijing Solarbio
Science & Technology Co., Ltd.) and the control group was
treated with an equal amount of dimethyl sulfoxide.
CuCl2 (Shanghai Macklin Biochemical Co., Ltd.) was
dissolved in sterile water. ES-CuCl2 was prepared by
mixing ES and CuCl2 in a 1:1 ratio. In the
ES-CuCl2 group, H1975 cells were treated with 30 nM
ES-CuCl2 for 2 h. By comparison, cells in the
TTM-ES-CuCl2 group were pretreated overnight with 20 µM
TTM before exposure to 30 nM ES-CuCl2 for 2 h. After the
aforementioned treatment, the cells of each group were cultured in
fresh medium at 37°C and 5% CO2 for 48 h, and RNA was
extracted. Gene expression was quantitatively detected by
RT-qPCR.
Statistical analysis
For gene pathway analysis (n=515) and core gene
validation and correlation analysis (T=483; N=347), Pearson
correlation analysis was used. When analyzing the gene expression
differences between the normal group and the cancer group (T=483,
N=347) using the GEPIA database, an independent samples t-test was
employed. When comparing differences between normal and cancer
groups in both TCGA and GTEx datasets (T=515; N=347),
non-parametric Wilcoxon rank-sum test were performed, using disease
status as the variable for calculating differential expression. For
patient survival analysis, the log-rank test and Cox univariate
regression were utilized. In experimental validation, differences
between groups were assessed using one-way ANOVA with Tukey's post
hoc test. A unpaired Student's t-test was used to compare
differences between two groups. Results are expressed as the mean ±
standard deviation. P<0.05 was considered to indicate a
statistically significant difference. All calculated results were
statistically analyzed using GraphPad Prism 9.1 software
(Dotmatics). All experiments were repeated three times.
Results
Identification of CRGs in patients
with LUAD from TCGA
Differential gene expression analysis was performed
on 59,427 genes associated with LUAD, retrieved from TCGA database
using the R packages limma-voom, DESeq2 and edgeR. The datasets
employed in all three methods excluded genes with >50% zero
expression values from TCGA dataset. All analyses were executed
within the SangerBox software platform. Genes with P<0.05, FDR
<0.05 and fold change >1.5 were selected and sorted based on
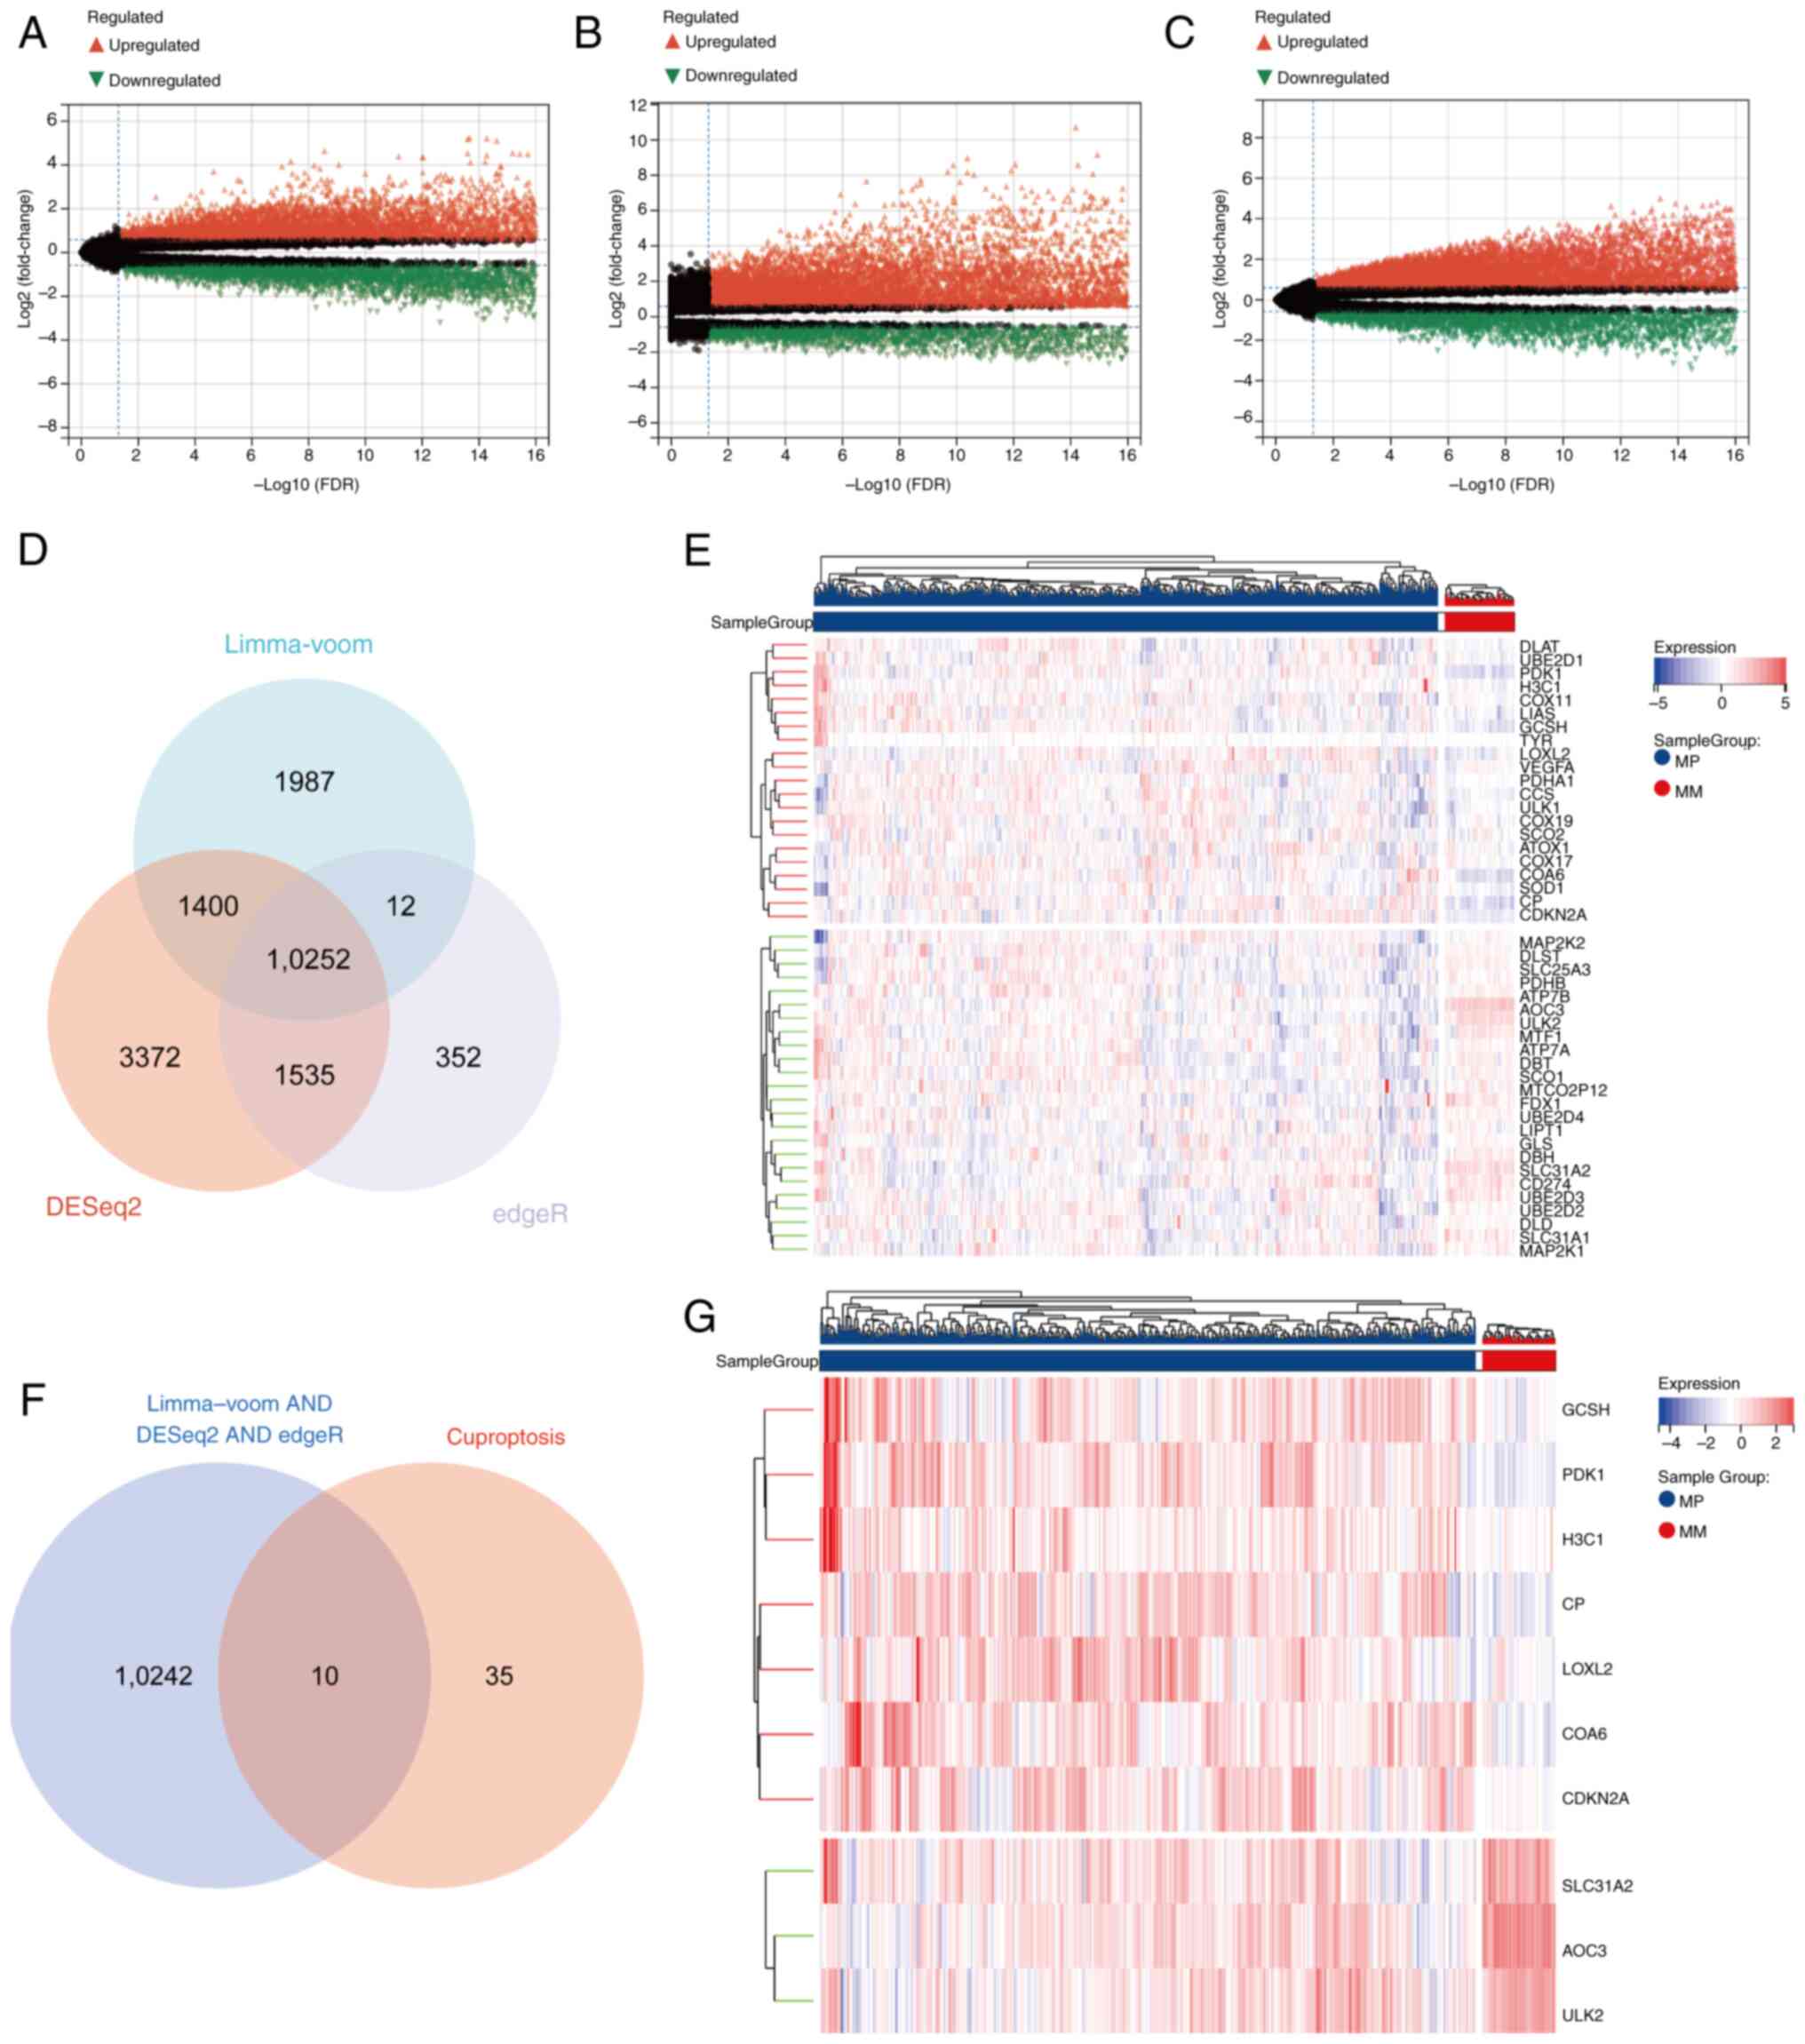
their P-values. According to the limma-voom method, 13,651
significantly DEGs were identified between LUAD and normal lung
tissues (Fig. 1A). A total of
16,559 DEGs were detected using DESeq2 (Fig. 1B), whereas edgeR analysis yielded
12,151 DEGs (Fig. 1C). The
intersection of these three gene sets revealed 10,252 common DEGs
(Fig. 1D). These common DEGs were
subsequently intersected with a set of 45 CRGs derived from the
literature (Fig. 1E), resulting in
10 candidate genes (Fig. 1F). Among
these candidates, three genes (AOC3, ULK2 and SLC31A2) were
downregulated, whereas seven genes (PDK1, CP, GCSH, COA6, LOXL2,
CDKN2A and H3C1) were upregulated (Fig.
1G). The statistical values associated with genes in the
heatmap all adhered to P<0.05, FDR <0.05 and fold change
>1.5.
Hub gene selection and prognostic
significance analysis
The STRING database was utilized to investigate
potential interactions among candidate genes, and the results were
visualized using Cytoscape. A PPI network was constructed by
importing 10 candidate genes into the STRING database, which
expanded to 15 nodes and 34 edges (Fig.
2A). Hub genes were identified using the MCC algorithm from the
cytoHubba plug-in within Cytoscape. Genes with high scores are
represented by red nodes, whereas those with low scores are denoted
by yellow nodes (Fig. 2B). Based on
image analysis, the LUAD CRG CDKN2A, with a score of 252, was
selected as the hub gene for further investigation (Fig. 2C). The UALCAN database was employed
to predict the effect of CDKN2A expression on OS of patients with
LUAD, samples were categorized into two groups: High-expression
(with TPM values above upper quartile) and low/medium expression
(with TPM values below upper quartile), revealing that patients in
the CDKN2A high-expression group exhibited worse OS compared with
the low/medium expression-group (P=0.0023; Fig. 2D). The KM plotter database was used
to assess the influence of CDKN2A (also known as multiple tumor
suppressor 1) expression on OS, PPS and FP in LUAD, thereby
validating the findings (Fig.
2E-M). The results indicated that of the nine datasets
analyzed, only two showed non-significant PPS (P=0.14, Fig. 2H; P=0.1, Fig. 2J), whereas all other datasets
demonstrated statistical significance (P<0.05). Due to the
relatively small sample size of ~300 cases for PPS compared with
~1,000 cases for OS and FP, there may be potential biases or errors
in the PPS results. Nevertheless, high CDKN2A expression was
associated with unfavorable patient prognosis, which supports the
potential of CDKN2A levels as a predictive marker for long-term
survival in patients with LUAD.
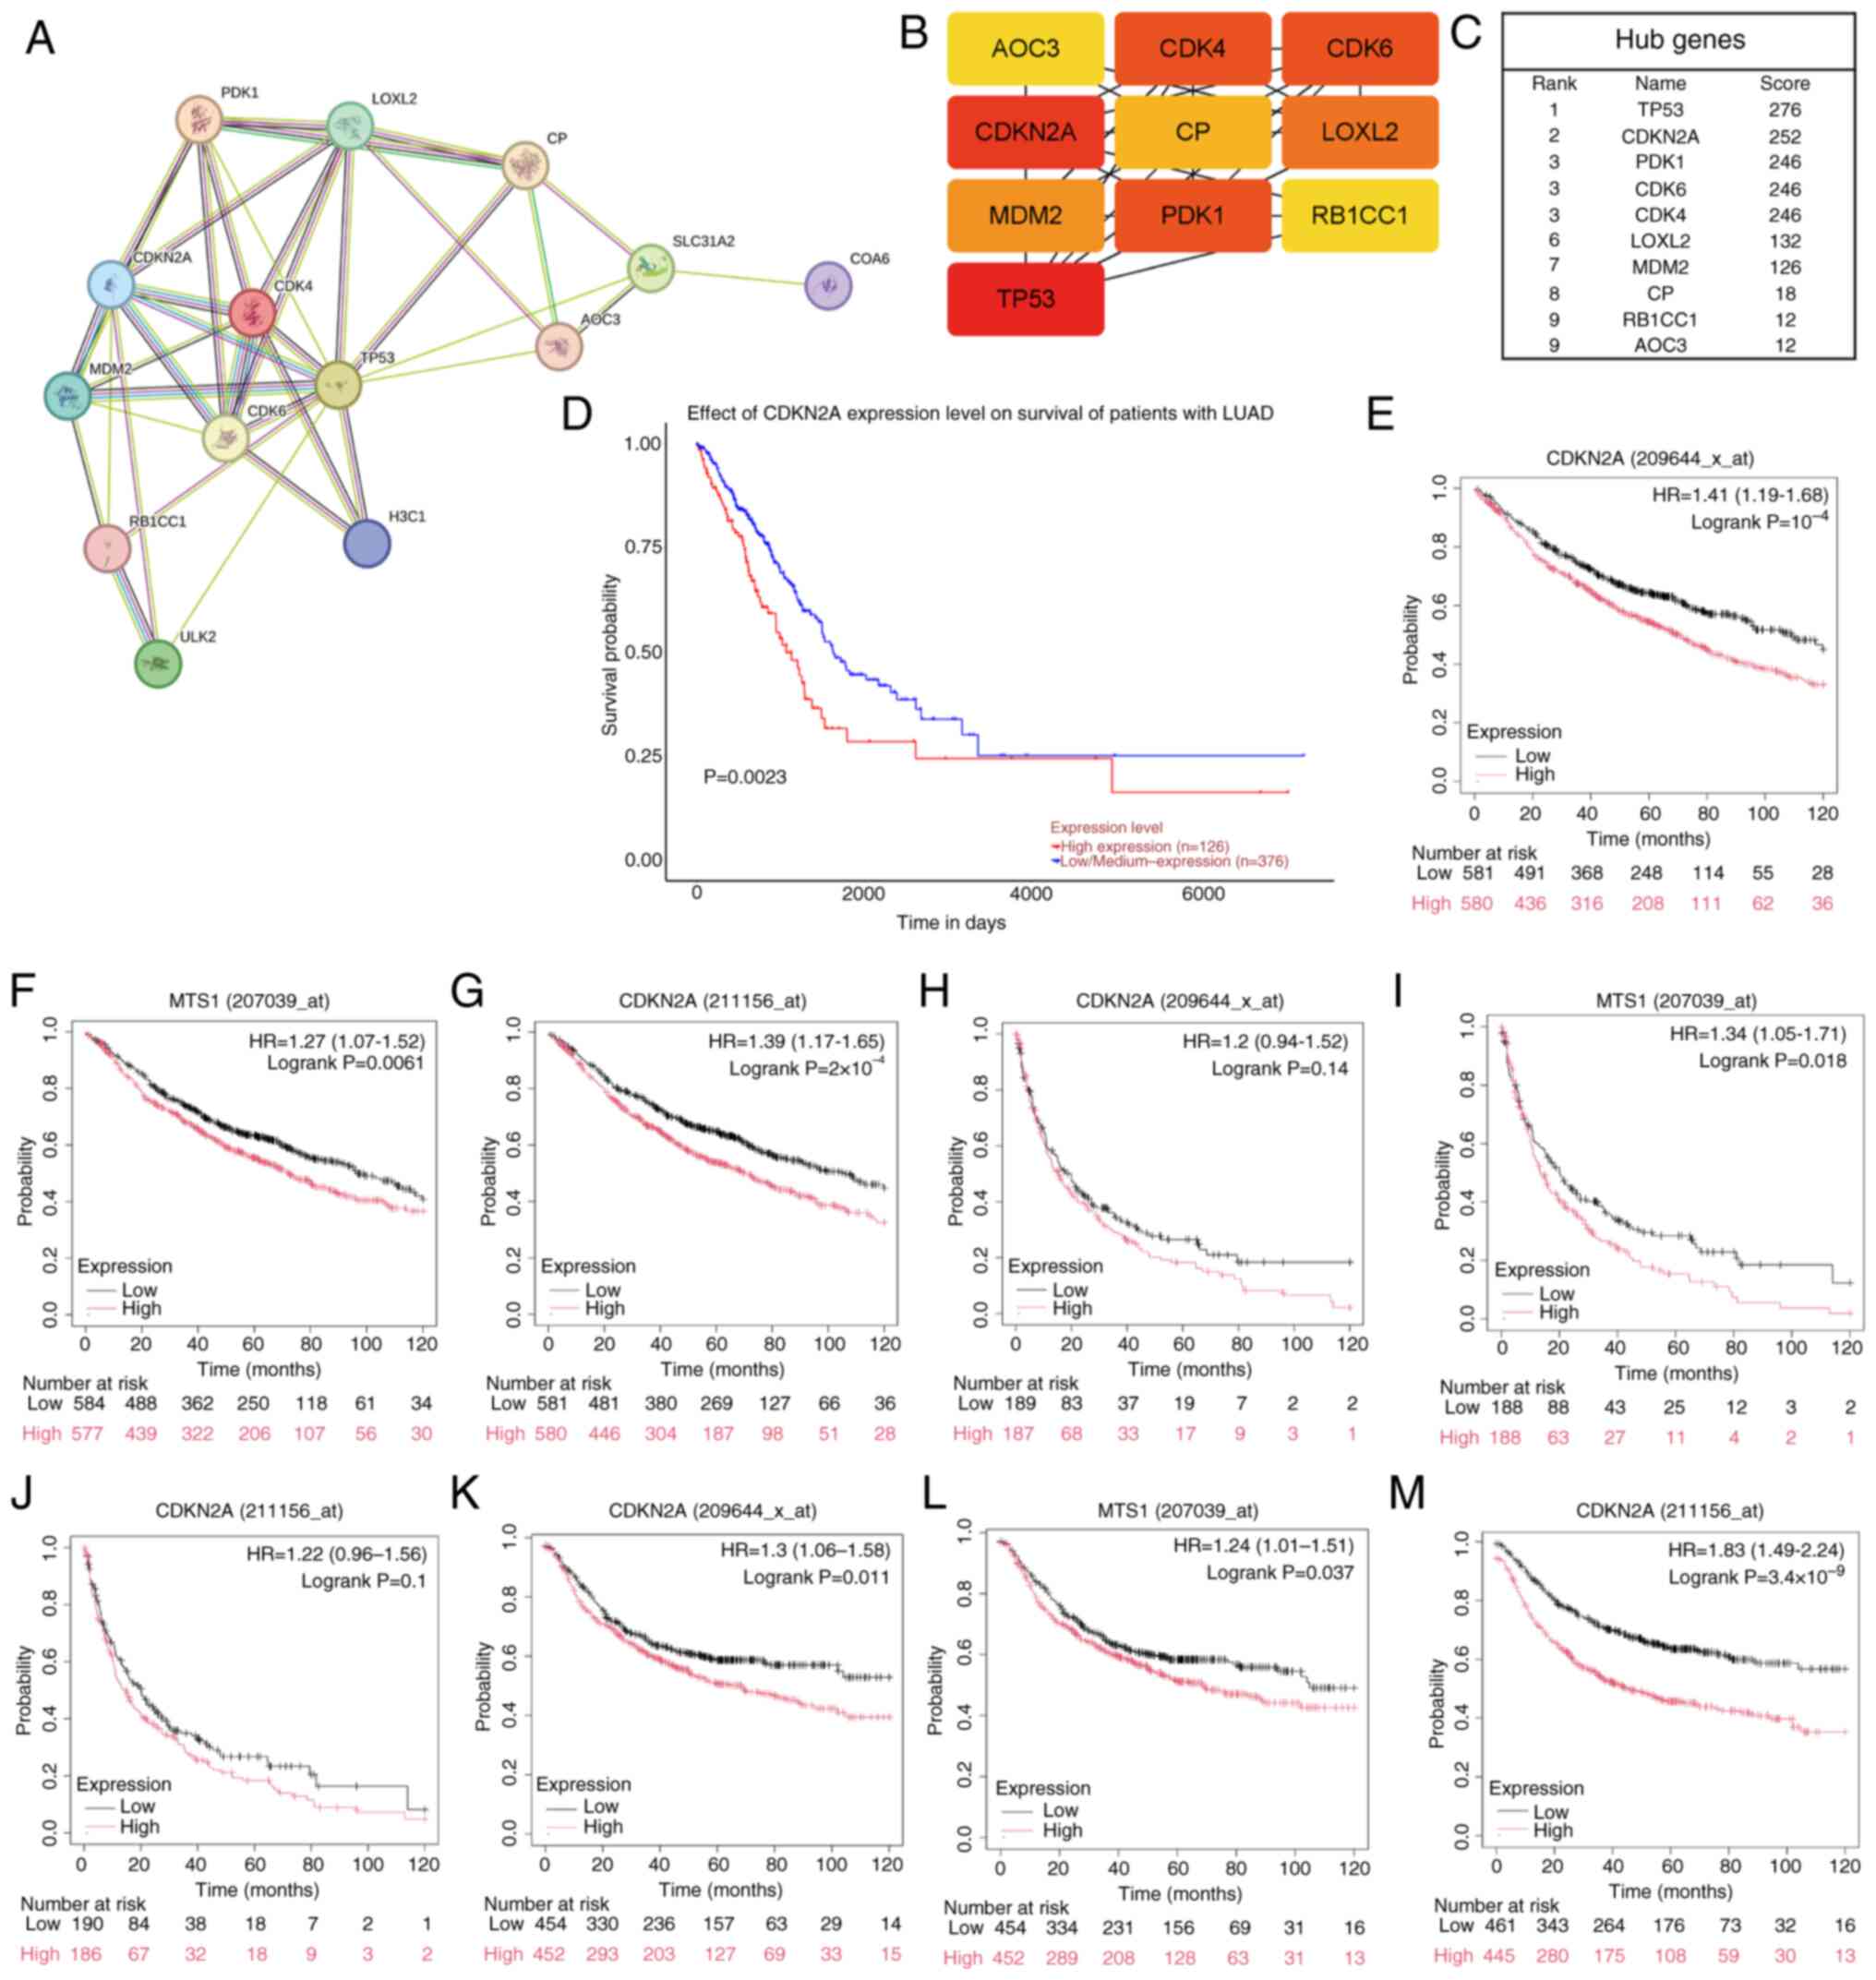 | Figure 2.A PPI network constructed to identify
hub genes and analyze their prognostic significance. (A) An
expanded PPI network centered on 10 overlapping genes was
constructed using the STRING database, comprising 15 nodes and 34
edges. (B) Pivotal genes within the PPI network were identified
using the maximal clique centrality algorithm. Genes with high
scores are represented by red nodes (TP53, CDKN2A, PDK1, CDK6,
CDK4), and those with low scores are depicted in yellow (LOXL2,
MDM2, CP, RB1CC1, AOC3). (C) As one of the 10 candidate genes for
cuproptosis in LUAD cells, CDKN2A was a gene with a high score and
was thus selected as the hub gene. (D) Survival analysis of OS in
The Cancer Genome Atlas-LUAD cohort focused on CDKN2A (high, n=126;
low n=376). (E-G) KM plotter analysis revealed an association
between high expression levels of CDKN2A and poor OS. (H-J)
Elevated expression of CDKN2A predicted adverse progression-free
survival, as evidenced by the KM plotter analysis. (K-M) High
expression of CDKN2A indicated unfavorable first progression, as
illustrated through the KM plotter analysis. KM, Kaplan-Meier; PPI,
protein-protein interaction; OS, overall survival; LUAD, lung
adenocarcinoma; CDKN2A, CDK inhibitor 2A; HR, hazard ratio; MTS1,
multiple tumor suppressor 1. |
Knockdown of CDKN2A inhibits
proliferation and migration of LUAD cells
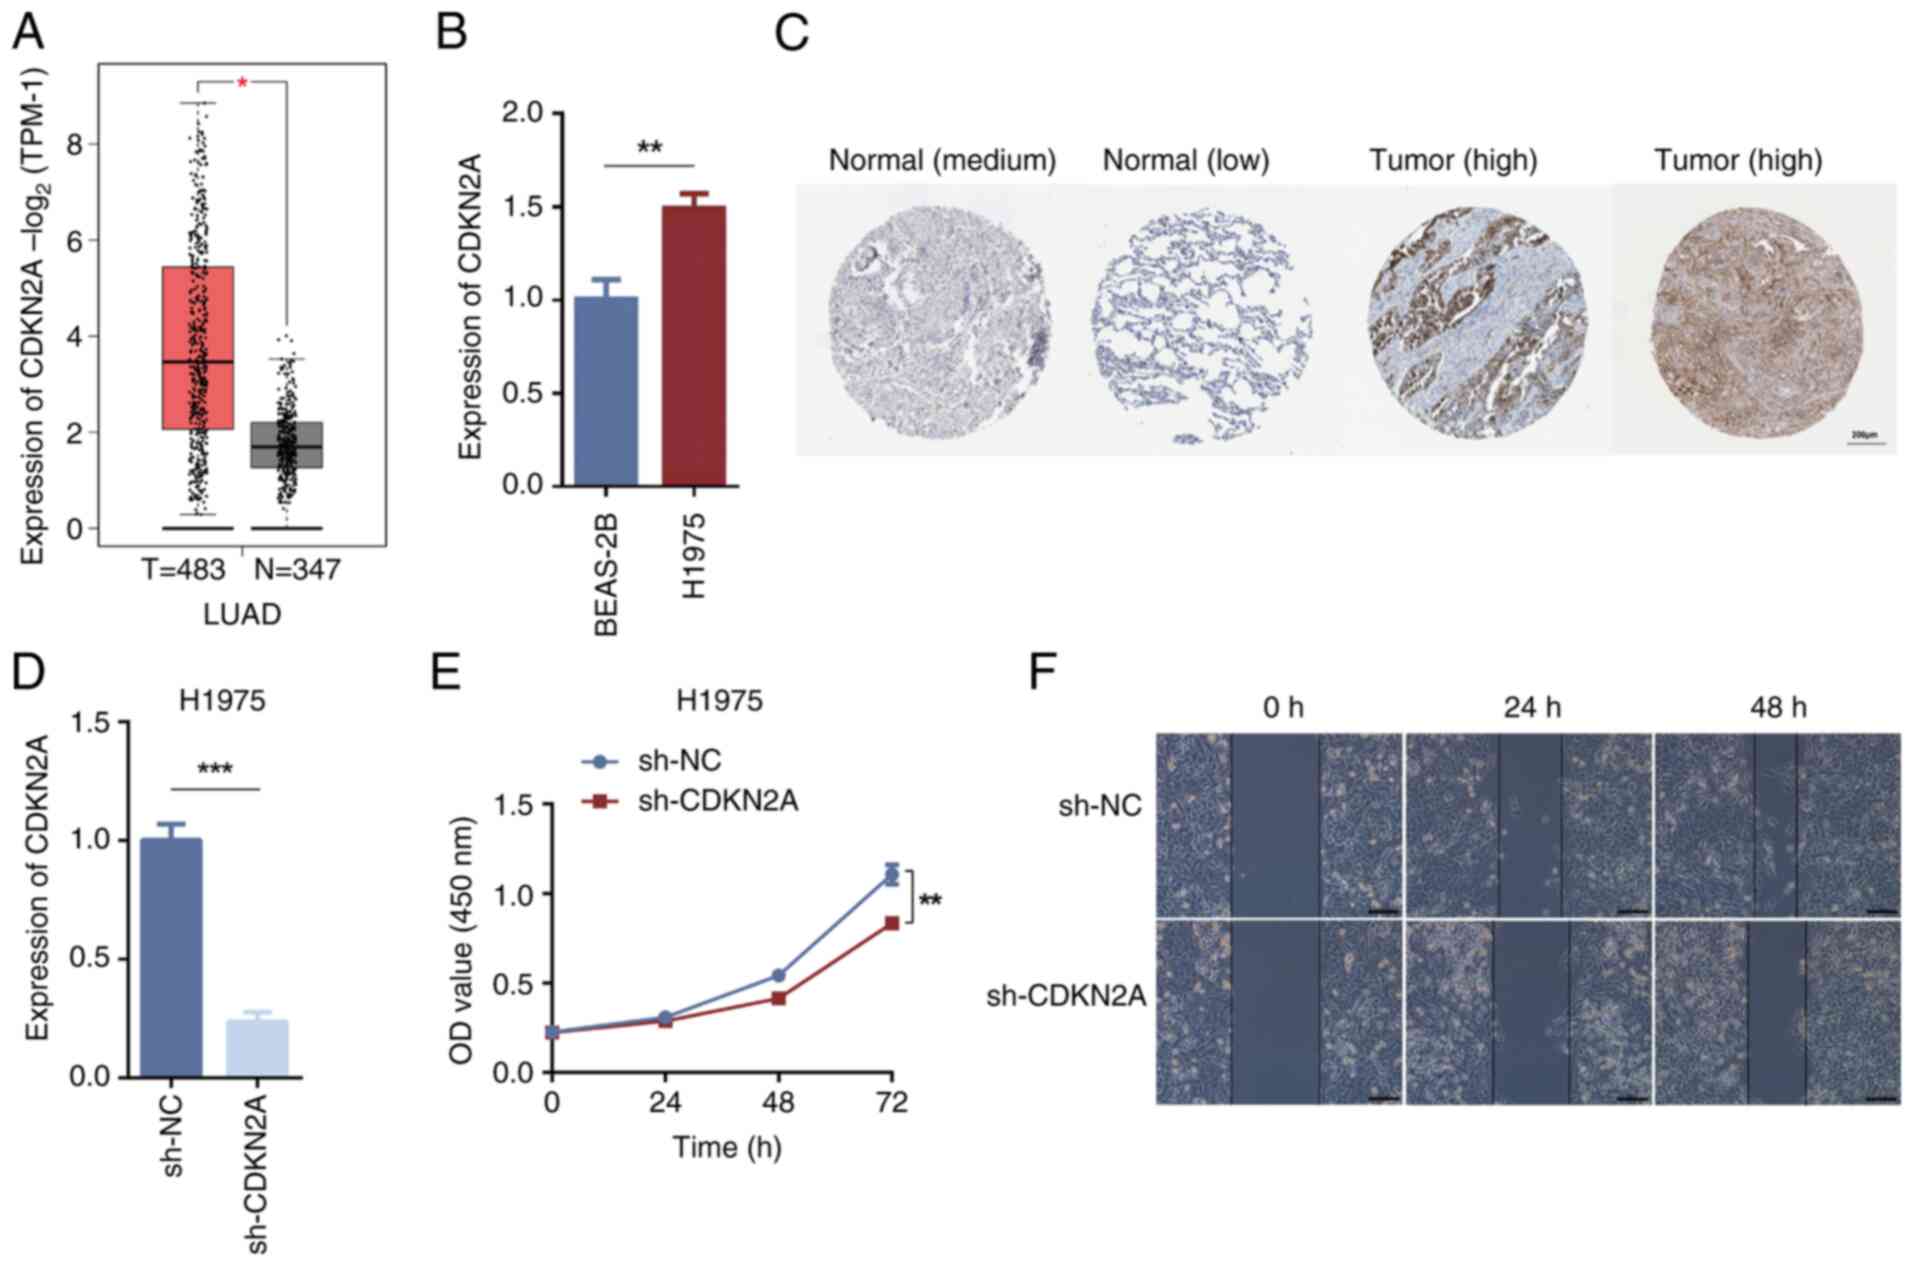
The GEPIA database predicted the clinical specimen
tissue expression levels of CDKN2A between LUAD tissues and normal
tissues. The results indicated that CDKN2A was significantly
upregulated in LUAD tissues compared with in normal tissues
(Fig. 3A). RT-qPCR validation
revealed that the mRNA expression levels of CDKN2A in H1975 cells
were significantly higher compared with those in BEAS-2B cells
(Fig. 3B). The HPA database was
utilized to assess and verify the presence of protein differences
between normal lung tissues and LUAD tissues for CDKN2A, further
confirming its role in LUAD tissues; the results revealed that
CDKN2A protein expression was increased in LUAD tissues than in
normal tissues (Fig. 3C). Following
the knockdown of CDKN2A in H1975 cells using sh-CDKN2A, RT-qPCR
validation of knockdown efficiency demonstrated that the expression
levels of CDKN2A in the sh-CDKN2A group were significantly lower
compared with those in the sh-NC group (Fig. 3D). The CCK-8 assay showed that
CDKN2A knockdown inhibited cell proliferation (Fig. 3E). The wound healing assay assessing
cell migration demonstrated reduced migratory ability of H1975
cells after CDKN2A knockdown (Fig.
3F). These findings indicated that CDKN2A knockdown may inhibit
the proliferative and migratory capacity of H1975 cells.
Co-expression network and gene
enrichment analysis of CDKN2A in LUAD
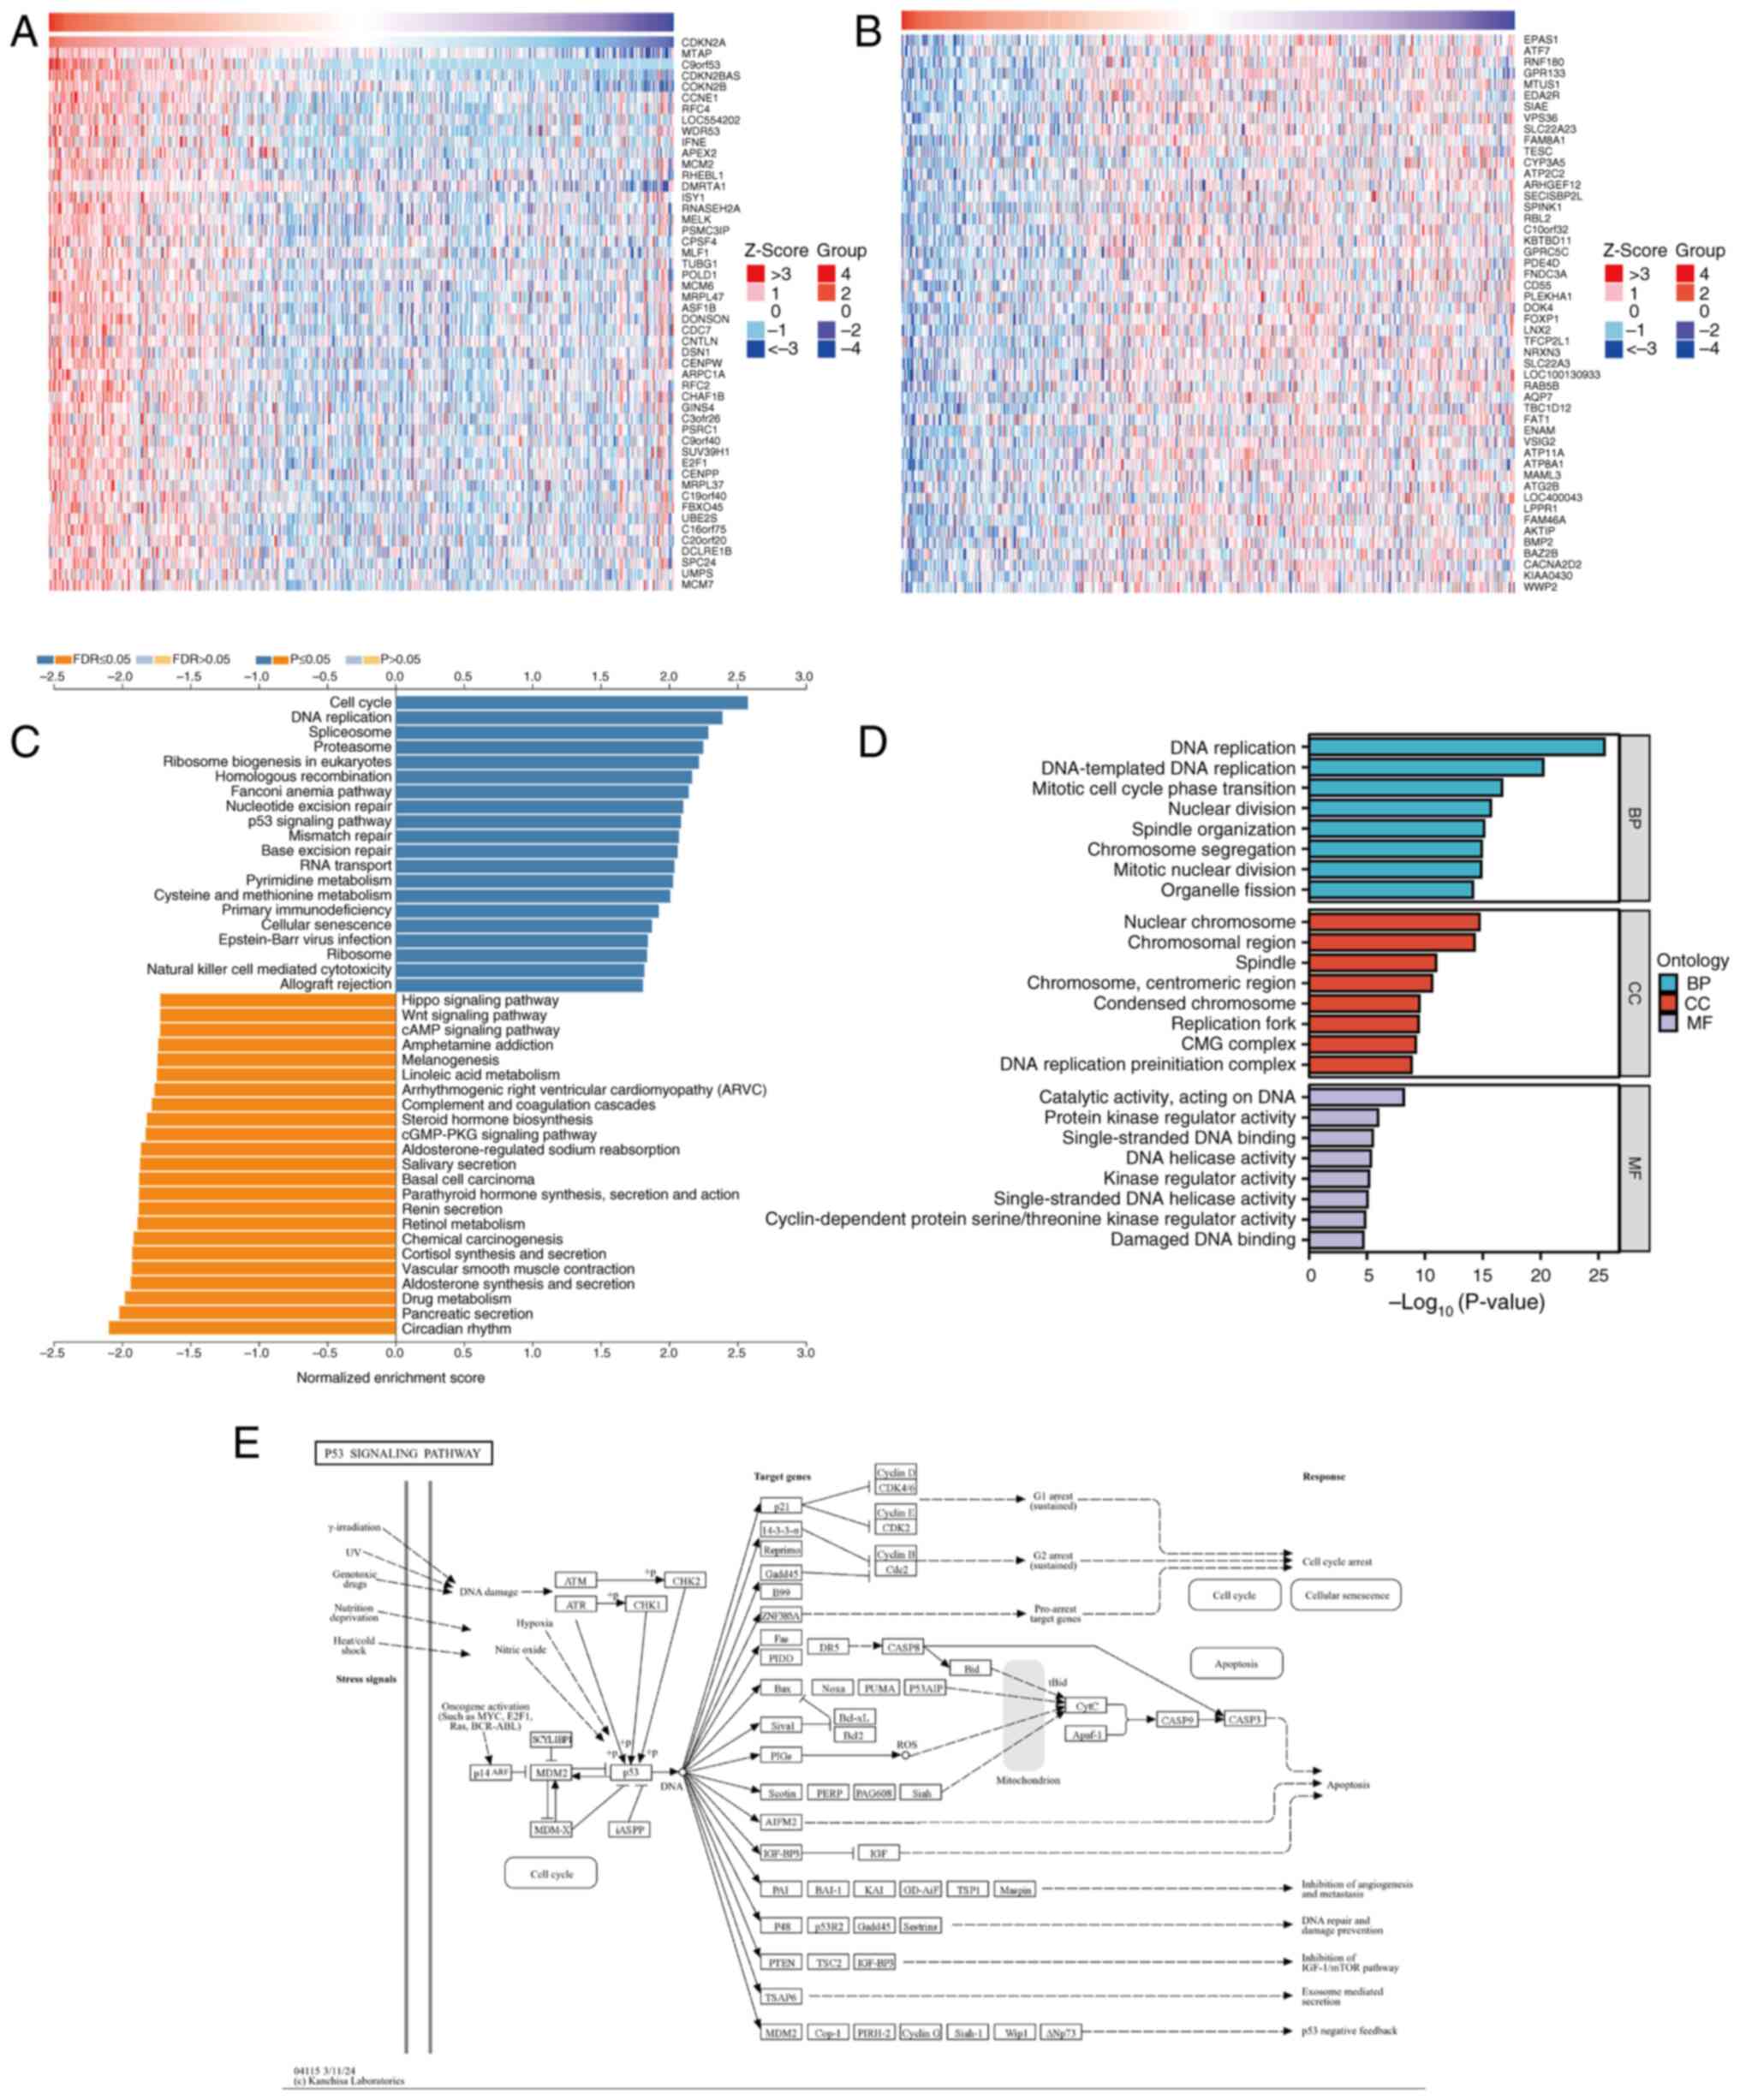
To investigate the potential functions and
mechanisms of CDKN2A in LUAD, analysis of CDKN2A co-expressed genes
was performed using LinkedOmics on RNA-seq data from patients with
LUAD in TCGA database. The resulting gene correlation heatmap
analysis revealed that CDKN2A expression was positively correlated
with the top 50 genes, including MTAP, CDKN2B, CCNE1 and RFC4
(Fig. 4A), and was negatively
correlated with the top 50 genes, such as EPAS1, ATF7, MTUS1 and
SIAE (Fig. 4B). Subsequently, the
KEGG pathways and GO terms enriched in the co-expressed genes of
CDKN2A were analyzed. The KEGG pathway analysis indicated that the
co-expressed genes of CDKN2A primarily participated in the ‘cell
cycle’, ‘DNA replication’, ‘p53 signaling pathway’ and ‘cAMP
signaling pathway’ (Fig. 4C), All
mentioned KEGG pathways were P<0.05. The GO functional analysis
revealed that CDKN2A co-expressed genes participated in biological
processes such as ‘DNA replication’ and ‘DNA-templated DNA
replication’; cellular components such as ‘nuclear chromosome’,
‘chromosomal region’ and ‘spindle’; and molecular functions
including ‘catalytic activity, acting on DNA’, ‘protein kinase
regulator activity’ and ‘single-stranded DNA binding’ (Fig. 4D). All mentioned GO terms were
P<0.05. The p53 pathway related to cuproptosis was selected for
further study with FDR<0.05. Further exploration of the KEGG
database demonstrated that CDKN2A exerts its effects by regulating
different genes through the p53 pathway (Fig. 4E).
SPI1 regulates CDKN2A to affect
cuproptosis in LUAD cells
Utilizing the hTFtarget database, 17 potential
co-TFs were predicted for nine CRGs, including AOC3, ULK2, SLC31A2,
PDK1, CP, GCSH, COA6, LOXL2 and H3C1 (Fig. 5A). A total of 25 common TFs were
identified for CDKN2A by integrating data from the ENCODE,
hTFtarget, Cistrome, TCGA-LUAD and GTEx Lung databases (Fig. 5B). The intersection of these two
predicted TF sets suggested that SPI1 and SRF might serve roles in
the transcriptional regulation of CDKN2A (Fig. 5C). Prognostic survival analysis of
SPI1 and SRF using the UALCAN database revealed that SRF did not
show prognostic significance (P=0.74; Fig. 5D). By contrast, the prognostic
survival analysis of SPI1 revealed a statistically significant
difference between the high and low expression groups; notably, the
prognosis of the low expression group was poor (P=0.016; Fig. 5E).
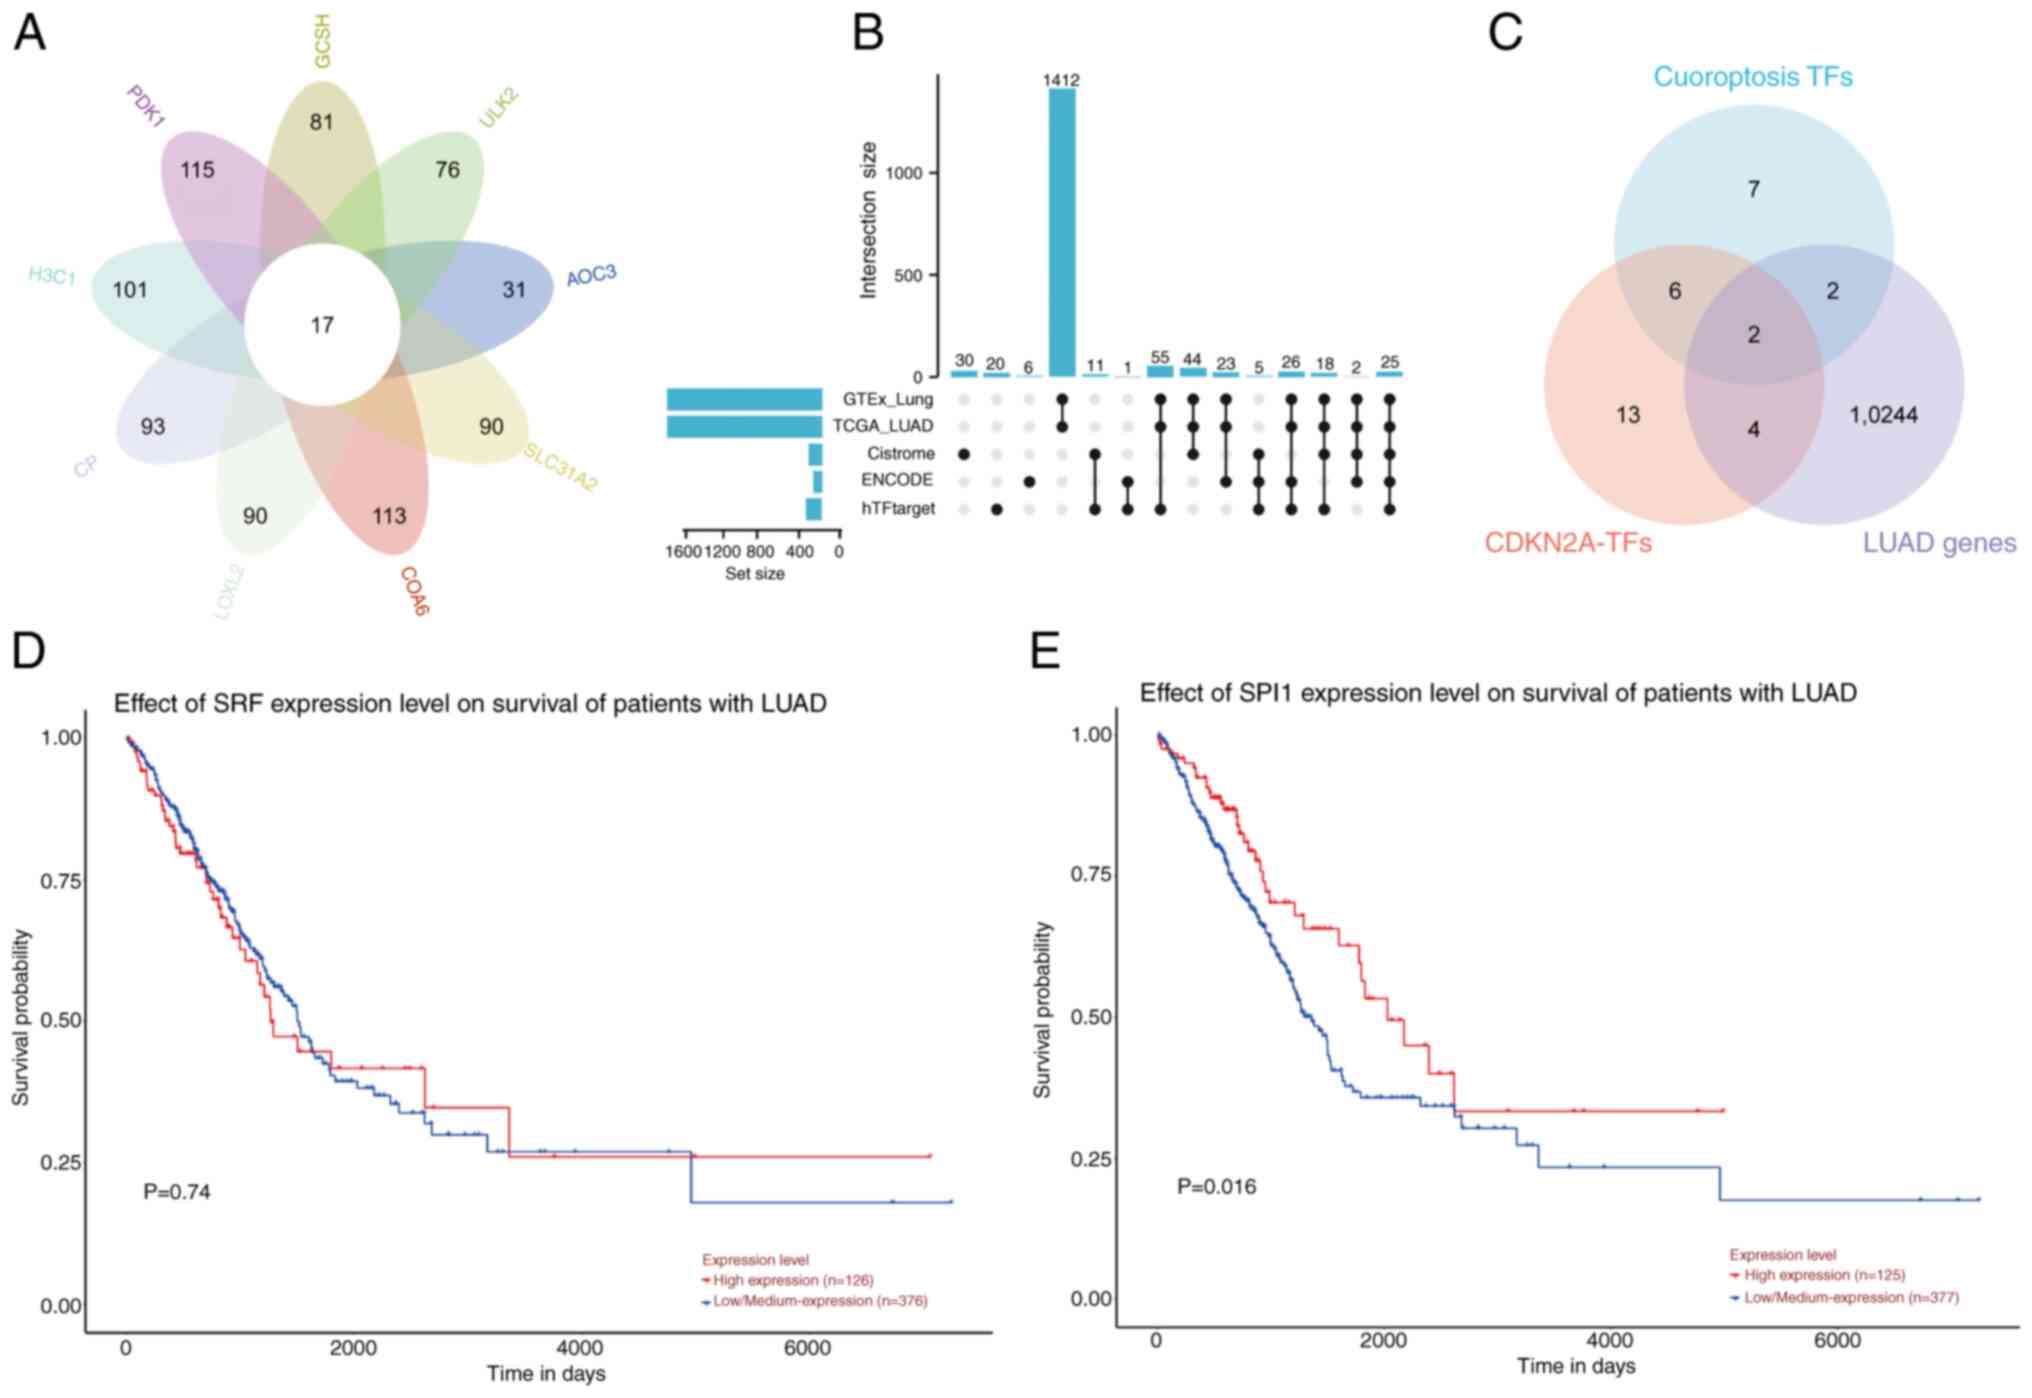 | Figure 5.SPI1 regulates CDKN2A expression to
affect cuproptosis in LUAD cells. (A) Venn diagram of potential
upstream TFs for CRGs. (B) UpSet plot displaying the 25 potential
TFs regulating CDKN2A in LUAD by different databases. (C) Venn
diagram of potential TFs of CRGs and CDKN2A in LUAD. (D) OS
analysis of SRF expression in LUAD, with P>0.05 indicating no
statistical significance (high, n=126; low, n=376). (E) OS analysis
of SPI1 expression in LUAD, with P<0.05 indicating statistical
significance (high, n=125; low, n=377). SPI1, Spi-1 proto-oncogene;
CDKN2A, CDK inhibitor 2A; LUAD, lung adenocarcinoma; TFs,
transcription factors; CRGs, cuproptosis-related genes; OS, overall
survival; TCGA, The Cancer Genome Atlas. |
Overexpression of SPI1 inhibits
proliferation and migration in LUAD cells
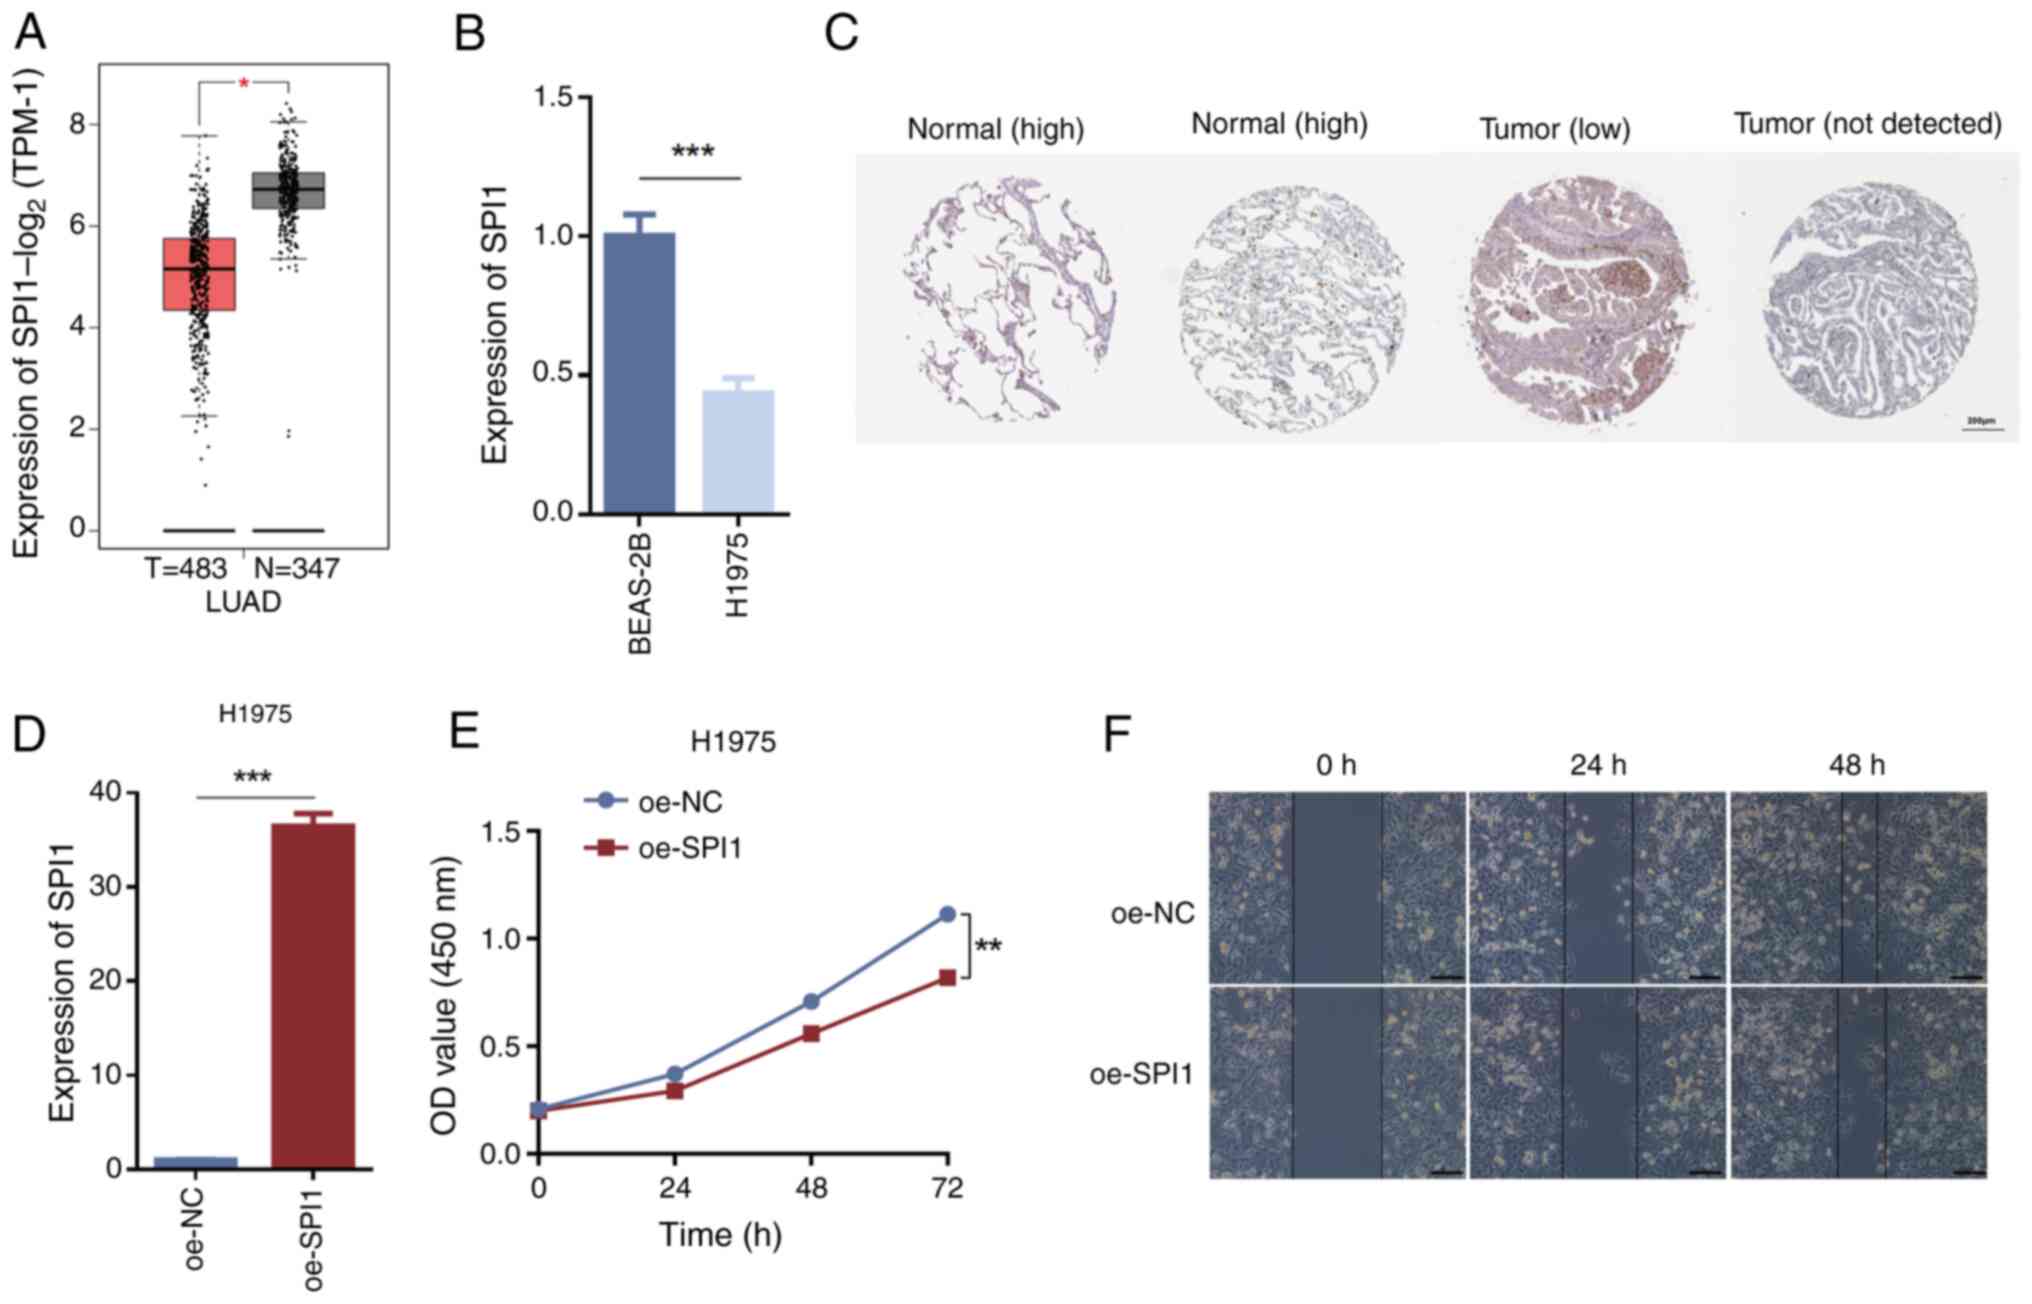
The tissue expression level predictions from
clinical specimens revealed significant differences in SPI1
expression between normal and LUAD tissues, with LUAD tissues
exhibiting lower SPI1 expression levels compared with normal
tissues (Fig. 6A). RT-qPCR
validation demonstrated that SPI1 expression in H1975 cells was
significantly lower compared with that in BEAS-2B cells (Fig. 6B). Furthermore, the HPA database was
utilized to assess and validate the differential SPI1 protein
levels between normal lung tissues and LUAD tissues, highlighting
its role in LUAD; the results indicated that SPI1 protein
expression was lower in LUAD tissues than in normal tissues
(Fig. 6C). Following the
overexpression of SPI1 in H1975 cells using oe-SPI1, RT-qPCR
analysis revealed a significant increase in SPI1 expression levels
in the oe-SPI1 group compared with those in the oe-NC group
(Fig. 6D). CCK-8 assays evaluating
cell viability indicated that SPI1 overexpression inhibited cell
proliferation (Fig. 6E). Wound
healing assays assessing cell migration demonstrated reduced
migration of H1975 cells in the oe-SPI1 group compared with that in
the oe-NC group (Fig. 6F). These
findings indicated that high SPI1 expression may inhibit cell
proliferation and migration.
Overexpression of SPI1 and knockdown
of CDKN2A sensitizes LUAD cells to cuproptosis inducers
A cuproptosis induction model was established
(Fig. 7A) to investigate whether
the expression of SPI1 and CDKN2A is influenced by cuproptosis. The
results indicated that ES-CuCl2 induced cuproptosis
leading to significant upregulation of SPI1 expression and
downregulation of CDKN2A expression. However, when H1975 cells were
pretreated with TTM, the upregulation of SPI1 was inhibited and the
downregulation of CDKN2A was also suppressed (Fig. 7B). Furthermore, the sensitivity of
H1975 cells to cuproptosis activators was assessed after knocking
down CDKN2A or overexpressing SPI1 to explore the roles of SPI1 and
CDKN2A in LUAD cuproptosis. CCK-8 assay results demonstrated that
SPI1 overexpression (Fig. 7C) and
CDKN2A knockdown (Fig. 7D) promoted
ES-CuCl2-induced cuproptosis in H1975 cells.
SPI1/CDKN2A/p53 signaling pathway
regulates cuproptosis in LUAD cells
Through integrated analysis of lung tissue data from
TCGA-GTEx, boxplots showed statistically significant differences in
SPI1 (Fig. 8A), CDKN2A (Fig. 8B) and TP53 (Fig. 8C) expression (P<0.001) between
normal lung tissues and LUAD tissues. The expression levels of SPI1
were significantly lower in LUAD tissues than those in normal
tissues, whereas the expression levels of CDKN2A and p53 were
significantly higher in LUAD tissues than those in normal tissues.
The GEPIA database was used to predict the correlations between
genes to demonstrate the regulatory association within the
SPI1/CDKN2A/p53 signaling axis. The results showed that SPI1, as a
TF, was negatively correlated with CDKN2A (P<0.01; Fig. 8D) and TP53 (P<0.01; Fig. 8E), whereas CDKN2A was positively
correlated with TP53 (P<0.01; Fig.
8F). Notably, the correlations between SPI1 and CDKN2A, and
between CDKN2A and p53 were considered weak (r-values
<0.3/-0.3). Therefore, western blot analysis was performed for
verification. The overexpression of SPI1 in H1975 cells resulted in
decreased protein levels of CDKN2A and p53 (Fig. 8G), and the knockdown of CDKN2A
decreased p53 protein levels (Fig.
8H). These findings suggested that SPI1 may promote the
cuproptosis of LUAD cells. Whereas CDKN2A and p53 as
anti-cuproptosis genes can inhibit the cuproptosis of LUAD, SPI1
can decrease the content of CDKN2A and p53 thereby affecting the
cuproptosis of LUAD cells. Based on the discovered gene pathway
association, SPI1 may promote cuproptosis in LUAD cells by
negatively regulating CDKN2A and p53.
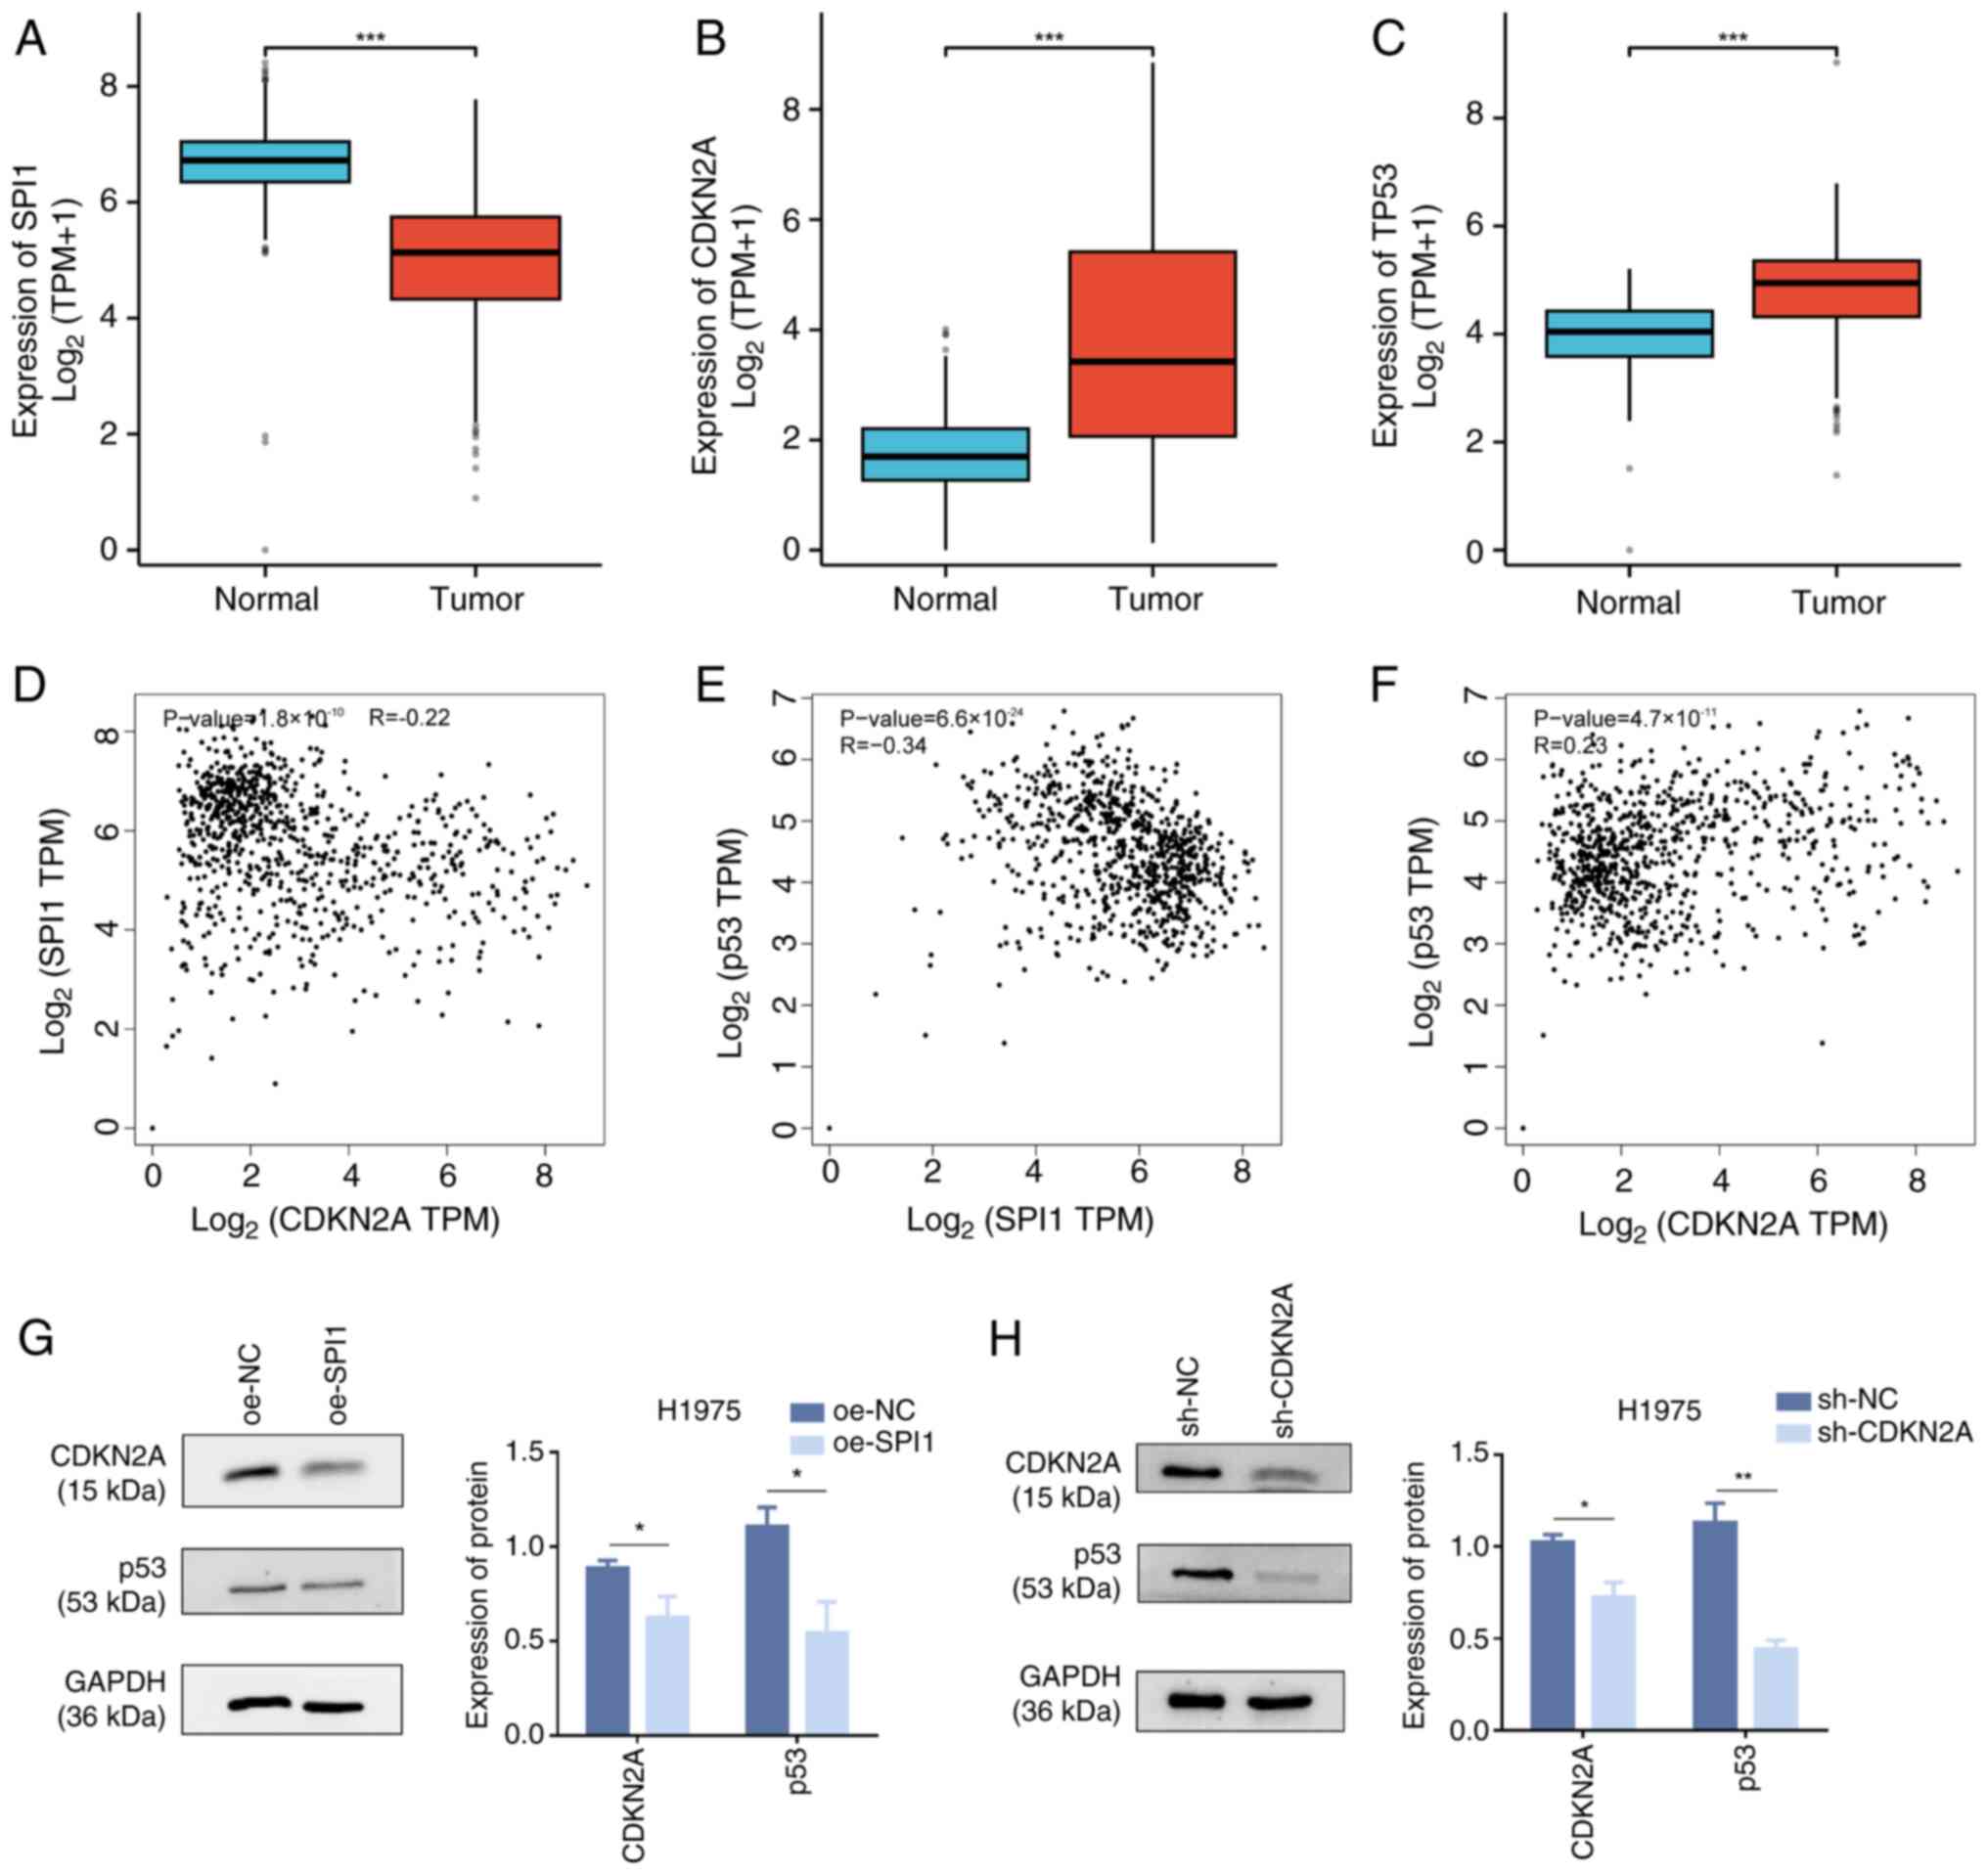 | Figure 8.Regulation of cuproptosis in LUAD
cells by the SPI1/CDKN2A/p53 signaling axis. Analysis of data from
The Cancer Genome Atlas in conjunction with Genotype-Tissue
Expression to validate the statistical significance of (A) SPI1,
(B) CDKN2A and (C) TP53 in tumor (n=515) and normal (n=347)
tissues. (D) Negative correlation between SPI1 and CDKN2A
co-expression in LUAD, with an R value of −0.22. (E) Negative
correlation between SPI1 and TP53 co-expression in LUAD, with an R
value of −0.34. (F) Positive correlation between CDKN2A and TP53
co-expression in LUAD, with an R value of 0.23. (G) Western blot
analysis of CDKN2A, p53 and GAPDH protein expression in H1975 cells
following oe-SPI1 transfection. (H) Western blot analysis of p53
and GAPDH protein expression in H1975 cells after the knockdown of
CDKN2A. *P<0.05; **P<0.01; ***P<0.001. LUAD, lung
adenocarcinoma; SPI1, SPI1 proto-oncogene; CDKN2A, CDK inhibitor
2A; oe, overexpression; sh, short hairpin; NC, negative control;
TPM, transcripts per million. |
Discussion
Copper, a ubiquitous transition metal element,
exhibits notable redox properties in its ionic form within
biological systems. Copper ions participate in numerous biochemical
reactions by donating or accepting electrons. Imbalances in copper
ion concentrations can lead to oxidative stress reactions and
abnormal autophagy, thereby triggering various copper- or copper
ion-associated diseases, such as Menkes disease, Wilson's disease,
neurodegenerative diseases, anemia, metabolic syndrome,
cardiovascular diseases and cancer (7,40,41).
Tsvetkov et al (8) proposed
the concept of cuproptosis and identified 13 CRGs, with the primary
targets including seven positive regulators: FDX1, LIAS, LIPT1,
DLD, DLAT, PDHA1 and PDHB, and three negative regulators: MTF1,
GLS, and CDKN2A. Previous research has explored the functions and
importance of CRGs. For example, under the manipulation of
mitochondrial Fe-S cluster proteins and FDX1, excessive
intracellular copper reduces Cu2+ to the highly toxic
Cu+ form by participating in energy metabolism and DNA
synthesis. ES, a copper ionophore, directly acts on FDX1 to
facilitate efficient copper transport into cells. DLAT, a component
of the PDH complex, promotes disulfide-dependent aggregation of
lipoylated DLAT (42). The
expression and mechanisms of CRGs in tumors are complex, and the
functions of other CRGs remain to be elucidated.
The present study, through bioinformatics analysis,
identified CDKN2A as a crucial gene in cuproptosis of LUAD, with
SPI1 as its upstream cuproptosis-related TF and p53 as its
downstream cuproptosis-related pathway. The expression and
functions of relevant genes were validated through RT-qPCR, CCK-8
assays, western blotting and cuproptosis-related experiments. The
high expression of CDKN2A in LUAD was associated with a poor
prognosis for patients. CDKN2A is the most frequently somatically
mutated cuproptosis regulator, and its abnormal status is
associated with tumorigenesis and progression (43). CDKN2A is highly expressed in most
tumor cells, and upregulation of this gene markedly affects the
cell cycle and other cellular functions, potentially leading to
cancer progression and poor prognosis for patients. This makes
CDKN2A a potential prognostic biomarker (15,44,45),
although the specific mechanisms underlying its association with
poor prognosis remain unclear. Previous research reported that
CDKN2A and MTF1 are cuproptosis-associated differential genes in
LUAD, exhibiting differential expression across immune subtypes
(45). The expression levels of
CDKN2A and MTF1 are associated with various functional states of
LUAD. Notably, CDKN2A demonstrates a negative association with
survival prognosis in LUAD; therefore, intervention strategies
targeting CDKN2A and MTF1 in LUAD, as well as potential combination
therapies, should be the focus of future research endeavors
(45). CDKN2A may adversely affect
the prognosis of certain tumors by inhibiting cuproptosis activity
and may be influenced by other cuproptosis-related regulators.
Therefore, targeted therapy addressing multiple cuproptosis
regulators, including CDKN2A, may yield notable synergistic
effects. This hypothesis requires extensive basic and clinical
research for validation (24).
Previous studies have used the CCK-8 assay to measure cell
viability at indicated time points after ES-Cu (1:1 ratio) pulse
treatment in fresh medium, and to assess sensitivity of cells to
ES-CuCl2 after gene overexpression or knockdown
(46–48). In the present study, after
cuproptosis was induced with ES-CuCl2, CDKN2A expression
was downregulated, whereas pretreatment with TTM inhibited this
downregulation. Additionally, knocking down CDKN2A increased the
sensitivity of LUAD cells to cuproptosis. Further studies are
needed to determine how CDKN2A regulates cellular cuproptosis.
SPI1, also known as PU.1, was identified as the
upstream regulator of CDKN2A in LUAD cuproptosis. It was initially
isolated by Moreau-Gachelin et al (49) from Friend erythroleukemia and
belongs to the erythroblast transformation-specific family of TFs.
Prior studies have demonstrated the tumor suppressor role of SPI1
in classical Hodgkin lymphoma cells and non-Hodgkin lymphoma cells
by modulating the cell cycle and apoptosis (50,51).
The present analysis highlighted the importance of SPI1 as a
prognostic TF for CDKN2A in LUAD cuproptosis, by negatively
regulating CDKN2A activity. SPI1 was identified as a common TF for
CDKN2A and a cuproptosis gene set in LUAD, aligning with the
findings of Huo et al (48),
which demonstrated that the upregulation of SLC3A1, induced by
ATF3/SPI1, facilitates the excessive accumulation of advanced
glycation end products and copper in diabetic cardiomyocytes,
thereby disrupting copper homeostasis and promoting cuproptosis.
The Epstein-Barr virus nuclear antigen 3C binds to BATF/IRF4 or
SPI1/IRF4 complex sites, thereby recruiting Sin3A to suppress
CDKN2A; however, the direct regulatory mechanisms remain to be
elucidated (52). Current research
on the role of SPI1 in cuproptosis and LUAD is limited. However,
predictive analyses across multiple databases identified
transcriptional regulation of CDKN2A by SPI1, which was further
assessed through western blotting. Upon ES-CuCl2-induced
cuproptosis, SPI1 expression was upregulated, whereas pretreatment
with the copper chelator TTM suppressed this upregulation.
Furthermore, cell proliferation assays demonstrated that SPI1
overexpression promoted ES-CuCl2-induced cuproptosis,
corroborating its role in LUAD cells.
The KEGG pathway enrichment analysis revealed the
association of CDKN2A with cancer-associated pathways, including
p53 signaling, DNA replication and cell cycle signaling. In >25
cancer types, cuproptosis is inversely associated with cellular
mechanisms such as apical junctions, mitotic spindle function,
epithelial-mesenchymal transition, transforming growth factor-β
signaling and p53 function, suggesting its potential as a target
for tumor metastasis and growth inhibition (24). The tumor suppressor p53 is a key
metabolic regulator. Previous evidence has highlighted the role of
p53 in reshaping cancer energy metabolism, mediating the shift from
glycolysis to oxidative phosphorylation, enhancing Fe-S cluster
biogenesis and coordinating copper chelator GSH levels. This
finding indicated the dual function of p53 in promoting or
inhibiting cuproptosis under various stress conditions. Mutant p53
enhances glycolysis, inhibits oxidative phosphorylation and
modulates lipid metabolism through several mechanisms, potentially
fortifying cancer cells against cuproptosis (53). As a central regulator of apoptosis
by transcribing multiple apoptotic target genes, copper enhances
the transcriptional activity of p53 to induce apoptosis (54). Furthermore, Tschan et al
(55) found that SPI1 can impair
the transcriptional activity of p53 by binding to specific regions,
thereby modulating the cell cycle and apoptosis. The
SPI1/CDKN2A/p53 regulatory network has notable implications for
understanding tumorigenesis, cellular metabolism and cuproptosis,
warranting further investigation.
In conclusion, the present study identified a
signaling pathway regulating cuproptosis mechanisms in LUAD through
the integration of public database resources, and validated it
through cellular experiments. Furthermore, the specific role of the
SPI1/CDKN2A/p53 signaling axis in modulating cuproptosis processes
was evaluated in LUAD cells. The present study revealed that after
copper induces cuproptosis in H1975 cells, SPI1 expression may be
upregulated, whereas CDKN2A expression is downregulated. When H1975
cells were pretreated with TTM, the upregulation of SPI1 was
revealed to be inhibited and the downregulation of CDKN2A was also
suppressed. Based on gene pathway associations, SPI1 could promote
cuproptosis in LUAD cells by inhibiting the expression of CDKN2A
and p53. Thus, the present study established a theoretical
foundation for further explorations in the field of cuproptosis.
Nonetheless, the present research relies on widely used public data
resources and no clinical studies were performed. Furthermore, in
addition to affecting CDKN2A and p53, and thus influencing
cuproptosis in LUAD cells, other mechanisms of SPI1 on cuproptosis
remain to be explored. Therefore, future endeavors should integrate
clinical validations to ensure the comprehensiveness and accuracy
of the findings, and the mechanisms underlying cuproptosis require
further analysis.
Acknowledgements
Not applicable.
Funding
The present study was supported by The Natural Science
Foundation of Shandong Province (grant no. ZR2023MH223), The
National Natural Science Foundation of China (grant no. 32301062),
The Shandong Province Medical and health science and Technology
Plan (grant no. 202304020786) and The National College Students
Innovation and Entrepreneurship Training Program (grant no.
202310440029).
Availability of data and materials
The data generated in the present study may be
requested from the corresponding author.
Authors' contributions
YL and NX were involved in conceptualization. WS and
SL performed the formal analysis. QW and XF performed analysis and
interpretation of the data. WS and RW were involved in conception
and design of the study. BT, XL and JA performed some experiments.
JA and WS wrote the original draft. YL and NX confirm the
authenticity of all the raw data. All authors read and approved the
final version of the manuscript.
Ethical approval and consent to
participate
Not applicable.
Patient consent for publication
Not applicable.
Competing interests
The authors declare that they have no competing
interests.
References
|
1
|
Siegel RL, Giaquinto AN and Jemal A:
Cancer statistics, 2024. CA Cancer J Clin. 74:12–49. 2024.
View Article : Google Scholar : PubMed/NCBI
|
|
2
|
Chen P, Liu Y, Wen Y and Zhou C: Non-small
cell lung cancer in China. Cancer Commun (Lond). 42:937–970. 2022.
View Article : Google Scholar : PubMed/NCBI
|
|
3
|
Jurisic V, Vukovic V, Obradovic J,
Gulyaeva LF, Kushlinskii NE and Djordjević N: EGFR polymorphism and
survival of NSCLC patients treated with TKIs: A systematic review
and meta-analysis. J Oncol. 2020:19732412020. View Article : Google Scholar : PubMed/NCBI
|
|
4
|
Jiao G and Wang B: NK cell subtypes as
regulators of autoimmune liver disease. Gastroenterol Res Pract.
2016:69034962016. View Article : Google Scholar : PubMed/NCBI
|
|
5
|
Brand A, Singer K, Koehl GE, Kolitzus M,
Schoenhammer G, Thiel A, Matos C, Bruss C, Klobuch S, Peter K, et
al: LDHA-associated lactic acid production blunts tumor
immunosurveillance by T and NK cells. Cell Metab. 24:657–671. 2016.
View Article : Google Scholar : PubMed/NCBI
|
|
6
|
Ma Q, Jiang H, Ma L, Zhao G, Xu Q, Guo D,
He N, Liu H, Meng Z, Liu J, et al: The moonlighting function of
glycolytic enzyme enolase-1 promotes choline phospholipid
metabolism and tumor cell proliferation. Proc Natl Acad Sci USA.
120:e22094351202023. View Article : Google Scholar : PubMed/NCBI
|
|
7
|
Chen Y, Tang L, Huang W, Zhang Y, Abisola
FH and Li L: Identification and validation of a novel
cuproptosis-related signature as a prognostic model for lung
adenocarcinoma. Front Endocrinol (Lausanne). 13:9632202022.
View Article : Google Scholar : PubMed/NCBI
|
|
8
|
Tsvetkov P, Coy S, Petrova B, Dreishpoon
M, Verma A, Abdusamad M, Rossen J, Joesch-Cohen L, Humeidi R,
Spangler RD, et al: Copper induces cell death by targeting
lipoylated TCA cycle proteins. Science. 375:1254–1261. 2022.
View Article : Google Scholar : PubMed/NCBI
|
|
9
|
Mou Y, Wang J, Wu J, He D, Zhang C, Duan C
and Li B: Ferroptosis, a new form of cell death: Opportunities and
challenges in cancer. J Hematol Oncol. 12:342019. View Article : Google Scholar : PubMed/NCBI
|
|
10
|
D'Arcy MS: Cell death: A review of the
major forms of apoptosis, necrosis and autophagy. Cell Biol Int.
43:582–592. 2019. View Article : Google Scholar : PubMed/NCBI
|
|
11
|
Fang Y, Tian S, Pan Y, Li W, Wang Q, Tang
Y, Yu T, Wu X, Shi Y, Ma P and Shu Y: Pyroptosis: A new frontier in
cancer. Biomed Pharmacother. 121:1095952020. View Article : Google Scholar : PubMed/NCBI
|
|
12
|
Su Z, Yang Z, Xu Y, Chen Y and Yu Q:
Apoptosis, autophagy, necroptosis, and cancer metastasis. Mol
Cancer. 14:482015. View Article : Google Scholar : PubMed/NCBI
|
|
13
|
Tsvetkov P, Detappe A, Cai K, Keys HR,
Brune Z, Ying W, Thiru P, Reidy M, Kugener G, Rossen J, et al:
Mitochondrial metabolism promotes adaptation to proteotoxic stress.
Nat Chem Biol. 15:681–689. 2019. View Article : Google Scholar : PubMed/NCBI
|
|
14
|
Huang Y, Yin D and Wu L: Identification of
cuproptosis-related subtypes and development of a prognostic
signature in colorectal cancer. Sci Rep. 12:173482022. View Article : Google Scholar : PubMed/NCBI
|
|
15
|
Liu H and Tang T: Pan-cancer genetic
analysis of cuproptosis and copper metabolism-related gene set.
Front Oncol. 12:9522902022. View Article : Google Scholar : PubMed/NCBI
|
|
16
|
Da Silva DA, De Luca A, Squitti R,
Rongioletti M, Rossi L, Machado CML and Cerchiaro G: Copper in
tumors and the use of copper-based compounds in cancer treatment. J
Inorg Biochem. 226:1116342022. View Article : Google Scholar : PubMed/NCBI
|
|
17
|
Salem A, Ahmed S, Khalfallah M, Hamadan N,
ElShikh W and Alfaki M: A comprehensive pan-cancer analysis reveals
cyclin-dependent kinase inhibitor 2A gene as a potential diagnostic
and prognostic biomarker in colon adenocarcinoma. Cureus.
16:e605862024.PubMed/NCBI
|
|
18
|
Stott FJ, Bates S, James MC, McConnell BB,
Starborg M, Brookes S, Palmero I, Ryan K, Hara E, Vousden KH and
Peters G: The alternative product from the human CDKN2A locus,
p14(ARF), participates in a regulatory feedback loop with p53 and
MDM2. EMBO J. 17:5001–5014. 1998. View Article : Google Scholar : PubMed/NCBI
|
|
19
|
Liu MT, Liu JY and Su J: CDKN2A gene in
melanoma. Zhonghua Bing Li Xue Za Zhi. 48:909–912. 2019.(In
Chinese). PubMed/NCBI
|
|
20
|
Chen Y: Identification and validation of
cuproptosis-related prognostic signature and associated regulatory
axis in uterine corpus endometrial carcinoma. Front Genet.
13:9120372022. View Article : Google Scholar : PubMed/NCBI
|
|
21
|
Zhou Z, Zhou Y, Liu D, Yang Q, Tang M and
Liu W: Prognostic and immune correlation evaluation of a novel
cuproptosis-related genes signature in hepatocellular carcinoma.
Front Pharmacol. 13:10741232022. View Article : Google Scholar : PubMed/NCBI
|
|
22
|
Shi WK, Li YH, Bai XS and Lin GL: The cell
cycle-associated protein CDKN2A may promotes colorectal cancer cell
metastasis by inducing epithelial-mesenchymal transition. Front
Oncol. 12:8342352022. View Article : Google Scholar : PubMed/NCBI
|
|
23
|
Zhang D, Wang T, Zhou Y and Zhang X:
Comprehensive analyses of cuproptosis-related gene CDKN2A on
prognosis and immunologic therapy in human tumors. Medicine
(Baltimore). 102:e334682023. View Article : Google Scholar : PubMed/NCBI
|
|
24
|
Wu C, Tan J, Wang X, Qin C, Long W, Pan Y,
Li Y and Liu Q: Pan-cancer analyses reveal molecular and clinical
characteristics of cuproptosis regulators. Imeta. 2:e682022.
View Article : Google Scholar : PubMed/NCBI
|
|
25
|
Tomczak K, Czerwińska P and Wiznerowicz M:
The cancer genome atlas (TCGA): An immeasurable source of
knowledge. Contemp Oncol (Pozn). 19:A68–77. 2015.PubMed/NCBI
|
|
26
|
RStudio Team, . RStudio: Integrated
Development for R. RStudio, PBC; Boston, MA: 2020, http://www.rstudio.com/October 15–2023
|
|
27
|
Shen W, Song Z, Zhong X, Huang M, Shen D,
Gao P, Qian X, Wang M, He X, Wang T, et al: Sangerbox: A
comprehensive, interaction-friendly clinical bioinformatics
analysis platform. Imeta. 1:e362022. View Article : Google Scholar : PubMed/NCBI
|
|
28
|
Law CW, Chen Y, Shi W and Smyth GK: voom:
Precision weights unlock linear model analysis tools for RNA-seq
read counts. Genome Biol. 15:R292014. View Article : Google Scholar : PubMed/NCBI
|
|
29
|
Szklarczyk D, Gable AL, Nastou KC, Lyon D,
Kirsch R, Pyysalo S, Doncheva NT, Legeay M, Fang T, Bork P, et al:
The STRING database in 2021: Customizable protein-protein networks,
and functional characterization of user-uploaded gene/measurement
sets. Nucleic Acids Res. 49(D1): D605–D612. 2021. View Article : Google Scholar : PubMed/NCBI
|
|
30
|
Doncheva NT, Morris JH, Gorodkin J and
Jensen LJ: Cytoscape StringApp: Network analysis and visualization
of proteomics data. J Proteome Res. 18:623–632. 2019. View Article : Google Scholar : PubMed/NCBI
|
|
31
|
Chin CH, Chen SH, Wu HH, Ho CW, Ko MT and
Lin CY: cytoHubba: Identifying hub objects and sub-networks from
complex interactome. BMC Syst Biol. 8 (Suppl 4):S112014. View Article : Google Scholar : PubMed/NCBI
|
|
32
|
Tang Z, Kang B, Li C, Chen T and Zhang Z:
GEPIA2: An enhanced web server for large-scale expression profiling
and interactive analysis. Nucleic Acids Res. 47((W1)): W556–W560.
2019. View Article : Google Scholar : PubMed/NCBI
|
|
33
|
Uhlén M, Fagerberg L, Hallström BM,
Lindskog C, Oksvold P, Mardinoglu A, Sivertsson Å, Kampf C,
Sjöstedt E, Asplund A, et al: Proteomics. Tissue-based map of the
human proteome. Science. 347:12604192015. View Article : Google Scholar : PubMed/NCBI
|
|
34
|
Chandrashekar DS, Bashel B, Balasubramanya
SAH, Creighton CJ, Ponce-Rodriguez I, Chakravarthi BVSK and
Varambally S: UALCAN: A portal for facilitating tumor subgroup gene
expression and survival analyses. Neoplasia. 19:649–658. 2017.
View Article : Google Scholar : PubMed/NCBI
|
|
35
|
Nagy Á, Munkácsy G and Győrffy B:
Pancancer survival analysis of cancer hallmark genes. Sci Rep.
11:60472021. View Article : Google Scholar : PubMed/NCBI
|
|
36
|
Vasaikar SV, Straub P, Wang J and Zhang B:
LinkedOmics: Analyzing multi-omics data within and across 32 cancer
types. Nucleic Acids Res. 46(D1): D956–D963. 2018. View Article : Google Scholar : PubMed/NCBI
|
|
37
|
Kanehisa M, Araki M, Goto S, Hattori M,
Hirakawa M, Itoh M, Katayama T, Kawashima S, Okuda S, Tokimatsu T
and Yamanishi Y: KEGG for linking genomes to life and the
environment. Nucleic Acids Res. 36((Database Issue)): D480–D484.
2008.PubMed/NCBI
|
|
38
|
Wang S and Liu X: The UCSCXenaTools R
package: A toolkit for accessing genomics data from UCSC Xena
platform, from cancer multi-omics to single-cell RNA-seq. J Open
Source Softw. 4:16272019. View Article : Google Scholar
|
|
39
|
Livak KJ and Schmittgen TD: Analysis of
relative gene expression data using real-time quantitative PCR and
the 2(−Delta Delta C(T)) method. Methods. 25:402–408. 2001.
View Article : Google Scholar : PubMed/NCBI
|
|
40
|
Linder MC and Hazegh-Azam M: Copper
biochemistry and molecular biology. Am J Clin Nutr. 63:797S–811S.
1996. View Article : Google Scholar : PubMed/NCBI
|
|
41
|
Li Y and Trush MA: DNA damage resulting
from the oxidation of hydroquinone by copper: Role for a
Cu(II)/Cu(I) redox cycle and reactive oxygen generation.
Carcinogenesis. 14:1303–1311. 1993. View Article : Google Scholar : PubMed/NCBI
|
|
42
|
Duan WJ and He RR: Cuproptosis:
Copper-induced regulated cell death. Sci China Life Sci.
65:1680–1682. 2022. View Article : Google Scholar : PubMed/NCBI
|
|
43
|
Wang H, Liu J, Zhu S, Miao K, Li Z, Qi X,
Huang L, Guo L, Wang Y, Cai Y and Lin Y: Comprehensive analyses of
genomic features and mutational signatures in adenosquamous
carcinoma of the lung. Front Oncol. 12:9458432022. View Article : Google Scholar : PubMed/NCBI
|
|
44
|
Ichikawa K, Imura J, Kawamata H, Takeda J
and Fujimori T: Down-regulated p16 expression predicts poor
prognosis in patients with extrahepatic biliary tract carcinomas.
Int J Oncol. 20:453–461. 2002.PubMed/NCBI
|
|
45
|
Li M, Tan Y, Li Z and Min L: Biological
characterization and clinical significance of cuproptosis-related
genes in lung adenocarcinoma. BMC Pulm Med. 25:132025. View Article : Google Scholar : PubMed/NCBI
|
|
46
|
Yu YH, Li HJ, Yang XY, Yu LY and Tong XM:
Elesclomol-Cu induces cuproptosis in human acute myeloid leukemia
cells. Zhongguo Shi Yan Xue Ye Xue Za Zhi. 32:389–394.
2024.PubMed/NCBI
|
|
47
|
Chen Y, Tang L, Huang W, Abisola FH, Zhang
Y, Zhang G and Yao L: Identification of a prognostic
cuproptosis-related signature in hepatocellular carcinoma. Biol
Direct. 18:42023. View Article : Google Scholar : PubMed/NCBI
|
|
48
|
Huo S, Wang Q, Shi W, Peng L, Jiang Y, Zhu
M, Guo J, Peng D, Wang M, Men L, et al: ATF3/SPI1/SLC31A1 signaling
promotes cuproptosis induced by advanced glycosylation end products
in diabetic myocardial injury. Int J Mol Sci. 24:16672023.
View Article : Google Scholar : PubMed/NCBI
|
|
49
|
Moreau-Gachelin F, Tavitian A and
Tambourin P: Spi-1 is a putative oncogene in virally induced murine
erythroleukaemias. Nature. 331:277–280. 1988. View Article : Google Scholar : PubMed/NCBI
|
|
50
|
Yuki H, Ueno S, Tatetsu H, Niiro H, Iino
T, Endo S, Kawano Y, Komohara Y, Takeya M, Hata H, et al: PU.1 is a
potent tumor suppressor in classical Hodgkin lymphoma cells. Blood.
121:962–970. 2013. View Article : Google Scholar : PubMed/NCBI
|
|
51
|
Endo S, Nishimura N, Toyoda K, Komohara Y,
Carreras J, Yuki H, Shichijo T, Ueno S, Ueno N, Hirata S, et al:
Decreased PU.1 expression in mature B cells induces
lymphomagenesis. Cancer Sci. 115:3890–3901. 2024. View Article : Google Scholar : PubMed/NCBI
|
|
52
|
Jiang S, Willox B, Zhou H, Holthaus AM,
Wang A, Shi TT, Maruo S, Kharchenko PV, Johannsen EC, Kieff E and
Zhao B: Epstein-Barr virus nuclear antigen 3C binds to BATF/IRF4 or
SPI1/IRF4 composite sites and recruits Sin3A to repress CDKN2A.
Proc Natl Acad Sci USA. 111:421–426. 2014. View Article : Google Scholar : PubMed/NCBI
|
|
53
|
Xiong C, Ling H, Hao Q and Zhou X:
Cuproptosis: p53-regulated metabolic cell death? Cell Death Differ.
30:876–884. 2023. View Article : Google Scholar : PubMed/NCBI
|
|
54
|
Xue Q, Kang R, Klionsky DJ, Tang D, Liu J
and Chen X: Copper metabolism in cell death and autophagy.
Autophagy. 19:2175–2195. 2023. View Article : Google Scholar : PubMed/NCBI
|
|
55
|
Tschan MP, Reddy VA, Ress A, Arvidsson G,
Fey MF and Torbett BE: PU.1 binding to the p53 family of tumor
suppressors impairs their transcriptional activity. Oncogene.
27:3489–3493. 2008. View Article : Google Scholar : PubMed/NCBI
|