Introduction
Renal cell carcinoma (RCC), which originates from
the tubular epithelial cells of the kidney, ranks among the ten
most prevalent types of cancer globally and represent >90% of
all renal cancer types. The most prevalent subtype of RCC is clear
cell RCC (ccRCC), which accounts for 75–85% of cases (1). Recent statistics indicate that there
were 434,419 newly diagnosed cases of RCC worldwide in 2022,
accounting for 2.2% of all cancer cases, and 155,702 deaths from
RCC, representing 1.6% of all cancer deaths (2). Although advancements in treatments
have significantly improved the survival and quality of life for
RCC patients, the prognosis for patients with advanced RCC remains
poor, as evidenced by a 12% 5-year overall survival (2,3).
Therefore, it is essential to focus on developing new treatment
methods and optimizing personalized treatment strategies to enhance
the prognostic outcomes for individuals suffering from advanced
RCC.
Transfer RNA (tRNA) is a fundamental type of RNA
molecule found in cells. The tRNA precursor produced through
transcription is initially non-functional and must undergo a series
of modifications and processing steps, facilitated by specific
enzymes, to mature and acquire biological functions (4). These modifications, primarily
catalyzed by tRNA modification enzymes, are crucial for tRNA's
stability, folding and function, thereby affecting the efficiency
and accuracy of protein translation (5). Other studies demonstrate that various
RNA modifications [such as N1-methyl adenosine (m1A),
5-methylcytosine (m5C) and N7-methylguanosine (m7G)] and
tRNA-modifying enzymes are often dysregulated in different types of
cancer, such as colorectal and breast cancer (5,6). For
example, m7G tRNA modification enhances the translation of
oncogenes that serve pivotal roles in cell cycle regulation and the
processes associated with the EGFR pathway (7). The dysregulation of tRNA-modifying
enzymes, including methyltransferase-like protein 1 (METTL1) and WD
Repeat Domain 4, is linked to poor prognosis in breast cancer and
nasopharyngeal carcinoma (8,9).
The tumor microenvironment (TME) is essential in
tumor progression and evolution (10). The TME comprises diverse cellular
entities, including vascular cells, cancer-associated fibroblasts
and infiltrating immune cells (11). These cells, in concert, orchestrate
a myriad of processes including angiogenesis, the tumor cells
invasion and evasion of growth-inhibitory factors, energy
metabolism, immune evasion, cell proliferation and apoptosis
(12–14). These functions are often executed in
a manner that transcends individual cellular autonomy (15). tRNA modifications regulate immune
cell function by affecting translation efficiency and accuracy. For
instance, TRMT61A-mediated m1A modification of tRNA promotes the
translation of key proteins (such as Myc) in CD4+ T
cells by regulating codon decoding, thus ensuring a rapid immune
response (16). Furthermore,
METTL1-mediated m7G tRNA modification enhances the infiltration of
cytotoxic immune cells into cancerous cells through the activating
effector genes of the IFN signaling pathway, thereby impacting the
TME (17). tRNA modification
systems directly support cancer cell phenotypes through
translational reprogramming, leading to increased proliferation,
metastatic potential and cancer stem cell survival (18). Based on the aforementioned studies,
it was hypothesized that the dysregulation of tRNA-related modified
gene expression affects TME by enhancing the infiltration of immune
cells, and thus promotes the occurrence and development of tumors.
Tumor progression and patient survival reflect complex cellular and
molecular interactions between the tumor and the host immune system
(19). However, to the best of our
knowledge, there is currently no reliable model to predict the
prognosis of patients with ccRCC based on tRNA modification
genes.
The present study aimed to apply univariate and
multivariate Cox regression analyses to develop a prognostic model
incorporating tRNA modification-related genes (TMRGs), in order to
enable independent evaluation of ccRCC prognosis using The Cancer
Genome Atlas (TCGA) database. Furthermore, the present study aimed
to investigate the development of a nomogram, predict chemotherapy
responses, perform somatic mutation analysis and functional
enrichment analysis to elucidate the probable underlying
mechanisms.
Materials and methods
Data acquisition and processing
techniques
Data on relevant clinical information, nucleotide
variations and mRNA expressions were obtained from the TCGA public
database. The dataset GSE29609 (20) was sourced from the Gene Expression
Omnibus (GEO) database (ncbi.nlm.nih.gov/). Leveraging the
capabilities of the ‘GEOquery’ package
(bioconductor.org/packages/GEOquery/,2.72.0), both gene expression
and clinical datasets were extracted. After integrating the
clinical data with the GEO transcriptome data by sample name, the
final sample size consisted of 39 cases. A total of 39 samples
derived from GSE29609 were employed as a validation cohort to
assess the precision of the prognostic model. Additionally, 100
TMRGs were identified using the Molecular Signatures Database
(MSigDB; https://www.gsea-msigdb.org/gsea/msigdb/human/genesets.jsp;
Table SI). First, on the MSigDB
website, ‘tRNA’ was searched, and ‘GOBP_TRNA_MODIFICATION’ was
selected. Next, the gene set tab-separated values metadata was
downloaded. Finally, a comparative analysis of the expression
levels of tRNA-modified proteins within ccRCC tissues was performed
utilizing the comprehensive resources obtained from the Human
Protein Atlas (HPA) database (proteinatlas.org/).
Cluster analysis
Univariate Cox regression analysis was utilized to
identify tRNA modification genes associated with prognostic
outcomes. To investigate the correlation among TMRGs, a
protein-protein interaction (PPI) network was created utilizing the
capabilities of the STRING database (string-db.org/) as follows: i)
Network type, full STRING network active; ii) interaction source:
Text mining, experiments, databases, co-expression, neighborhood,
gene fusion, co-occurrence; and iii) minimum required interaction
score, medium confidence 0.400. Subsequently, the Cytoscape
Cytohubba (cytoscape.org/,v3.10.2) plug-in identified 26 hub genes
and modules in the PPI network related to tRNA modification genes.
Cluster analysis was performed using the package
‘ConsensusClusterPlus’
(bioconductor.org/packages/ConsensusClusterPlus/1.66.0) program to
identify molecular subtypes associated with tRNA modification;
parameters included maxK, 9; reps, 10; and pItem, 0.8. Kaplan-Meier
analysis was used to analyze the differences between the two
groups. χ2 analysis was conducted concurrently to
generate heat maps to systematically illustrate the associations
between distinct clusters and their corresponding clinical
features.
Identification and validation of the
model
The least absolute shrinkage and selection operator
(LASSO) and multivariable Cox regression analyses were performed to
identify genes associated with ccRCC and establish prognostic
signatures. The GraphPad software (version 9.5; Dotmatics) was
employed to display the coefficients in the selected genes. The
risk score was calculated as follows: ∑nn
coef(i) × Expr(i) (where i represents genes). Kaplan-Meier
analysis and receiver operating characteristic (ROC) curves were
generated to assess the predictive value of each attribute. Cox
regression analyses were applied to verify whether a signature was
an independent risk factor. Correlation analysis, stratification
analysis and the establishment of a nomogram, based on risk scores
and pertinent clinical attributes, were performed according to
clinicopathological standards. Calibration plots were created for
the 1-, 3- and 5-year survival rates to evaluate the alignment
between the predicted probabilities and the actual survival
results.
Enrichment analysis
Gene Set Enrichment Analysis (GSEA;
gsea-msigdb.org/gsea/index.jsp) was performed to examine pathway
enrichment in high-risk groups. The internal reference gene sets
included three categories: C2 KEGG, HALLMARK and C5GO. Significant
results were indicated by normalized enrichment scores (NES) >1,
a nominal P<0.05 and a false discovery rate (FDR) q-value
<0.25.
Immunologic landscape analysis
A quartet of immune-related algorithms, including
single sample (ss) GSEA, ESTIMATE, TIDE and CIBERSORT algorithms
(RStudio IDE; Posit Software, PBC) were applied to assess and
compare the immunological profiles of high-risk and low-risk
cohorts. The ssGSEA methodology was utilized to elucidate the
activity of immune cells, immune functions and the pathways
associated with immunity for each sample. Marker genes for various
immune cells were identified from previous studies, such as
FOXP3/CTLA4, CD56, which are the marker genes of Tregs and Natural
killer cells (21,22). The ESTIMATE method was utilized to
calculate immune, stromal, estimate score and tumor purity by
analyzing the ratio of immune cells to stromal cells. The
composition of immune cell populations infiltrating each tumor
specimen was predicted utilizing the CIBERSORT algorithm. Following
cluster analysis and subsequent characterization, a comparative
examination of the expression of the major histocompatibility
complex (MHC) and immune checkpoint molecules was performed. Higher
Tumor Immune Dysfunction and Exclusion (TIDE) scores are associated
with longer survival and poorer response to checkpoint blockade
therapy. Employing the TIDE database (tide.dfci.harvard.edu/), the
TIDE scores for TCGA-kidney RCC (KIRC) cohort were calculated to
predict immunotherapy responses in both subpopulations.
Analysis of tumor-related scores
The R package ssGSEA (parameters included: Method,
‘ssgsea’; kcdf, ‘Gaussian’; abs.ranking, TRUE) was applied to
assess the angiogenic activity, tumorigenic cytokine score,
mesenchymal EMT and stemness score for individual samples within
the TCGA-KIRC cohort.
Gene mutation analysis
Based on TCGA-KIRC somatic mutation data, the
‘maftools’ (bioconductor.org/packages/maftools/,2.18.0) package was
applied to analyze gene mutations. Tumor mutational burden (TMB)
was calculated for each patient and compared between the high-risk
and low-risk cohorts. The TMB scores were subsequently utilized to
perform a comprehensive survival analysis. The cBioPortal database
(cbioportal.org/v4.0) indicated that some genes selected by the
signature have somatic mutations.
Chemotherapy response
The Genomics of Drug Sensitivity in Cancer (GDSC)
database (https://www.cancerrxgene.org/) was used to evaluate
the impact of predictive signatures on treatment response in ccRCC.
The ‘oncoPredict’ (https://bioconductor.org/packages/oncoPredict, 1.0.1)
package was employed to retrieve the gene expression profiles from
the GDSC dataset with the corresponding drug response data.
Sensitivity scores were applied to predict the maximum
IC50 of all drugs in patients with KIRC.
Primer design
The primer design process in the present study
typically adhered to the following: i) The nucleotide sequence of
the target gene was retrieved from gene databases, such as National
Center for Biotechnology Information GenBank
(ncbi.nlm.nih.gov/genbank/), ii) based on the sequence of the
target gene, an oligonucleotide sequence was designed that can
anneal and bind effectively; the optimal length for primers
generally ranges from 18 to 25 nucleotides, which ensures high
specificity and appropriate annealing temperatures, iii)
calculation of primer melting temperature (Tm) was performed,
aiming for a Tm between 55–65°C as recommended; primers were
calculated using online tools such as OligoCalculator
(idtdna.com/calc/analyzer) and iv a design software such as Primer3
(tmcalculator.neb.com; v2.6.1) minimized non-specific binding
between primer sequences and target sequences. Accession numbers
are shown in Table SII.
Cell culture and reverse
transcription-quantitative (RT-q) PCR
HK2 and ccRCC lines (786-O, 769-P, ACHN, Caki-1 and
OS-RC-2) were purchased from the Shanghai Institutes for Biological
Sciences. HK2 and ACHN cells were cultured in MEM (Gibco; Thermo
Fisher Scientific, Inc.) supplemented with 10% fetal bovine serum
(FBS; Gibco; Thermo Fisher Scientific, Inc.), while 786-O, 769-P
and OS-RC-2 cells were cultured in RPMI-1640 (Gibco; Thermo Fisher
Scientific, Inc.) medium supplemented with 10% FBS. Caki-1 cells
were maintained in a McCoy's 5A medium (Gibco; Thermo Fisher
Scientific, Inc.) supplemented with 10% FBS. All cell lines were
maintained in a sterile incubator (Thermo Fisher Scientific, Inc.)
at 37°C with 5% CO2. Total RNA was extracted from the
tissues or cell lysates of RCC patients utilizing a TRIzol™ reagent
kit (Qiagen, Inc.). Subsequent cDNA synthesis employed a
Thermo-script RT kit (Thermo Fisher Scientific, Inc.) according to
the manufacturer's instructions. The 2(−ΔΔ C(T)) Method to analysis
the relative gene expression (23).
qPCR was conducted utilizing the CFX96™ Real-Time System (Bio-Rad
Laboratories, Inc.) with SYBR Green PCR reagent (Takara Bio, Inc.).
The thermocycling conditions were as follows: 95°C for 5 min,
followed by 40 cycles of 95°C for 15 sec, 60°C for 25 sec and 72°C
for 30 sec. GADPH served as a standardized internal reference for
normalization. The primer sequences utilized for qPCR are listed in
Table SIII.
Statistical analysis
All statistical analyses were performed using R
software (version 4.3.1; Posit Software, PBC) and GraphPad Prism
(version 9.5; Dotmatics). The data are presented as mean ± standard
deviation (SD) or mean ± standard error of the mean (SEM), as
specified in the figure legends. P<0.05 was considered to
indicate a statistically significant difference. For survival
analysis, Kaplan-Meier curves were generated and the log-rank test
was applied to evaluate differences between groups. Univariate and
multivariate Cox proportional hazards regression models were used
to determine independent prognostic factors. The LASSO regression
and multivariate Cox regression were performed to construct the
prognostic model. Comparisons between two groups were conducted
using the Wilcoxon rank-sum test or Student's t-test, depending on
the normality of the data distribution assessed by the Shapiro-Wilk
test. For comparisons among multiple groups, one-way ANOVA followed
by Tukey's post hoc test was applied when the data were normally
distributed, while the Kruskal-Wallis test followed by Dunn's post
hoc test was used for non-normally distributed data. χ2
analysis was used to examine associations between categorical
variables. GSEA was conducted using the clusterProfiler package
(bioconductor.org/packages/clusterProfiler, 4.12.0). P<0.05 and
FDR <0.25 were considered to indicate a statistically
significant difference in terms of enrichment. The TIDE score
differences between groups were assessed using the Mann-Whitney U
test. The correlation between continuous variables was evaluated
using Spearman's or Pearson's correlation analysis, depending on
the distribution of the data. The ROC curve and area under the
curve (AUC) were used to assess the predictive accuracy of the
prognostic model. Differences in TMB scores were analyzed using the
Wilcoxon test. Drug sensitivity prediction was performed using the
oncoPredict package and IC50 values were compared using
the Wilcoxon test. All experiments were performed with at least
three biological replicates. Statistical significance for each
analysis is indicated in the corresponding figure legends.
Results
Identification of two tRNA
modification-associated clusters
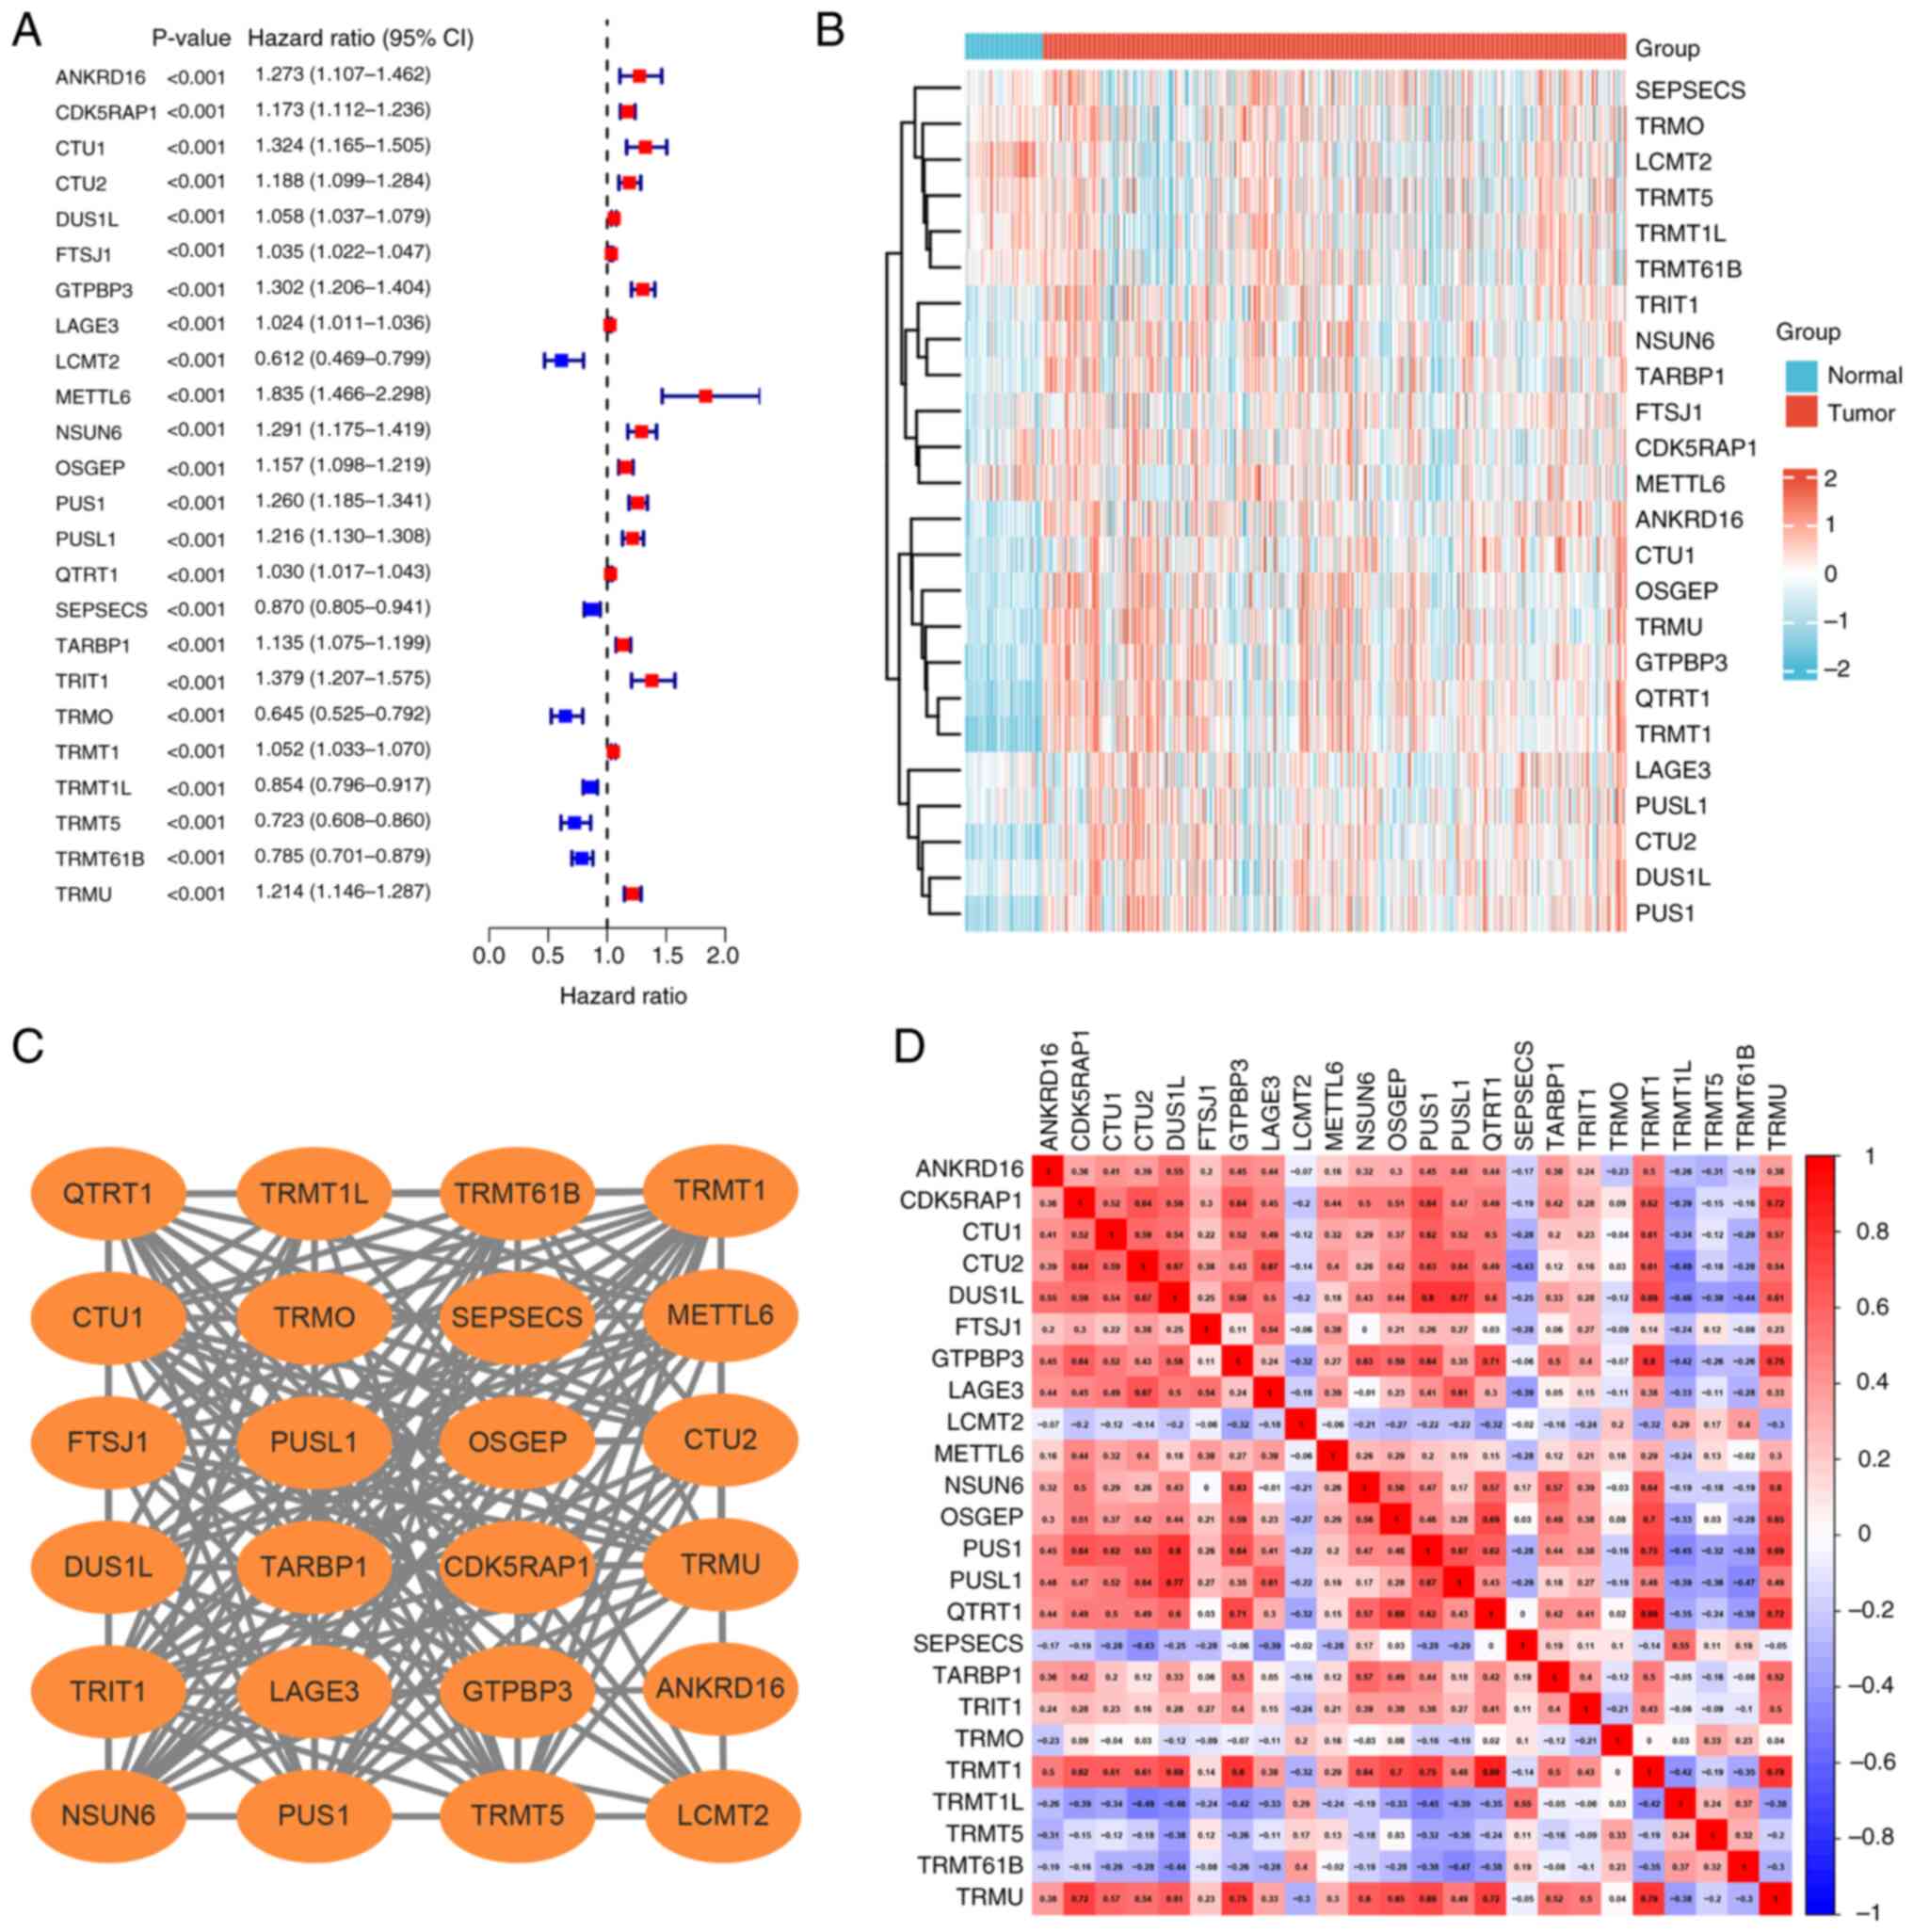
A total of 100 genes (Table SI) associated with tRNA
modification were identified in the MSigDB. Univariate Cox analysis
identified 24 genes significantly associated with ccRCC prognosis,
including six protective factors, leucine carboxyl
methyltransferase 2 (LCMT2), SEPSECS, TRNA methyltransferase O
(TRMO), TRNA methyltransferase 1L (TRMT1L), TRMT5, TRMT61B and 18
risk factors (Fig. 1A). The
expression levels of the 24 genes related to prognosis in ccRCC
tissues were compared with that of normal kidney tissues (Fig. 1B). The PPI network and correlation
analysis illustrated the complex associations among the 24
prognosis-related genes (Fig. 1C and
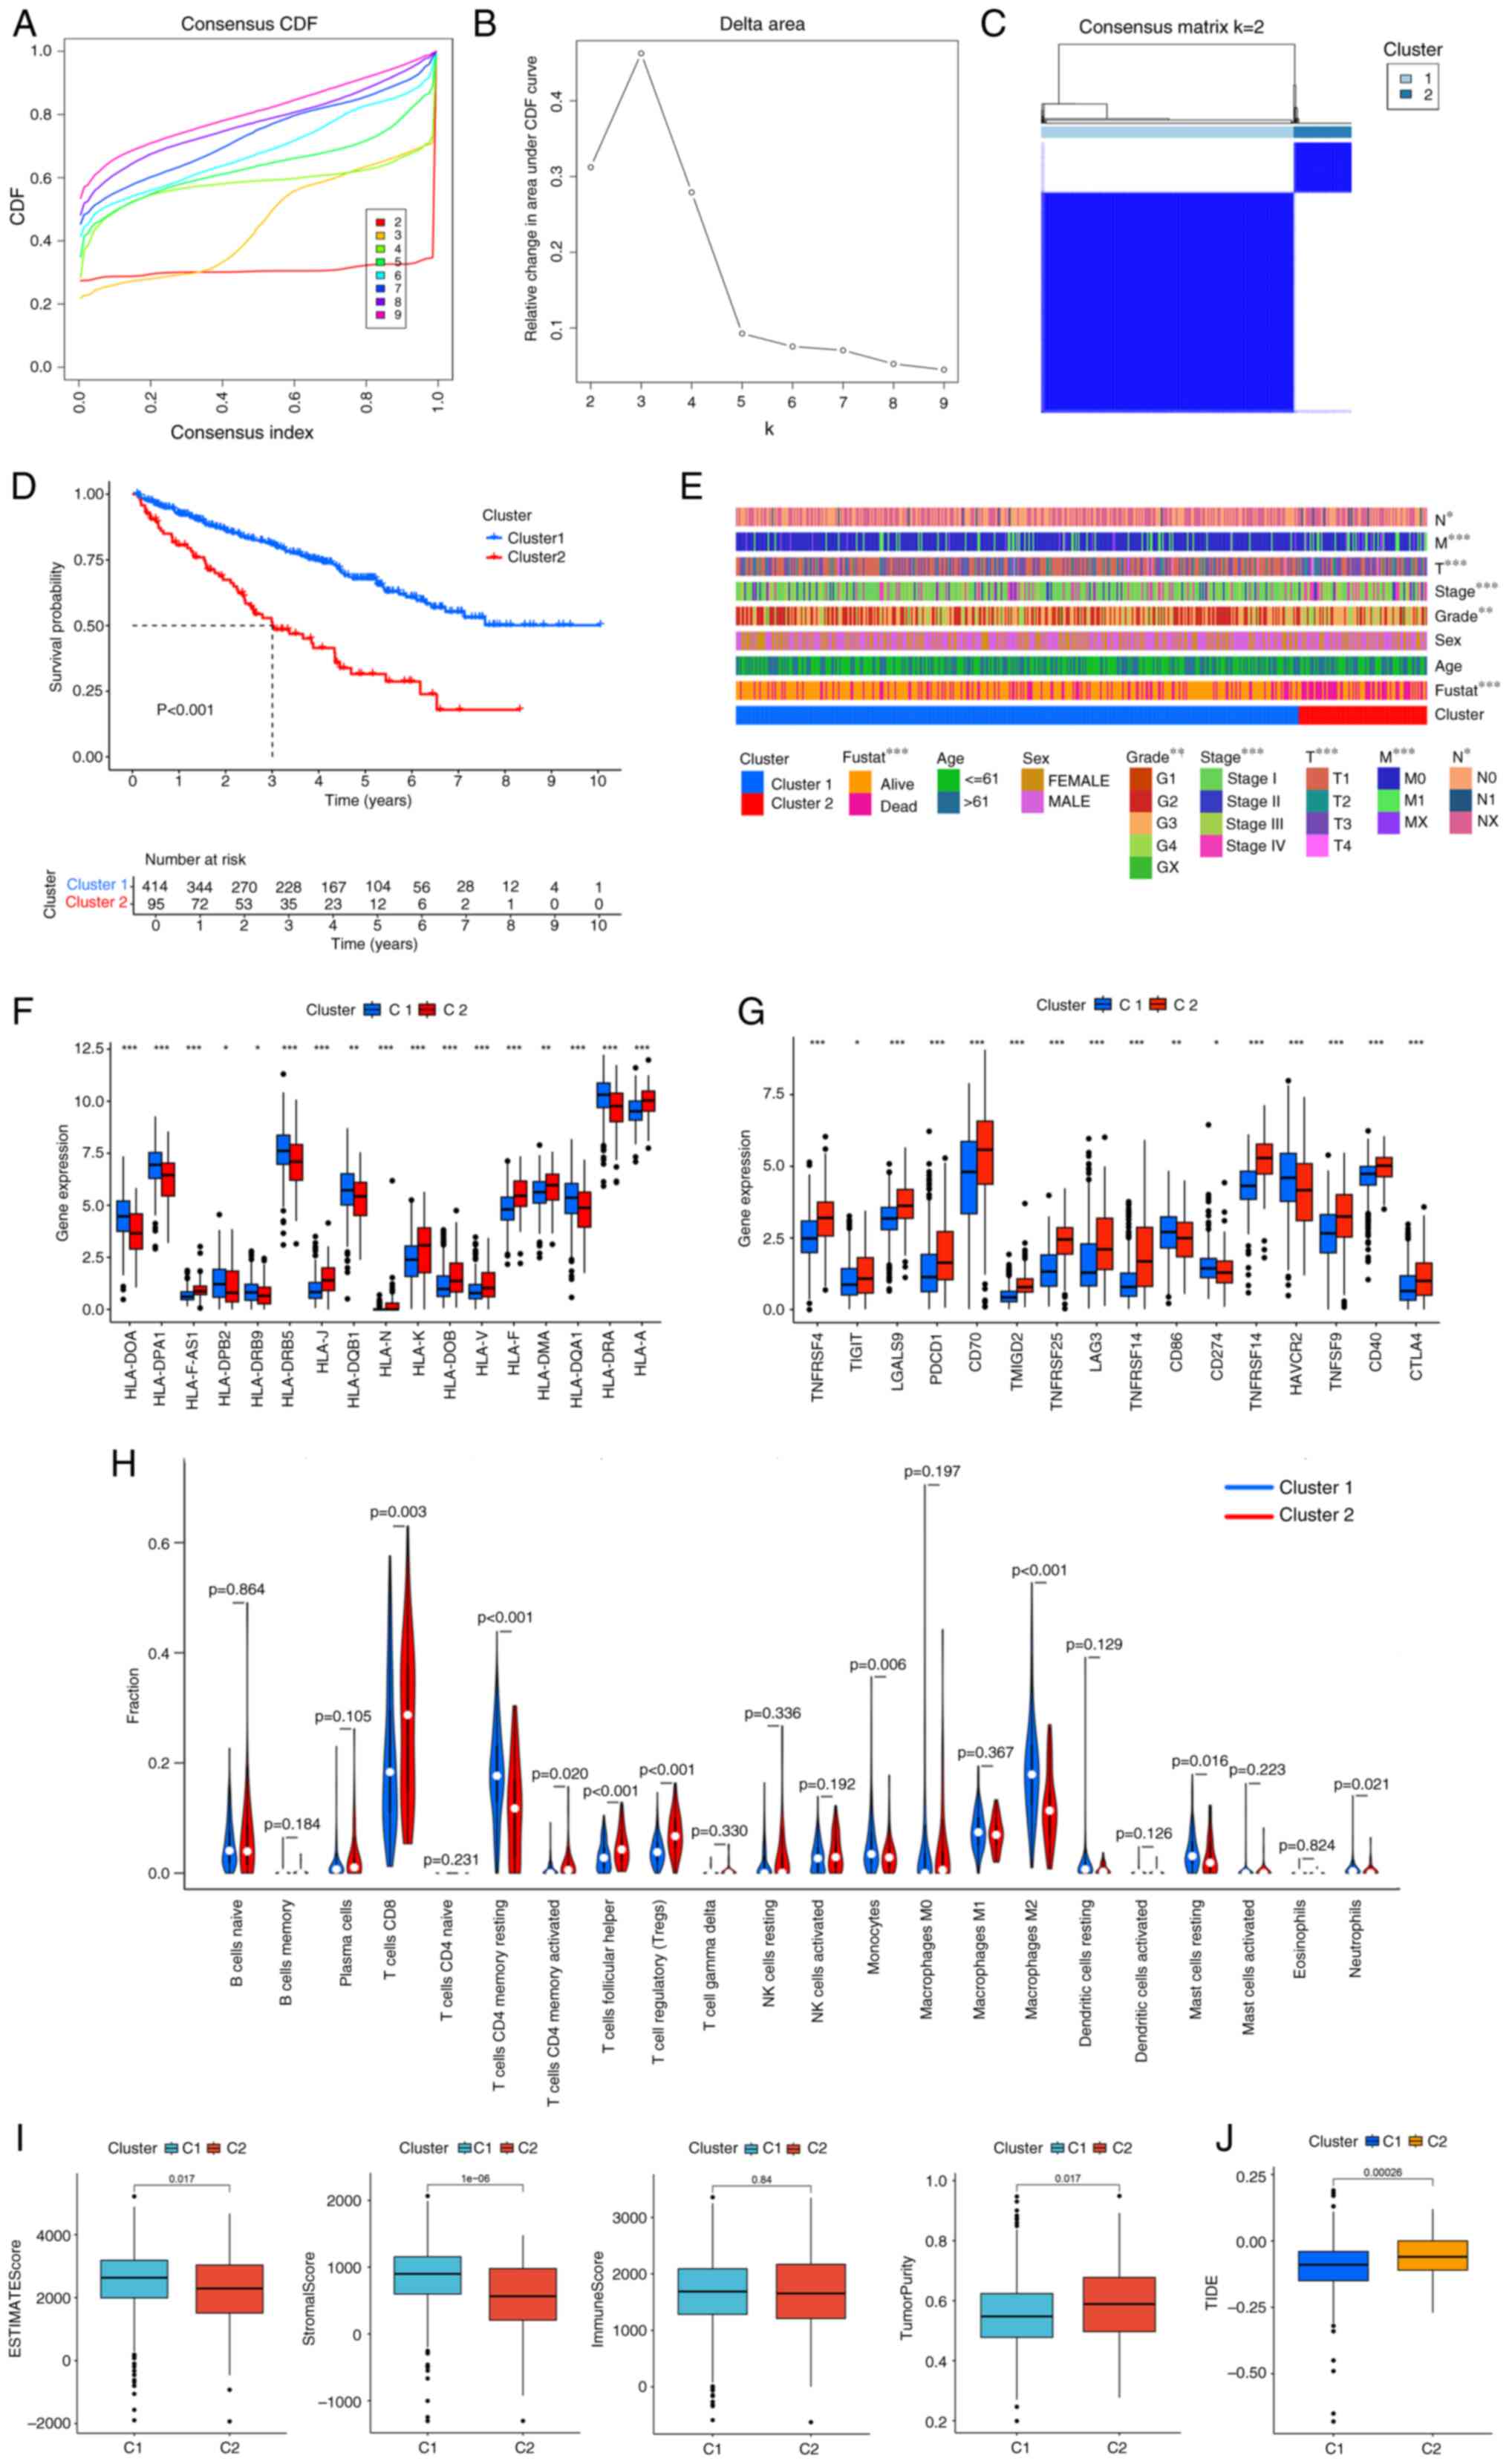
D). Clustering studies using these 24 genes (Table SIV) indicated that the optimal
classification was to stratify patients with ccRCC into two
categories (k=2) based on the expression patterns of 24 tRNA
modification-associated genes (Fig.
2A-C). The cases represented by clusters 1 and 2 are shown in
Table SV. Survival analysis of the
two subgroups demonstrated that patients classified within cluster
1 exhibited a significantly more favorable prognosis compared with
that of the patients in cluster 2 (Fig.
2D) The heat map significant associations between the clusters
and clinicopathological parameters including clinical stage, T, M
stage and grade, advanced stage (III/IV) or T4/N1/M1are enriched in
Cluster2 (Fig. 2E).
Evaluation of tumor immune
microenvironment in two clusters
In addition, cluster 2 exhibited significant
association with decreased expression levels of various MHC
molecules (Fig. 2F). Considering
the disparities in immune infiltration between the two cohorts, the
relationship with immune checkpoints was examined. Cluster 2
demonstrated significantly increased expression levels of immune
checkpoints such as TNF receptor superfamily member 7, programmed
cell death protein 1 (PD-1), T-cell immunoreceptor with Ig and ITIM
domains (TIGIT), lymphocyte-activation gene 3 (LAG3), CD40 and
cytotoxic t-lymphocyte antigen 4 (CTLA-4; Fig. 2G). CIBERSORT algorithm showed that
cluster 2 exhibited a markedly increased infiltration of immune
cells, encompassing CD8+ T lymphocytes, activated memory
CD4+ T lymphocytes, follicular helper T cells and
regulatory T cells (Tregs; Fig. 2H)
Using the ESTIMATE methodology, cluster 2 demonstrated
significantly increased tumor purity, accompanied by decreased
stromal and ESTIMATE scores (Fig.
2I). Prolonged survival and diminished efficacy of checkpoint
blockade therapy are linked to elevated TIDE scores (24). Cluster 2 exhibited significantly
increased TIDE scores compared with that of cluster 1 (Fig. 2J).
Construction and validation of tRNA
modification-related prognostic model
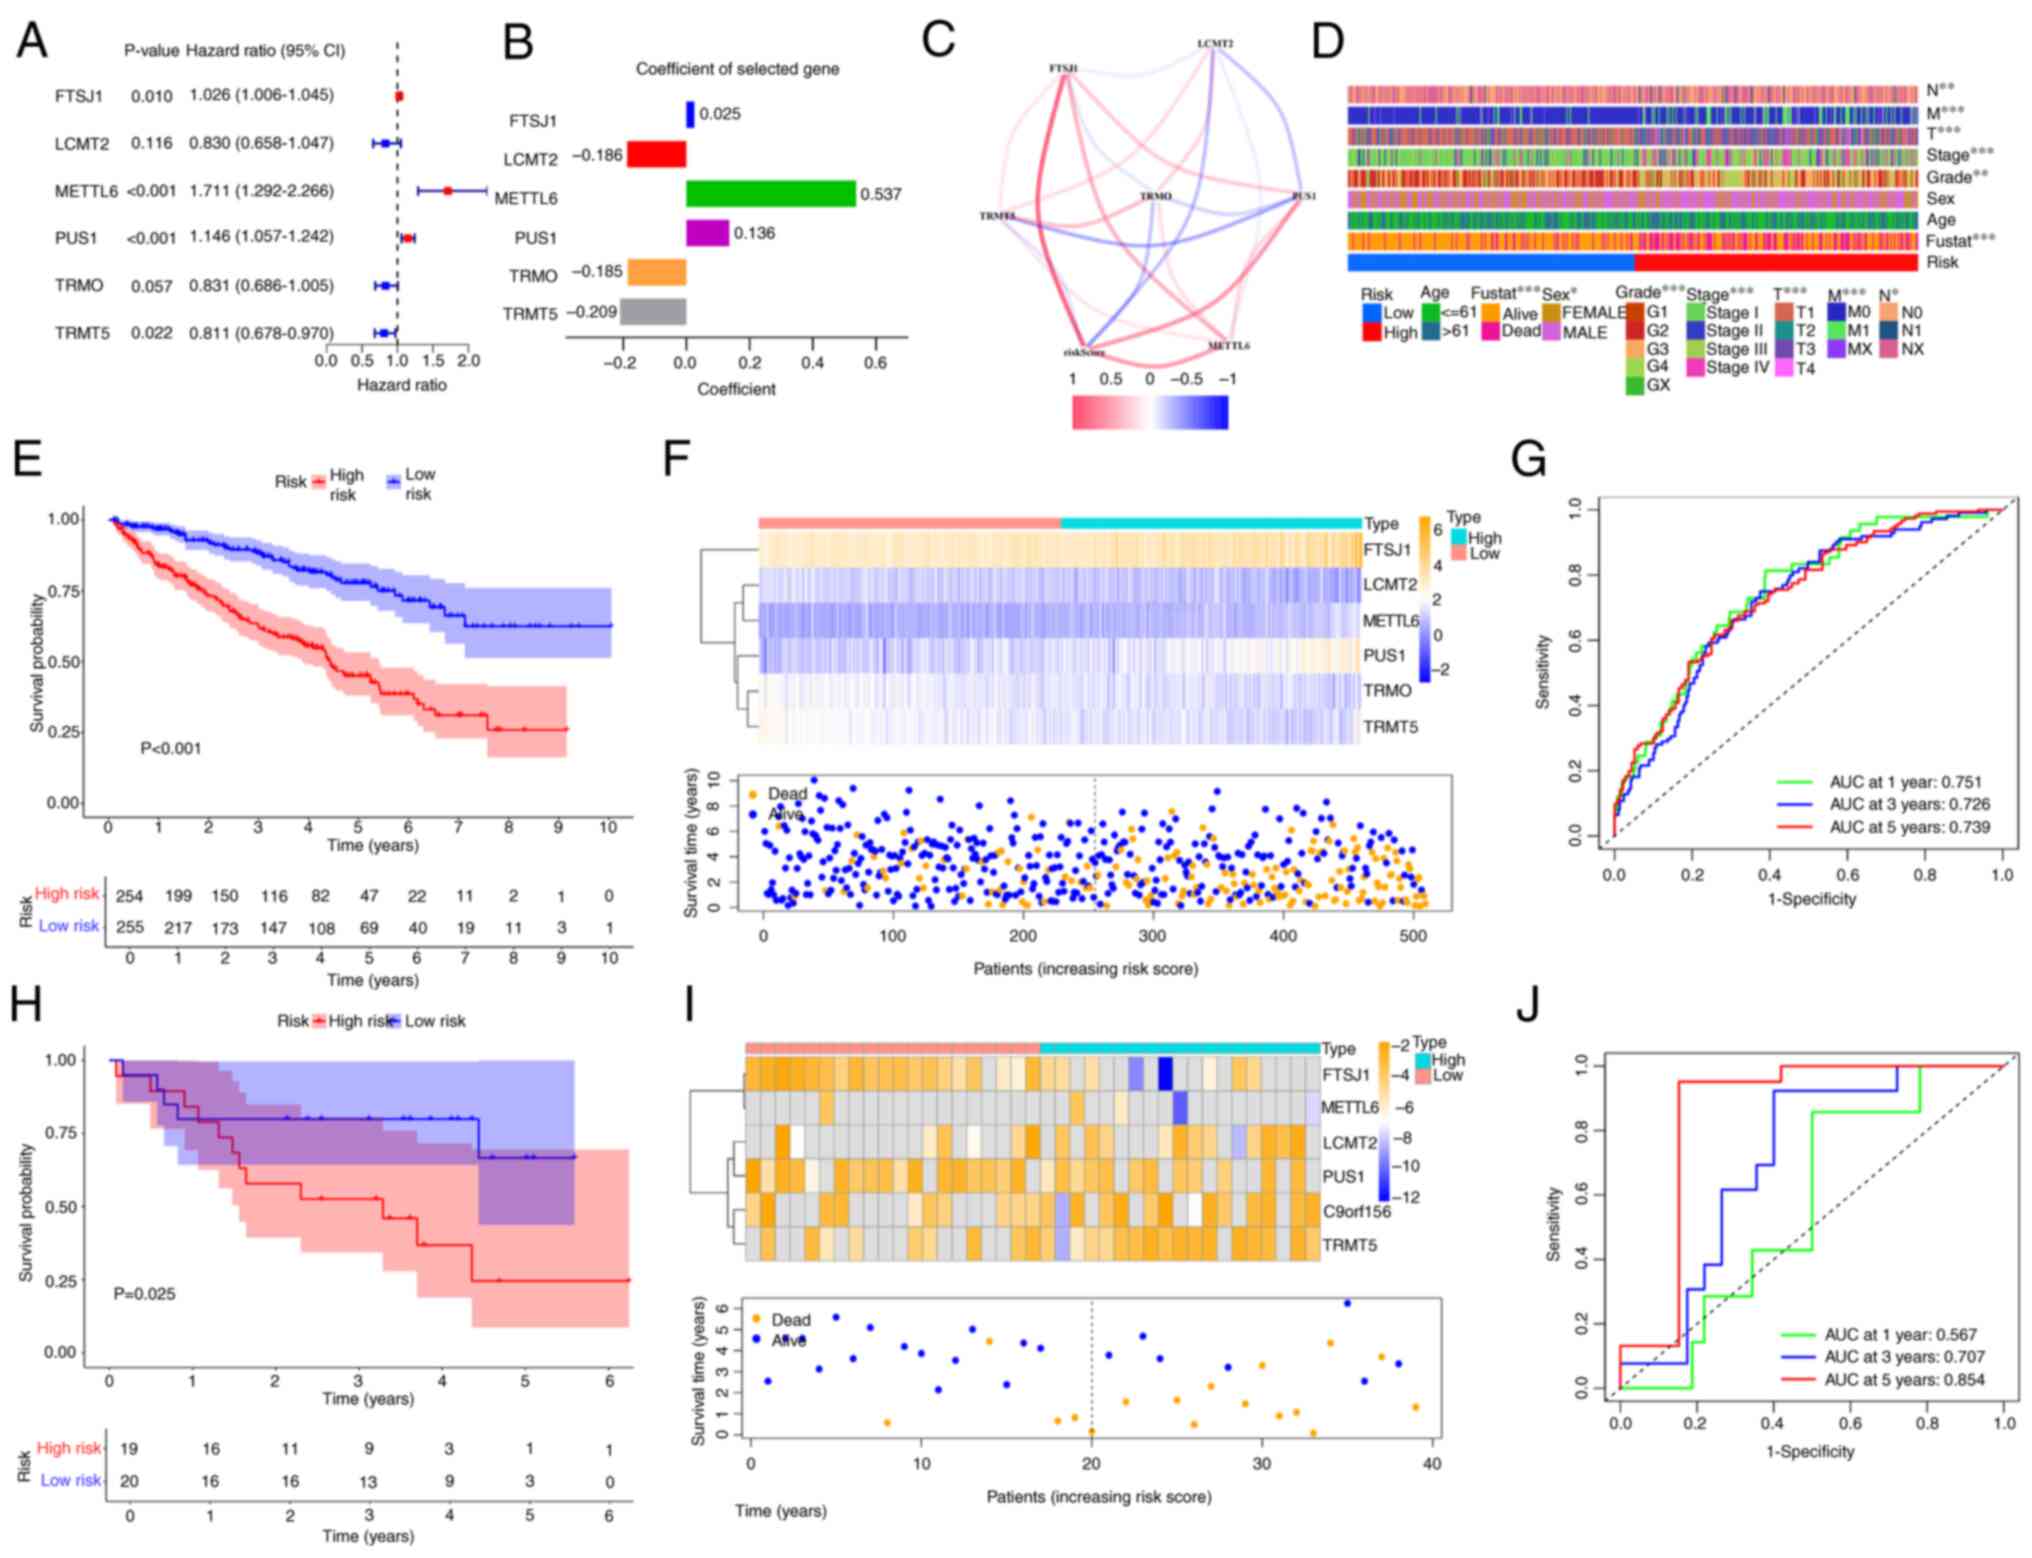
LASSO analysis in conjunction with multivariate Cox
regression analysis was applied to refine the gene set of the
present model, which resulted in the inclusion of six genes, FtsJ
RNA 2′-O-methyltransferase 1 (FTSJ1), LCMT2, METTL6, pseudouridine
synthase 1 (PUS1), TRMO and TRMT5, within the signature (Fig. 3A). The coefficients of the six genes
in the signature are shown Fig. 3B.
The relationships between risk score and six genes are illustrated
in Fig. 3C. The risk score was
calculated according to the formula: ∑nn
coef(i) × Expr(i) and the model was then used to classify
patients with ccRCC into low- and high-risk groups using optimized
cut-off values (1.053). The risk score was correlated with
clinicopathological parameters such as grade and clinical stage
(Fig. 3D). At the 1-, 3- and 5-year
AUCs (0.751, 0.726 and 0.739), patients that exhibited increased
risk scores demonstrated significantly poorer prognosis compared
with those with low-risk scores (Fig.
3E-G). The results of the survival analysis were validated
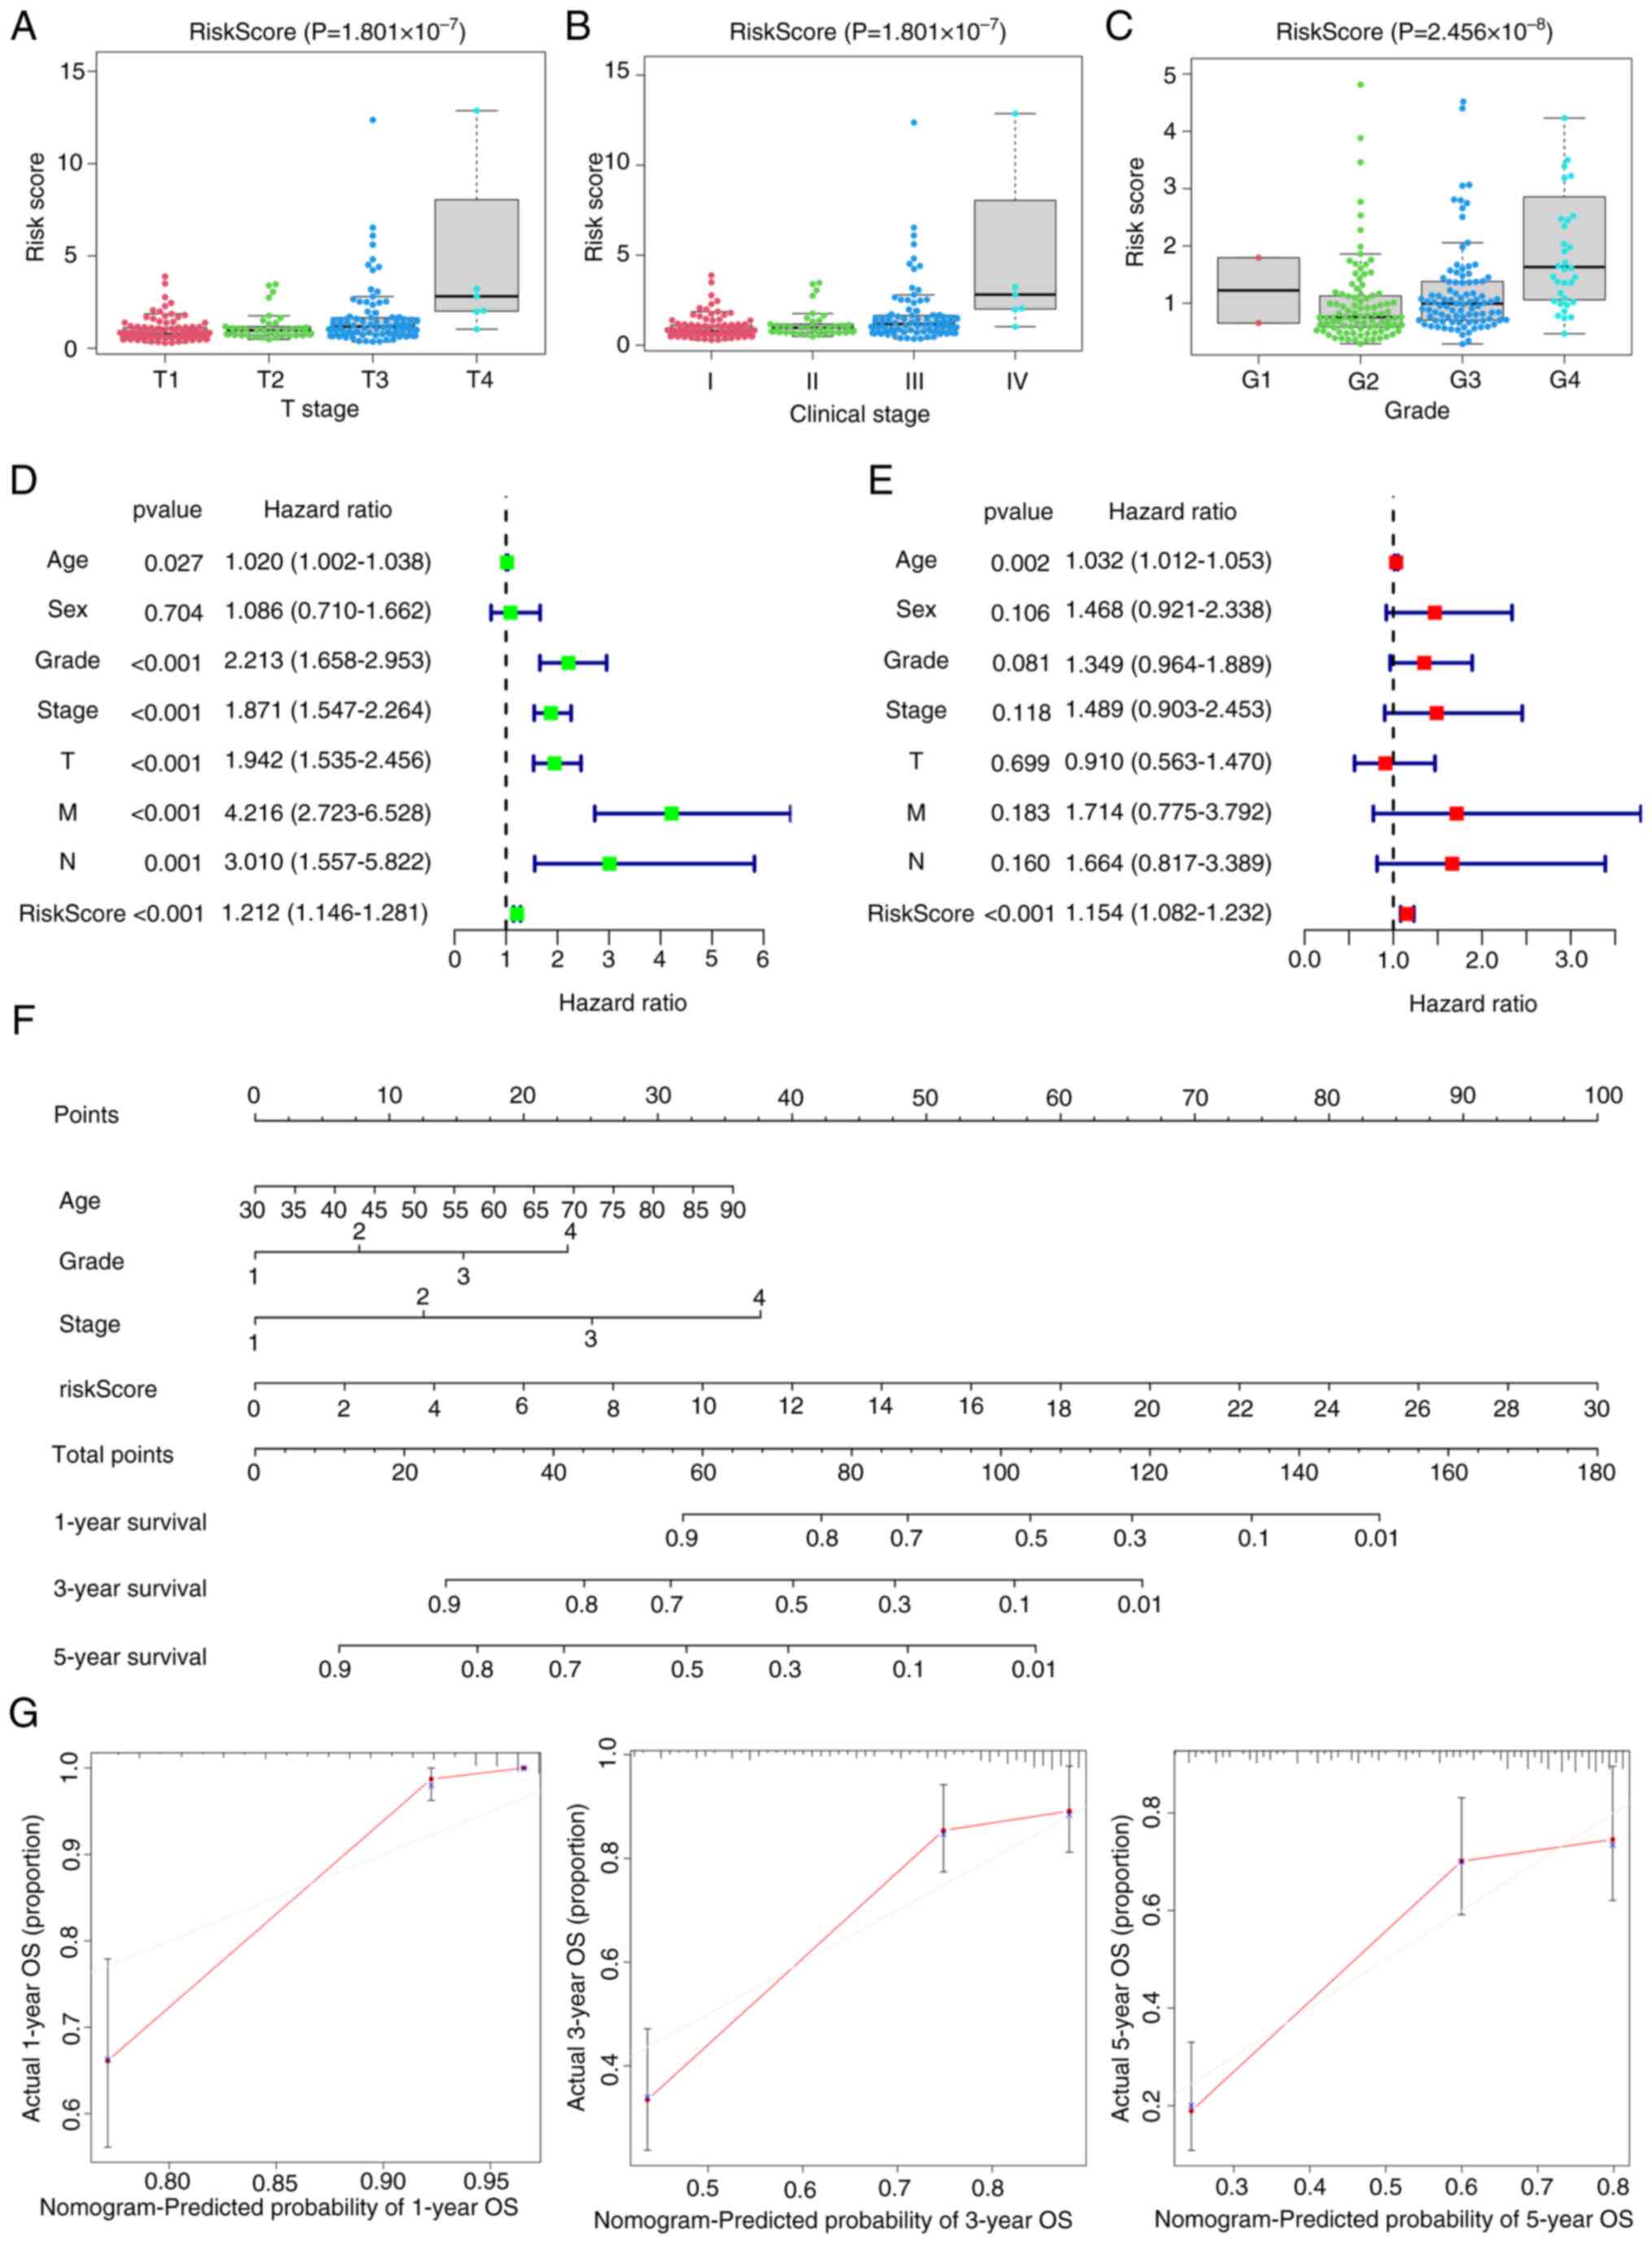
through the utilization of the GSE29609 dataset (Fig. 3H-J). Additionally, changes in risk
assessments among subgroups associated with numerous
clinicopathological parameters were observed. Patients within
grades 3 and 4, and stages T3-T4 and III–IV exhibited significantly
increased risk scores, which suggested that more advanced tumors
were associated with higher risk scores (Fig. 4A-C). Finally, Cox regression
analyses demonstrated that the signature constituted an independent
risk factor (Fig. 4D and E). From
the Cox regression analysis results, age, score, clinical stage and
signature were included when constructing the nomogram, with the
gene signature as the key component of significance (Fig. 4F). According to the calibration
plot, the survival times at 1-, 3- and 5-years exhibited alignment
with the projected survival estimates (Fig. 4G).
Functional enrichment and
tumorigenesis score analyses for low- and high-risk ccRCC
GSEA was employed to examine pathways that govern
tumorigenesis within the high-risk cohort. Numerous
tumor-associated pathways were significantly enriched within the
high-risk cohort (Fig. 5B). The
findings demonstrated that the high-risk cohort exhibited a
significant enrichment in the EMT pathway [NES=1.72; nominal (NOM)
P=0.029; FDR q-value=0.12], IL6-JAK-STAT3 signaling pathway
(NES=1.75; NOM P=0.027; FDR q-value=0.18), P53 pathway (NES=1.80;
NOM P=0.018; FDR q-value=0.14) and the interactions of
cytokine-cytokine receptors (NES=1.81; NOM P=0.014; FDR
q-value=0.17; Fig. 5A). The scores
of angiogenic activity, mesenchymal EMT, tumorigenic cytokines and
stemness were assessed in patients with ccRCC. The scores for EMT
were significantly decreased, while the assessments of tumorigenic
cytokines, angiogenic activity and stemness exhibited a significant
increase within the high-risk cohort compared with that of the
low-risk cohort (Fig. 5C). The risk
score demonstrated a positive correlation with the tumorigenic
cytokines scores (R=0.22; P=8.4×10−07), angiogenic
activity scores (R=0.25; P=2.4×10−08) and stemness
scores (R=0.12; P=0.0092), whereas the risk score negatively
correlated with mesenchymal EMT scores (R=−0.11; P=0.015; Fig. 5D).
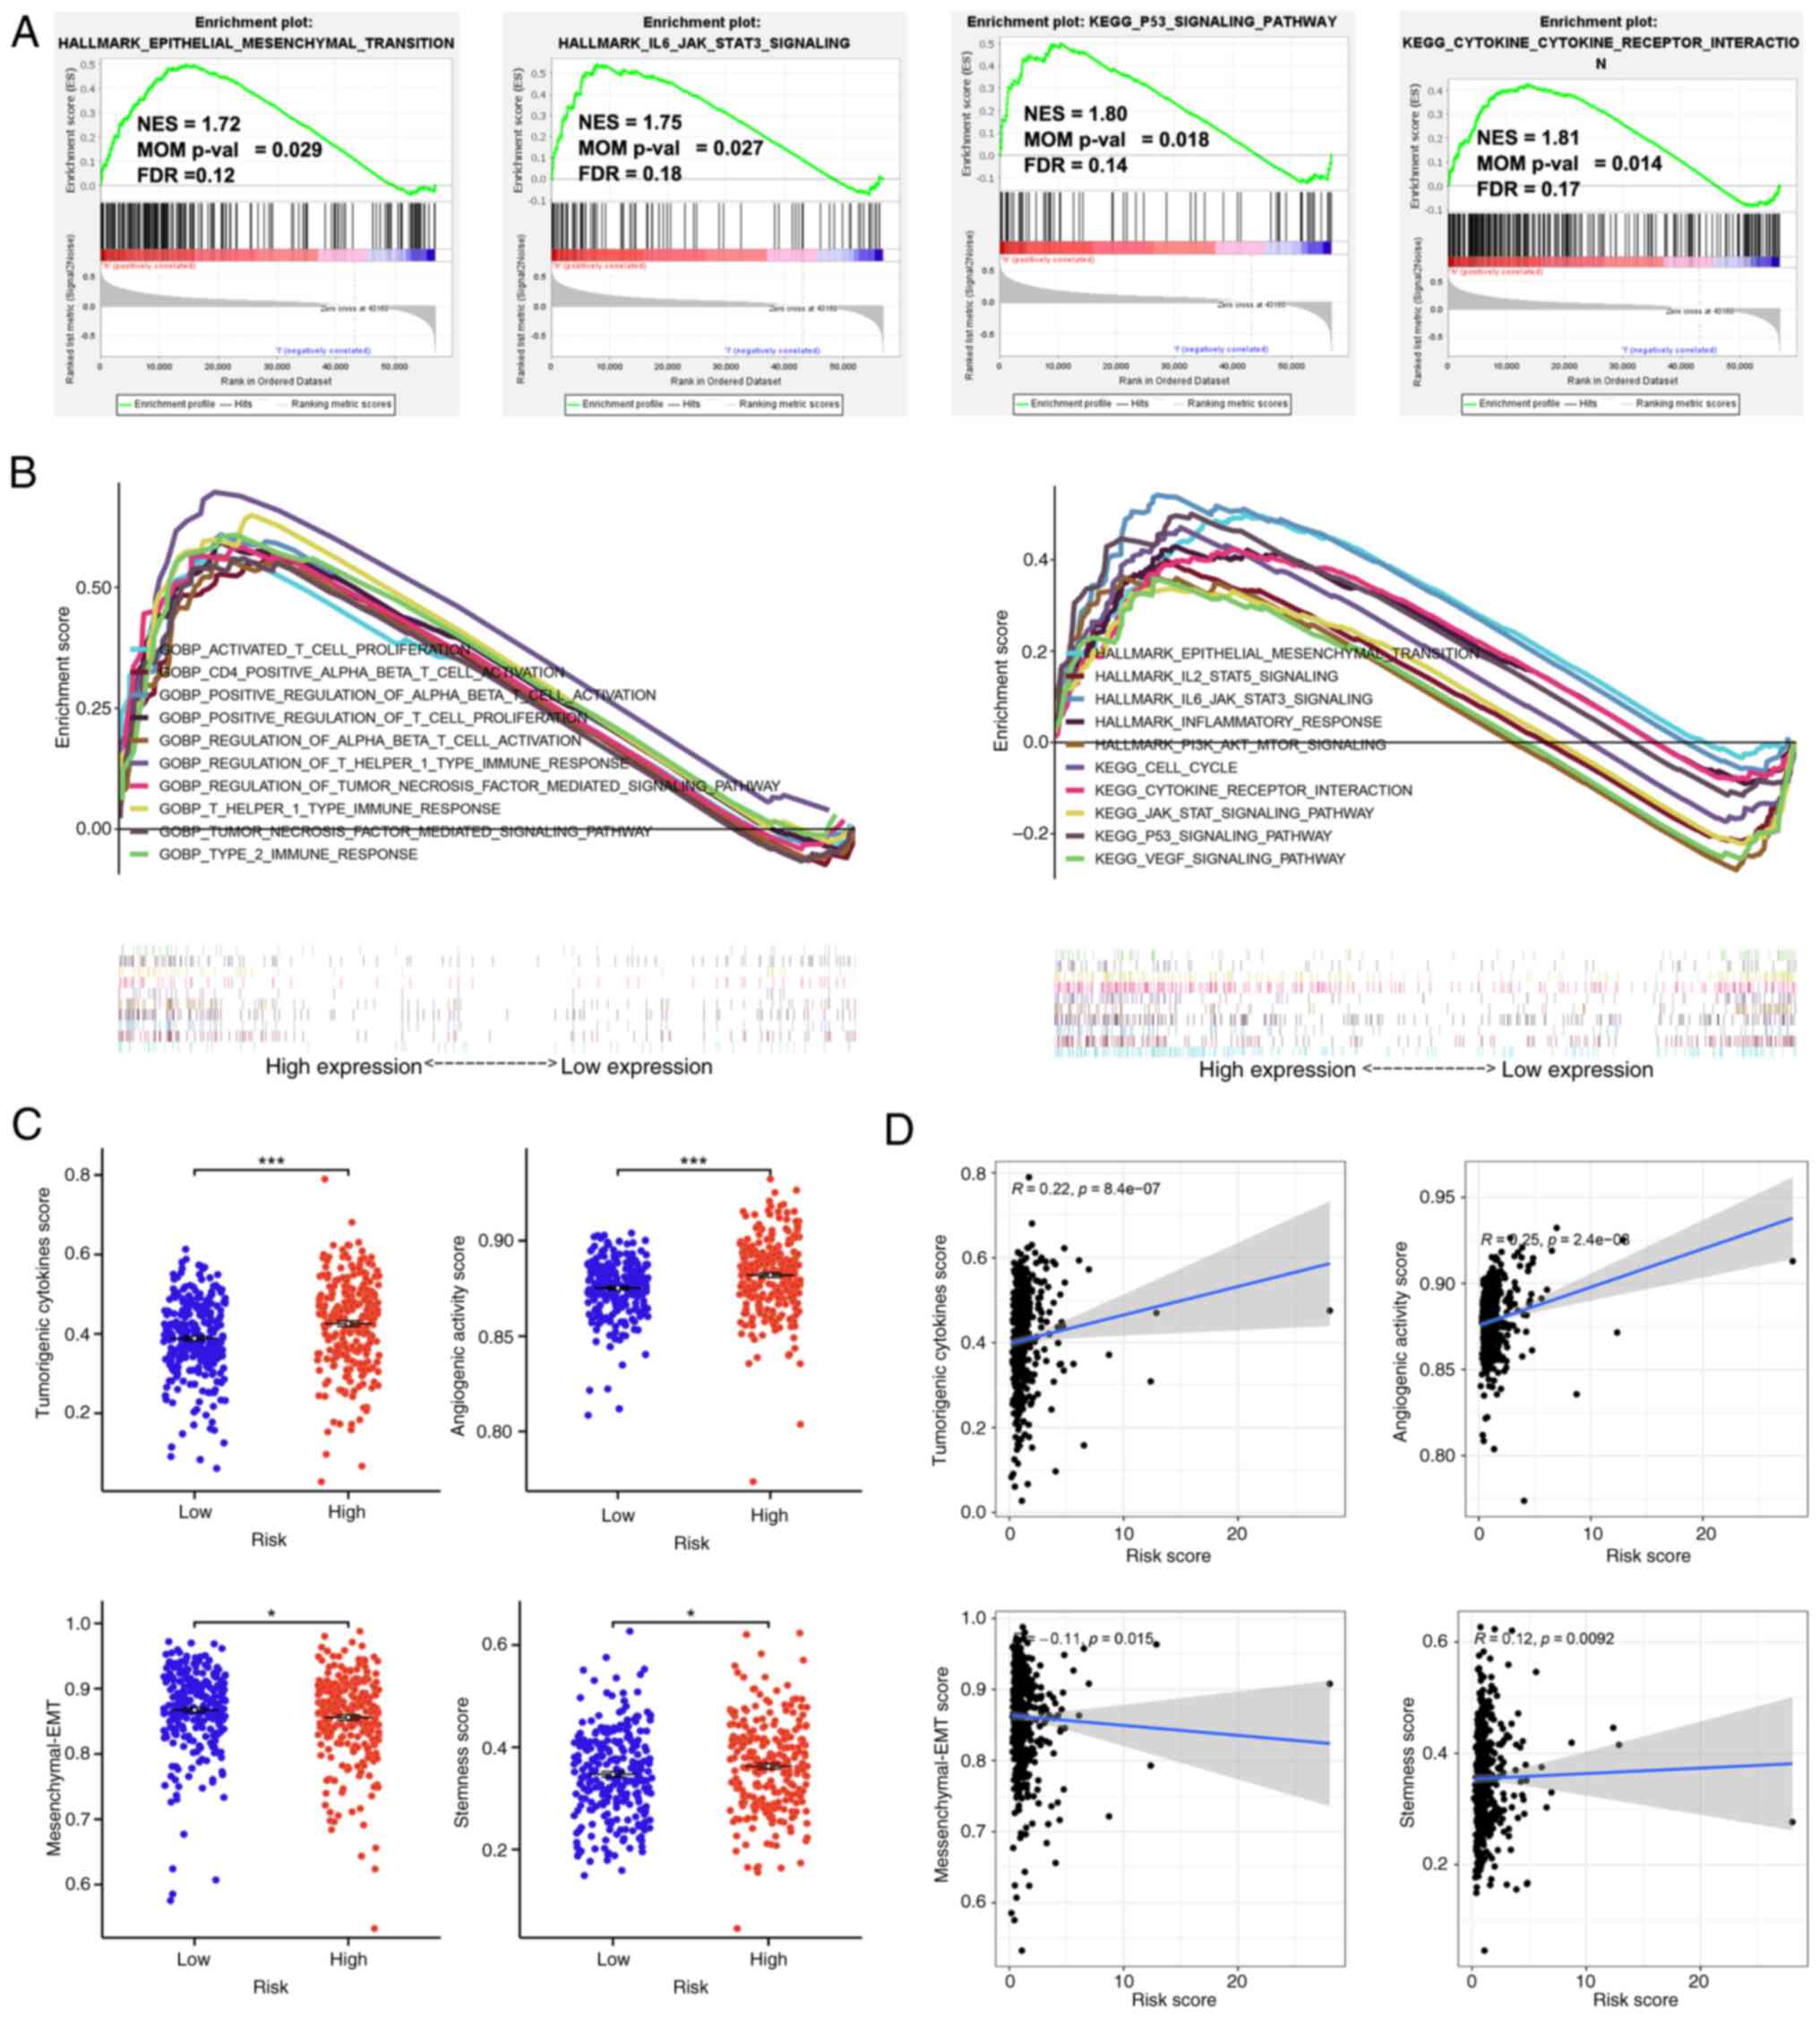 | Figure 5.Functional enrichment and
tumorigenesis score analysis for low- and high-risk ccRCC groups.
(A) The high-risk group showed significant enrichment of the EMT,
IL6-JAK-STAT3, P53 and cytokine-cytokine receptor interaction
pathways. (B) Gene set enrichment analysis of numerous
tumor-related regulatory pathways enriched in the high-risk group.
(C) The scores of angiogenic activity, mesenchymal EMT, tumorigenic
cytokines and stemness in the high-risk group. (D) The risk score
was positively correlated with tumorigenic cytokines scores
(R=0.22; P=8.4×10⁷), angiogenic activity scores (R=0.25;
P=2.4×10⁸) and stemness scores (R=0.12; P=0.0092), and
negatively correlated with mesenchymal EMT scores. EMT,
epithelial-mesenchymal transition; NES, normalized enrichment
scores; FDR, false discovery rate; ccRCC, clear cell renal cell
carcinoma; NOM, nominal. *P<0.05, ***P<0.001 |
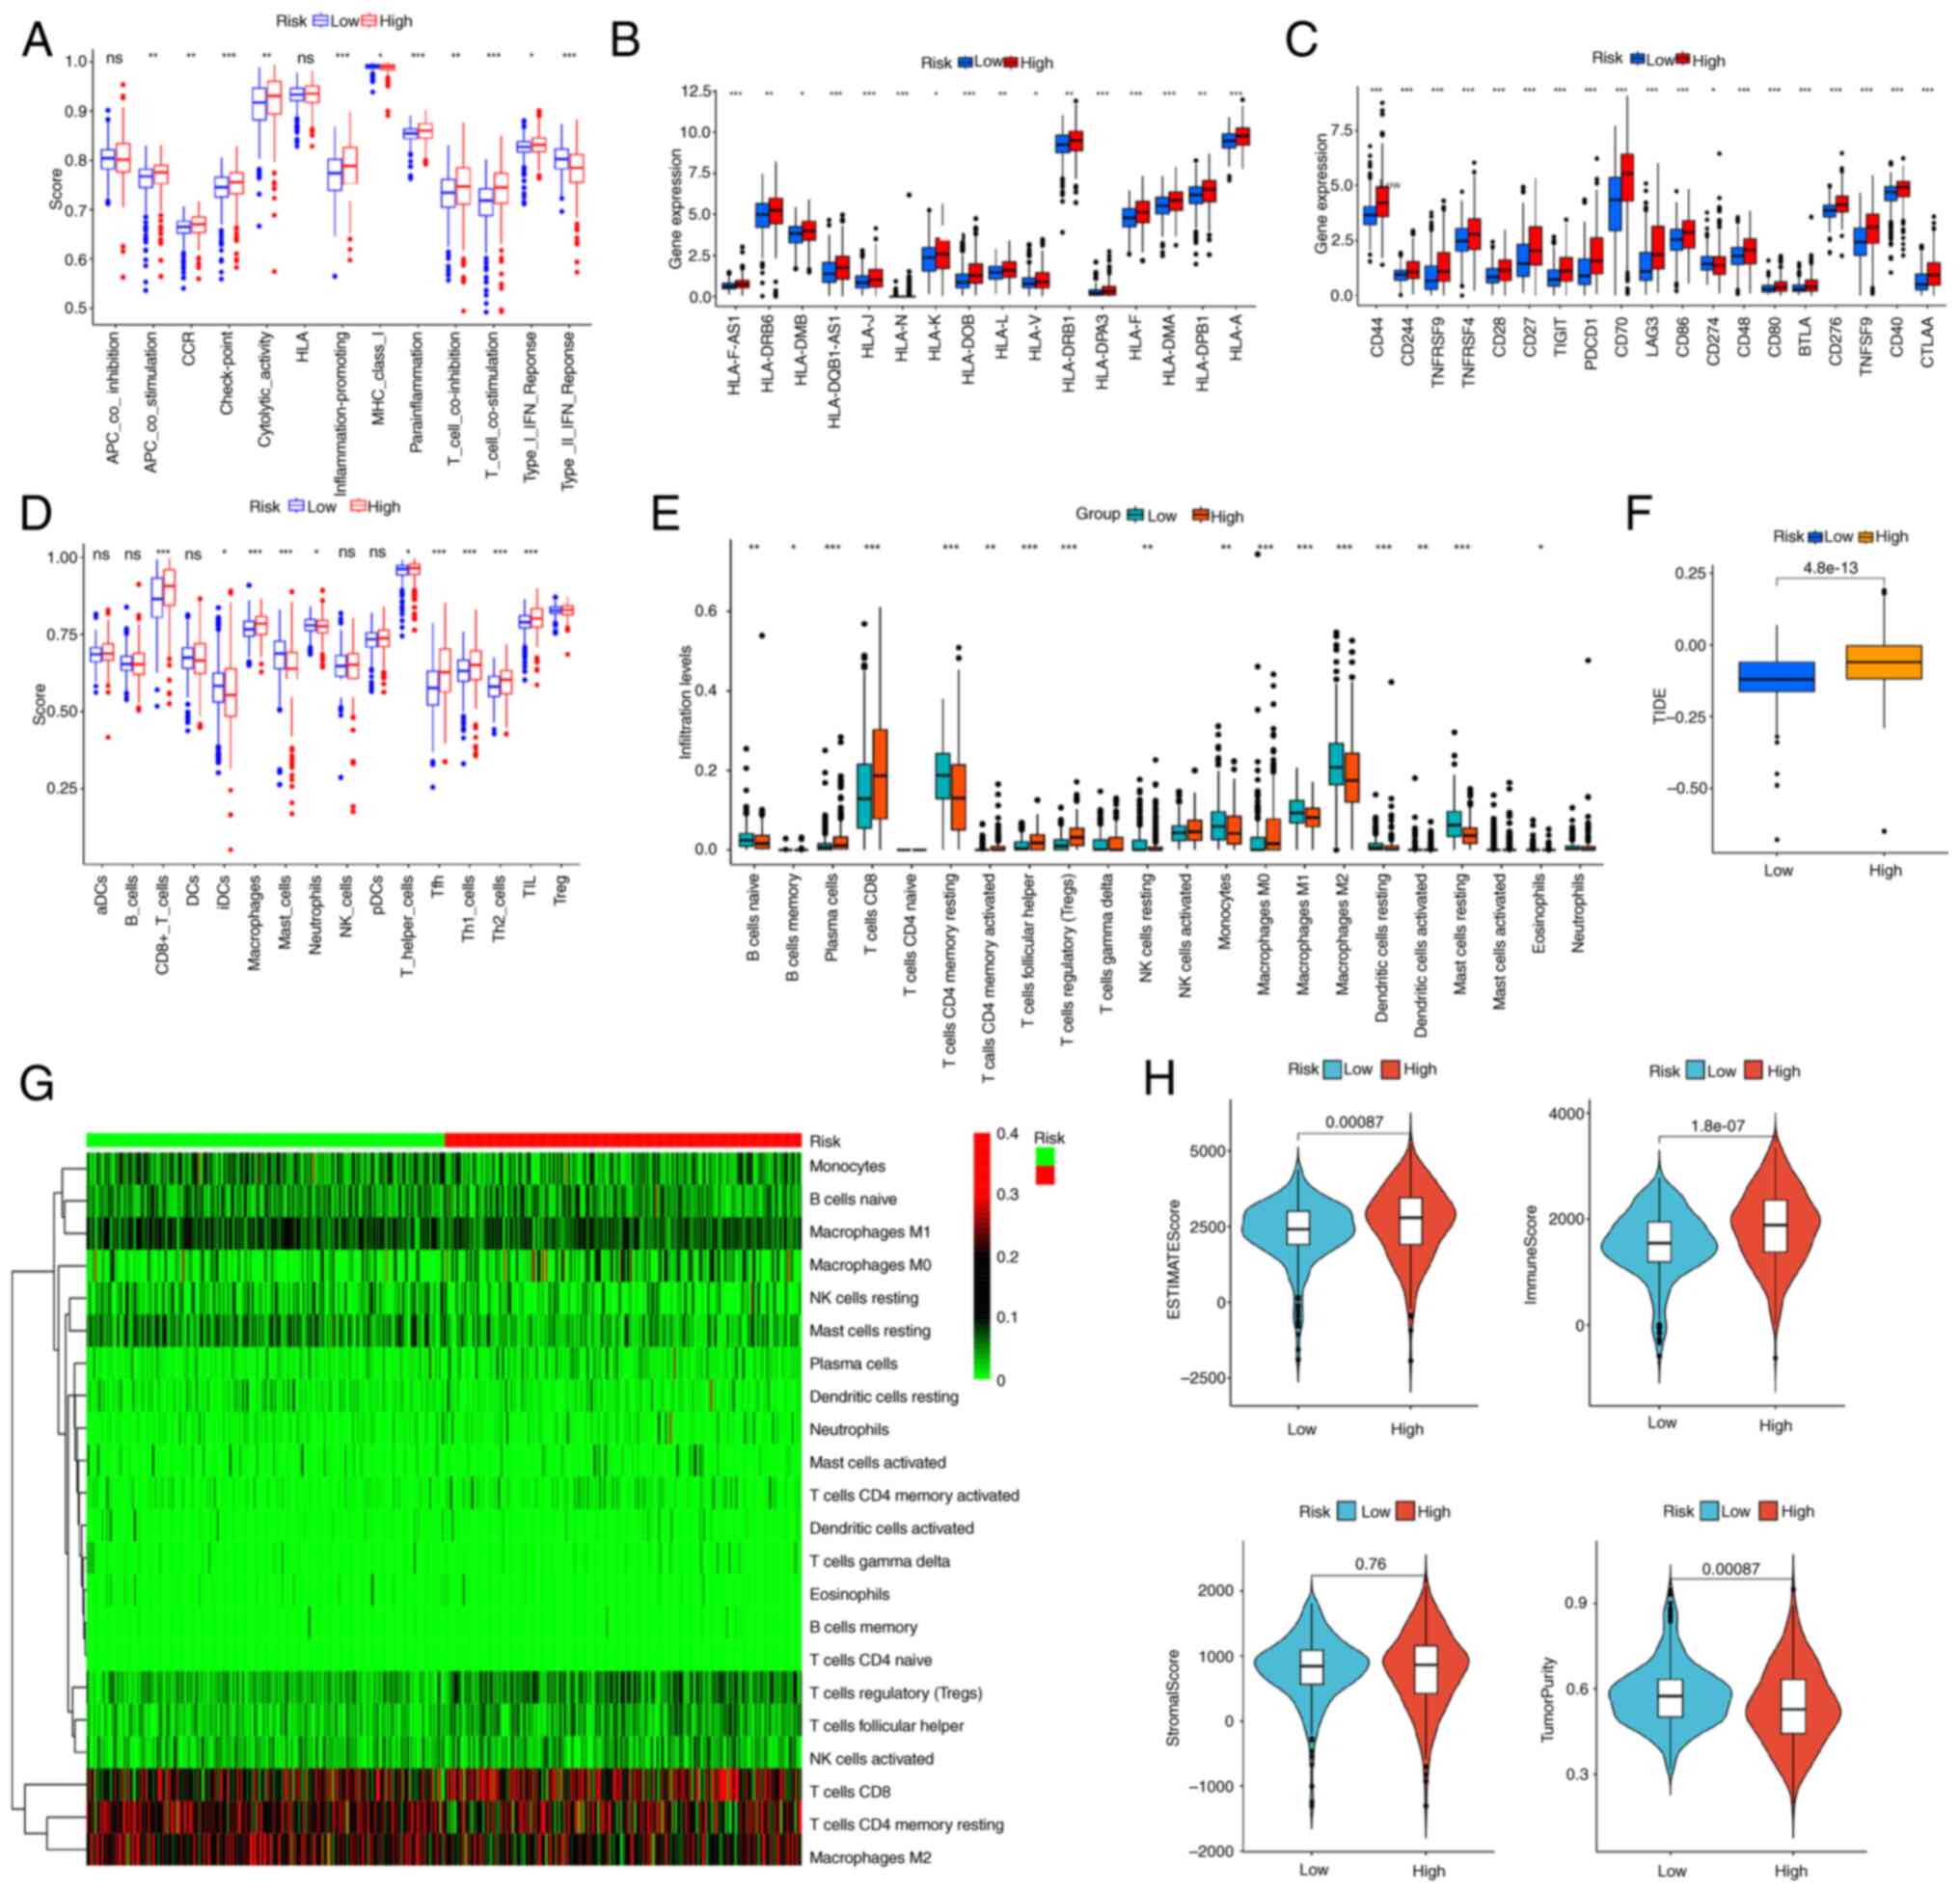
Estimating immune cell infiltration
and immune checkpoint inhibitors
Previous studies showed that the TME serves a
pivotal role in tumorigenesis, and GSEA conducted in the present
study indicated that several immune-related pathways were
associated with the high-risk group. Therefore, the association
with the tumor immune microenvironment was investigated. The ssGSEA
algorithm demonstrated that the high-risk group showed
significantly enhanced immune-related activities and pathways, as
well as a more pronounced infiltration of immune cells in
comparison with the low-risk group (Fig. 6A and D). Additionally, MHC
expression levels were significantly increased in the high-risk
group, compared with that of the low-risk group (Fig. 6B). The high-risk cohort exhibited
significantly increased expression levels of immune checkpoint
inhibitors, including TNFRSF9, PDCD1, TIGIT, LAG3, CD40 and CTLA-4
(Fig. 6C). The CIBERSORT algorithm
indicated that plasma cells, CD8+ T cells, activated
memory CD4+ T cells, Tregs, follicular helper T cells
and M0 macrophages emerged as the predominant immune cells
infiltrating the high-risk cohort (Fig.
6E and G). High TIDE scores in high-risk subtypes suggested
that patients with high-risk ccRCC may exhibit a diminished
response to immunotherapy (Fig.
6F). The ESTIMATE algorithm demonstrated that the high-risk
cohort exhibited decreased tumor purity, and increased
immunological and estimated scores compared with that of the
low-risk group (Fig. 6H).
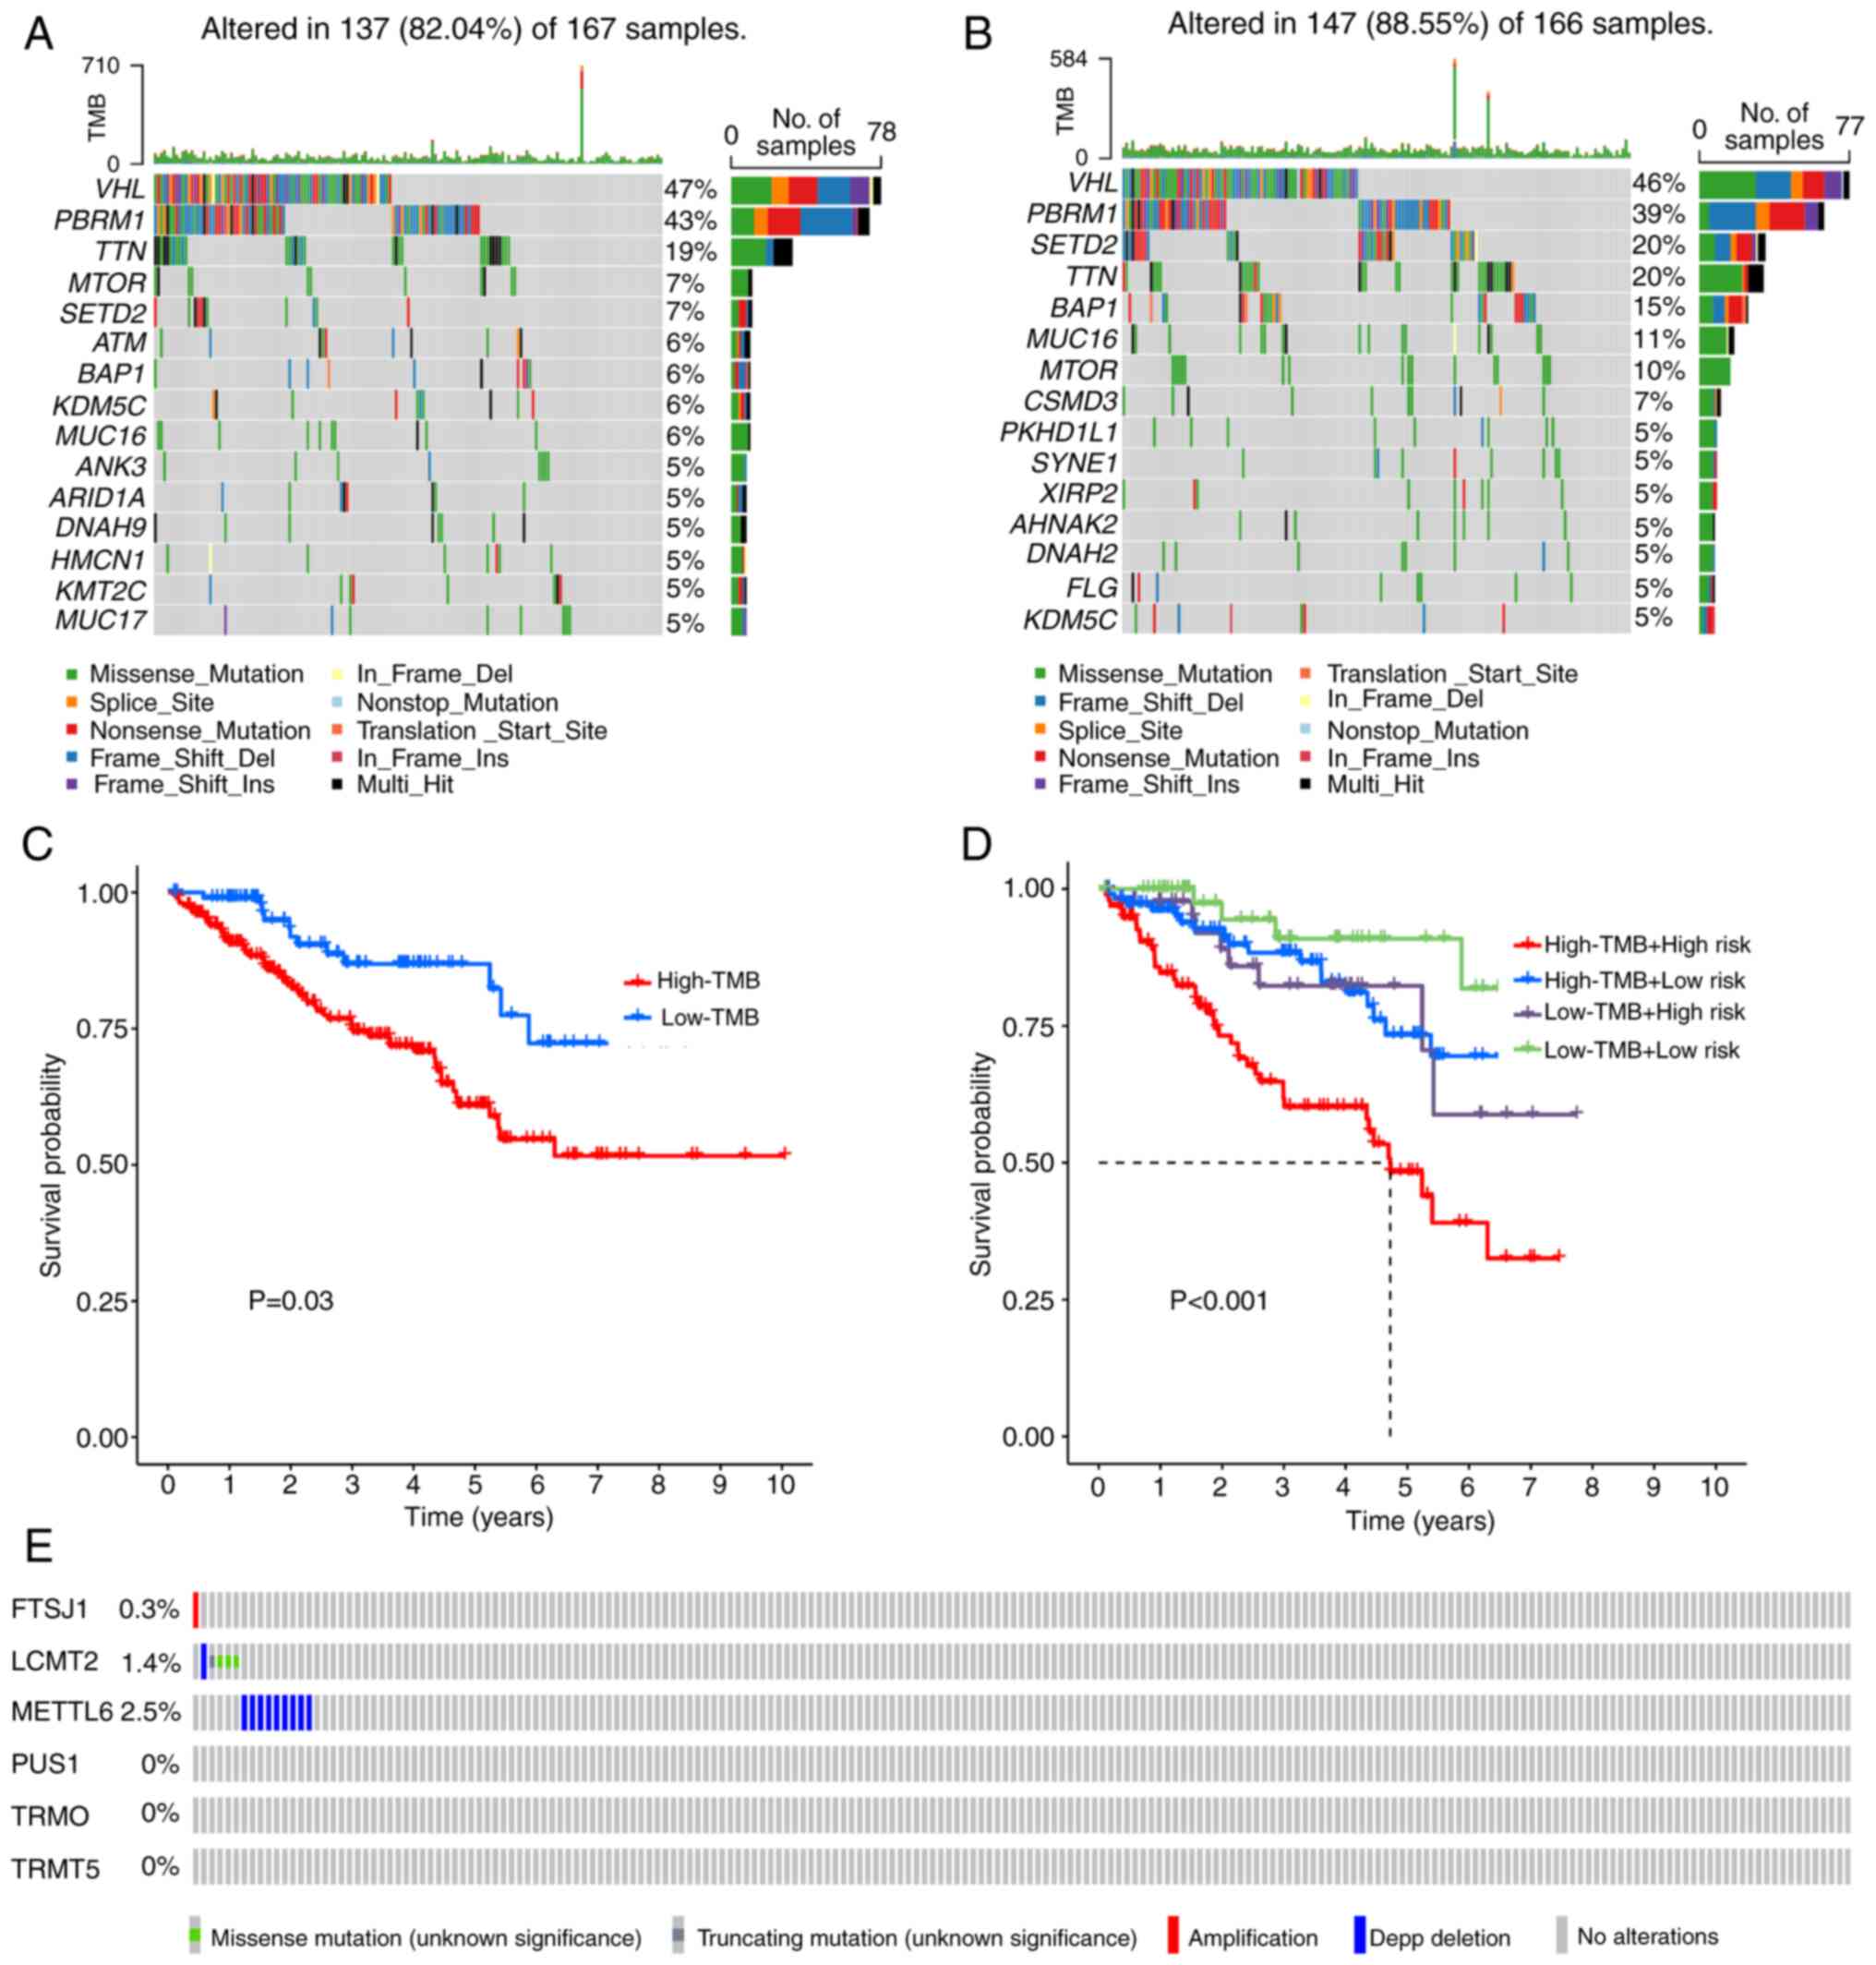
Somatic mutations and TMB scores in
the signature
Primary nucleotide variation data pertaining to
ccRCC were acquired from the TCGA database to investigate the
genomic mutation disparities between high-risk and low-risk
cohorts. Notably, the five genes exhibiting the highest mutation
frequency within the low-risk group were identified as von
Hippel-Lindau tumor suppressor (VHL; 47%), polybromo 1 (PBRM1;
43%), titin (TTN; 19%), mTOR (7%) and SET domain containing 2
histone lysine methyltransferase (SETD2; 7%; Fig. 7A). In the high-risk group, the top
five genes with the highest mutation frequency were VHL (46%),
PBRM1 (39%), SETD2 (20%), TTN (20%) and BRCA1-associated protein 1
(15%; Fig. 7B). Using a cut-off
value is 0.925). The cases stratified into a low-TMB cohort
exhibited a significantly prolonged survival duration compared with
of the high-TMB cohort (Fig. 7C).
The present model demonstrated that the high-risk and high-TMB
cohort exhibited a markedly poorer prognosis when compared with
that of the low-risk and low TMB group (Fig. 7D). Investigation into the mutation
rates of marker genes demonstrated that FTSJ1 exhibited
amplification mutations, while METTL6 was characterized by a
predominance of profound deletion mutations. By contrast, LCMT2
displayed a higher frequency of missense mutations (Fig. 7E).
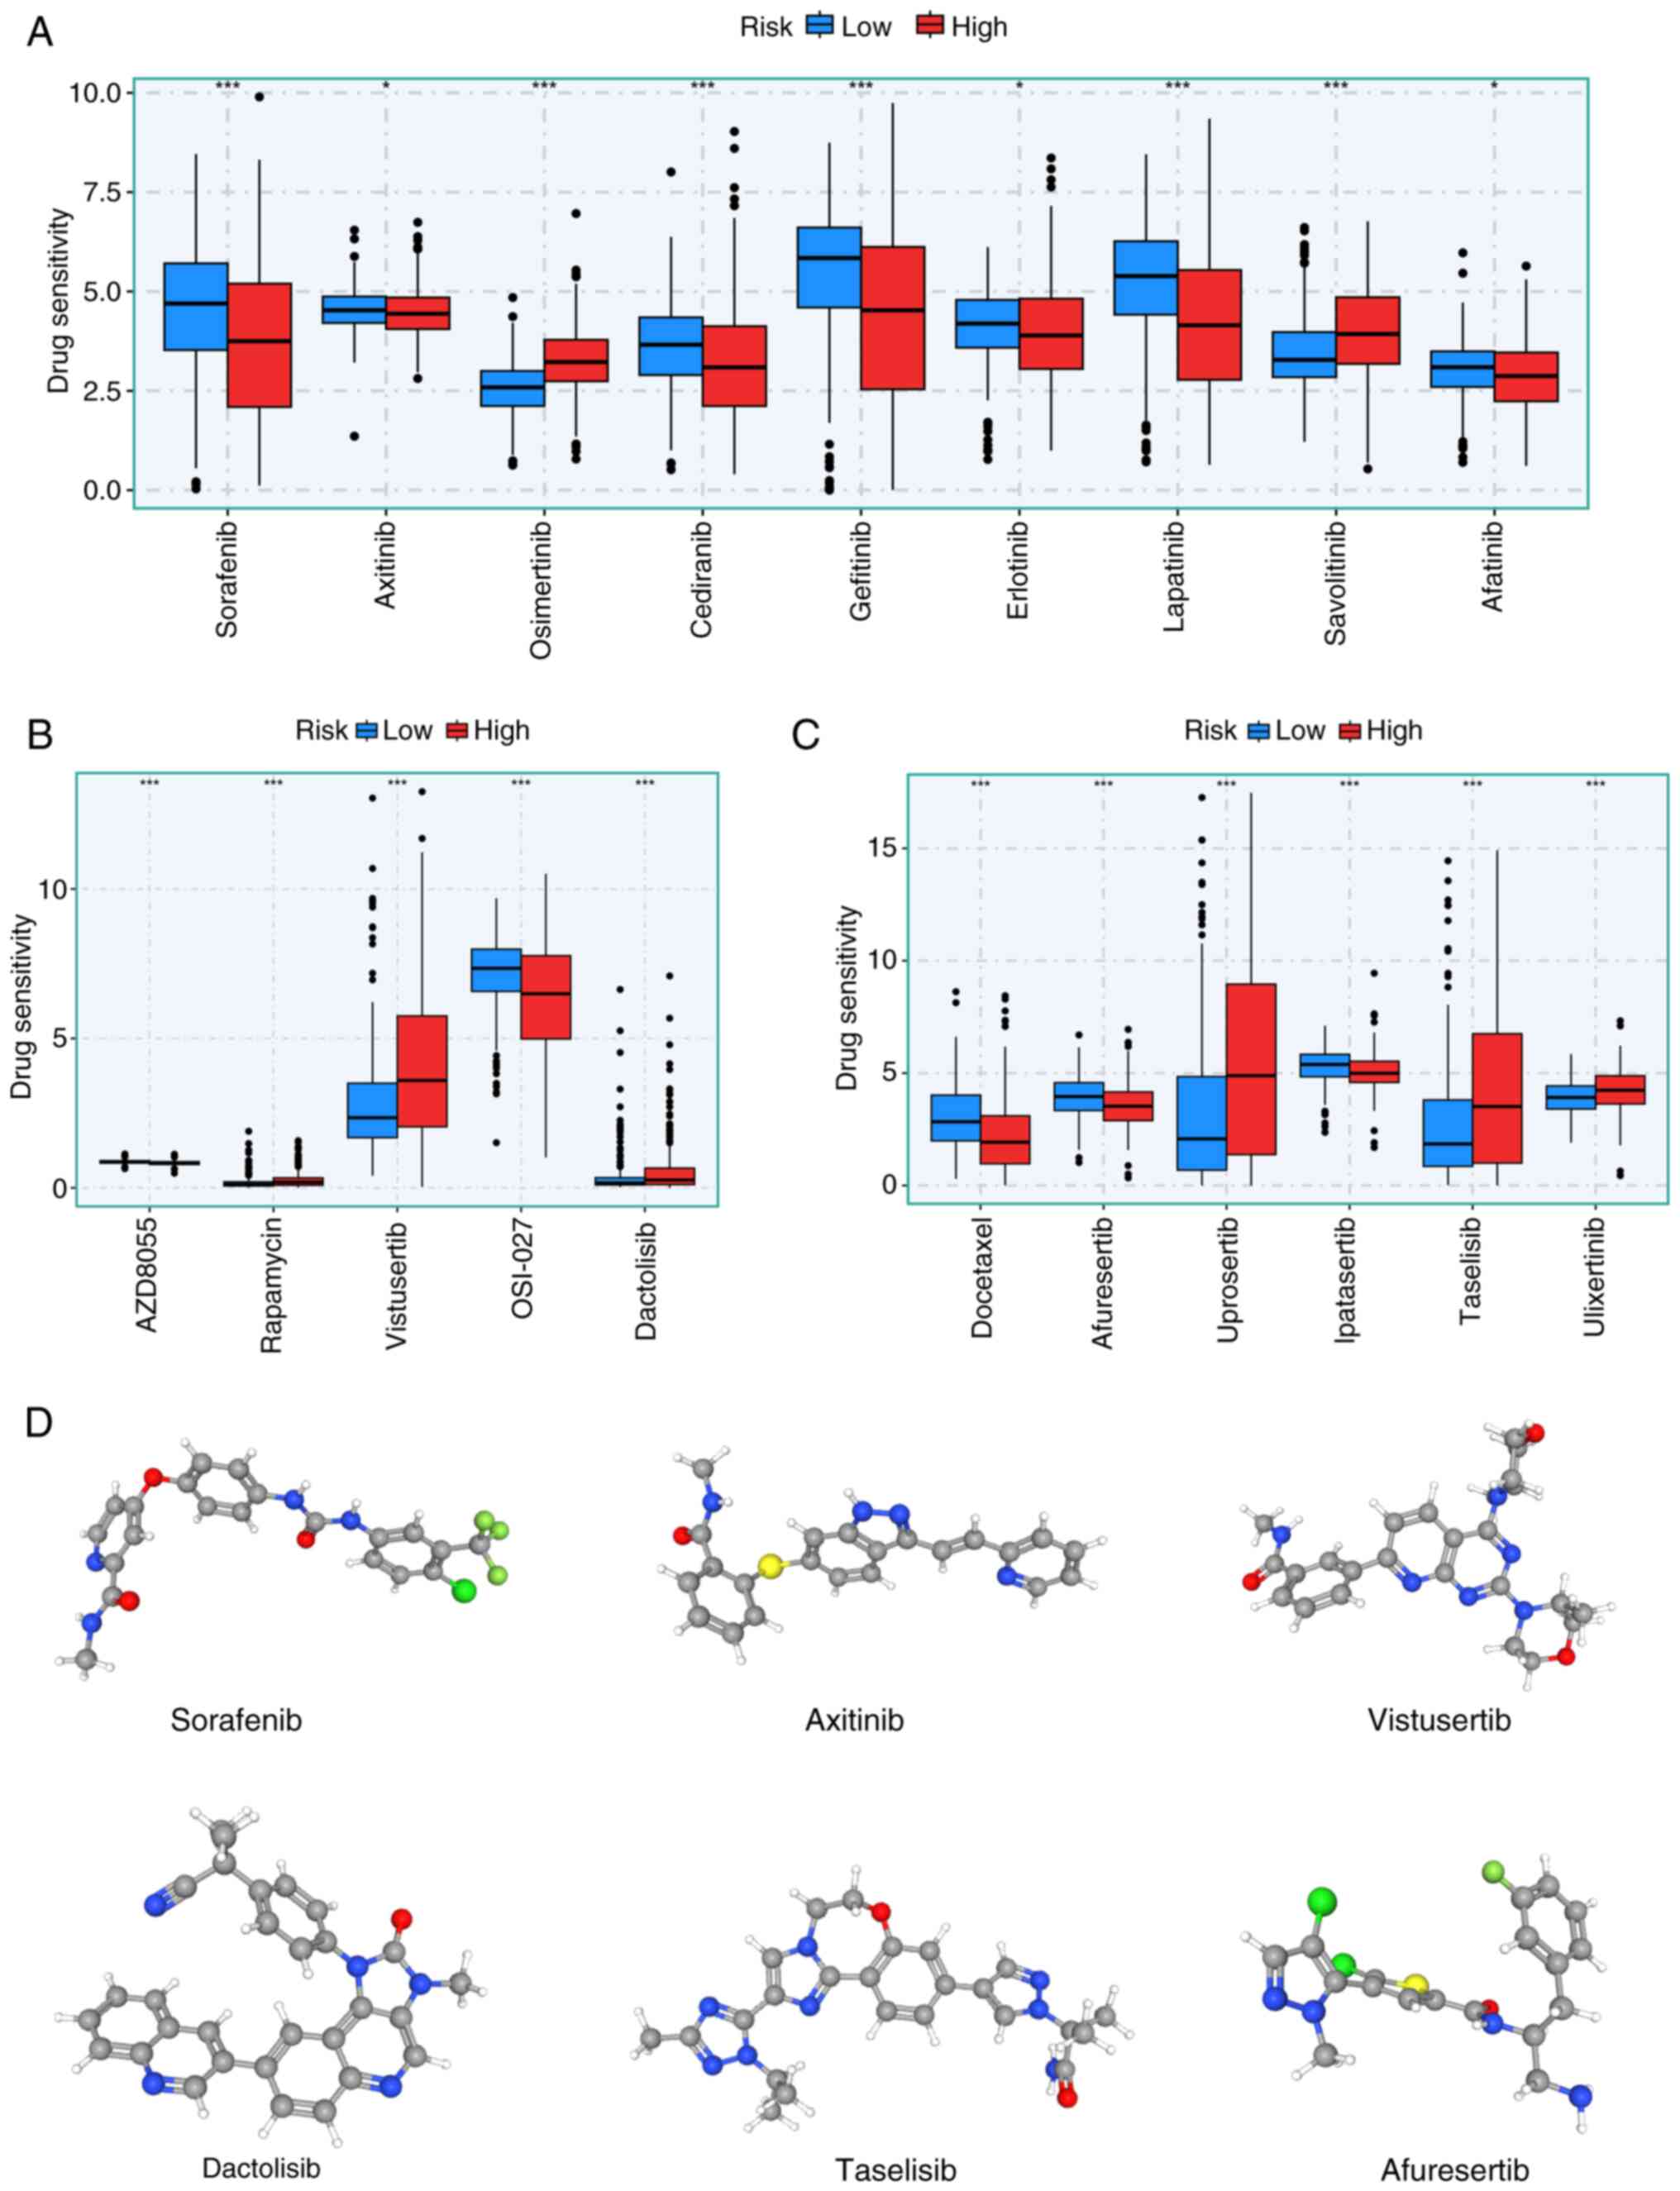
Drug sensitivity prediction
GDSC was used to predict the therapeutic response of
high- and low-risk patient cohorts to widely utilized
chemotherapeutic agents. Significant differences were observed in
the responsiveness of the high- and low-risk cohorts to an array of
chemotherapy agents, including tyrosine kinase (Fig. 8A), mTOR (Fig. 8B), AKT and Erk inhibitors (Fig. 8C). Additionally, the
three-dimensional structures of potential drugs (sorafenib,
axitinib, vistusertib, dactolisib, taselisib and afuresertib) were
displayed using the PubChem database (Fig. 8D).
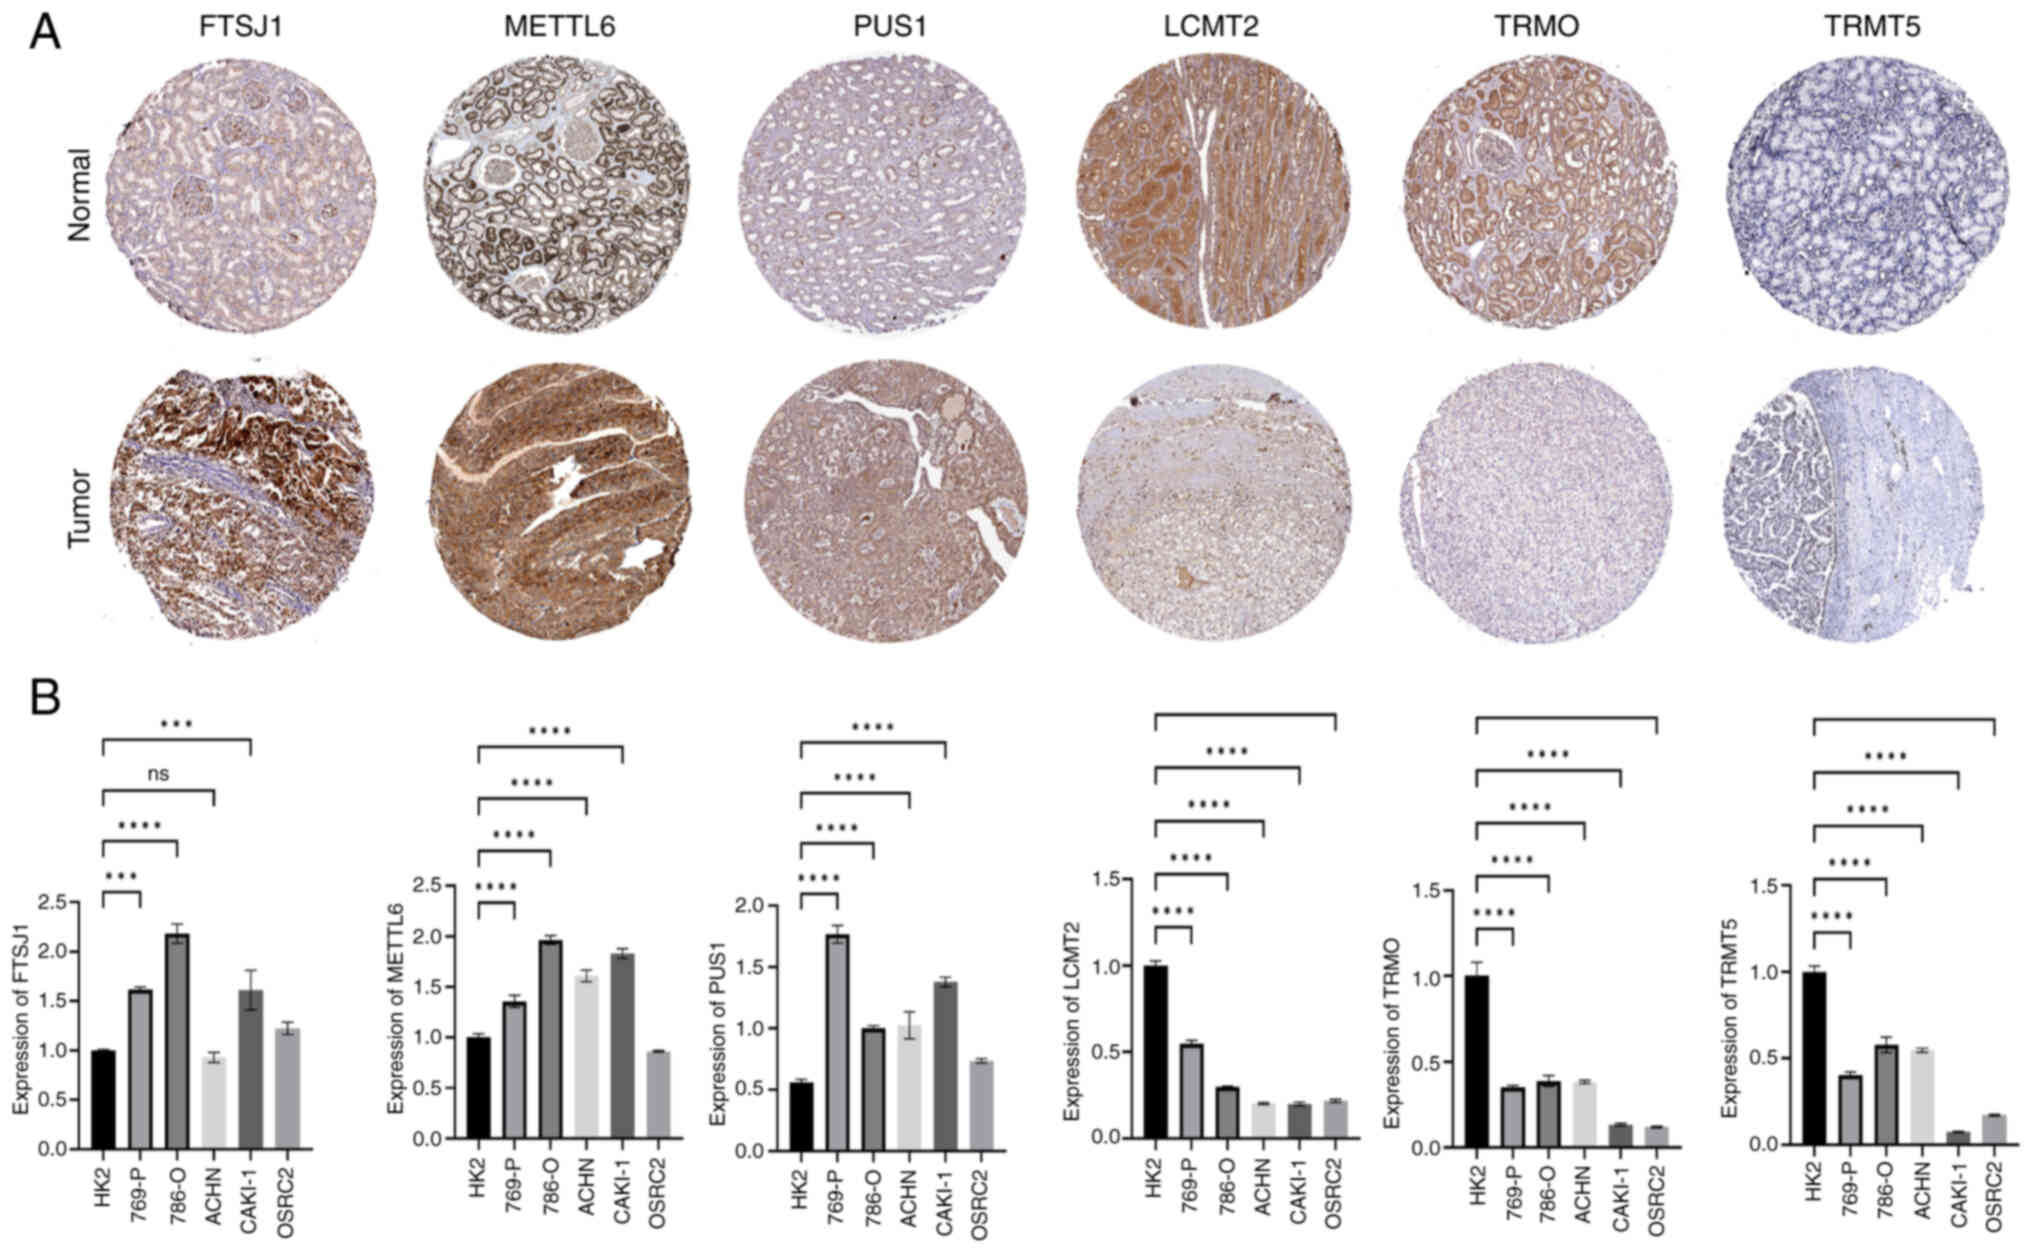
Expression levels of six signature
genes in ccRCC tissues and cell lines
The protein expression levels of the six signature
genes in renal cancer were derived from immunohistochemical
staining data from the HPA database (Fig. 9A). To validate the results, total
RNA was extracted from an array of ccRCC cell lines (786-O, 769-P,
ACHN, Caki-1 and OSRC-2) and HK2 cells. Subsequently, the mRNA
expression levels FTSJ1, LCMT2, METTL6, PUS1, TRMO and TRMT5 of
mRNA were assessed. The RT-qPCR results showed that the mRNA
expression levels of FTSJ1, METTL6 and PUS1 were markedly increased
in ccRCC cells, while the mRNA expression levels of LCMT2, TRMO and
TRMT5 were significantly decreased ccRCC cells compared with that
of HK2 cells (Fig. 9B).
Discussion
There is increasing evidence that the occurrence of
RCC is a multi-step process characterized by the interplay among
genetic, epigenetic and transcriptional changes (25,26).
The development of RCC is often accompanied by mutations of the VHL
gene, which inactivates the VHL protein and promote the
accumulation of Hypoxia-inducible factor (HIF)-1α and HIF-2α,
creating a favorable microenvironment for tumor cell growth
(27,28). Concurrently, downstream target genes
such as VEGF, platelet-derived growth factor, TGF-α and CXCR4 are
activated, leading to increased tumor angiogenesis (29–31).
Anti-angiogenic drugs such as sunitinib and sorafenib, which
inhibit tumor angiogenesis, have been developed based on this
mechanism (32,33). However, a large proportion of
patients with RCC exhibit a short response to these targeted drugs
and several patients develop drug resistance (34–37).
Additionally, some patients experience severe adverse reactions
during treatment, such as hand-foot skin reactions, hypertension
and diarrhea (38–40). Therefore, studying molecular markers
related to RCC metastasis, recurrence and prognosis is important in
order to improve RCC treatment and patient survival rates.
tRNA-modifying enzymes serve a pivotal role in the
occurrence, progression and treatment resistance in tumors by
regulating the modification state of tRNA, which affects protein
translation and cellular stress responses (41–43).
The present study stratified patients with ccRCC into two distinct
clusters, using the molecular subtypes of 24 TMRGs. The two
clusters exhibited significant differences in immune infiltrating
cells and clinical characteristics. Additionally, these clusters
exhibited a strong association with the related immune pathways and
tumor-related mechanisms. A tRNA modification-related signature
composed of six genes (FTSJ1, LCMT2, METTL6, PUS1, TRMO and TRMT5)
were also identified as predictors of clinical outcomes and
treatment responses in patients with ccRCC. The present findings
could potentially enhance the precision of survival probability
forecasts for individuals afflicted by patients with ccRCC.
FTSJ1 is a 2′-O-methyltransferase responsible for
adding a methyl group to the 2′-O position of tRNA, thereby
modifying tRNA (44). In non-small
cell lung cancer, FTSJ1 acts as a tumor suppressor by modifying
tRNA and downregulating DRAM1 (45). Conversely, in triple-negative breast
cancer, it functions as a tumor promoter by facilitating tumor
progression and weakening the immune system's attack (46). However, the role of FTSJ1 in ccRCC
is currently unclear. The present study used the common resource
library (the GEPIA database, which demonstrated that LCMT2 (also
known as TYW4) belongs to the highly variable methyltransferase
superfamily. LCMT2 is identified as the putative homolog of the
carboxy methyltransferase gene PPM2 from Saccharomyces cerevisiae,
which serves a key role in the biosynthesis of the hypermodified
guanosine known as wybutosine (47). LCMT2 catalyzes the final stage of
wybutosine biosynthesis, namely methylation and
methoxycarbonylation (48). LCMT2
is involved in DNA methylation, carrying mutations of intratumoral
heterogeneity and microsatellite instability in colon cancer
frameshift mutations (49). METTL6
is a tRNA methyltransferase that orchestrates the synthesis of
3-methylcytidine at the C32 site of the specific serine tRNA
isoreceptor. METTL6 serves an important role in tumor cell
proliferation; it was reported that knocking out METTL6 in mice led
to a reduction in energy expenditure (50), and the expression levels of METTL6
are increased in luminal breast cancer (51).
PUS1 is a gene encoding an enzyme involved in the
synthesis of pseudouridine, a modified base present in RNA
(52). The pseudouridine
modification has a role in RNA stability, translation and splicing,
and is important for cellular functions such as protein synthesis.
Disruption of PUS1 causes alterations in RNA processing and protein
production, which may result in cancer cell proliferation and
survival (53). Previous studies
have suggested that PUS1 may serve a significant role in the
development of various types of cancer, such as hepatocellular
carcinoma, breast cancer and RCC (54–56).
PUS1 promotes hepatocellular carcinoma through pseudouridylation of
mRNA to enhance the translation of carcinogenic mRNA (54). The upregulation of PUS1 expression
leads to an increase in the activity, migration, invasion and
colony-forming ability of RCC cancer cells (55). Fang et al (56) reported that PUS1 could be utilized
to predict adverse outcomes and triple-negative status in breast
cancer, although these findings are preliminary and require further
investigation to confirm its role in these specific types of
cancer.
TRMO is a gene encoding an enzyme involved in RNA
methylation, and its dysregulation may promote this process by
affecting the methylation of tRNAs involved in the synthesis of
carcinogenic or tumor suppressor proteins (57). TRMO dysregulation has been related
to the susceptibility of differentiated thyroid cancer (58). TRMT5 is a nuclear coding protein
involved in the post-transcriptional maturation of mitochondrial
tRNA and mutations in TRMT5 can lead to complex hereditary
neuropathic syndrome (59). A
previous study has demonstrated the potential role of TRMT5 in
hepatocellular carcinoma, targeting TRMT5 to inhibit hepatocellular
carcinoma progression by inhibiting the HIF-1α pathway and
enhancing sensitivity to adriamycin (60). The present study performed a
comprehensive search using the PubMed database, utilizing the terms
‘GENE and ccRCC’, which indicated that the number of studies on the
five characteristic genes associated with tRNA modification (FTSJ1,
LCMT2, METTL6, TRMO and TRMT5) in ccRCC is limited. One of these
studies reported that, by overexpressing PUS1 and knocking down
PUS1 in RCC cells in vitro, PUS1 expression was associated
with RCC cell viability, migration, invasion and colony-forming
ability (55). Further experimental
and clinical studies are required to confirm their association with
the development of ccRCC.
In recent years, as the treatment of ccRCC has
diversified, immunotherapy has emerged as a popular research area
(61–63). The TME is a complex and dynamic
milieu that encompasses not only tumor cells but also various
extracellular matrix components, blood vessels and immune cells
(64). The interplay between tumor
cells and immune cells within the TME is instrumental in
orchestrating the dynamics of tumor, immune evasion and response to
cancer therapy (65). M2
macrophages are generally regarded as tumor promoters since they
facilitate tissue remodeling, angiogenesis (formation of new blood
vessels) and immunosuppression. M0 macrophages can be stimulated by
Th2 cytokines to transform into M2 macrophages, which release
cytokines such as IL-10 and TGF-β, inhibit the anti-tumor immune
response and promote tumor cell proliferation (66). Tregs are immune cells that suppress
the activity of other immune cells and maintain immune tolerance
(67).
Previous studies have shown that Tregs are a type of
immunosuppressive cell (68–70).
In cancer, Tregs are frequently elevated in the TME and promote
immune escape by inhibiting the functions of other immune cells
that might attack the tumor (71–73).
Tregs and macrophages M0 were the main immune cells infiltrating
the high-risk group. Regulation of tRNA modifications may be
associated with immune cell activation (74) In particular, specific tRNA
modifications could facilitate the translation of genes that are
crucial for maintaining the suppressive activity Tregs (16). For instance, tRNA modifications can
influence macrophages from a resting state (M0) towards
pro-inflammatory (M1) or anti-inflammatory (M2) phenotypes
(75). Although the direct
relationship between tRNA modification genes and the precise
regulation of Tregs or M0 macrophages remains an area warranting
further investigation, it is plausible that these modifications
impact translational control over immune cell differentiation,
function and metabolism. Research in this domain has the potential
to yield novel insights into immune regulation and identify
therapeutic targets for diseases related to immune dysfunction. The
relationship between Tregs, M0 macrophages and the 6 genes
identified (FTSJ1, LCMT2, METTL6, PUS1, TRMO and TRMT5) is
currently unclear. The present results suggested that patients in
high-risk subgroups of TMRGs are more susceptible to cancer
immunosuppression. Tumor cells and immune cells within the TME
typically express immune checkpoint proteins, such as PD-1 and
CTLA-4, which inhibit T cell activation and facilitate immune
tolerance (76,77). The upregulation of these checkpoints
constitutes the primary mechanism through which tumors evade the
immune response (78).
Immunotherapies, such as immune checkpoint inhibitors (anti-PD-1
and anti-CTLA-4) have demonstrated successful outcomes in the
treatment of certain types of cancer by restoring T-cell responses
and overcoming immunosuppression within the TME (79). According to the present study, the
expression levels of TNFRSF9, PD-1, TIGIT, LAG3, CD40 and CTLA-4
were significantly increased in the high-risk groups. Therefore,
the tumor immune environment could be evaluated using immune
checkpoint expression and the potential effectiveness of immune
checkpoint inhibitors may be anticipated. TMB scores are a
molecular marker to determine whether tumor patients are suitable
for immunotherapy (80). Patients
harboring tumors with a higher TMB score experience a significantly
enhanced clinical benefit after receiving immune checkpoint
inhibitors (81). TMB also showed
strong efficacy in predicting overall survival.
In the present study, the low-TMB group exhibited a
significantly prolonged survival compared with that of the high-TMB
cohort. Furthermore, the high-risk + high-TMB subgroup demonstrated
a significantly poorer prognosis compared with that of the low-risk
+ low-TMB group. Notably, there were significant differences in
sensitivity between high- and low-risk groups to various
chemotherapy agents; these results may potentially inform tailored
treatment strategies for both high- and low-risk patients in the
future. RT-qPCR was performed to measure the expression levels of
the model genes in ccRCC cell lines. A total of six model genes
were observed, which is consistent with a previous analysis.
However, further experiments are needed, both in vivo and
in vitro, to verify functional disparities among the model
genes. Among the several prognostic genes associated with ccRCC,
TMRGs remain understudied. To the best of our knowledge, there is
no reliable model to predict the prognosis of patients with ccRCC
based on tRNA modification genes. Compared with other prognostic
models of ccRCC, the model in the present study is composed of
fewer genes, had higher accuracy and may improves feasibility for
future clinical and basic studies (82).
However, there are certain limitations of the
present study. First, the present study is predominantly limited to
publicly accessible databases for bioinformatic methods; therefore,
it is necessary that further in vivo and in vitro
experiments are conducted to elucidate the impact of these six
model genes on the occurrence and development of the disease in
patients with ccRCC. Second, the present study only analyzed the
association between the risk model and immune cells, immune
function, MHC molecules, immune checkpoints and immunotherapy.
However, the significance of the model, particularly when
integrated with immunotherapy, necessitates an ongoing commitment
to accumulate a substantial array of samples for thorough
evaluation. Finally, screening tRNA modified genes only based on
MSigDB has certain limitations, such as i) data coverage: Although
MSigDB contains a large gene set, it mainly focuses on known
biological pathways and functional annotations and may not cover
all genes associated with tRNA modification, particularly newly
discovered genes or genes that have not been adequately studied;
and ii) species diversity: MSigDB data mainly focuses on model
organisms such as humans and mice, and may lack information on tRNA
modified genes in other species, which limited the scope of the
present study. However, the tRNA modified genes screened from the
MSigDB are comprehensive, and to the best of our knowledge, no
other database has been found to date with more comprehensive data.
If more comprehensive or additional databases are found in the
future, they may be used for additional validation in the
future.
In conclusion, the present study identified a new
prognostic model in ccRCC containing six genes (FTSJ1, LCMT2,
METTL6, PUS1, TRMO and TRMT5), based on TMRGs. Furthermore, the
disparities in immune profiles, genetic mutation statuses and
pharmacological sensitivities across various molecular subtypes and
risk categories were examined. The present findings may improve
prognosis and facilitate personalized treatment strategies for
patients with ccRCC, thereby enhancing individualized patient
management.
Supplementary Material
Supporting Data
Acknowledgements
Not applicable.
Funding
The present work was supported by the Youth Project of Health
Commission of Nantong City (grant no. QN2022017), Nantong Science
and Technology Bureau (grant no. MS22019009) and Basic Research and
Social Minsheng Plan Project (grant no. JC12022008).
Availability of data and materials
The data generated in the present study may be
requested from the corresponding author.
Authors' contributions
BZ designed the present study. ZC, CS, XZ and WZ
performed experiments. ZC, SYX, YFJ and XZ conducted the data
analysis. XZ and ZC wrote the manuscript which was examined and
revised by BZ. ZC and BZ confirm the authenticity of all the raw
data. All authors read and approved the final manuscript.
Ethics approval and consent to
participate
Not applicable.
Patient consent for publication
Not applicable.
Competing interests
The authors declare that they have no competing
interests.
References
|
1
|
Moch H, Amin MB, Berney DM, Compérat EM,
Gill AJ, Hartmann A, Menon S, Raspollini MR, Rubin MA, Srigley JR,
et al: The 2022 World Health Organization classification of tumours
of the urinary system and male genital organs-part A: Renal,
penile, and testicular tumours. Eur Urol. 82:458–468. 2022.
View Article : Google Scholar : PubMed/NCBI
|
|
2
|
Bray F, Laversanne M, Sung H, Ferlay J,
Siegel RL, Soerjomataram I and Jemal A: Global cancer statistics
2022: GLOBOCAN estimates of incidence and mortality worldwide for
36 cancers in 185 countries. CA Cancer J Clin. 74:229–263. 2024.
View Article : Google Scholar : PubMed/NCBI
|
|
3
|
Miller KD, Nogueira L, Mariotto AB,
Rowland JH, Yabroff KR, Alfano CM, Jemal A, Kramer JL and Siegel
RL: Cancer treatment and survivorship statistics, 2019. CA Cancer J
Clin. 69:363–385. 2019. View Article : Google Scholar : PubMed/NCBI
|
|
4
|
Chujo T and Tomizawa K: Human transfer RNA
modopathies: Diseases caused by aberrations in transfer RNA
modifications. FEBS J. 288:7096–7122. 2021. View Article : Google Scholar : PubMed/NCBI
|
|
5
|
Suzuki T: The expanding world of tRNA
modifications and their disease relevance. Nat Rev Mol Cell Biol.
22:375–392. 2021. View Article : Google Scholar : PubMed/NCBI
|
|
6
|
Ren D, Mo Y, Yang M, Wang D, Wang Y, Yan
Q, Guo C, Xiong W, Wang F and Zeng Z: Emerging roles of tRNA in
cancer. Cancer Lett. 563:2161702023. View Article : Google Scholar : PubMed/NCBI
|
|
7
|
Ying X, Liu B, Yuan Z, Huang Y, Chen C,
Jiang X, Zhang H, Qi D, Yang S, Lin S, et al: METTL1-m7
G-EGFR/EFEMP1 axis promotes the bladder cancer development. Clin
Transl Med. 11:e6752021. View
Article : Google Scholar : PubMed/NCBI
|
|
8
|
Li T, Chen Z, Wang Z, Lu J and Chen D:
Combined signature of N7-methylguanosine regulators with their
related genes and the tumor microenvironment: a prognostic and
therapeutic biomarker for breast cancer. Front Immunol.
14:12601952023. View Article : Google Scholar : PubMed/NCBI
|
|
9
|
Chen B, Jiang W, Huang Y, Zhang J, Yu P,
Wu L and Peng H: N7-methylguanosine tRNA modification
promotes tumorigenesis and chemoresistance through WNT/β-catenin
pathway in nasopharyngeal carcinoma. Oncogene. 41:2239–2253. 2022.
View Article : Google Scholar : PubMed/NCBI
|
|
10
|
Hanahan D and Weinberg RA: Hallmarks of
cancer: The next generation. Cell. 144:646–674. 2011. View Article : Google Scholar : PubMed/NCBI
|
|
11
|
Quail DF and Joyce JA: Microenvironmental
regulation of tumor progression and metastasis. Nat Med.
19:1423–1437. 2013. View Article : Google Scholar : PubMed/NCBI
|
|
12
|
Kalluri R: The biology and function of
fibroblasts in cancer. Nat Rev Cancer. 16:582–598. 2016. View Article : Google Scholar : PubMed/NCBI
|
|
13
|
Binnewies M, Roberts EW, Kersten K, Chan
V, Fearon DF, Merad M, Coussens LM, Gabrilovich DI,
Ostrand-Rosenberg S, Hedrick CC, et al: Understanding the tumor
immune microenvironment (TIME) for effective therapy. Nat Med.
24:541–550. 2018. View Article : Google Scholar : PubMed/NCBI
|
|
14
|
Lee SC, Dacheux MA, Norman DD, Balázs L,
Torres RM, Augelli-Szafran CE and Tigyi GJ: Regulation of tumor
immunity by lysophosphatidic acid. Cancers (Basel). 12:12022020.
View Article : Google Scholar : PubMed/NCBI
|
|
15
|
Laplagne C, Domagala M, Le Naour A,
Quemerais C, Hamel D, Fournié JJ, Couderc B, Bousquet C, Ferrand A
and Poupot M: Latest advances in targeting the tumor
microenvironment for tumor suppression. Int J Mol Sci. 20:47192019.
View Article : Google Scholar : PubMed/NCBI
|
|
16
|
Liu Y, Zhou J, Li X, Zhang X, Shi J, Wang
X, Li H, Miao S, Chen H, He X, et al: tRNA-m1A modification
promotes T cell expansion via efficient MYC protein synthesis. Nat
Immunol. 23:1433–1444. 2022. View Article : Google Scholar : PubMed/NCBI
|
|
17
|
Orellana EA, Liu Q, Yankova E, Pirouz M,
De Braekeleer E, Zhang W, Lim J, Aspris D, Sendinc E, Garyfallos
DA, et al: METTL1-mediated m7G modification of Arg-TCT
tRNA drives oncogenic transformation. Mol Cell. 81:3323–3338.e14.
2021. View Article : Google Scholar : PubMed/NCBI
|
|
18
|
Endres L, Fasullo M and Rose R: tRNA
modification and cancer: Potential for therapeutic prevention and
intervention. Future Med Chem. 11:885–900. 2019. View Article : Google Scholar : PubMed/NCBI
|
|
19
|
Galon J, Angell HK, Bedognetti D and
Marincola FM: The continuum of cancer immunosurveillance:
Prognostic, predictive, and mechanistic signatures. Immunity.
39:11–26. 2013. View Article : Google Scholar : PubMed/NCBI
|
|
20
|
Liu J, Yao L, Yang Y, Ma J, You R, Yu Z
and Du P: A novel stemness-related lncRNA signature predicts
prognosis, immune infiltration and drug sensitivity of clear cell
renal cell carcinoma. J Transl Med. 23:2382025. View Article : Google Scholar : PubMed/NCBI
|
|
21
|
Wing JB, Tanaka A and Sakaguchi S: Human
FOXP3+ regulatory T cell heterogeneity and function in
autoimmunity and cancer. Immunity. 50:302–316. 2019. View Article : Google Scholar : PubMed/NCBI
|
|
22
|
Wu SY, Fu T, Jiang YZ and Shao ZM: Natural
killer cells in cancer biology and therapy. Mol Cancer. 19:1202020.
View Article : Google Scholar : PubMed/NCBI
|
|
23
|
Livak KJ and Schmittgen TD: Analysis of
relative gene expression data using real-time quantitative PCR and
the 2(−Delta Delta C(T)) method. Methods. 25:402–408. 2001.
View Article : Google Scholar : PubMed/NCBI
|
|
24
|
Hong K, Cen K, Chen Q, Dai Y, Mai Y and
Guo Y: Identification and validation of a novel senescence-related
biomarker for thyroid cancer to predict the prognosis and
immunotherapy. Front Immunol. 14:11283902023. View Article : Google Scholar : PubMed/NCBI
|
|
25
|
Linehan WM, Srinivasan R and Schmidt LS:
The genetic basis of kidney cancer: A metabolic disease. Nat Rev
Urol. 7:277–285. 2020. View Article : Google Scholar : PubMed/NCBI
|
|
26
|
Linehan WM, Bratslavsky G, Pinto PA,
Schmidt LS, Neckers L, Bottaro DP and Srinivasan R: Molecular
diagnosis and therapy of kidney cancer. Annu Rev Med. 61:329–343.
2010. View Article : Google Scholar : PubMed/NCBI
|
|
27
|
Hsieh JJ, Purdue MP, Signoretti S, Swanton
C, Albiges L, Schmidinger M, Heng DY, Larkin J and Ficarra V: Renal
cell carcinoma. Nat Rev Dis Primers. 3:170092017. View Article : Google Scholar : PubMed/NCBI
|
|
28
|
Moore LE, Nickerson ML, Brennan P, Toro
JR, Jaeger E, Rinsky J, Han SS, Zaridze D, Matveev V, Janout V, et
al: Von Hippel-Lindau (VHL) inactivation in sporadic clear cell
renal cancer: Associations with germline VHL polymorphisms and
etiologic risk factors. PLoS Genet. 7:e10023122011. View Article : Google Scholar : PubMed/NCBI
|
|
29
|
Semenza GL: Hypoxia-inducible factors:
Mediators of cancer progression and targets for cancer therapy.
Trends Pharmacol Sci. 33:207–214. 2012. View Article : Google Scholar : PubMed/NCBI
|
|
30
|
Gnarra JR, Tory K, Weng Y, Schmidt L, Wei
MH, Li H, Latif F, Liu S, Chen F, Duh FM, et al: Mutations of the
VHL tumour suppressor gene in renal carcinoma. Nat Genet. 7:85–90.
1994. View Article : Google Scholar : PubMed/NCBI
|
|
31
|
Maas M, Kurcz A, Hennenlotter J, Scharpf
M, Fend F, Walz S, Stühler V, Todenhöfer T, Stenzl A, Bedke J and
Rausch S: Differential expression and clinical relevance of C-X-C
motif chemokine receptor 4 (CXCR4) in renal cell carcinomas, benign
renal tumors, and metastases. Int J Mol Sci. 24:52272023.
View Article : Google Scholar : PubMed/NCBI
|
|
32
|
Massari F, Ciccarese C, Santoni M,
Brunelli M, Piva F, Modena A, Bimbatti D, Fantinel E, Santini D,
Cheng L, et al: Metabolic alterations in renal cell carcinoma.
Cancer Treat Rev. 41:767–776. 2015. View Article : Google Scholar : PubMed/NCBI
|
|
33
|
Choueiri TK, Hessel C, Halabi S, Sanford
B, Michaelson MD, Hahn O, Walsh M, Olencki T, Picus J, Small EJ, et
al: Cabozantinib versus sunitinib as initial therapy for metastatic
renal cell carcinoma of intermediate or poor risk (Alliance A031203
CABOSUN randomised trial): Progression-free survival by independent
review and overall survival update. Eur J Cancer. 94:115–125. 2018.
View Article : Google Scholar : PubMed/NCBI
|
|
34
|
Porta C, Procopio G, Cartenì G, Sabbatini
R, Bearz A, Chiappino I, Ruggeri EM, Re GL, Ricotta R, Zustovich F,
et al: Sequential use of sorafenib and sunitinib in advanced
renal-cell carcinoma (RCC): An Italian multicentre retrospective
analysis of 189 patient cases. BJU Int. 108:E250–E257. 2011.
View Article : Google Scholar : PubMed/NCBI
|
|
35
|
Wang Q, Gao S, Shou Y, Jia Y, Wei Z, Liu
Y, Shi J, Miao D, Miao Q, Zhao C, et al: AIM2 promotes renal cell
carcinoma progression and sunitinib resistance through FOXO3a-ACSL4
axis-regulated ferroptosis. Int J Biol Sci. 19:1266–1283. 2023.
View Article : Google Scholar : PubMed/NCBI
|
|
36
|
Wang Y, Liu X, Gong L, Ding W, Hao W, Peng
Y, Zhang J, Cai W and Gao Y: Mechanisms of sunitinib resistance in
renal cell carcinoma and associated opportunities for therapeutics.
Br J Pharmacol. 180:2937–2955. 2023. View Article : Google Scholar : PubMed/NCBI
|
|
37
|
Sun H, Zheng J, Xiao J, Yue J, Shi Z, Xuan
Z, Chen C, Zhao Y, Tang W, Ye S, et al: TOPK/PBK is phosphorylated
by ERK2 at serine 32, promotes tumorigenesis and is involved in
sorafenib resistance in RCC. Cell Death Dis. 13:4502022. View Article : Google Scholar : PubMed/NCBI
|
|
38
|
Li J, Zhang L, Ge T, Liu J, Wang C and Yu
Q: Understanding sorafenib-induced cardiovascular toxicity:
Mechanisms and treatment implications. Drug Des Devel Ther.
18:829–843. 2024. View Article : Google Scholar : PubMed/NCBI
|
|
39
|
Li Y, Li S, Zhu Y, Liang X, Meng H, Chen
J, Zhang D, Guo H and Shi B: Incidence and risk of
sorafenib-induced hypertension: A systematic review and
meta-analysis. J Clin Hypertens (Greenwich). 16:177–185. 2014.
View Article : Google Scholar : PubMed/NCBI
|
|
40
|
Yang Y and Bu P: Progress on the
cardiotoxicity of sunitinib: Prognostic significance, mechanism and
protective therapies. Chem Biol Interact. 257:125–131. 2016.
View Article : Google Scholar : PubMed/NCBI
|
|
41
|
Cui W, Zhao D, Jiang J, Tang F, Zhang C
and Duan C: tRNA modifications and modifying enzymes in disease,
the potential therapeutic targets. Int J Biol Sci. 19:1146–1162.
2023. View Article : Google Scholar : PubMed/NCBI
|
|
42
|
Huang H, Li H, Pan R, Wang S and Liu X:
tRNA modifications and their potential roles in pancreatic cancer.
Arch Biochem Biophys. 714:1090832021. View Article : Google Scholar : PubMed/NCBI
|
|
43
|
Begley U, Sosa MS, Avivar-Valderas A,
Patil A, Endres L, Estrada Y, Chan CTY, Su D, Dedon PC,
Aguirre-Ghiso JA and Begley T: A human tRNA methyltransferase
9-like protein prevents tumour growth by regulating LIN9 and
HIF1-α. EMBO Mol Med. 5:366–383. 2013. View Article : Google Scholar : PubMed/NCBI
|
|
44
|
Brazane M, Dimitrova DG, Pigeon J,
Paolantoni C, Ye T, Marchand V, Da Silva B, Schaefer E, Angelova
MT, Stark Z, et al: The ribose methylation enzyme FTSJ1 has a
conserved role in neuron morphology and learning performance. Life
Sci Alliance. 6:e2022018772023. View Article : Google Scholar : PubMed/NCBI
|
|
45
|
He Q, Yang L, Gao K, Ding P, Chen Q, Xiong
J, Yang W, Song Y, Wang L, Wang Y, et al: FTSJ1 regulates tRNA
2′-O-methyladenosine modification and suppresses the malignancy of
NSCLC via inhibiting DRAM1 expression. Cell Death Dis. 11:3482020.
View Article : Google Scholar : PubMed/NCBI
|
|
46
|
Pruitt KD, Tatusova T, Klimke W and
Maglott DR: NCBI reference sequences: Current status, policy and
new initiatives. Nucleic Acids Res. 37((Database Issue)): D32–D36.
2009. View Article : Google Scholar : PubMed/NCBI
|
|
47
|
Sun Y, Liu Q, Zhong S, Wei R and Luo JL:
Triple-negative breast cancer intrinsic FTSJ1 favors tumor
progression and attenuates CD8+ T cell infiltration. Cancers
(Basel). 16:5972024. View Article : Google Scholar : PubMed/NCBI
|
|
48
|
Suzuki Y, Noma A, Suzuki T, Ishitani R and
Nureki O: Structural basis of tRNA modification with CO2 fixation
and methylation by wybutosine synthesizing enzyme TYW4. Nucleic
Acids Res. 37:2910–2925. 2009. View Article : Google Scholar : PubMed/NCBI
|
|
49
|
Yeon SY, Jo YS, Choi EJ, Kim MS, Yoo NJ
and Lee SH: Frameshift mutations in repeat sequences of ANK3,
HACD4, TCP10L, TP53BP1, MFN1, LCMT2, RNMT, TRMT6, METTL8 and
METTL16 genes in colon cancers. Pathol Oncol Res. 24:617–622. 2018.
View Article : Google Scholar : PubMed/NCBI
|
|
50
|
Ignatova VV, Kaiser S, Ho JSY, Bing X,
Stolz P, Tan YX, Lee CL, Gay FPH, Lastres PR, Gerlini R, et al:
METTL6 is a tRNA m3C methyltransferase that regulates
pluripotency and tumor cell growth. Sci Adv. 6:eaaz45512020.
View Article : Google Scholar : PubMed/NCBI
|
|
51
|
Gatza ML, Silva GO, Parker JS, Fan C and
Perou CM: An integrated genomics approach identifies drivers of
proliferation in luminal-subtype human breast cancer. Nat Genet.
46:1051–1059. 2014. View Article : Google Scholar : PubMed/NCBI
|
|
52
|
Grünberg S, Doyle LA, Wolf EJ, Dai N,
Corrêa IR Jr, Yigit E and Stoddard BL: The structural basis of mRNA
recognition and binding by yeast pseudouridine synthase PUS1. PLoS
One. 18:e02912672023. View Article : Google Scholar : PubMed/NCBI
|
|
53
|
Martinez NM, Su A, Burns MC, Nussbacher
JK, Schaening C, Sathe S, Yeo GW and Gilbert WV: Pseudouridine
synthases modify human pre-mRNA co-transcriptionally and affect
pre-mRNA processing. Mol Cell. 82:645–659.e9. 2022. View Article : Google Scholar : PubMed/NCBI
|
|
54
|
Hu YX, Diao LT, Hou YR, Lv G, Tao S, Xu
WY, Xie SJ, Ren YH and Xiao ZD: Pseudouridine synthase 1 promotes
hepatocellular carcinoma through mRNA pseudouridylation to enhance
the translation of oncogenic mRNAs. Hepatology. 80:1058–1073. 2024.
View Article : Google Scholar : PubMed/NCBI
|
|
55
|
Li L, Zhu C, Xu S, Xu Q, Xu D, Gan S, Cui
X and Tang C: PUS1 is a novel biomarker for evaluating malignancy
of human renal cell carcinoma. Aging (Albany NY). 15:5215–5227.
2023.PubMed/NCBI
|
|
56
|
Fang Z, Shen HY, Xu Q, Zhou HL, Li L, Yang
SY, Zhu Z and Tang JH: PUS1 is a novel biomarker for predicting
poor outcomes and triple-negative status in breast cancer. Front
Oncol. 12:10305712022. View Article : Google Scholar : PubMed/NCBI
|
|
57
|
Kimura S, Miyauchi K, Ikeuchi Y, Thiaville
PC, Crécy-Lagard Vd and Suzuki T: Discovery of the β-barrel-type
RNA methyltransferase responsible for N6-methylation of
N6-threonylcarbamoyladenosine in tRNAs. Nucleic Acids Res.
42:9350–9365. 2014. View Article : Google Scholar : PubMed/NCBI
|
|
58
|
Kulkarni O, Sugier PE, Guibon J,
Boland-Augé A, Lonjou C, Bacq-Daian D, Olaso R, Rubino C, Souchard
V, Rachedi F, et al: Gene network and biological pathways
associated with susceptibility to differentiated thyroid carcinoma.
Sci Rep. 11:89322021. View Article : Google Scholar : PubMed/NCBI
|
|
59
|
Argente-Escrig H, Vílchez JJ, Frasquet M,
Muelas N, Azorín I, Vílchez R, Millet-Sancho E, Pitarch I,
Tomás-Vila M, Vázquez-Costa JF, et al: A novel TRMT5 mutation
causes a complex inherited neuropathy syndrome: The role of nerve
pathology in defining a demyelinating neuropathy. Neuropathol Appl
Neurobiol. 48:e128172022. View Article : Google Scholar : PubMed/NCBI
|
|
60
|
Zhao Q, Zhang L, He Q, Chang H, Wang Z,
Cao H, Zhou Y, Pan R and Chen Y: Targeting TRMT5 suppresses
hepatocellular carcinoma progression via inhibiting the HIF-1α
pathways. J Zhejiang Univ Sci B. 24:50–63. 2023.(In English,
Chinese). View Article : Google Scholar : PubMed/NCBI
|
|
61
|
Wang Y, Suarez ER, Kastrunes G, de Campos
NSP, Abbas R, Pivetta RS, Murugan N, Chalbatani GM, D'Andrea V and
Marasco WA: Evolution of cell therapy for renal cell carcinoma. Mol
Cancer. 23:82024. View Article : Google Scholar : PubMed/NCBI
|
|
62
|
Pal SK, Tran B, Haanen JBAG, Hurwitz ME,
Sacher A, Tannir NM, Budde LE, Harrison SJ, Klobuch S, Patel SS, et
al: CD70-targeted allogeneic CAR T-cell therapy for advanced clear
cell renal cell carcinoma. Cancer Discov. 14:1176–1189. 2024.
View Article : Google Scholar : PubMed/NCBI
|
|
63
|
Xu Z, Jiang W, Liu L, Qiu Y, Wang J, Dai
S, Guo J and Xu J: Dual-loss of PBRM1 and RAD51 identifies
hyper-sensitive subset patients to immunotherapy in clear cell
renal cell carcinoma. Cancer Immunol Immunother. 73:952024.
View Article : Google Scholar : PubMed/NCBI
|
|
64
|
Hinshaw DC and Shevde LA: The tumor
microenvironment innately modulates cancer progression. Cancer Res.
79:4557–4566. 2019. View Article : Google Scholar : PubMed/NCBI
|
|
65
|
Gajewski TF, Schreiber H and Fu YX: Innate
and adaptive immune cells in the tumor microenvironment. Nat
Immunol. 14:1014–1022. 2013. View Article : Google Scholar : PubMed/NCBI
|
|
66
|
Boutilier AJ and Elsawa SF: Macrophage
polarization states in the tumor microenvironment. Int J Mol Sci.
22:69952021. View Article : Google Scholar : PubMed/NCBI
|
|
67
|
Tao JH, Cheng M, Tang JP, Liu Q, Pan F and
Li XP: Foxp3, regulatory T cell, and autoimmune diseases.
Inflammation. 40:328–339. 2017. View Article : Google Scholar : PubMed/NCBI
|
|
68
|
Gao Y, You M, Fu J, Tian M, Zhong X, Du C,
Hong Z, Zhu Z, Liu J, Markowitz GJ, et al: Intratumoral stem-like
CCR4+ regulatory T cells orchestrate the immunosuppressive
microenvironment in HCC associated with hepatitis B. J Hepatol.
76:148–159. 2022. View Article : Google Scholar : PubMed/NCBI
|
|
69
|
De Serres SA, Sayegh MH and Najafian N:
Immunosuppressive drugs and Tregs: A critical evaluation! Clin J Am
Soc Nephrol. 4:1661–1669. 2009. View Article : Google Scholar : PubMed/NCBI
|
|
70
|
Chen ML, Pittet MJ, Gorelik L, Flavell RA,
Weissleder R, von Boehmer H and Khazaie K: Regulatory T cells
suppress tumor-specific CD8 T cell cytotoxicity through TGF-beta
signals in vivo. Proc Natl Acad Sci USA. 102:419–424. 2005.
View Article : Google Scholar : PubMed/NCBI
|
|
71
|
Fu J, Xu D, Liu Z, Shi M, Zhao P, Fu B,
Zhang Z, Yang H, Zhang H, Zhou C, et al: Increased regulatory T
cells correlate with CD8 T-cell impairment and poor survival in
hepatocellular carcinoma patients. Gastroenterology. 132:2328–2339.
2007. View Article : Google Scholar : PubMed/NCBI
|
|
72
|
Shan F, Somasundaram A, Bruno TC, Workman
CJ and Vignali DAA: Therapeutic targeting of regulatory T cells in
cancer. Trends Cancer. 8:944–961. 2022. View Article : Google Scholar : PubMed/NCBI
|
|
73
|
Li C, Jiang P, Wei S, Xu X and Wang J:
Regulatory T cells in tumor microenvironment: New mechanisms,
potential therapeutic strategies and future prospects. Mol Cancer.
19:1162020. View Article : Google Scholar : PubMed/NCBI
|
|
74
|
Rak R, Polonsky M, Eizenberg-Magar I, Mo
Y, Sakaguchi Y, Mizrahi O, Nachshon A, Reich-Zeliger S,
Stern-Ginossar N, Dahan O, et al: Dynamic changes in tRNA
modifications and abundance during T cell activation. Proc Natl
Acad Sci USA. 118:e21065561182021. View Article : Google Scholar : PubMed/NCBI
|
|
75
|
Lu S, Wei X, Tao L, Dong D, Hu W, Zhang Q,
Tao Y, Yu C, Sun D and Cheng H: A novel tRNA-derived fragment
tRF-3022b modulates cell apoptosis and M2 macrophage polarization
via binding to cytokines in colorectal cancer. J Hematol Oncol.
15:1762022. View Article : Google Scholar : PubMed/NCBI
|
|
76
|
Vesely MD, Zhang T and Chen L: resistance
mechanisms to anti-PD cancer immunotherapy. Annu Rev Immunol.
40:45–74. 2022. View Article : Google Scholar : PubMed/NCBI
|
|
77
|
Nishimura H and Honjo T: PD-1: An
inhibitory immunoreceptor involved in peripheral tolerance. Trends
Immunol. 22:265–268. 2001. View Article : Google Scholar : PubMed/NCBI
|
|
78
|
Cui JW, Li Y, Yang Y, Yang HK, Dong JM,
Xiao ZH, He X, Guo JH, Wang RQ, Dai B and Zhou ZL: Tumor
immunotherapy resistance: Revealing the mechanism of
PD-1/PD-L1-mediated tumor immune escape. Biomed Pharmacother.
171:1162032024. View Article : Google Scholar : PubMed/NCBI
|
|
79
|
Rotte A: Combination of CTLA-4 and PD-1
blockers for treatment of cancer. J Exp Clin Cancer Res.
38:2552019. View Article : Google Scholar : PubMed/NCBI
|
|
80
|
Palmeri M, Mehnert J, Silk AW, Jabbour SK,
Ganesan S, Popli P, Riedlinger G, Stephenson R, de Meritens AB,
Leiser A, et al: Real-world application of tumor mutational
burden-high (TMB-high) and microsatellite instability (MSI)
confirms their utility as immunotherapy biomarkers. ESMO Open.
7:1003362022. View Article : Google Scholar : PubMed/NCBI
|
|
81
|
Klempner SJ, Fabrizio D, Bane S, Reinhart
M, Peoples T, Ali SM, Sokol ES, Frampton G, Schrock AB, Anhorn R
and Reddy P: Tumor mutational burden as a predictive biomarker for
response to immune checkpoint inhibitors: A review of current
evidence. Oncologist. 25:e147–e159. 2020. View Article : Google Scholar : PubMed/NCBI
|
|
82
|
Zhang Q, Lin B, Chen H, Ye Y, Huang Y,
Chen Z and Li J: Lipid metabolism-related gene expression in the
immune microenvironment predicts prognostic outcomes in renal cell
carcinoma. Front Immunol. 14:13242052023. View Article : Google Scholar : PubMed/NCBI
|