Introduction
Breast cancer (BRCA) is one of the most prevalent
and challenging cancer types affecting women worldwide (1,2). BRCA
is characterized by the uncontrolled proliferation of abnormal
cells within breast tissue, leading to tumorigenesis (3). Although the exact etiology of BRCA
remains elusive, several risk factors, including genetic mutations,
hormonal imbalances and environmental influences, have been
identified (4,5). Investigating the mechanisms underlying
BRCA is of paramount importance in clinical medicine, as it
facilitates the development of targeted therapies, early detection
techniques and preventive strategies, ultimately enhancing patient
outcomes and prognosis.
With advancements in bioinformatics tools and gene
sequencing technologies, extensive research has shed light on the
underlying mechanisms driving BRCA development and progression
(6,7). A key contributor is genetic
alterations, particularly mutations in genes such as BRCA1 and
BRCA2 (8,9). These mutations compromise the normal
function of tumor suppressor genes, enabling uncontrolled cell
division and growth (10).
Additionally, the dysregulation of hormonal signaling pathways,
including estrogen and progesterone receptors, has been implicated
in the pathogenesis of hormone receptor-positive BRCA (11,12).
Thus, a deeper understanding of the mechanisms underlying BRCA may
offer valuable insights for early detection and prevention.
In the present study, an integrated analysis of BRCA
samples utilizing bioinformatics databases and analytical
approaches was performed to identify clinically significant key
genes. Additionally, cell-based experiments were conducted to
explore the specific functions and underlying mechanisms of these
key genes in BRCA. The present study provides valuable insights
into the tumorigenesis of BRCA and contributes to the development
of targeted therapeutic strategies.
Materials and methods
Identification of differentially
expressed genes (DEGs) from the GSE21422 and The Cancer Genome
Atlas (TCGA)-BRCA datasets
The GSE21422 dataset (GPL570 platform, expression
profiling by array) was downloaded from the Gene Expression Omnibus
(ncbi.nlm.nih.gov/geo/), and includes 5 healthy breast and 14 BRCA
samples (ductal carcinoma in situ and invasive ductal breast
carcinoma) (13). Gene expression
data from TCGA-BRCA cohort were downloaded from the UCSC Xena
Browser (https://xenabrowser.net/). Gene
expression RNA-seq data in HTSeq-FPKM format were obtained from
TCGA-BRCA dataset. TCGA-BRCA dataset encompasses all molecular
subtypes of BRCA, including the triple-negative BRCA (TNBC),
hormone receptor-positive and HER2-enriched subtypes. Using the
GEO2R tool (https://www.ncbi.nlm.nih.gov/geo/geo2r/) and ‘limma’ R
package (version 3.52.4) in R software (version 4.2.2), DEGs were
analyzed on the basis of log2[fold change (FC)]>1 for
upregulation and <-1 for downregulation, with statistical
significance (P<0.05). The GSE21422-DEGs and TCGA-BRCA-DEGs were
combined and the overlapping genes were screened via a Venn
diagram, which were then uploaded to the Database for Annotation,
Visualization, and Integrated Discovery (https://david.ncifcrf.gov/tools.jsp) to conduct Kyoto
Encyclopedia of Genes and Genomes (KEGG) pathway and Gene Ontology
[GO; including Cell Component (CC), Biological Process (BP) and
Molecular Function (MF)] analysis. P<0.05 was considered to
indicate a statistically significant difference. To identify key
genes among the DEGs, a protein-protein interaction (PPI) network
was constructed using the STRING database (string-db.org/) with a
minimum required interaction score of 0.4. The resulting network
was imported into Cytoscape software (version 3.9.1), and the
CytoHubba plugin was applied to analyze network topology. The
BottleNeck algorithm within CytoHubba was used to rank genes based
on their network importance.
Least Absolute Shrinkage and Selection
Operator (LASSO) regression model
LASSO analysis was performed via the ‘glmnet’
package in R software. This model was applied to the overlapping
genes identified in the aforementioned analysis. The coefficients
of the signature genes were determined at λmin, which
was obtained by examining the association between the partial
likelihood deviation and log(λ). The samples from TCGA-BRCA dataset
were divided into high-risk and low-risk groups based on the median
value (−0.0085) of the calculated risk scores derived from the
expression levels of the overlapping genes. A risk score model was
then designed to compare the survival status of patients with BRCA
and the differences in the expression of signature genes between
the two groups. Kaplan-Meier (KM) survival curves for
progression-free survival (PFS) were generated using the ‘survival’
package. The hazard ratio (HR), confidence interval (CI) and log
rank P-value were calculated to compute the differences in survival
outcomes between the high-risk and low-risk groups. To assess the
prognostic value of the risk model, receiver operating
characteristic (ROC) curves were established using the ‘timeROC’
package, specifically for the 1-, 3- and 5-year time points. The
predictive accuracy of the model was quantified by calculating the
area under the curve (AUC) values.
Gene Set Cancer Analysis (GSCA)
GSCA is a computational method used to assess the
variation in gene set activity across different samples in gene
expression data. In the present study, the GSCA database
(https://guolab.wchscu.cn/GSCA/#/) was
used to perform gene mutation analysis on signature genes,
including single nucleotide variants (SNVs), copy number variations
(CNVs), variant types, variant classifications, variant
classification summaries and variants per sample.
Expression, ROC and KM survival
analyses
Expression, ROC and KM survival analyses were also
conducted to evaluate the individual clinical relevance of each
signature gene. Unlike the risk model-based analyses described
above, which assessed the combined prognostic value of the entire
gene signature using a composite risk score, these analyses focused
on the diagnostic and prognostic value of each gene independently.
Specifically, the signature gene expression levels in the TCGA-BRCA
tumor and normal groups were observed. ROC analysis was
subsequently used to evaluate the diagnostic value of the signature
genes in BRCA. ROC analysis was performed using the ‘pROC’ package.
The larger the AUC value, the greater the diagnostic value. KM
survival curves were constructed to visualize the differences in
survival outcomes. KM survival analysis was conducted using the
‘survminer’ package in R. The log-rank test was used to estimate
the significant difference between the groups, and HRs were
calculated to estimate the risk associated with the gene expression
levels. Finally, the overall survival (OS) probability of genes
with diagnostic value was evaluated.
Construction of the prognostic
nomogram
Univariate and multivariate Cox regression analyses
were performed on signature genes that showed significant
association with OS together with clinical factors, including age,
pT stage and pTNM stage, to identify the 5 candidate genes linked
to BRCA survival. These analyses were conducted via the
‘forestplot’ package, and prognostic genes with a significant
association (P<0.05) were identified. A prognostic nomogram
incorporating the significant prognostic variables was subsequently
designed via the ‘rms’ package. The nomogram aimed to predict the
1-, 3- and 5-year survival probabilities of patients with BRCA with
identified prognostic factors. Additionally, a calibration curve
was used to estimate the performance and accuracy of the survival
nomogram model.
Analysis of the correlation between
gene expression and clinical parameters in BRCA
The Human Protein Atlas (HPA; proteinatlas.org/) is
a comprehensive and publicly available resource that provides
information about the expression and localization of proteins in
various human tissues and cells (14). In the present study, the protein
expression of Rac/Cdc42 guanine nucleotide exchange factor 6
(ARHGEF6) in BRCA was assessed. Data from the University of Alabama
at Birmingham Cancer Data Analysis Portal (https://ualcan.path.uab.edu/index.html) was used to
conduct clinical feature analysis on the basis of individual cancer
stage, age, nodal metastasis status and TP53 mutation status. The
Genomics of Drug Sensitivity in Cancer database (cancerrxgene.org/)
was used to analyze the relationship between ARHGEF6 expression
levels and the IC50 of paclitaxel in BRCA. We collected
genes involved in apoptosis and performed single-sample gene set
enrichment analysis (ssGSEA) using the GSVA package (version 3.21)
in R with the method set to ‘ssgsea’. Finally, Spearman correlation
analysis was used to assess the relationship between gene
expression and pathway scores.
Cell lines
The BRCA cell lines, Hs578t (cat. no. QS-H157;
Keycell Biotechnology Co., Ltd.) and MDA-MB-231 (cat. no.
BFN608008564; The Cell Bank of Type Culture Collection of the
Chinese Academy of Sciences), were subjected to short tandem repeat
analysis and mycoplasma testing. These cell lines were stored in
liquid nitrogen at −80°C and subsequently cultured in Roswell Park
Memorial Institute 1640 medium (cat. no. E600028; Sangon Biotech
Co., Ltd.) supplemented with 10% fetal bovine serum (FBS; cat. no.
C0235; Beyotime Institute of Biotechnology) and
penicillin-streptomycin (cat. no. 60162ES76; Shanghai Yeasen
Biotechnology Co., Ltd.). For subsequent studies, the cells were
cultured at 37°C in a humidified environment with 5%
CO2.
Cell transfection
The ARHGEF6 overexpression plasmid
[pRP(Exp)-CMV>hARHGEF6; NM_004840.3] and a negative control
[pRP(Exp)-CMV>ORF_Stuffer) were constructed by VectorBuilder,
Inc. Lipofectamine 2000 (cat. no. 11668019; Invitrogen; Thermo
Fisher Scientific, Inc.) was used for cell transfection according
to the manufacturer's instructions. Briefly, 2 µg of plasmid was
transfected into cells cultured at 37°C in a humidified incubator
with 5% CO2. The transfection mixture was incubated with
cells for 6 h at 37°C, after which the medium was replaced with
fresh complete medium. Subsequent experiments were performed 48 h
post-transfection.
RNA extraction and reverse
transcription-quantitative PCR (RT-qPCR)
After cell transfection, total RNA was isolated from
cells with TRIzol reagent (cat. no. R0016; Beyotime Institute of
Biotechnology), followed by RT of the RNA into complementary DNA
with a PrimeScript RT kit (cat. no. 04379012001; Roche Diagnostics)
according to the manufacturer's instructions. qPCR was conducted
with a SYBR Green PCR Mix Kit (cat. no. 4344463; Thermo Fisher
Scientific, Inc.). The reaction conditions were as follows: Initial
denaturation at 95°C for 5 min, followed by 40 cycles of
denaturation at 95°C for 5 sec, annealing at 60°C for 30 sec and
extension at 74°C for 30 sec. GAPDH served as the internal control.
The 2−ΔΔCq method was used to determine the relative
expression levels of the target genes (15). The primers used were as follows:
ARHGEF6 forward, 5′-TCCAGGAATGGTTGGAGCAG-3′ and reverse,
5′-GGCTGTCCGGTAGAGCTAAA-3′; BCL2 forward,
5′-AAAAATACAACATCACAGAGGAAGT-3′ and reverse,
5′-GTTTCCCCCTTGGCATGAGA-3′; caspase3 forward,
5′-TGAGGCGGTTGTAGAAGAGTTTC-3′ and reverse,
5′-TTATTAACGAAAACCAGAGCGCC-3′; p53 forward,
5′-AAGTCTAGAGCCACCGTCCA-3′ and reverse, 5′-GACGCTAGGATCTGACTGCG-3′;
GAPDH forward, 5′-AATGGGCAGCCGTTAGGAAA-3′ and reverse,
5′-GCGCCCAATACGACCAAATC-3′.
Western blotting
Cell lysis was performed using RIPA lysis buffer
(cat. no. P0013; Beyotime Institute of Biotechnology) and total
protein was extracted. Then, 12% sodium dodecyl
sulfate-polyacrylamide gel electrophoresis (cat. no. P0690;
Beyotime Institute of Biotechnology) was used to separate the
proteins (25 µg/lane), before the proteins were transferred to PVDF
membranes (cat. no. FFP24; Beyotime Institute of Biotechnology).
The membranes were then blocked for 2 h at room temperature with 5%
non-fat milk. Primary antibodies were added to the membranes and
incubated overnight at 4°C. Antibodies were as follows:
anti-ARHGEF6 (1:1,000, ab184569, Abcam), anti-BCL2 (1:1,000,
ab182858, Abcam, UK), anti-p53 (1:1,000, ab32509, Abcam, UK),
anti-caspase-3 (1:1,000, ab32351, Abcam, UK), anti-c-caspase-3
(1:1,000, ab32042, Abcam, UK) and anti-GAPDH (1:3,000, ab9485,
Abcam, UK). Then the membranes were incubated with goat Anti-Rabbit
IgG H&L (HRP) (1:5,000, ab6721, Abcam, UK) for 4 h at room
temperature. GAPDH served as the internal control, and protein
expression was visualized with an enhanced chemiluminescence kit
(cat. no. KGC4603; KeyGene).
Cell proliferation assay
Cell proliferation was measured using Cell Counting
Kit-8 (CCK-8; cat. no. C0038; Beyotime Institute of Biotechnology)
assay. After transfection for 48 h, the cells were seeded into
96-well plates at a density of 2×10³ cells per well.
Then, 10 µl of CCK-8 solution was added to each well at various
time intervals (0, 24, 48, 72 and 96 h) to assess the viability and
proliferation of the cells, followed by incubation for 1 h at 37°C.
A microplate reader (Bio-Rad Laboratories, Inc.) was then used to
measure the absorbance of the cells at 450 nm.
Cell invasion and migration
assays
For the invasion experiment, the transfected cells
(5×10⁴) were plated in the upper chamber of a Transwell
insert covered with Matrigel (cat. no. 356234; BD Biosciences),
which had been incubated at 37°C for 1 h before cell seeding. The
cells were cultured in serum-free media in the upper chamber. The
lower chamber was filled with media containing 10% FBS. The cells
were incubated at 37°C for 24 h. The invading cells were fixed with
4% paraformaldehyde (cat. no. P0099; Beyotime Institute of
Biotechnology) and labeled with 4′,6-diamidino-2-phenylindole (cat.
no. C1006; Beyotime Institute of Biotechnology). Randomly chosen
fields of view were used to study the cells under a microscope.
Same procedures were followed for the cell migration experiment,
except that Matrigel was not applied to the Transwell insert.
Flow cytometry
Transfected cells were harvested using trypsin (cat.
no. 40101ES25; Shanghai Yeasen Biotechnology Co., Ltd.). The cell
suspension was then centrifuged at 300 × g for 5 min at room
temperature to obtain a pellet. The pellet was subsequently
resuspended in phosphate-buffered saline (cat. no. C0221A; Beyotime
Institute of Biotechnology). The resuspended cells were stained
with an Annexin V-fluorescein isothiocyanate (FITC)/propidium
iodide (PI) (cat. no. C1383L; Beyotime Institute of Biotechnology)
staining kit according to the manufacturer's instructions.
Following incubation, the stained cells were analyzed by a flow
cytometer (BD Biosciences). Data were analyzed with FlowJo software
(version 10.8.1; BD Biosciences).
Statistical analysis
All cellular experiments were performed in
triplicate, and data are expressed as mean ± standard deviation.
Statistical analyses were conducted using GraphPad Prism 8.0
software (Dotmatics). Comparisons between two groups were performed
using unpaired independent samples t-test. P<0.05 was considered
to indicate a statistically significant difference.
Results
Identification and functional
enrichment analysis of overlapping DEGs
The overlapping DEGs were identified by integrating
data from the GSE21422 dataset and TCGA-BRCA cohort. Using the
GSE21422 dataset, 1,081 downregulated and 973 upregulated DEGs were
identified (Fig. 1A). From
TCGA-BRCA samples, 1,498 downregulated and 903 upregulated DEGs
were obtained (Fig. 1B). The
intersection of these datasets yielded overlapping DEGs (Fig. 1C). To explore the biological
significance of these overlapping DEGs, GO enrichment analysis was
performed. In the BP category, the overlapping DEGs were
significantly enriched in processes such as the ‘Regulation of
angiogenesis’, ‘External encapsulating structure organization’ and
‘Regulation of cell population proliferation’ (Fig. 1D). For CC, the genes were
predominantly associated with the ‘Collagen-containing
extracellular matrix’, ‘Cell-cell junction’ and ‘Spindle’ (Fig. 1D). In terms of MF, significant
enrichment was observed for ‘Metal ion binding’, ‘Androsterone
dehydrogenase activity’, ‘ErbB-3 class receptor binding’, ‘CXCR3
chemokine receptor binding’ and ‘NAD-retinol dehydrogenase
activity’ (Fig. 1D). KEGG pathway
analysis further revealed that the overlapping DEGs were involved
in several critical pathways, including those related to the
Regulation of lipolysis in adipocytes, PPAR signaling pathway,
ECM-receptor interaction, AMPK signaling pathway and Pyruvate
metabolism (Fig. 1E). To identify
potential hub genes, a protein-protein interaction network was
constructed utilizing the BottleNeck algorithm, which pinpointed 30
key interactive genes (Fig.
1F).
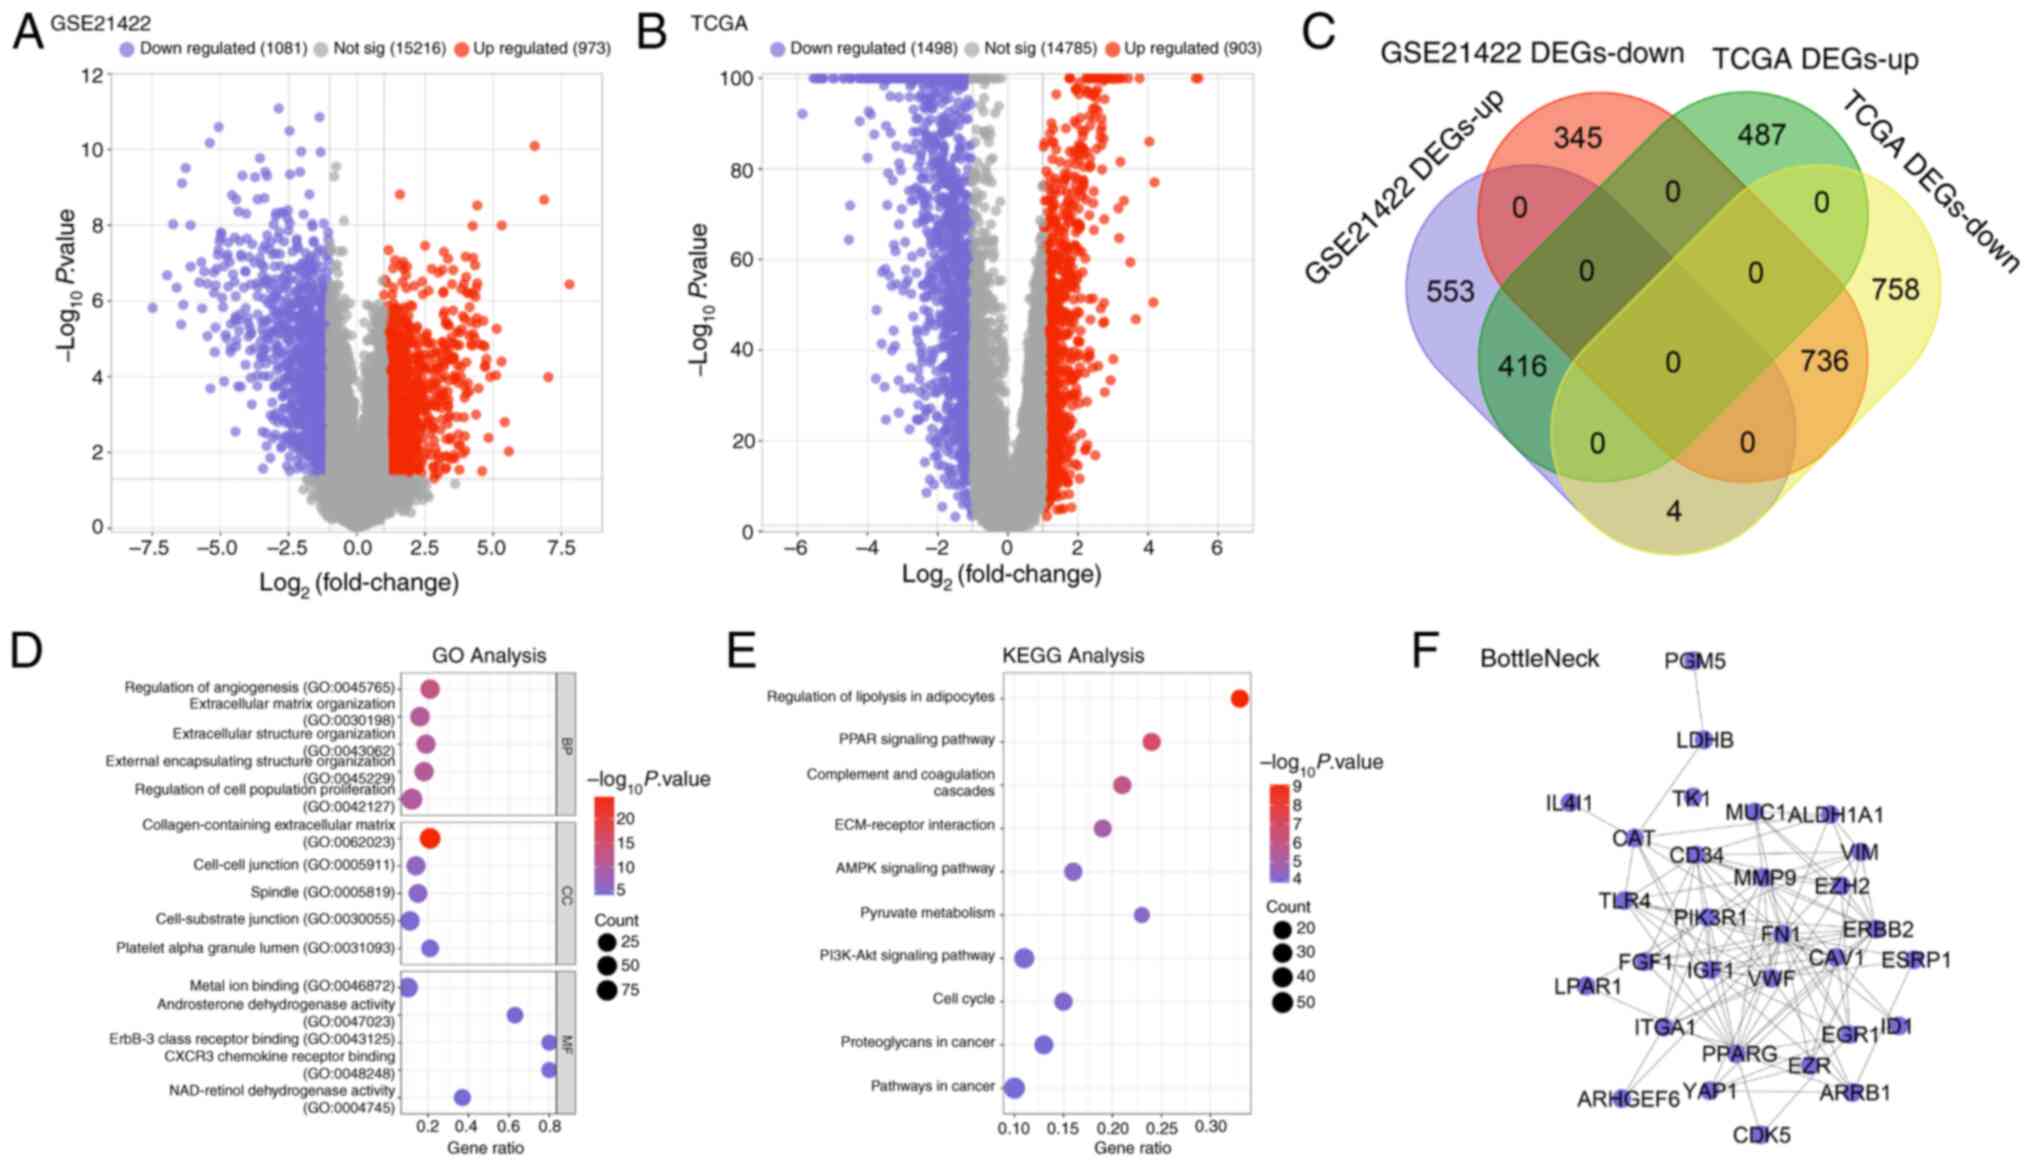 | Figure 1.Overlapping DEGs were obtained from
GSE21422 and TCGA datasets. (A) DEGs in the GSE21422 dataset
includes 1,081 downregulated genes, 973 upregulated genes and
15,216 non-significant genes. (B) DEGs in TCGA dataset includes 903
upregulated genes, 1,498 downregulated genes and 14,785
non-significant genes. (C) The Venn diagram of overlapping DEGs
from the GSE21422 and TCGA datasets. Purple represents upregulated
GSE21422 DEGs, orange represents downregulated GSE21422 DEGs, green
represents upregulated TCGA DEGs and yellow represents
downregulated TCGA DEGs. (D) The enriched GO terms of overlapping
DEGs, including BP, CC and MF. (E) The enriched KEGG pathways of
the overlapping DEGs. (F) The protein-protein interaction network
of overlapping DEGs analyzed by BottleNeck algorithm, with 30
nodes. DEGs, differentially expressed genes; TCGA, The Cancer
Genome Atlas; GO, Gene Ontology; BP, Biological Process; CC, Cell
Component; MF, Molecular Function; KEGG, Kyoto Encyclopedia of
Genes and Genomes. |
Identification of 8 prognostic
signature genes via the risk score model
Subsequent LASSO Cox regression analysis of the 30
previously identified interactive genes led to the selection of 8
prognostic signature genes on the basis of the λmin
value (Fig. 2A and B). The risk
model analysis (Fig. 2C)
demonstrated that patients in the high-risk group had a higher
mortality rate and a lower survival rate than did those in the
low-risk group. Notably, the expression levels of the 8 signature
genes, fibronectin (FN1), IL4I1, PIK3R1, integrin α1 (ITGA1),
inhibitor of DNA binding 1 (ID1), aldehyde dehydrogenase 1 family
member A1 (ALDH1A1), ARHGEF6 and enhancer of zeste 2 polycomb
repressive complex 2 subunit (EZH2), were significantly different
between the two groups. KM survival curve analysis for PFS revealed
that patients in the high-risk group had significantly poorer
prognoses (log-rank P=0.000363; 95% CI, 1.312-2.543). The
calculated HR between the groups was 1.826 (>1), underscoring
the utility of the risk model as an effective prognostic indicator
(Fig. 2D). Furthermore, ROC curve
analysis (Fig. 2E) indicated that
the risk model exhibited strong predictive performance (AUC
>0.6) for survival outcomes at 1, 3 and 5 years, with the
highest accuracy observed at the 1-year time point (AUC=0.699).
These results underscore the prognostic value of the identified
signature genes and the robustness of the developed risk model in
predicting survival outcomes for the studied population.
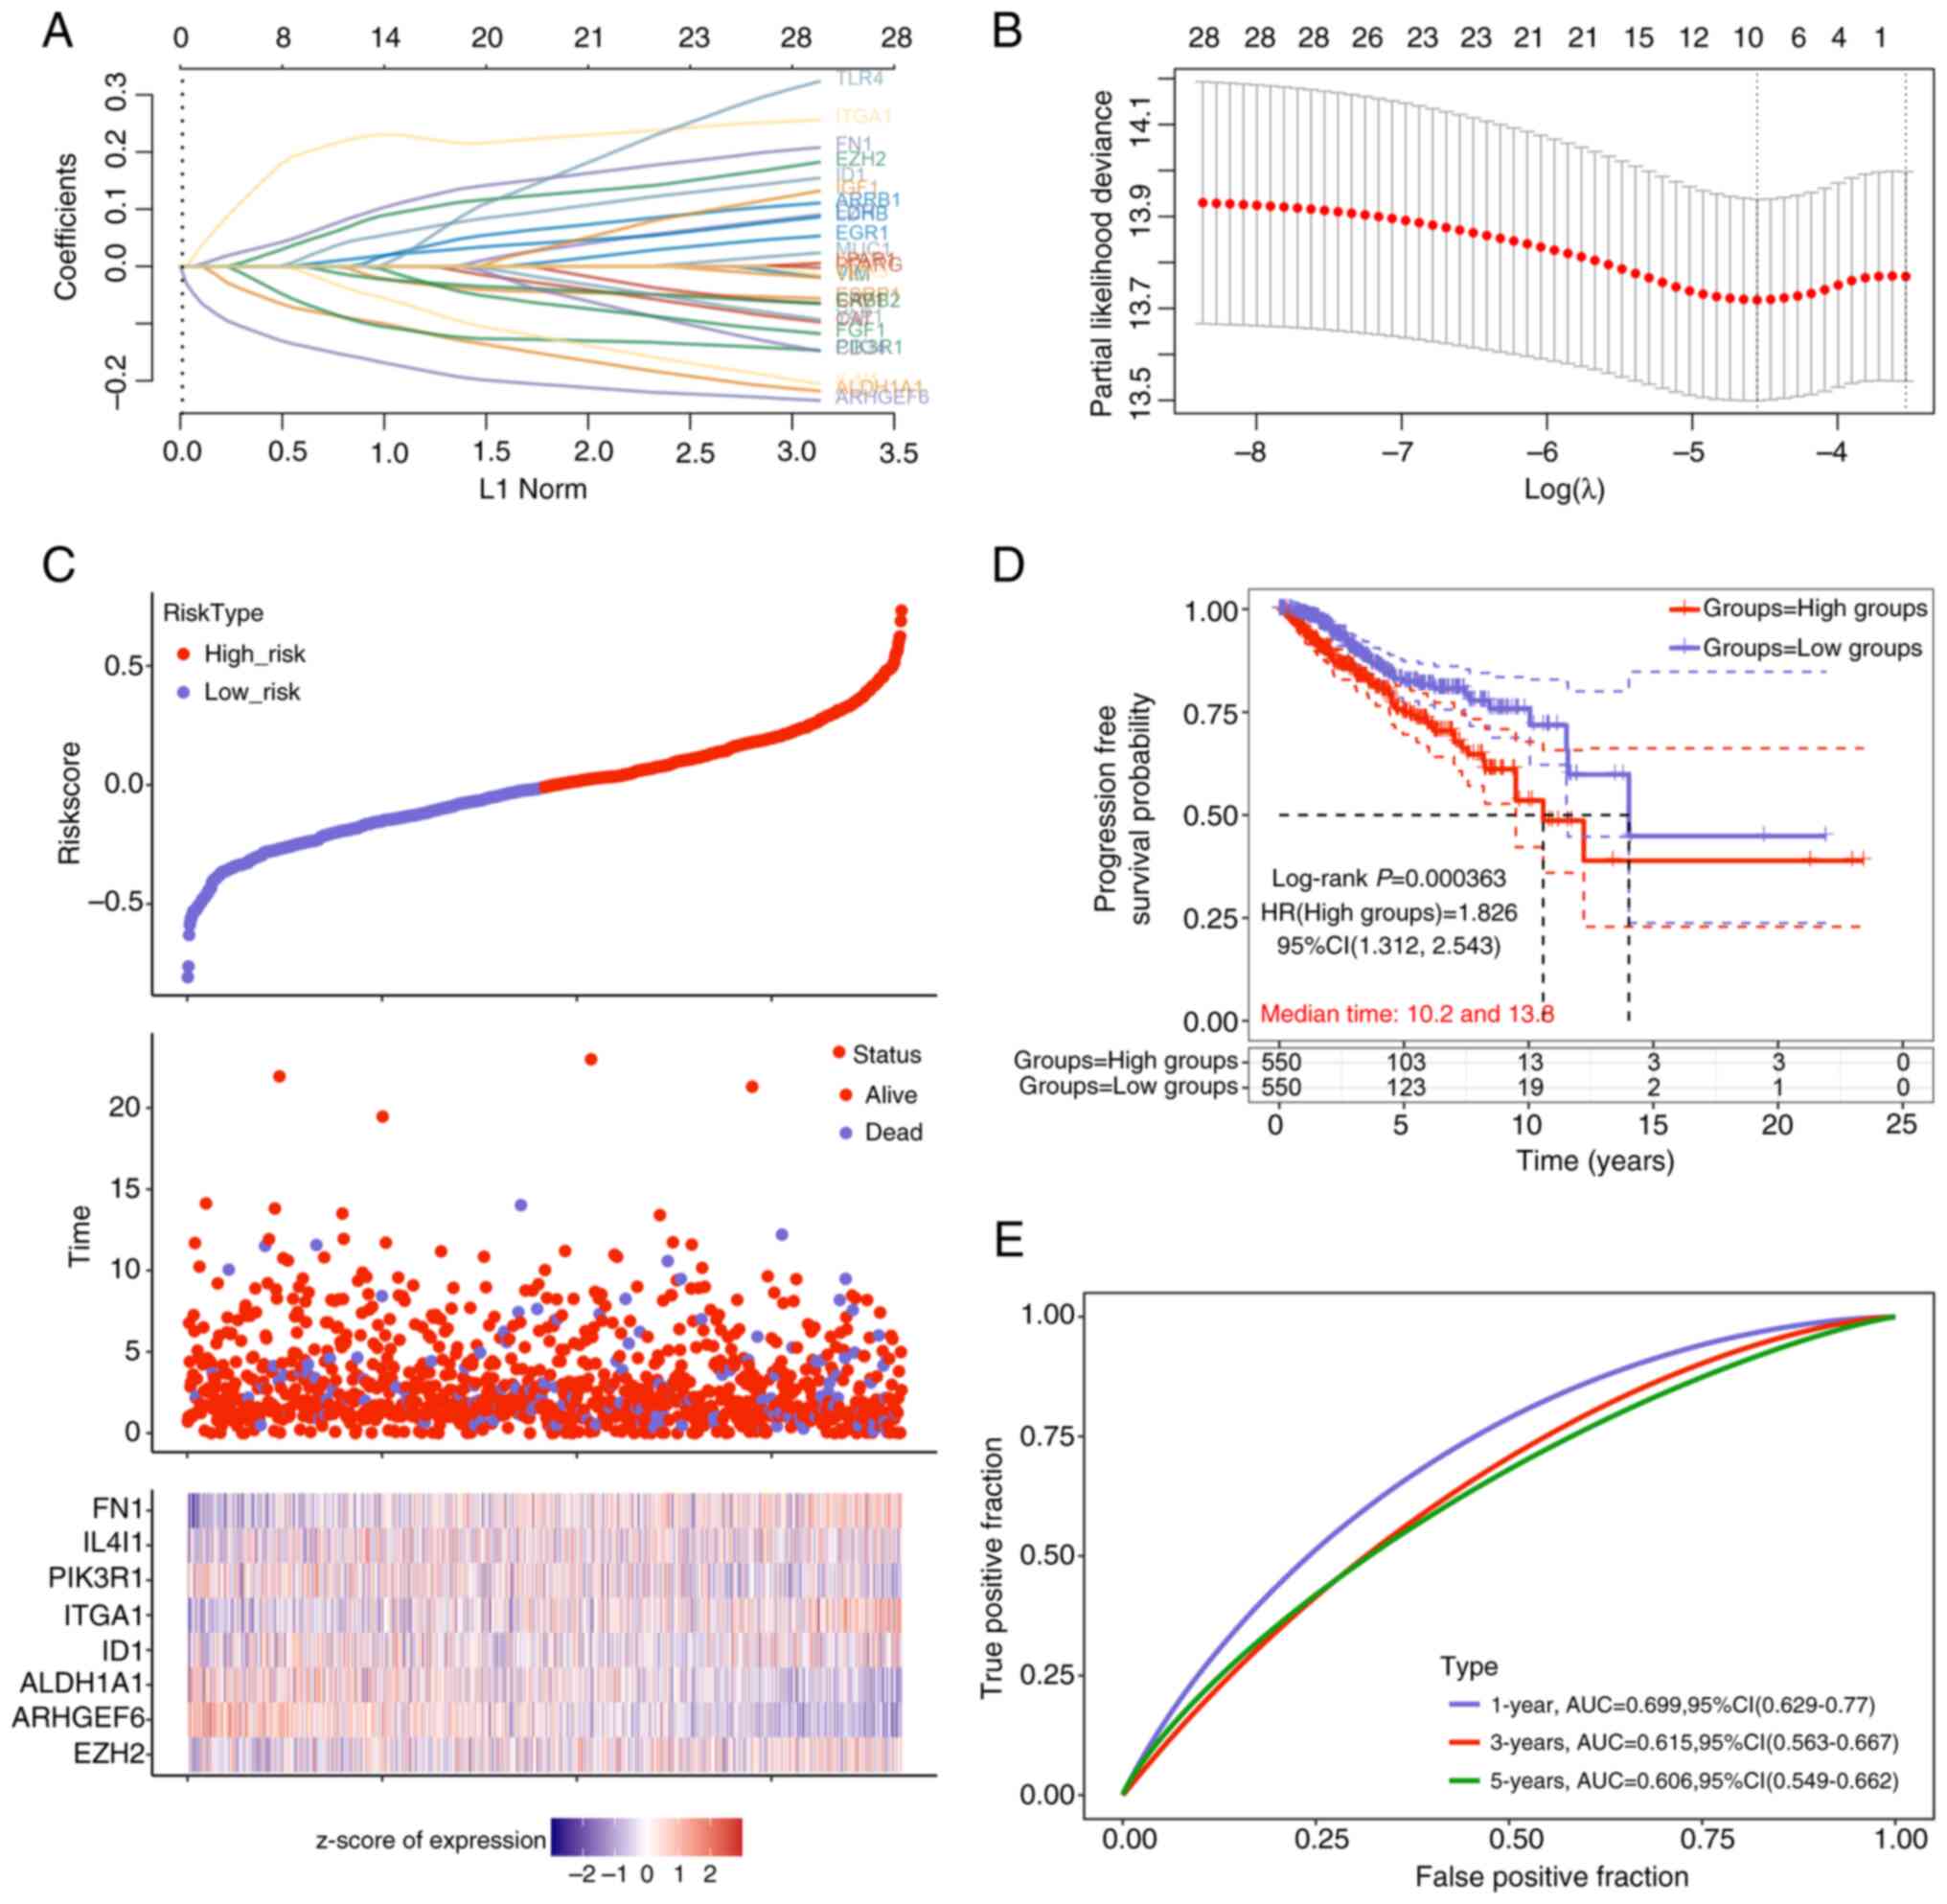 | Figure 2.Prognostic signature genes were
identified by the risk score model. (A) Detailed table shows the
feature gene selection corresponding to the λmin value.
Each row represents a feature gene, and the columns include the
gene name and its corresponding coefficient. (B) The LASSO
regression coefficient plot illustrates the selection of 8
signature genes out of the 30 interactive genes. The vertical axis
represents the coefficient magnitude, and the horizontal axis
represents log(λ) values, where λ is the regularization parameter.
The vertical line at λmin indicates the selection of the
feature genes. (C) Risk score (top), survival time (middle) and
signature gene expression (bottom) from the low-risk group to
high-risk group. (D) Kaplan-Meier survival curve based on
progression-free survival reveals a significantly worse prognosis
in the high-risk group, indicating the prognostic risk model's
capability. (E) AUC values from the ROC curve analysis demonstrate
good predictive accuracy of the risk model for survival at 1, 3 and
5 years, with the highest prediction accuracy observed at the
1-year mark (AUC=0.699). LASSO, Least Absolute Shrinkage and
Selection Operator; AUC, area under the curve; HR, hazard ratio;
CI, confidence interval. |
Comprehensive gene mutation analysis
of the 8 signature genes in BRCA
Next, a comprehensive analysis of gene mutations in
the signature genes in BRCA was performed, which revealed
significant genomic alterations across multiple samples, providing
valuable insights into the landscape of somatic mutations in
cancer. CNV analysis revealed diverse CNV percentages among the 8
genes in patients with BRCA (Fig.
3A). Notably, ID1 exhibited the highest percentage of
heterozygous amplification, whereas PIK3R1 showed the highest
percentage of heterozygous deletion. By contrast, nearly all the
genes displayed a low percentage of homozygous amplification. The
SNV heatmap further revealed that PIK3R1 had the highest mutation
frequency in BRCA samples, followed by FN1 and ITGA1 (Fig. 3B). Among the mutation types,
missense mutations were the most prevalent, with single nucleotide
polymorphisms identified as the primary variant type. Additionally,
C>T transitions were the most common substitution pattern in the
SNV class, with PIK3R1 emerging as the most frequently mutated gene
(Fig. 3C and D).
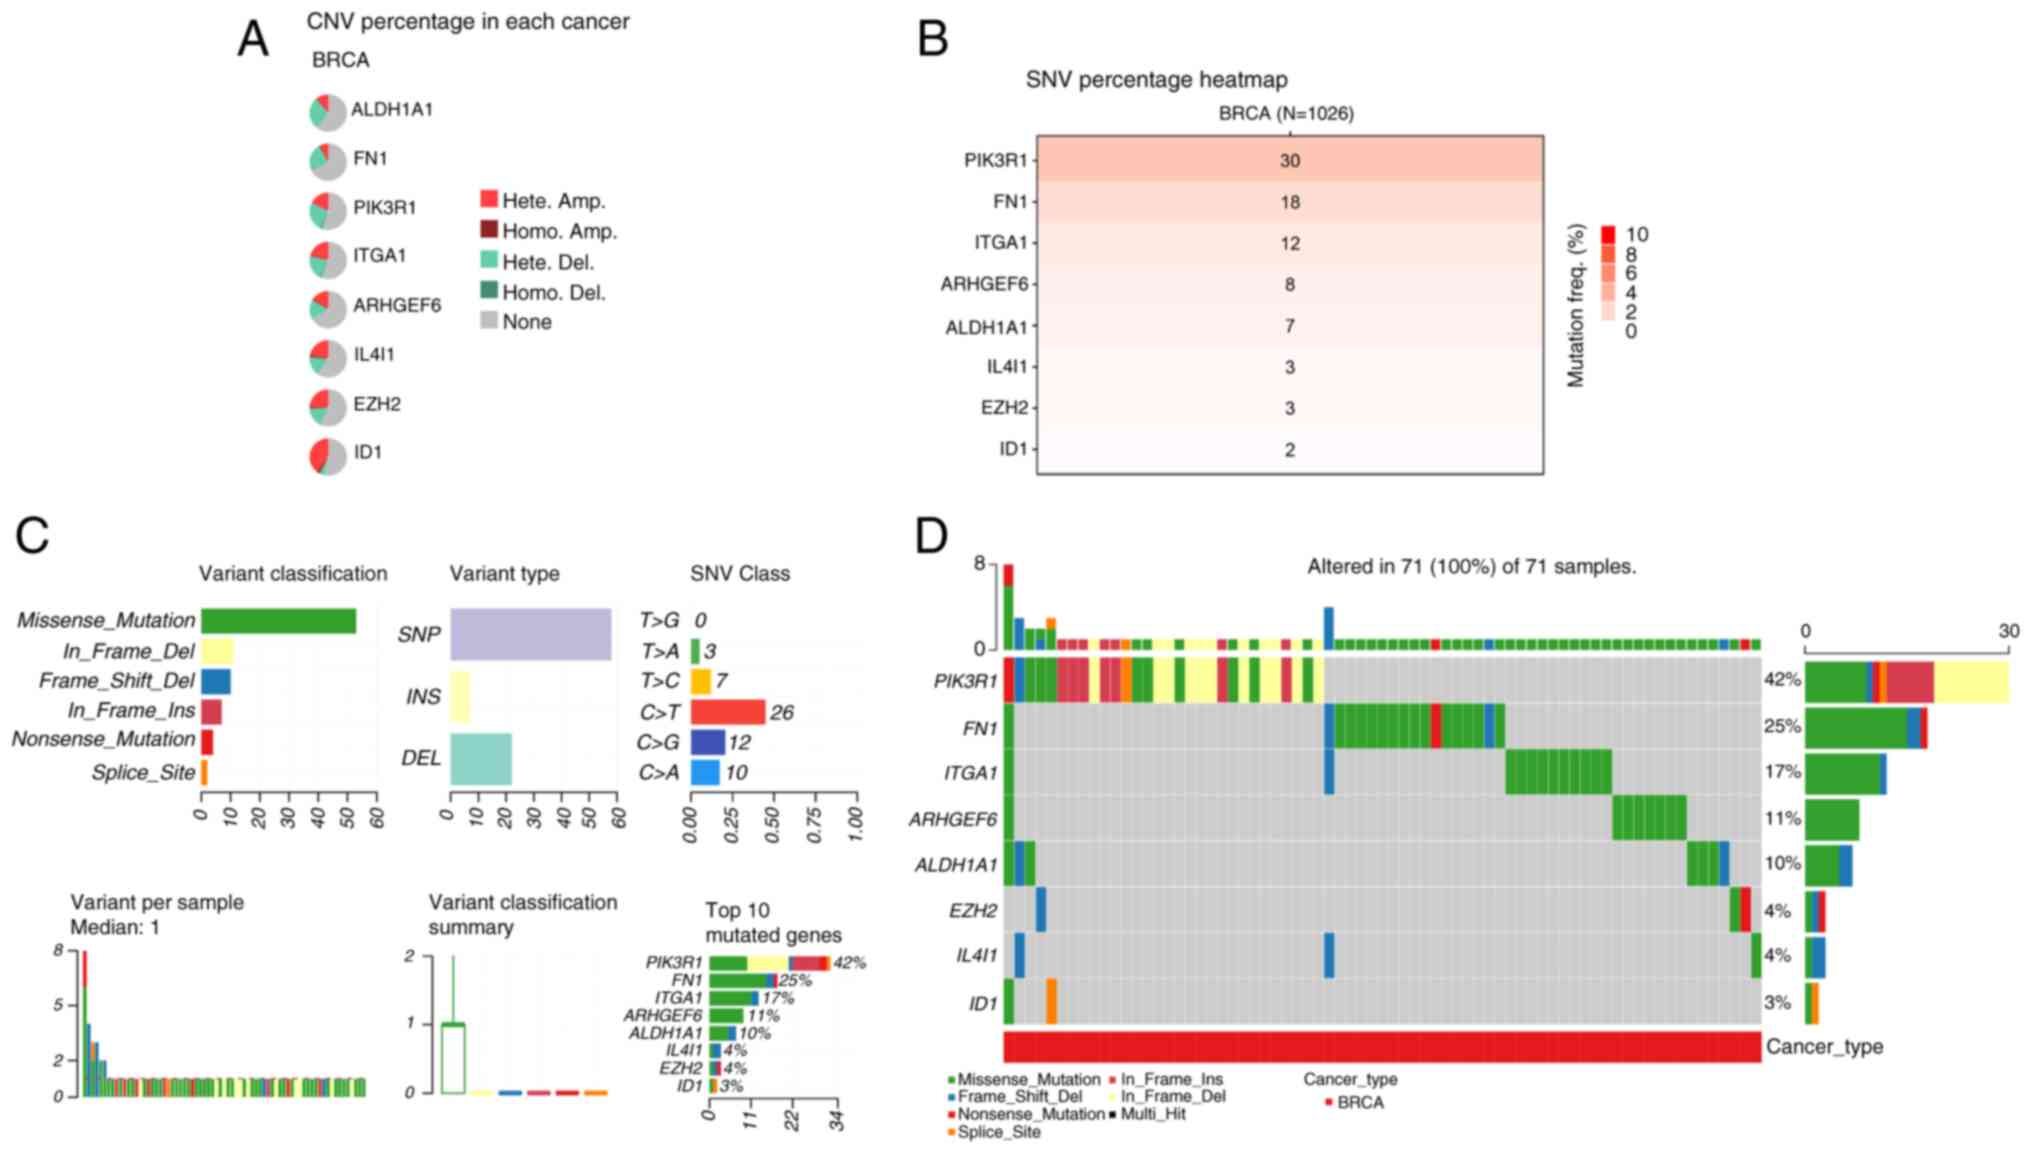 | Figure 3.Gene mutation analysis of 8 signature
genes in BRCA. (A) The CNV percentage of 8 signature genes in BRCA
samples was evaluated to assess the genomic alterations. (B) A
heatmap displaying the SNV percentage of the 8 signature genes in
breast cancer samples (n=1,026) was generated to visualize the
mutation frequency. (C) The gene mutation details of signature
genes, including variant classification, variant type, SNV Class,
variants per sample, variant classification summary and the top 10
mutated genes. (D) The mutation types of 8 signature genes altered
in 71 (100%) of 71 BRCA samples. BRCA, breast cancer; CNV, copy
number variation; Hete Amp, heterozygous amplification; Homo Amp,
homozygous amplification; Hete Del, heterozygous deletion; Homo
Del, homozygous deletion; SNV, single nucleotide variant. |
Identification of 5 candidate genes
with diagnostic and prognostic value in BRCA
The expression levels of the 8 signature genes in
the normal and BRCA tumor groups were further analyzed. The results
revealed that EZH2, IL4I1 and FN1 were upregulated in the tumor
group, whereas the remaining genes were downregulated (Fig. 4A). ROC curve analysis demonstrated
that ALDH1A1, ARHGEF6, EZH2, ITGA1 and PIK3R1 exhibited high
diagnostic value for BRCA (Fig.
4B-I). KM survival analysis further revealed the prognostic
significance of these genes. Specifically, high expression levels
of ALDH1A1, ARHGEF6, ITGA1 and PIK3R1 were associated with improved
OS, whereas high EZH2 expression was associated with a poorer OS
(Fig. 4J-N). These findings
highlight ALDH1A1, ARHGEF6, EZH2, ITGA1 and PIK3R1 as potential
diagnostic biomarkers for patients with BRCA, with prognostic
implications.
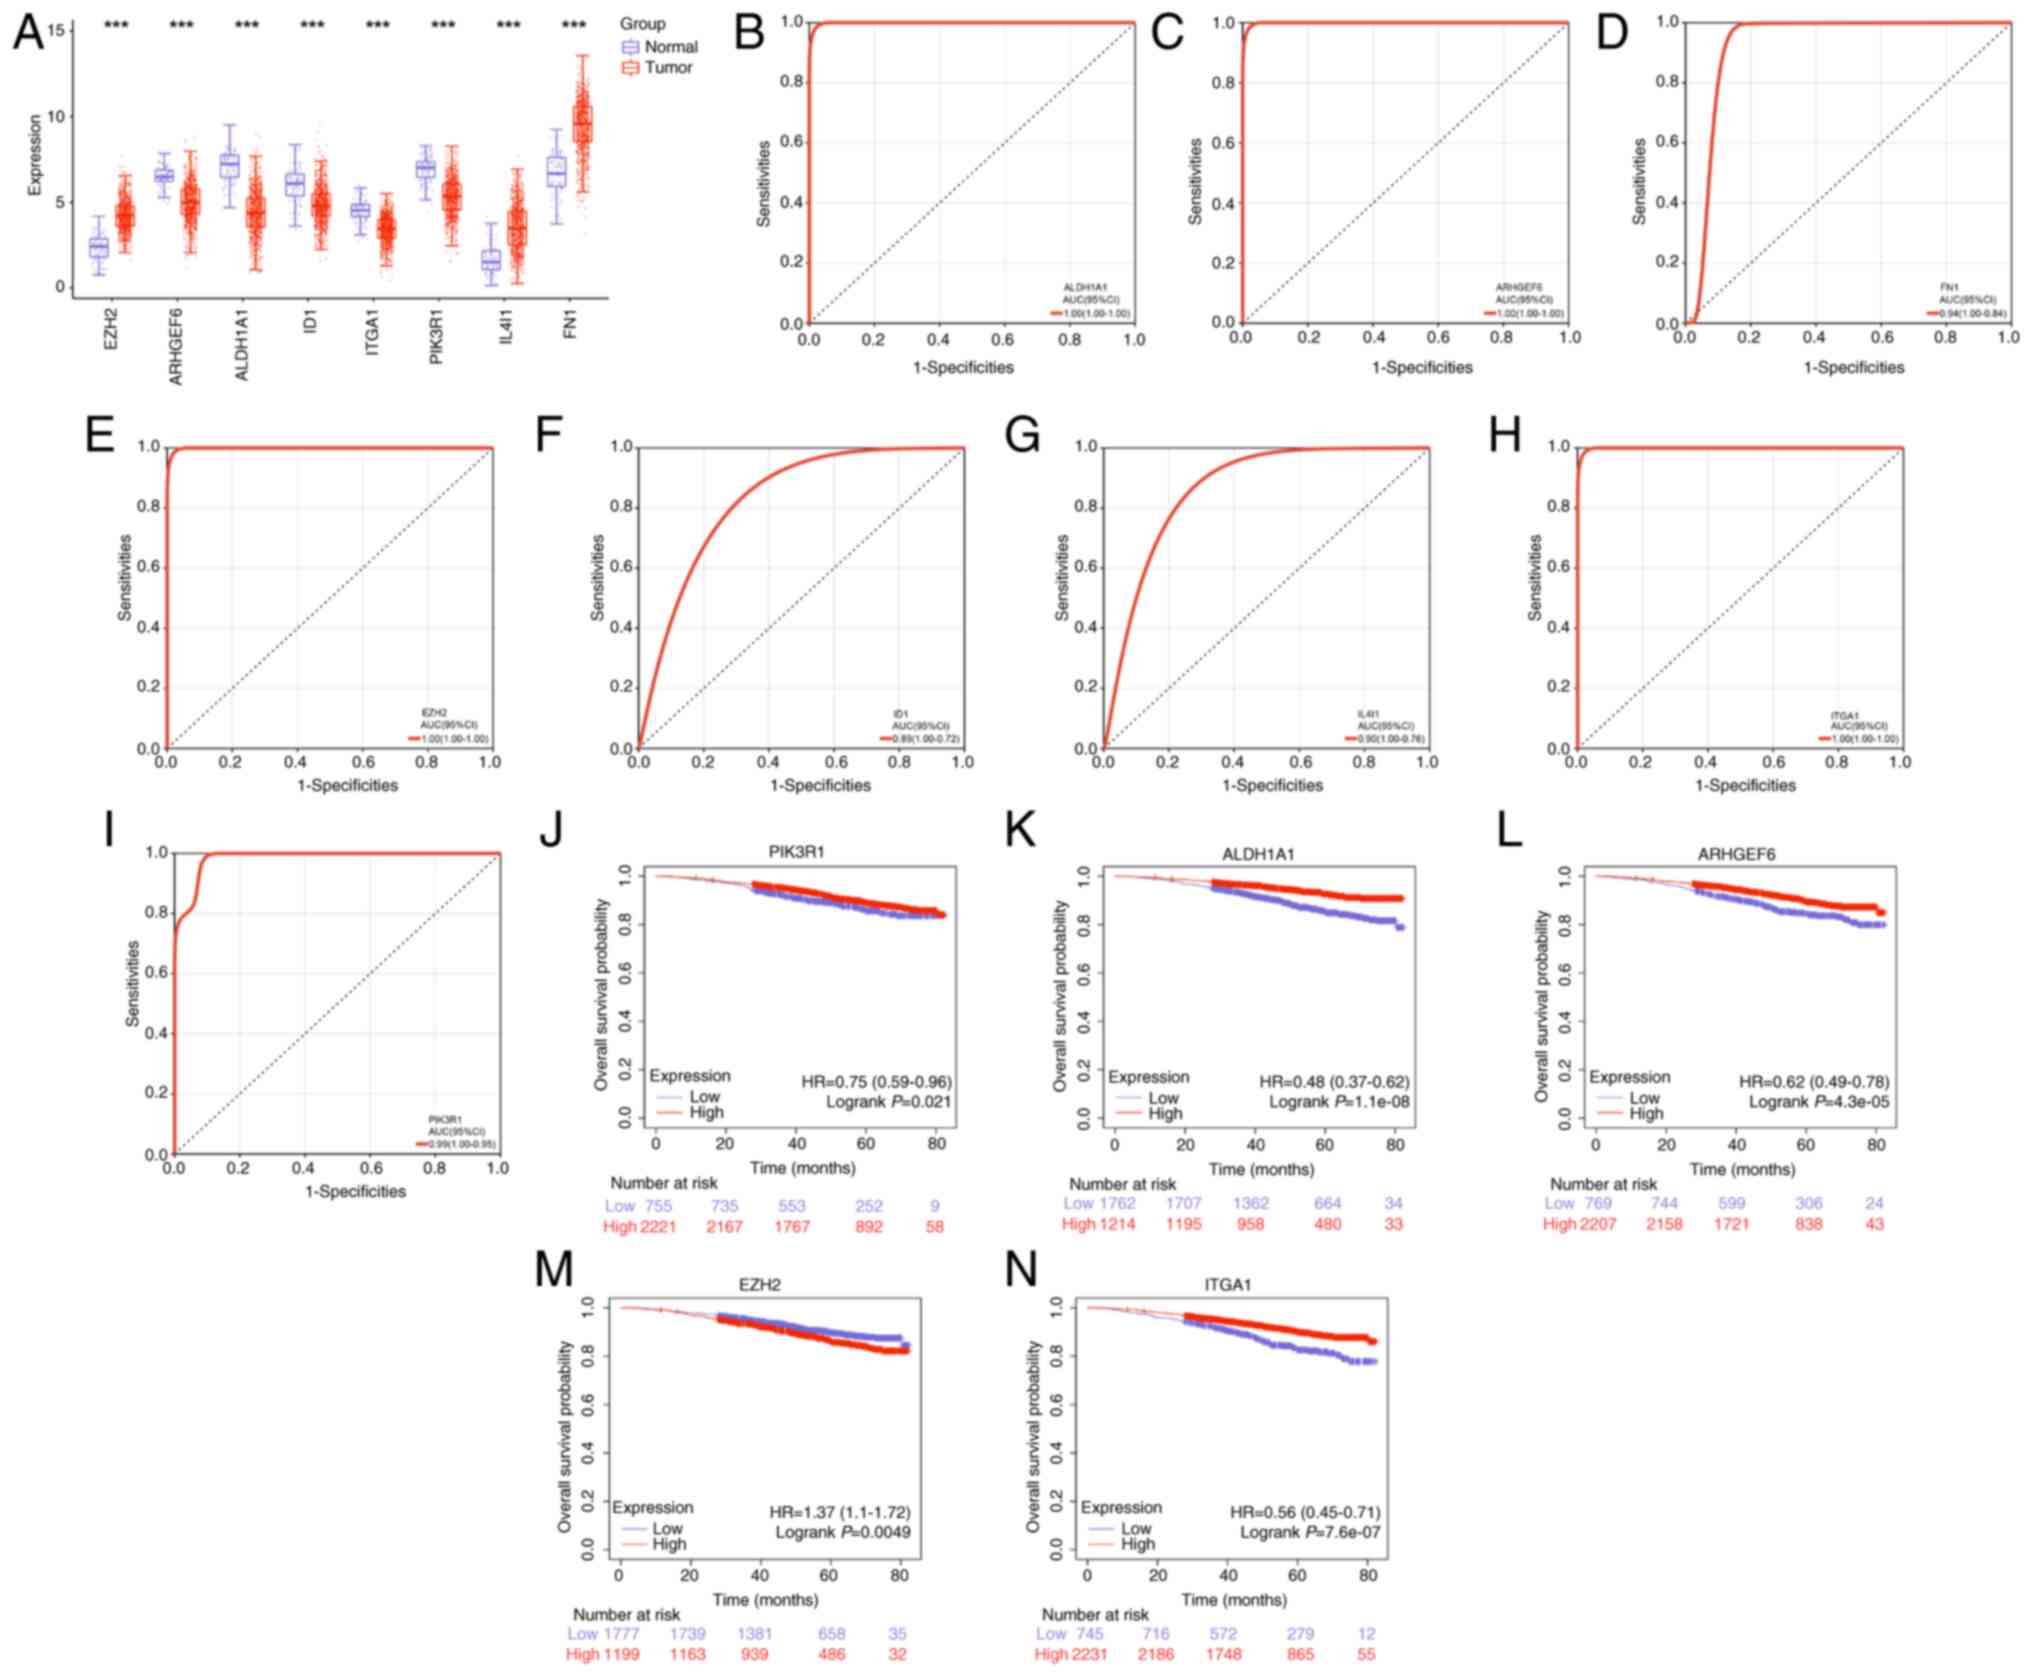 | Figure 4.Candidate genes with diagnostic and
prognostic value in BRCA were identified. (A) The expression levels
of 8 signature genes in normal and BRCA tumor groups. (B-I) The
receiver operating calibration curve analysis of 8 signature genes.
The top 5 genes with the highest AUC values are ALDH1A1, ARHGEF6,
EZH2, ITGA1 and PIK3R1. (J-N) The Kaplan-Meier survival analysis of
PIK3R1, ALDH1A1, ARHGEF6, EZH2 and ITGA1. ***P<0.001. BRCA,
breast cancer; AUC, area under the curve; HR, hazard ratio; CI,
confidence interval; ALDH1A1, aldehyde dehydrogenase 1 family
member A1; ARHGEF6, Rac/Cdc42 guanine nucleotide exchange factor 6;
EZH2, enhancer of zeste 2 polycomb repressive complex 2 subunit;
ITGA1, integrin α1; ID1, inhibitor of DNA binding 1; FN1,
fibronectin. |
ARHGEF6 is the key gene of the 5
candidate genes
Univariate and multivariate Cox regression analyses
were performed to estimate the prognostic significance of the
candidate prognostic genes (Fig. 5A and
B). In univariate analysis, ARHGEF6 was significantly
associated with better overall survival, while advanced pT-stage
and pTNM-stage predicted worse outcomes (Fig. 5A). In multivariate analysis, ARHGEF6
remained an independent protective factor, whereas ITGA1 and
pTNM-stage were independent risk factors (Fig. 5B). To facilitate accurate prognosis
prediction for patients with BRCA, a nomogram was subsequently
created on the basis of the independent prognostic factors
identified via multivariate Cox regression analysis. This nomogram
integrated multiple clinical characteristics, including ALDH1A1,
ARHGEF6, ITGA1 and the pTNM stage (Fig.
5C), which were evaluated via a calibration curve. These curves
were generated to assess the agreement between the predicted
survival probabilities from the nomogram and the actual observed
survival rates at 1, 3 and 5 years. The results in Fig. 5D show that the predicted results
closely corresponded to the actual results, which indicated that
this nomogram had high predictive accuracy. On the basis of these
findings, ARHGEF6 was targeted as the key gene in the present
study.
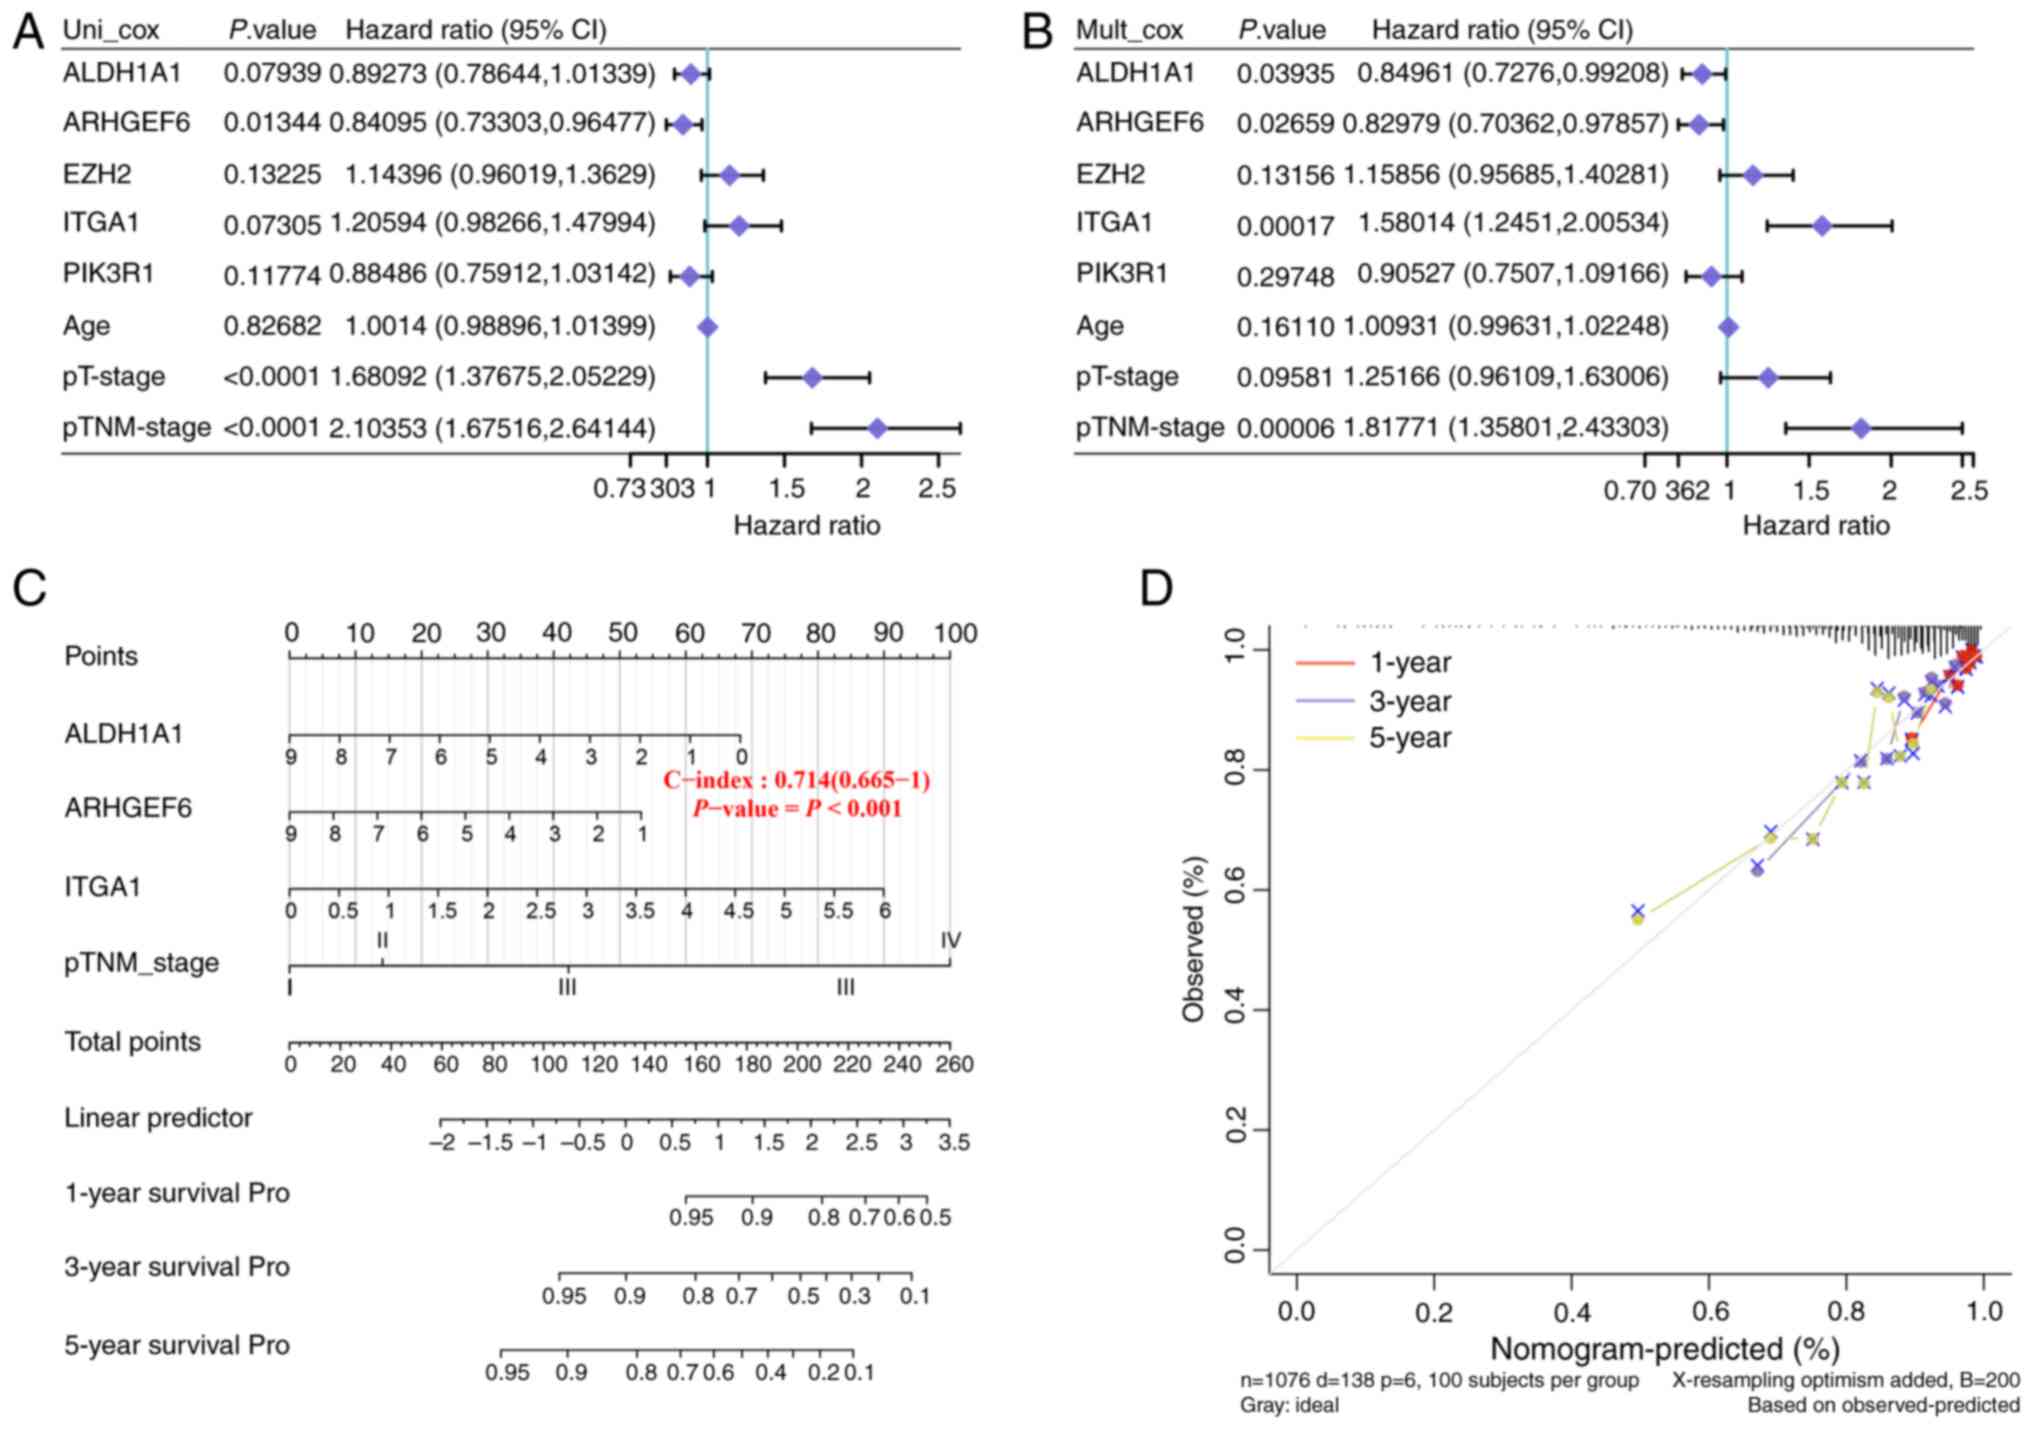 | Figure 5.ARHGEF6 was targeted in the present
study as the key gene. (A) Univariate and (B) multivariate Cox
regression analyses were performed to assess the prognostic
significance of PIK3R1, ALDH1A1, ARHGEF6, EZH2 and ITGA1. (C) The
prognostic nomogram integrated ALDH1A1, ARHGEF6, ITGA1 and pTNM
stage to predict the 1-, 3- and 5-year survival probability. (D)
The performance of the prognostic nomogram was evaluated using
calibration curves. ALDH1A1, aldehyde dehydrogenase 1 family member
A1; ARHGEF6, Rac/Cdc42 guanine nucleotide exchange factor 6; EZH2,
enhancer of zeste 2 polycomb repressive complex 2 subunit; ITGA1,
integrin α1; CI, confidence interval. |
ARHGEF6 is a tumor suppressor gene in
BRCA
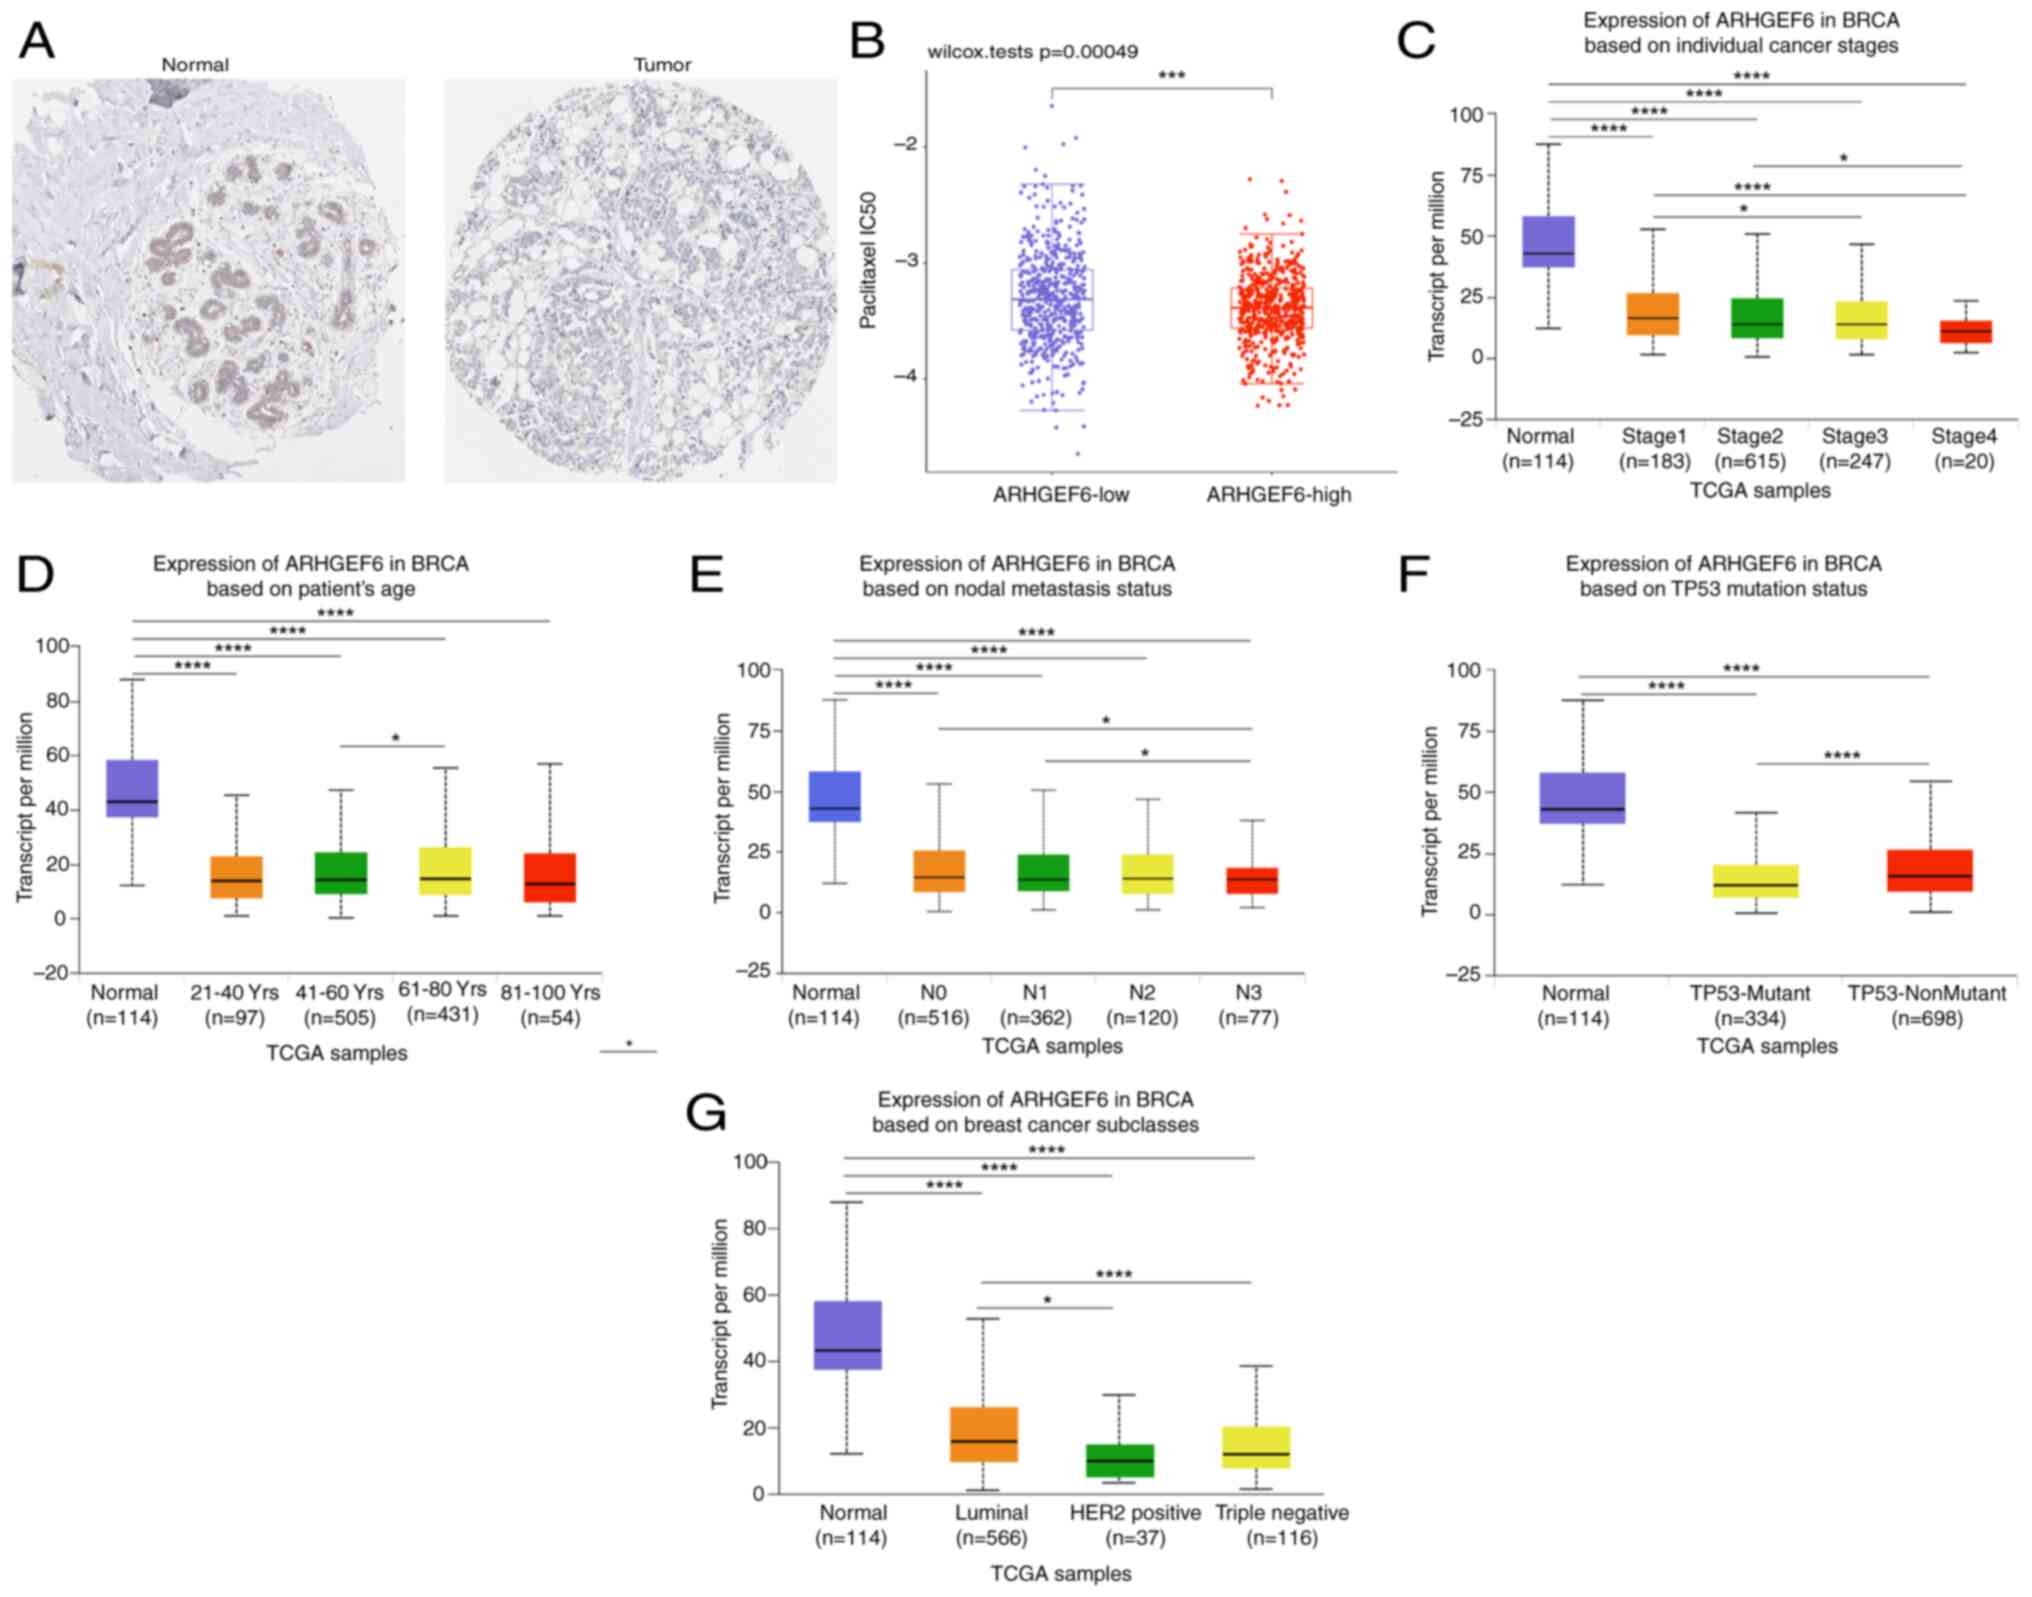
Analysis using the HPA database revealed that the
ARHGEF6 protein levels were significantly lower in BRCA tumor
tissues than in normal tissues (Fig.
6A). Higher ARHGEF6 expression was associated with lower
IC50 values in the paclitaxel sensitivity analysis,
suggesting its potential role in guiding personalized therapeutic
strategies (Fig. 6B). The
downregulation of ARHGEF6 was observed across various clinical
subgroups, including different cancer stages (Fig. 6C), age groups (Fig. 6D), nodal metastasis statuses
(Fig. 6E) and TP53 mutation
statuses (Fig. 6F). However, the
differences in ARHGEF6 expression among these clinical subgroups
were relatively minor. ARHGEF6 expression across molecular subtypes
of BRCA was further compared and it was found that ARHGEF6 was
downregulated in the Luminal, HER2-positive and TNBC subtypes
compared with normal tissues (Fig.
6G). Compared with the Luminal subtype, the ARHGEF6 levels were
significantly lower in both the HER2-positive and TNBC groups
(Fig 6G). Although ARHGEF6
expression was slightly higher in TNBC than in the HER2-positive
group, the difference was not statistically significant (Fig 6G). Although both HER2-positive and
TNBC subtypes showed reduced ARHGEF6 expression compared with the
normal breast tissue and Luminal subtypes, TNBC was selected for
functional validation due to its poor prognosis and lack of
targeted therapies.
ARHGEF6 overexpression suppresses cell
proliferation, invasion and migration and promotes apoptosis
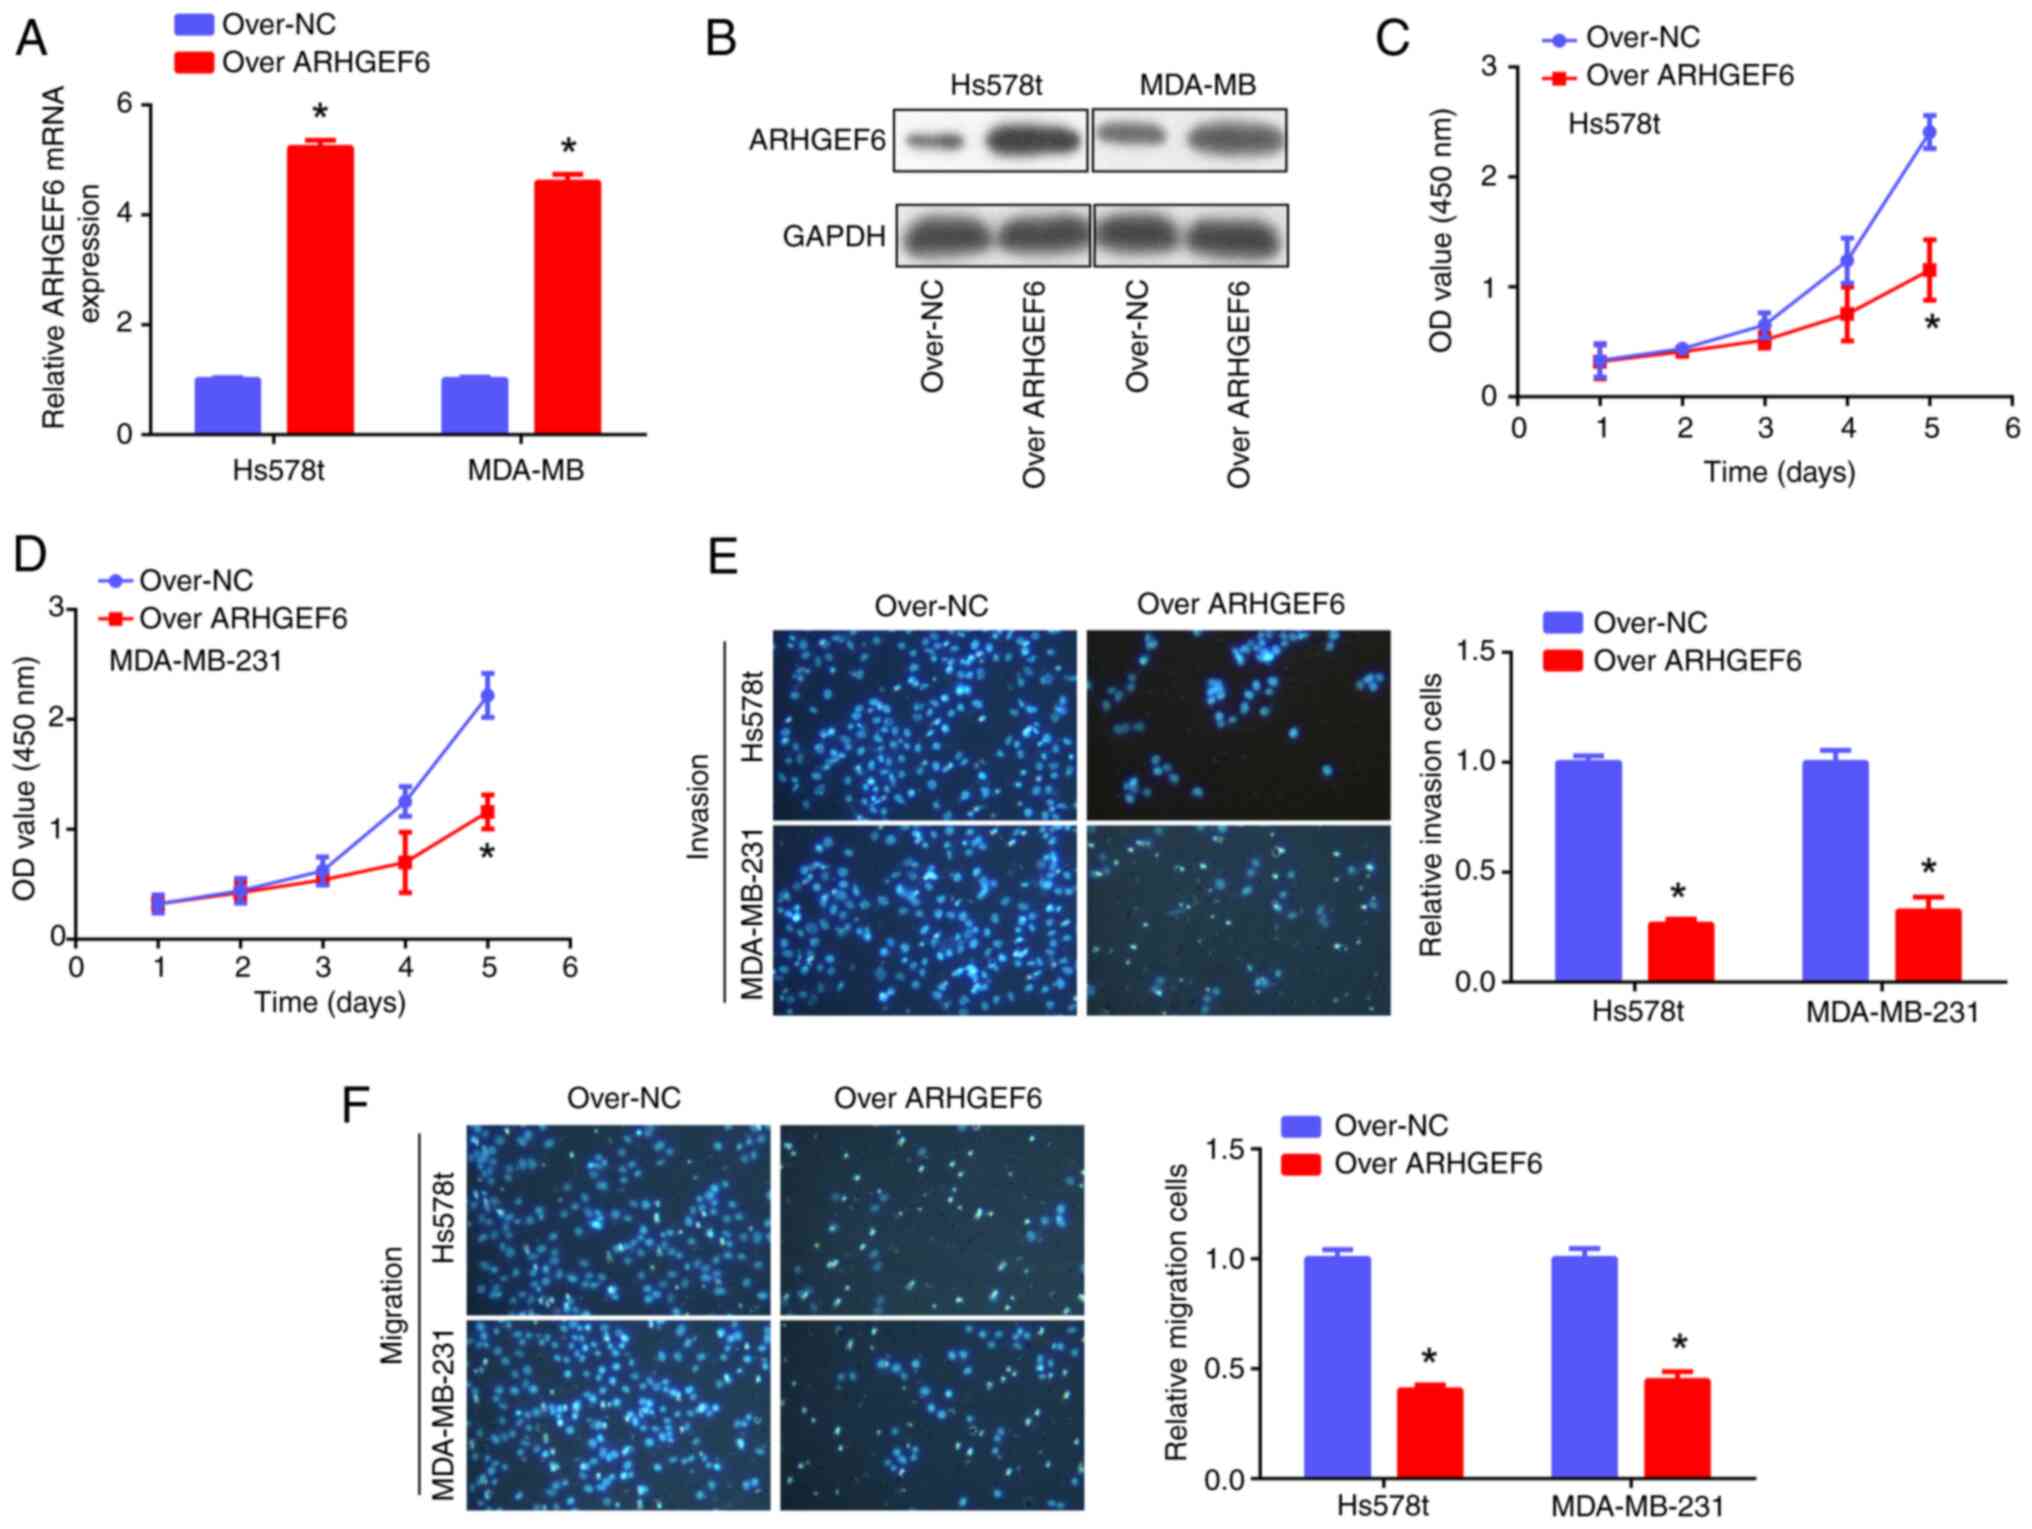
For the cellular experiments, ARHGEF6 was first
overexpressed in Hs578t and MDA-MB-231 cells, as confirmed by PCR
and western blotting assays (Fig. 7A
and B). Subsequent functional experiments demonstrated that
ARHGEF6 overexpression significantly suppressed the proliferation
(Fig. 7C and D), invasion and
migration (Fig. 7E and F) of BRCA
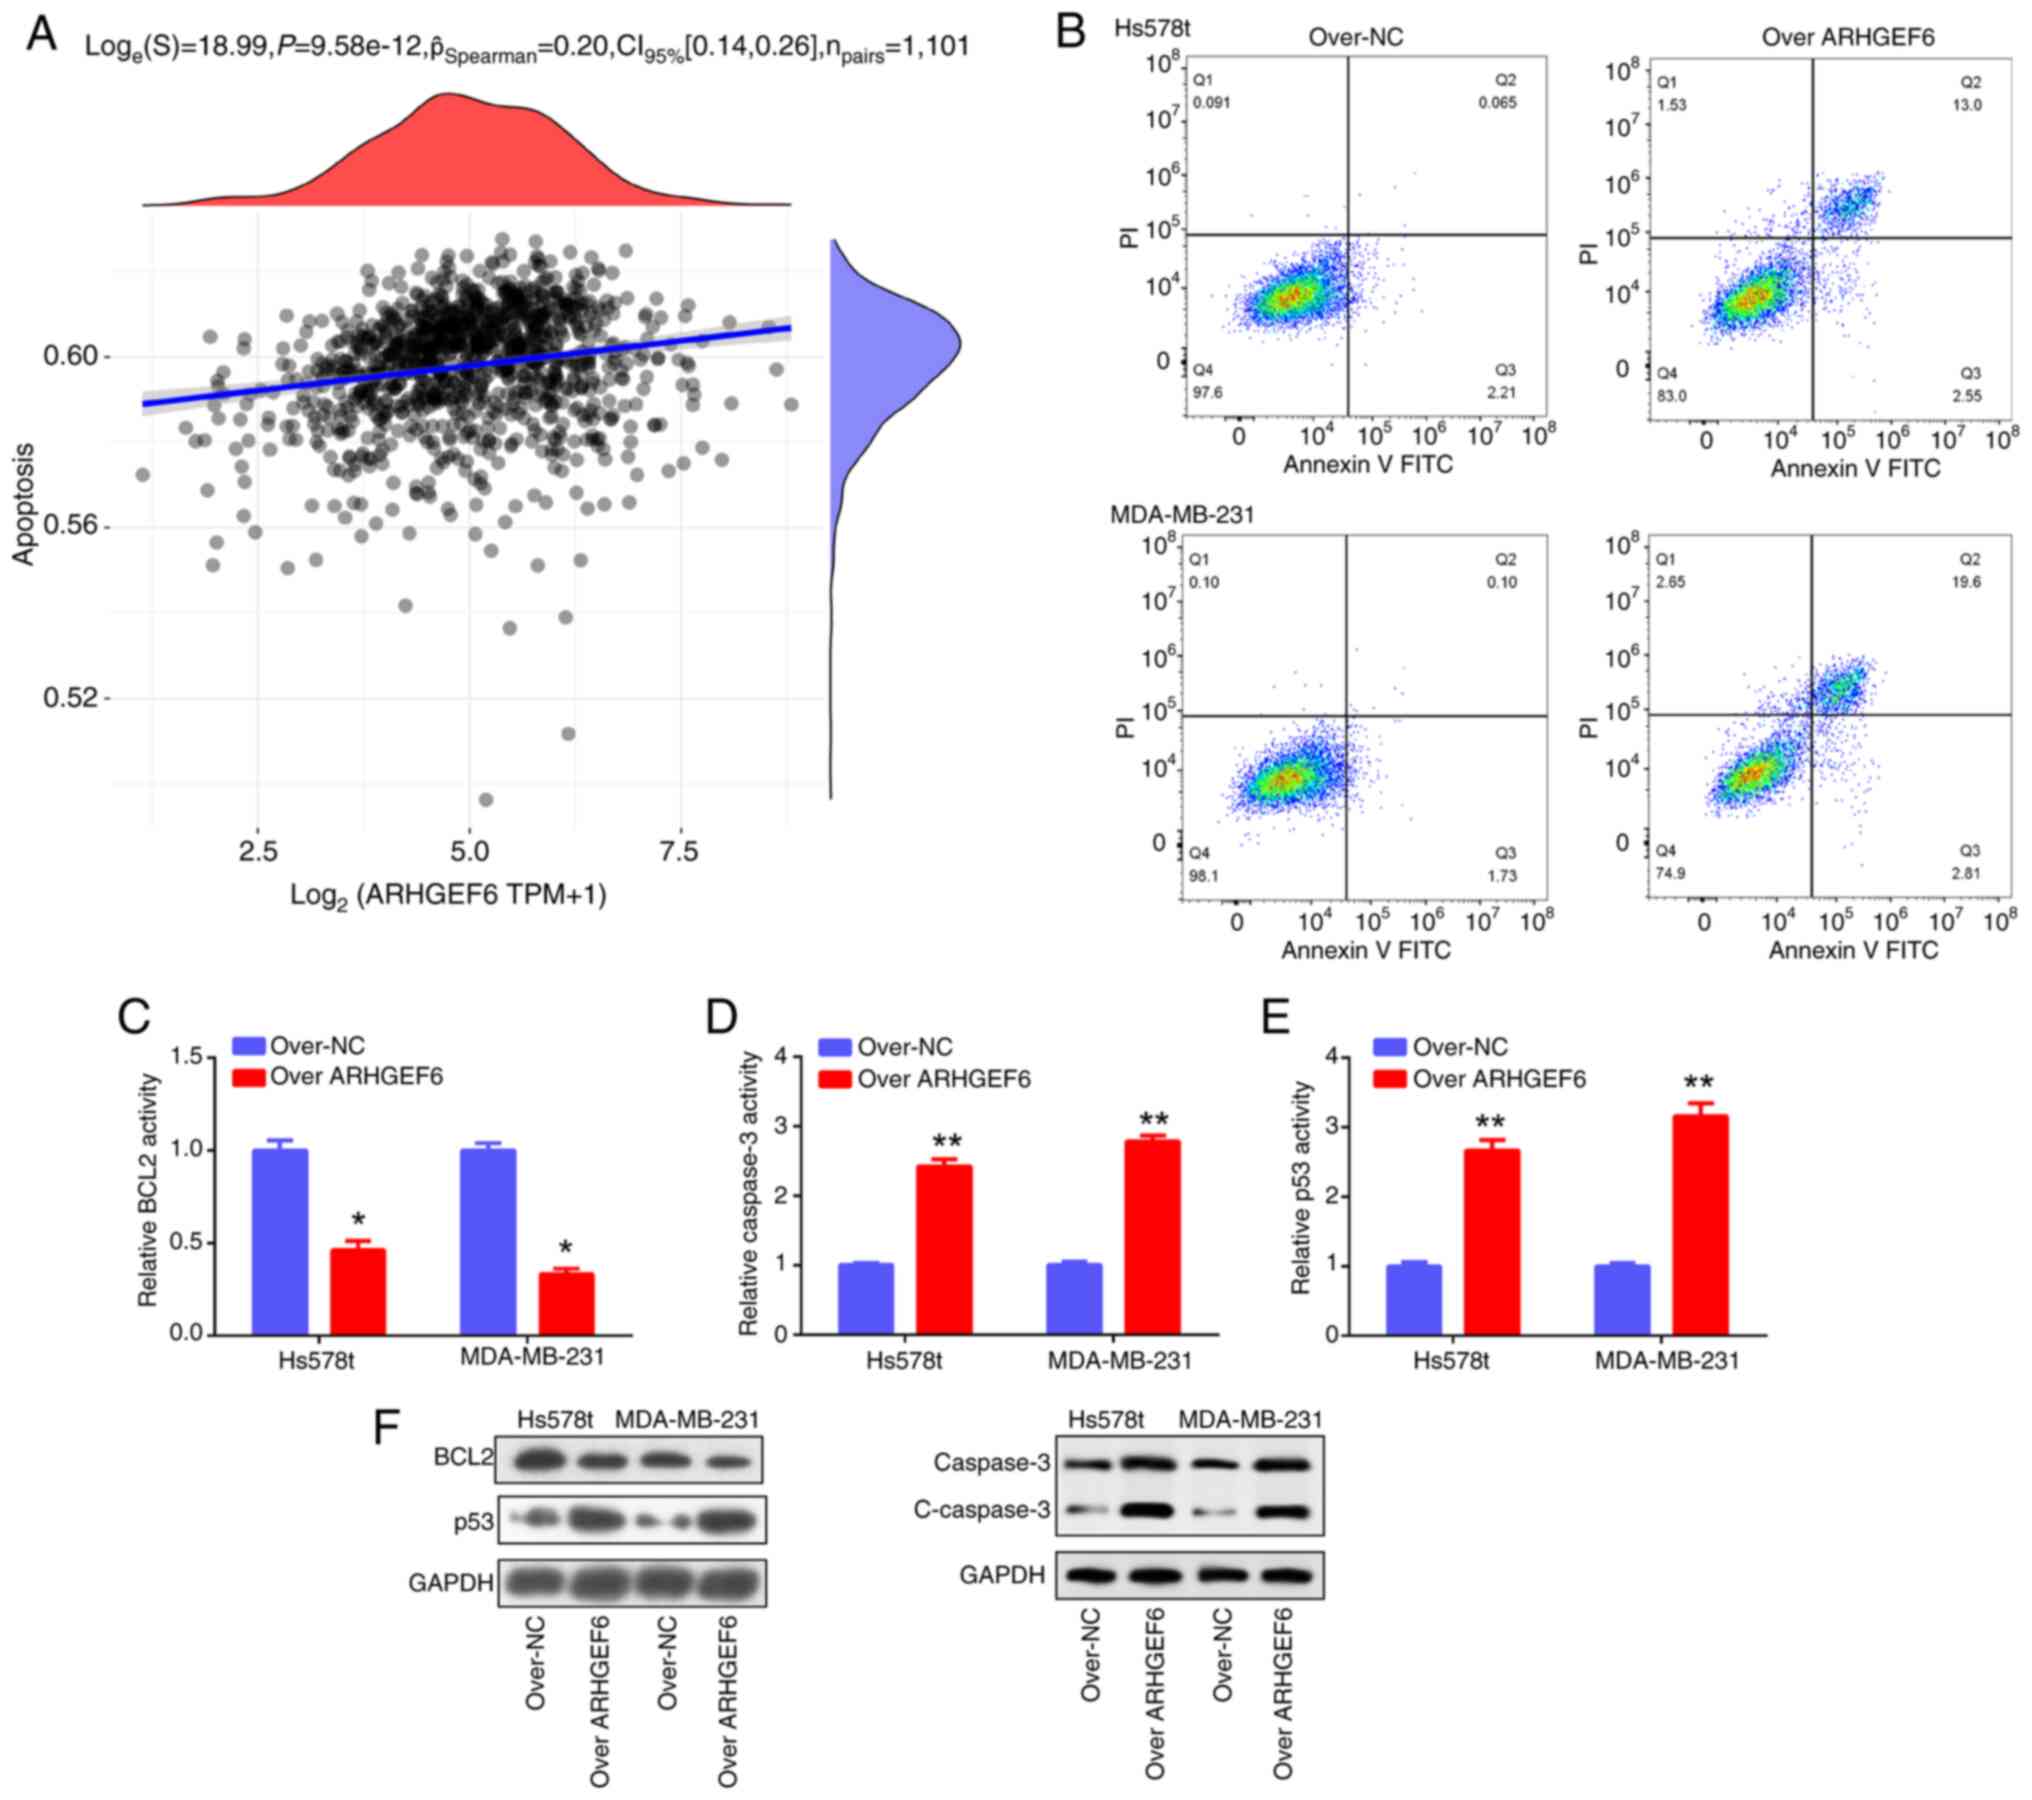
cell lines. Furthermore, ARHGEF6 was found to be positively
correlated with apoptosis (Fig.
8A), a finding further validated by flow cytometry (Fig. 8B), PCR and western blotting
analyses. Mechanistically, ARHGEF6 overexpression downregulated
BCL2 while upregulating caspase-3 and p53 at both the mRNA and
protein levels, along with increased cleaved caspase-3 protein
expression, thereby promoting apoptosis in BRCA cells (Fig. 8C-F). Collectively, these results
highlight ARHGEF6 as a tumor suppressor gene in BRCA that regulates
cell growth, invasion, migration and apoptosis.
Discussion
Clinical biomarkers are essential for predicting
treatment response and optimizing therapy selection (16). For example, genetic mutations such
as BRAF mutations in melanoma can help predict the response to
targeted therapies (17,18). Similarly, biomarkers such as
programmed death-ligand 1 expression in tumors have been utilized
to determine which patients can benefit from immune checkpoint
inhibitors in various cancer types (19,20).
BRCA is a heterogeneous disease with various subtypes according to
the presence or absence of specific molecular markers (21,22).
At present, it is vital to identify biomarkers and genetic
signatures related to BRCA because current diagnostic tools lack
sufficient sensitivity and specificity for early-stage detection,
leading to delayed diagnosis and treatment. Moreover, existing
biomarkers may not fully capture tumor heterogeneity, limiting
personalized therapy options. Improving biomarker discovery can
facilitate earlier intervention and better patient outcomes.
In the present study, the overlapping DEGs from the
GSE21422 and TCGA-BRCA datasets were selected due to their
comprehensive breast cancer gene expression profiles and large
sample sizes. Overlapping DEGs identified from these datasets were
enriched primarily in the regulation of angiogenesis,
collagen-containing extracellular matrix (ECM) and metal ion
binding. Angiogenesis plays a vital role in the growth and
metastasis of tumors, including BRCA. Several regulatory factors
have been identified in the context of BRCA angiogenesis. For
example, vascular endothelial growth factor is a key angiogenic
factor that promotes the formation of new blood vessels (23,24).
The primary element of the ECM, collagen, is essential for
preserving tissue integrity (25).
In BRCA, alterations in the composition and organization of
collagen within the ECM have been observed (26). Metal ions are essential for various
physiological processes, but their dysregulation can contribute to
cancer development (27). In BRCA,
metal ion-binding proteins have been implicated in tumor
progression and angiogenesis (28).
Understanding the molecular mechanisms underlying these processes
can provide valuable insights for developing targeted therapies and
improving patient outcomes in BRCA treatment.
In the present study, on the basis of the
overlapping genes, risk score model, expression, ROC and KM
survival analyses were performed and 5 genes with diagnostic value
were identified, namely, ALDH1A1, ARHGEF6, EZH2, ITGA1 and PIK3R1.
The prognostic nomogram revealed that ALDH1A1, ARHGEF6 and ITGA1
also had prognostic value. ALDH1A1 is involved in the oxidation of
aldehydes (29,30); it has also been investigated in the
context of cancer, in which its upregulation has been related to
tumor initiation, progression and resistance to chemotherapy
(31). For example, in BRCA, cancer
stem cells are expected to play a role in tumor recurrence and
metastasis and ALDH1A1 is frequently utilized as a marker for these
cells (32,33). ITGA1 is a transmembrane receptor
protein involved in cell adhesion and signaling (34). ITGA1 is abnormally expressed in
cancer and is associated with tumor progression (35,36).
In BRCA, ITGA1 has been identified as a potential biomarker for
predicting tumor aggressiveness and patient prognosis (37).
Notably, ARHGEF6 was identified as the key gene.
ARHGEF6 is dysregulated in lung adenocarcinoma and medulloblastoma
(38,39). Additionally, cancer metastasis
involves a process known as epithelial-mesenchymal transition,
which is associated with ARHGEF6 (40,41).
Targeting ARHGEF6 and its downstream signaling pathways may have
therapeutic potential for inhibiting cancer metastasis. As key
players in several biological processes, ALDH1A1, ARHGEF6 and ITGA1
have also been linked to tumor growth, metastasis and therapeutic
resistance. These findings may help in the development of targeted
treatments and biomarkers for improved diagnostic and treatment
results.
Moreover, the functions of ARHGEF6 were investigated
in cell-based experiments in the present study. Using public
databases, downregulated ARHGEF6 mRNA and protein levels were
detected in BRCA. ARHGEF6 was overexpressed and CCK-8, Transwell
and apoptosis assays were performed. The data demonstrated that
ARHGEF6 overexpression suppressed cell proliferation, invasion and
migration while promoting cell apoptosis. These findings suggest
that ARHGEF6 is a suppressor gene in BRCA, which could have
implications for the clinical treatment of BRCA.
There are limitations to the present study. First,
validation was only performed in Hs578T and MDA-MB-231 cells, and
other BRCA subtypes or animal models were not used, which limits
the broad applicability of the conclusions. In future studies,
animal experiments will further verify the biological function of
ARHGEF6 and elucidate its underlying mechanisms. Additionally, the
present study did not thoroughly investigate clinical heterogeneity
factors, such as molecular subtypes, patient age and treatment
regimens, which may influence gene expression and patient
prognosis. Therefore, future research should expand the clinical
sample size, and further validate the clinical prognostic value of
ARHGEF6, thereby enhancing its potential for clinical
translation.
Overall, the present study identified novel
diagnostic indicators (such as ALDH1A1, ARHGEF6, EZH2, ITGA1 and
PIK3R1) and prognostic indicators (such as ALDH1A1, ARHGEF6 and
ITGA1) for BRCA, identified a key gene, ARHGEF6, and confirmed its
function by cellular experiments. These findings provide valuable
directions for understanding BRCA tumor development, progression
and response to therapy. These findings may facilitate the
development of novel therapeutic targets and personalized treatment
strategies and thus the improvement of patient outcomes in BRCA
management.
Acknowledgements
Not applicable.
Funding
This research was supported by Natural Science Foundation of
Bengbu Central Hospital (Grant No. 2025bbsy01 and 2025bbsy17).
Availability of data and materials
The data generated in the present study may be
requested from the corresponding author.
Authors' contributions
YZ, DZ and XS conceived and designed the study,
analyzed data and wrote the manuscript. QS, LY and WL analyzed
data. XZ, WF and BL performed experiments. CX, JL, HF and QZ
supervised the study, revised the manuscript and contributed to
data interpretation. YZ and QZ confirm the authenticity of all the
raw data. All authors have read and approved the final
manuscript.
Ethics approval and consent to
participate
Not applicable.
Patient consent for publication
Not applicable.
Competing interests
The authors declare that they have no competing
interests.
References
|
1
|
Liyanage PY, Hettiarachchi SD, Zhou Y,
Ouhtit A, Seven ES, Oztan CY, Celik E and Leblanc RM:
Nanoparticle-mediated targeted drug delivery for breast cancer
treatment. Biochim Biophys Acta Rev Cancer. 1871:419–433. 2019.
View Article : Google Scholar : PubMed/NCBI
|
|
2
|
Al-Mulhim F, Alqosaib AI, Al-Muhnna A,
Fari K, Abdel-Ghany S, Rizk H, Prince AB, Isichei A and Sabit H:
CRISPR/Cas9-mediated activation of CDH1 suppresses metastasis of
breast cancer in rats. Electronic J Biotechnol. 53:54–60. 2021.
View Article : Google Scholar
|
|
3
|
Mao XD, Wei X, Xu T, Li TP and Liu KS:
Research progress in breast cancer stem cells: Characterization and
future perspectives. Am J Cancer Res. 12:3208–3222. 2022.PubMed/NCBI
|
|
4
|
Yousef AJA: Male breast cancer:
Epidemiology and risk factors. Semin Oncol. 44:267–272. 2017.
View Article : Google Scholar : PubMed/NCBI
|
|
5
|
Momenimovahed Z and Salehiniya H:
Epidemiological characteristics of and risk factors for breast
cancer in the world. Breast Cancer (Dove Med Press). 11:151–164.
2019.PubMed/NCBI
|
|
6
|
Lei Y, Tang R, Xu J, Wang W, Zhang B, Liu
J, Yu X and Shi S: Applications of single-cell sequencing in cancer
research: Progress and perspectives. J Hematol Oncol. 14:912021.
View Article : Google Scholar : PubMed/NCBI
|
|
7
|
Wang K, Li L, Fu L, Yuan Y, Dai H, Zhu T,
Zhou Y and Yuan F: Integrated bioinformatics analysis the function
of RNA binding proteins (RBPs) and their prognostic value in breast
cancer. Front Pharmacol. 10:1402019. View Article : Google Scholar : PubMed/NCBI
|
|
8
|
Feng Y, Spezia M, Huang S, Yuan C, Zeng Z,
Zhang L, Ji X, Liu W, Huang B, Luo W, et al: Breast cancer
development and progression: Risk factors, cancer stem cells,
signaling pathways, genomics, and molecular pathogenesis. Genes
Dis. 5:77–106. 2018. View Article : Google Scholar : PubMed/NCBI
|
|
9
|
Marra A, Trapani D, Viale G, Criscitiello
C and Curigliano G: Practical classification of triple-negative
breast cancer: Intratumoral heterogeneity, mechanisms of drug
resistance, and novel therapies. NPJ Breast Cancer. 6:542020.
View Article : Google Scholar : PubMed/NCBI
|
|
10
|
Sheikh A, Hussain SA, Ghori Q, Naeem N,
Fazil A, Giri S, Sathian B, Mainali P and Al Tamimi DM: The
spectrum of genetic mutations in breast cancer. Asian Pac J Cancer
Prev. 16:2177–2185. 2015. View Article : Google Scholar : PubMed/NCBI
|
|
11
|
Viedma-Rodríguez R, Baiza-Gutman L,
Salamanca-Gómez F, Diaz-Zaragoza M, Martínez-Hernández G,
Esparza-Garrido R, Velázquez-Flores MA and Arenas-Aranda D:
Mechanisms associated with resistance to tamoxifen in estrogen
receptor-positive breast cancer. Oncol Rep. 32:3–15. 2014.
View Article : Google Scholar : PubMed/NCBI
|
|
12
|
Nagini S: Breast cancer: Current molecular
therapeutic targets and new players. Anticancer Agents Med Chem.
17:152–163. 2017. View Article : Google Scholar : PubMed/NCBI
|
|
13
|
Kretschmer C, Sterner-Kock A, Siedentopf
F, Schoenegg W, Schlag PM and Kemmner W: Identification of early
molecular markers for breast cancer. Mol Cancer. 10:152011.
View Article : Google Scholar : PubMed/NCBI
|
|
14
|
Thul PJ and Lindskog C: The human protein
atlas: A spatial map of the human proteome. Protein Sci.
27:233–244. 2018. View
Article : Google Scholar : PubMed/NCBI
|
|
15
|
Livak KJ and Schmittgen TD: Analysis of
relative gene expression data using real-time quantitative PCR and
the 2(−Delta Delta C(T)) method. Methods. 25:402–408. 2001.
View Article : Google Scholar : PubMed/NCBI
|
|
16
|
Sutcliffe M, Radley G and Barton A:
Personalized medicine in rheumatic diseases: How close are we to
being able to use genetic biomarkers to predict response to TNF
inhibitors? Expert Rev Clin Immunol. 16:389–396. 2020. View Article : Google Scholar : PubMed/NCBI
|
|
17
|
Ahmadzada T, Kao S, Reid G, Boyer M, Mahar
A and Cooper WA: An update on predictive biomarkers for treatment
selection in non-small cell lung cancer. J Clin Med. 7:1532018.
View Article : Google Scholar : PubMed/NCBI
|
|
18
|
Pao W and Girard N: New driver mutations
in non-small-cell lung cancer. Lancet Oncol. 12:175–180. 2011.
View Article : Google Scholar : PubMed/NCBI
|
|
19
|
Meng X, Huang Z, Teng F, Xing L and Yu J:
Predictive biomarkers in PD-1/PD-L1 checkpoint blockade
immunotherapy. Cancer Treat Rev. 41:868–876. 2015. View Article : Google Scholar : PubMed/NCBI
|
|
20
|
Sivapiragasam A, Kumar P, Sokol ES,
Albacker LA, Killian JK, Ramkissoon SH, Huang RSP, Severson EA,
Brown CA, Danziger N, et al: Predictive biomarkers for immune
checkpoint inhibitors in metastatic breast cancer. Cancer Med.
10:53–61. 2021. View Article : Google Scholar : PubMed/NCBI
|
|
21
|
Januškevičienė I and Petrikaitė V:
Heterogeneity of breast cancer: The importance of interaction
between different tumor cell populations. Life Sci. 239:1170092019.
View Article : Google Scholar : PubMed/NCBI
|
|
22
|
Ibragimova MK, Tsyganov MM and Litviakov
NV: Molecular-genetic portrait of breast cancer with triple
negative phenotype. Cancers (Basel). 13:53482021. View Article : Google Scholar : PubMed/NCBI
|
|
23
|
Melincovici CS, Boşca AB, Şuşman S,
Mărginean M and Mihu C, Istrate M, Moldovan IM, Roman AL and Mihu
C: Vascular endothelial growth factor (VEGF)-key factor in normal
and pathological angiogenesis. Rom J Morphol Embryol. 59:455–467.
2018.PubMed/NCBI
|
|
24
|
Kajdaniuk D, Marek B, Borgiel-Marek H and
Kos-Kudła B: Vascular endothelial growth factor (VEGF)-part 1: In
physiology and pathophysiology. Endokrynol Pol. 62:444–455.
2011.PubMed/NCBI
|
|
25
|
Yuan Z, Li Y, Zhang S, Wang X, Dou H, Yu
X, Zhang Z, Yang S and Xiao M: Extracellular matrix remodeling in
tumor progression and immune escape: from mechanisms to treatments.
Mol Cancer. 22:482023. View Article : Google Scholar : PubMed/NCBI
|
|
26
|
Insua-Rodríguez J and Oskarsson T: The
extracellular matrix in breast cancer. Adv Drug Deliv Rev.
97:41–55. 2016. View Article : Google Scholar : PubMed/NCBI
|
|
27
|
Park KC, Dharmasivam M and Richardson DR:
The role of extracellular proteases in tumor progression and the
development of innovative metal ion chelators that inhibit their
activity. Int J Mol Sci. 21:68052020. View Article : Google Scholar : PubMed/NCBI
|
|
28
|
Stelling MP, Motta JM, Mashid M, Johnson
WE, Pavão MS and Farrell NP: Metal ions and the extracellular
matrix in tumor migration. FEBS J. 286:2950–2964. 2019. View Article : Google Scholar : PubMed/NCBI
|
|
29
|
Tomita H, Tanaka K, Tanaka T and Hara A:
Aldehyde dehydrogenase 1A1 in stem cells and cancer. Oncotarget.
7:11018–11032. 2016. View Article : Google Scholar : PubMed/NCBI
|
|
30
|
Poturnajova M, Kozovska Z and Matuskova M:
Aldehyde dehydrogenase 1A1 and 1A3 isoforms-mechanism of activation
and regulation in cancer. Cell Signal. 87:1101202021. View Article : Google Scholar : PubMed/NCBI
|
|
31
|
Ciccone V, Morbidelli L, Ziche M and
Donnini S: How to conjugate the stemness marker ALDH1A1 with tumor
angiogenesis, progression, and drug resistance. Cancer Drug Resist.
3:26–27. 2020.PubMed/NCBI
|
|
32
|
Kong Y, Lyu N, Wu J, Tang H and Xie X,
Yang L, Li X, Wei W and Xie X: Breast cancer stem cell markers CD44
and ALDH1A1 in serum: Distribution and prognostic value in patients
with primary breast cancer. J Cancer. 9:3728–3735. 2018. View Article : Google Scholar : PubMed/NCBI
|
|
33
|
Li W, Ma H, Zhang J, Zhu L, Wang C and
Yang Y: Unraveling the roles of CD44/CD24 and ALDH1 as cancer stem
cell markers in tumorigenesis and metastasis. Sci Rep. 7:138562017.
View Article : Google Scholar : PubMed/NCBI
|
|
34
|
Adorno-Cruz V and Liu H: Regulation and
functions of integrin α2 in cell adhesion and disease. Genes Dis.
6:16–24. 2019. View Article : Google Scholar : PubMed/NCBI
|
|
35
|
Gharibi A, La Kim S, Molnar J, Brambilla
D, Adamian Y, Hoover M, Hong J, Lin J, Wolfenden L and Kelber JA:
ITGA1 is a pre-malignant biomarker that promotes therapy resistance
and metastatic potential in pancreatic cancer. Sci Rep.
7:100602017. View Article : Google Scholar : PubMed/NCBI
|
|
36
|
Wei L, Yin F, Zhang W and Li L: ITGA1 and
cell adhesion-mediated drug resistance in ovarian cancer. Int J
Clin Exp Pathol. 10:5522–5529. 2017.
|
|
37
|
Han Y, Wang J and Xu B: Novel biomarkers
and prediction model for the pathological complete response to
neoadjuvant treatment of triple-negative breast cancer. J Cancer.
12:936–945. 2021. View Article : Google Scholar : PubMed/NCBI
|
|
38
|
Tong L, Wang S, Yang J, Zhang Q, Gu X, Mo
T, Luo Y, Zhang C, Zhang J and Liu Y: Combined ARHGEF6 and tumor
mutational burden may serve as a potential biomarker for
immunotherapy of lung adenocarcinoma. Heliyon. 9:e185012023.
View Article : Google Scholar : PubMed/NCBI
|
|
39
|
Hemmesi K, Squadrito ML, Mestdagh P, Conti
V, Cominelli M, Piras IS, Sergi LS, Piccinin S, Maestro R, Poliani
PL, et al: miR-135a inhibits cancer stem cell-driven
medulloblastoma development by directly repressing Arhgef6
expression. Stem Cells. 33:1377–1389. 2015. View Article : Google Scholar : PubMed/NCBI
|
|
40
|
Guan X, Guan X, Dong C and Jiao Z: Rho
GTPases and related signaling complexes in cell migration and
invasion. Exp Cell Res. 388:1118242020. View Article : Google Scholar : PubMed/NCBI
|
|
41
|
Zhou W, Li X and Premont RT: Expanding
functions of GIT Arf GTPase-activating proteins, PIX Rho guanine
nucleotide exchange factors and GIT-PIX complexes. J Cell Sci.
129:1963–1974. 2016. View Article : Google Scholar : PubMed/NCBI
|