Introduction
Liver hepatocellular carcinoma (LIHC) is a major
contributor to cancer-associated mortality worldwide, accounting
for a notable proportion of global cancer mortalities with a
5-year-survival probability of ~18%; of these occurrences, ~90% are
classified as HCC (1). Despite
advancements in surgical techniques, liver transplantation and
systemic therapies, the prognosis for patients with LIHC remains
poor (2). This poor prognosis is
primarily due to late-stage diagnoses, high recurrence rates and
resistance to conventional treatments (3,4).
Furthermore, the lack of reliable early detection biomarkers and
effective therapeutic options exacerbates the challenges in
managing LIHC (5). Consequently,
there is an urgent need to identify novel molecular biomarkers that
can serve as prognostic indicators and guide therapeutic
decision-making, thus ultimately improving patient outcomes.
The tumor microenvironment (TME) is a crucial driver
of cancer progression, with macrophages (particularly M2
macrophages) serving a central role in modulating immune responses
(6). M2 macrophages promote tumor
growth, metastasis and immune evasion by secreting cytokines such
as IL-10 and TGF-β, which suppress the activation of cytotoxic T
cells and natural killer (NK) cells (7,8).
Research has demonstrated that M2 macrophages notably influence the
progression of LIHC by promoting tumor growth and metastasis
(9). M2 macrophages are generally
considered to possess immunosuppressive properties, which enable
them to create a tumor-supportive microenvironment. These cells
achieve this effect by secreting a variety of cytokines and
chemokines that facilitate tumor cell survival and dissemination
(10,11). Previous studies have revealed that
M2 macrophages contribute to the initiation and progression of
liver cancer via interactions with hepatic stellate cells within
the LIHC microenvironment (12,13).
This crosstalk not only enhances the polarization of M2 macrophages
but also promotes tumor immune evasion by inhibiting the activity
of CD8+ T cells. Consequently, therapeutic strategies
targeting M2 macrophages may offer novel approaches for the
treatment of LIHC (11,14). Furthermore, M2 macrophages
contribute to resistance to chemotherapy and immunotherapy, thus
positioning these cells as critical targets for novel therapeutic
strategies (15). The elucidation
of the molecular mechanisms underlying M2 macrophage polarization
in LIHC may provide valuable insights into improving prognostic
assessment and enhancing treatment efficacy.
The present study aimed to explore the prognostic
significance of M2 macrophage-associated genes in LIHC and create a
predictive model for patient outcomes. Using data from The Cancer
Genome Atlas (TCGA) database, key genes associated with M2
macrophage infiltration were identified using the weighted gene
co-expression network analysis (WGCNA) algorithm. A risk model was
constructed based on these genes and validated using survival
analysis. Additionally, the potential of these genes as therapeutic
targets was examined by assessing their relationships with immune
checkpoint expression and responses to immunotherapy. The findings
offer valuable insights into the role of M2 macrophages in LIHC and
identify potential biomarkers for prognosis and immunotherapy
strategies.
Materials and methods
Data collection and preprocessing
The primary dataset used for data analysis included
the LIHC cohort from the TCGA database, which included gene
expression profiles and clinical data for patients with LIHC. The
raw RNA sequencing (RNA-seq) data were processed and normalized to
the transcripts per million format to standardize the gene
expression levels across all samples. In addition, samples with a
reported survival time of 0 days were excluded from the analysis to
ensure the integrity and reliability of the survival data. To
validate the prognostic model, two independent external validation
datasets were used. The first dataset (GSE76427) was retrieved from
the Gene Expression Omnibus (GEO) database (https://www.ncbi.nlm.nih.gov/geo/), and the second
dataset (LIRI-JP) was obtained from the International Cancer Genome
Consortium (ICGC) database (https://dcc.icgc.org/).
Evaluation of macrophage immune
infiltration in LIHC
To assess macrophage immune infiltration in LIHC and
normal tissue samples, six widely used immune infiltration
estimation methods were applied: CIBERSORT (16), xCell (17), TIMER (18), QUANTISEQ (19), EPIC (20) and MCPCOUNTER (21). These algorithms, which leverage
transcriptomic data, were used to quantify the relative levels of
macrophage infiltration in both LIHC and normal samples.
Additionally, the present study focused on the differential
expression of M2 macrophages and performed comparative analyses of
gene expression between patients with LIHC and normal controls.
Network construction, module
preservation and correlation analysis
WGCNA was employed to identify gene modules
associated with M2 macrophages (22). After excluding outlier samples, the
top 25% most variable genes were selected for subsequent analysis.
The optimal soft threshold for constructing the network was
determined by evaluating the scale-free topology model fit. A power
value that resulted in a fit close to 0.9 was chosen. The gene
co-expression network was subsequently constructed and modules were
identified based on hierarchical clustering. Preservation analysis
was performed to assess the reproducibility of the identified
modules. The modules were categorized as being strongly preserved
(Z >10), weakly preserved (2<Z<10) or not preserved
(Z<2). Modules with poor preservation were excluded from further
analysis. Finally, the correlation between M2 macrophage expression
levels and the identified gene modules was assessed using various
immune infiltration methods. The modules with the greatest
correlations with M2 macrophages were selected for further
modelling.
Prognostic gene selection and M2
macrophages-related model development
Univariate Cox regression analysis was performed on
292 genes to identify those associated with prognosis in LIHC.
Genes with P-values <0.05 were selected for further
investigation. To refine this selection, Least Absolute Shrinkage
and Selection Operator (LASSO) regression was performed with
10-fold cross-validation to identify the optimal regularization
parameter (λ). A λ-value that optimized the model fit while
minimizing overfitting was chosen. Multivariate Cox regression was
subsequently performed to evaluate the independent prognostic value
of the selected genes. A prognostic risk score model was developed
based on the expression levels of these genes, which were weighted
by their respective regression coefficients. The risk score formula
was calculated by multiplying the expression level of each gene by
its corresponding coefficient. To assess the model's predictive
accuracy, Kaplan-Meier survival analysis and time-dependent
receiver operating characteristic (ROC) curves were used to
evaluate overall survival (OS) and model performance in both the
training cohort (GSE76427) and independent validation cohorts
(LIRI-JP).
Functional enrichment analysis
To examine the differential activation of biological
pathways between the two risk groups, gene set variation analysis
(GSVA) was performed on the hallmark gene sets (23). GSVA scores were computed for each
gene set and differential expression analysis was performed to
identify the pathways with significant differential activation
between the two groups. In addition, Gene Ontology (GO) analysis
was performed to identify biological processes and cellular
components that were differentially enriched in the two risk
groups. Kyoto Encyclopedia of Genes and Genomes (KEGG) pathway
enrichment analysis with the package ‘clusterprofiler’ of R studio
(24) was also performed to examine
differences in signaling pathway activation between the groups. For
all the analyses, statistical significance was assessed using the
Benjamini-Hochberg method to correct for multiple comparisons.
Immune infiltration, tumor mutational
burden (TMB) and immune checkpoint analysis
To assess the relationships between immune
characteristics and risk stratification, the ESTIMATE algorithm
(ESTIMATE: Home) was first applied to quantify the scores for each
patient with LIHC. Pearson correlation analyses were subsequently
performed to examine the associations between these scores and the
prognostic risk score. The TMB was also evaluated for each patient
and a correlation analysis was performed with the risk score to
determine whether the TMB was associated with the risk profile. To
further explore immune responses, we employed the ‘limma’ package
of R studio to conduct differential expression analysis was
performed on common inhibitory and stimulatory immune checkpoint
genes with the threshold of |log2 fold change|>1.5 and
P<0.05. The expression of these genes was compared between the
two risk groups to investigate their potential roles in immune
evasion and therapeutic resistance. Additionally, the Tumor Immune
Dysfunction and Exclusion (TIDE) algorithm was employed to assess
the immune escape potential in both risk groups (25). Finally, the Submap algorithm was
applied to predict the likelihood of patient response to immune
checkpoint blockade (ICB) therapy based on the gene expression
signatures (26).
Single-cell (sc)RNA-seq based on the
tumor immune single cell Hub 2 (TISCH2) database
The killer cell lectin like receptor B1 (KLRB1),
with the smallest P-value in the multivariate Cox regression, was
analyzed across multiple single-cell datasets to investigate its
role in the TME. Using the TISCH2 database (27), the expression of KLRB1 was assessed
in six independent scRNA-seq datasets (http://tisch.compbio.cn/home/). The expression levels
of KLRB1 were compared across various immune cell types, including
CD8+ T cells, CD8+ exhausted T cells (Tex)
and NK cells. Ligand-receptor interactions were also examined
between different cell populations using a heatmap to visualize the
strength of these interactions. The interactions were further
represented as a network diagram to illustrate the intensity or
activity of ligand-receptor signaling, specifically between
CD8+ T cells and other cell types in the TME.
Pan-cancer expression and prognostic
analysis of KLRB1
To investigate the potential role of KLRB1 in cancer
biology, a pan-cancer analysis was performed using data from TCGA.
First, KLRB1 expression across various cancer types (including
LIHC) was assessed to identify significant differences in
expression. The prognostic value of KLRB1 was subsequently examined
by analyzing its expression in relation to clinical outcomes,
including the disease-free interval (DFI), disease-specific
survival (DSS), OS and platinum-free interval (PFI) parameters
across various cancer types. A forest plot analysis was performed
to further investigate the relationship between KLRB1 expression
and OS across various cancers. Finally, the samples were
categorized into high- and low-KLRB1 groups and differential
expression analysis was performed. Gene Set Enrichment Analysis
(GSEA) was subsequently used to identify enriched biological
pathways in the high- and low-expression groups, thus providing
insights into the potential mechanisms through which KLRB1
influences tumor progression.
Cell culture
The HuH-1 (CL-0811), HuH-7 (CL-0120), and THP-1
(CL-0233) cell lines were purchased from Procell Life Science &
Technology Co., Ltd. The HuH-1 and HuH-7 cells were cultured in
Dulbecco's Modified Eagle's Medium supplemented with 10% fetal
bovine serum (FBS) and 1% penicillin/streptomycin (all from GIBCO;
Thermo Fisher Scientific, Inc.). The THP-1 cells were cultured in
RPMI 1640 medium supplemented with 10% FBS and 1%
penicillin/streptomycin (all from GIBCO; Thermo Fisher Scientific,
Inc.). Cultures were maintained in a humidified incubator at 37°C
with a 5% CO2 atmosphere to ensure optimal growth
conditions.
Construction of KLRB1 knockdown and
overexpression cell lines
A lentivirus-based short hairpin RNA (shRNA)
strategy was employed using three distinct shRNA sequences to
downregulate KLRB1 expression in HuH-7 cells. These shRNA sequences
were cloned into the lentiviral vector pLKO.1. Simultaneously,
full-length KLRB1 complementary DNA (cDNA) was synthesized by PCR
using total RNA extracted from HuH-1 cells and cloned into the
lentiviral overexpression vector pLV-CMV-MCS-PGK-Puro to induce
KLRB1 overexpression in HuH-1 cells. Both vectors were obtained
from Addgene (Beijing Zhongyuan Co.). For lentivirus production, 10
µg of pLV-CMV-MCS-PGK-Puro was co-transfected with 7.5 µg of
packaging plasmid (pMDLg/pRRE; Addgene; Beijing Zhongyuan Co.), 2.5
µg of envelope plasmid (VSV-G; Addgene; Beijing Zhongyuan Co.) and
15 µg of a helper plasmid (pRSV-Rev; Addgene; Beijing Zhongyuan
Co.) using the calcium phosphate transfection method as part of a
3rd generation lentiviral system. Transfection was performed at
37°C for 48 h. Lentiviral particles were generated by
co-transfecting 293T cells (Procell Life Science & Technology
Co., Ltd.) with a packaging plasmid mix (REV: VSVG: PMDL=2:3:5)
using TurboFect transfection reagent (cat. no. R0532; Fermentas;
Thermo Fisher Scientific, Inc.), with virus supernatant harvested
36–48 h post-transfection and filtered for use in infection. HuH-7
and HuH-1 cells were seeded in 6-well plates until reaching 60–70%
confluency before infection with lentiviral particles at a
multiplicity of infection of 10, supplemented with poly-L-lysine (8
µg/ml) to enhance transduction. Following 12–16 h of co-culture
with the virus, the medium was replaced with fresh culture medium.
After 48 h, stable transductants were selected using 2 µg/ml
puromycin (the original concentration was 1 mg/ml) to confirm
successful transduction. All procedures were conducted at 37°C with
5% CO2. The sequences utilized for KLRB1 knockdown and
overexpression are shown in Table
SI.
RNA extraction and reverse
transcription quantitative PCR (RT-qPCR)
According to the manufacturer's protocol, total RNA
was extracted from tissue samples using TRIzol reagent (Invitrogen;
Thermo Fisher Scientific, Inc.). Subsequently, a cDNA synthesis kit
(cat. no. R212-01; Vazyme Biotech Co., Ltd.) was used to convert
the RNA into cDNA. The qPCR experiments were conducted using SYBR
Green qRT-PCR Master Mix (Vazyme Biotech Co., Ltd.), with GAPDH
serving as the internal control for normalization and the
2−ΔΔCq method (28) was
used to analyze the difference. The thermocycling protocol
consisted of an initial pre-denaturation step at 95°C for 5 min,
followed by 40 cycles of denaturation at 95°C for 10 sec, annealing
at 60°C for 20 sec and extension at 72°C for 20 sec. The primer
sequences used are listed in Table
SII.
Cell proliferation assay
Cell proliferation was assessed using a Cell
Counting Kit-8 (CCK-8; Beijing Solarbio Science & Technology
Co., Ltd.) according to the manufacturer's instructions. A total of
2,500 cells were seeded into 96-well plates and cultured for 3
days. A total of 10 µl of CCK-8 solution was added to each well for
1 h before measurement of the absorbance at 450 nm at room
temperature.
Transwell migration assay
A Transwell chamber (pore size, 8 µm; Corning, Inc.)
was used to assess the migratory ability of the cells. Target cells
(typically 1×10⁵ cells per well) were seeded into the
upper chamber of the Transwell system, with serum-free medium used
as the inducer. The lower chamber contained complete culture medium
supplemented with 10% serum (GIBCO; Thermo Fisher Scientific, Inc.)
as a chemoattractant to guide cell migration. The cells were
incubated at 37°C in a 5% CO2 incubator for 24 to 48 h,
thus allowing the cells to migrate through the membrane into the
lower chamber. After incubation, non-migrating cells in the upper
chamber were gently removed with a cotton swab. The cells in the
lower chamber were subsequently washed with PBS, fixed with
methanol at room temperature for 30 min and stained with 0.1%
crystal violet solution at room temperature for 10 min. Finally,
the stained cells in the lower chamber were observed and counted
under an inverted microscope to assess the migratory ability of the
cells through the software of Image J (version 1.8.0_345; National
Institutes of Health).
Annexin V/propidium iodide (PI)
staining assay
To assess cell apoptosis, the Annexin V-FITC/PI
(BioLegend, Inc.) dual-staining method was used. First, sh-KLRB1-2
and OE-KLRB1 cells were seeded into culture dishes and cultured
until they reached 70–80% confluence. After treatment, the cells
were collected and washed twice with PBS to remove residual culture
medium. The cells were then resuspended in 1× binding buffer and
stained with annexin V-FITC and PI solution. The mixture was gently
vortexed and incubated at room temperature in the dark for 15 min.
Annexin V-FITC binds to phosphatidylserine exposed on the surface
of the cell membrane, thereby marking early apoptotic cells,
whereas PI stains the nuclei of late apoptotic or necrotic cells
with compromised membrane integrity. After staining, apoptosis was
analyzed by flow cytometry (FACSAria III; BD Biosciences) and
evaluation using FlowJo (version 10.8.1). The dual fluorescence
signals from annexin V-FITC and PI allowed for the distinction
between healthy cells, early apoptotic cells, late apoptotic cells
and necrotic cells, thereby providing a comprehensive assessment of
the apoptotic status of the cells.
Cell tube formation assay
Human umbilical vein endothelial cells (HUVECs)
(PUMC-HUVEC-T1; cat. no. CL-0675) were obtained from Procell Life
Science & Technology Co., Ltd. The third to the fifth passage
of HUVECs in the logarithmic growth phase were used for the
subsequent experiments. The cell tube formation assay involved
seeding HUVECs onto a solidified layer of Matrigel® and
incubation for 4 to 6 h at 37°C to allow tube formation in a
96-well plate. After the cells were incubated with the coculture
supernatant of HuH-7 or HuH-1 cells for 8 h at 37°C, tube-like
structures formed. After the incubation period, the formation of
tube-like structures was examined under a fluorescence microscope.
The degree of tube formation was quantified by assessing parameters
such as the number of branches and total branching length through
Image J (version 1.8.0_345).
qPCR detection of macrophage cell
polarization
To evaluate the polarization status of M0 cells, the
expression levels of polarization marker genes were assessed using
qPCR. The THP-1 cells were cultured in RPMI 1640 medium
supplemented with 10% FBS and 1% penicillin/streptomycin (all from
GIBCO; Thermo Fisher Scientific, Inc.). Cultures were maintained in
a humidified incubator at 37°C with a 5% CO2 atmosphere
to ensure optimal growth conditions. THP-1 cells were first treated
with 100 nM phorbol 12-myristate 13-acetate for 48 h to induce
differentiation into M0 cells. The culture supernatants from
sh-KLRB1-2 and OE-KLRB1 cells were subsequently added to the M0
cells for 24 h at 37°C, after which the gene expression of the M1
and M2 markers was measured. According to manufacturer's protocol,
total RNA was extracted from the cells using TRIzol reagent
(Invitrogen; Thermo Fisher Scientific, Inc.) and reverse
transcription was performed to generate cDNA according to the
manufacturer's instructions using a reverse transcription kit (cat.
no. R212-01; Vazyme Biotech Co., Ltd.). SYBR Green fluorescence dye
(Vazyme Biotech Co., Ltd.) was used for qPCR. Specifically, the
first stage involved pre-denaturation at 95°C for 5 min, for one
cycle. Then the second stage began, which involved denaturation at
95°C for 10 sec, annealing at 60°C for 20 sec and extension at 72°C
for 20 sec, for 40 cycles. The relative expression levels of the M1
and M2 marker genes were calculated using the 2−ΔΔCq
method (28), with GAPDH serving as
the internal control. The expression levels of both M1 markers
(CD86 and IL-12) and M2 markers (IL-10 and CD206) were measured.
The sequences of the primers utilized are listed in Table SII.
Western blot analysis
The total protein of cells was obtained using
radioimmunoprecipitation assay buffer for 30 sec (cat. no. P0013B;
Beyotime Institute of Biotechnology). The total protein was
separated using 10% SDS-PAGE. The separated proteins were
subsequently transferred to a polyvinylidene fluoride membrane (GE
Healthcare). Following a 2-h blocking step at room temperature with
5% non-fat dry milk (Yili), the membranes were incubated with the
primary antibody overnight at 4°C. The primary antibodies were as
follows: Bax (1:500 dilution; cat. no. A12009), Bcl-2 (1:1,000
dilution; cat. no. A19693), C-caspase-3 (1:500 dilution; cat. no.
A11319) and β-actin (1:10,000 dilution; cat. no. AC038; all from
ABclonal Biotech Co., Ltd.). Subsequently, the membranes were
incubated with the secondary antibody (1:10,000 dilution; cat. no.
AB_1185567; goat anti-rabbit IgG; Invitrogen; Thermo Fisher
Scientific, Inc.) for 2 h at room temperature. The blots were
visualized using an enhanced chemiluminescence system (Beyotime
Institute of Biotechnology) and analyzed densitometrically using
ImageJ software (version 1.8.0_345).
Statistical analysis
All bioinformatics analyses in the present study
were performed using R Studio version 4.3.1 (https://cran.rstudio.com/bin/windows/base/old/4.3.1/),
while data were processed with GraphPad Prism 9.0 (Dotmatics).
Statistical comparisons between two groups were assessed using an
unpaired Student's t-test, whereas differences among multiple
groups were evaluated by one-way ANOVA and the Bonferroni's test
was used as the post-hoc test. P<0.05 was considered to indicate
a statistically significant difference. To ensure reproducibility,
all experiments were repeated at least three times, with results
expressed as the mean ± standard deviation.
Results
Differential expression of M2
macrophages in patients with LIHC and normal controls
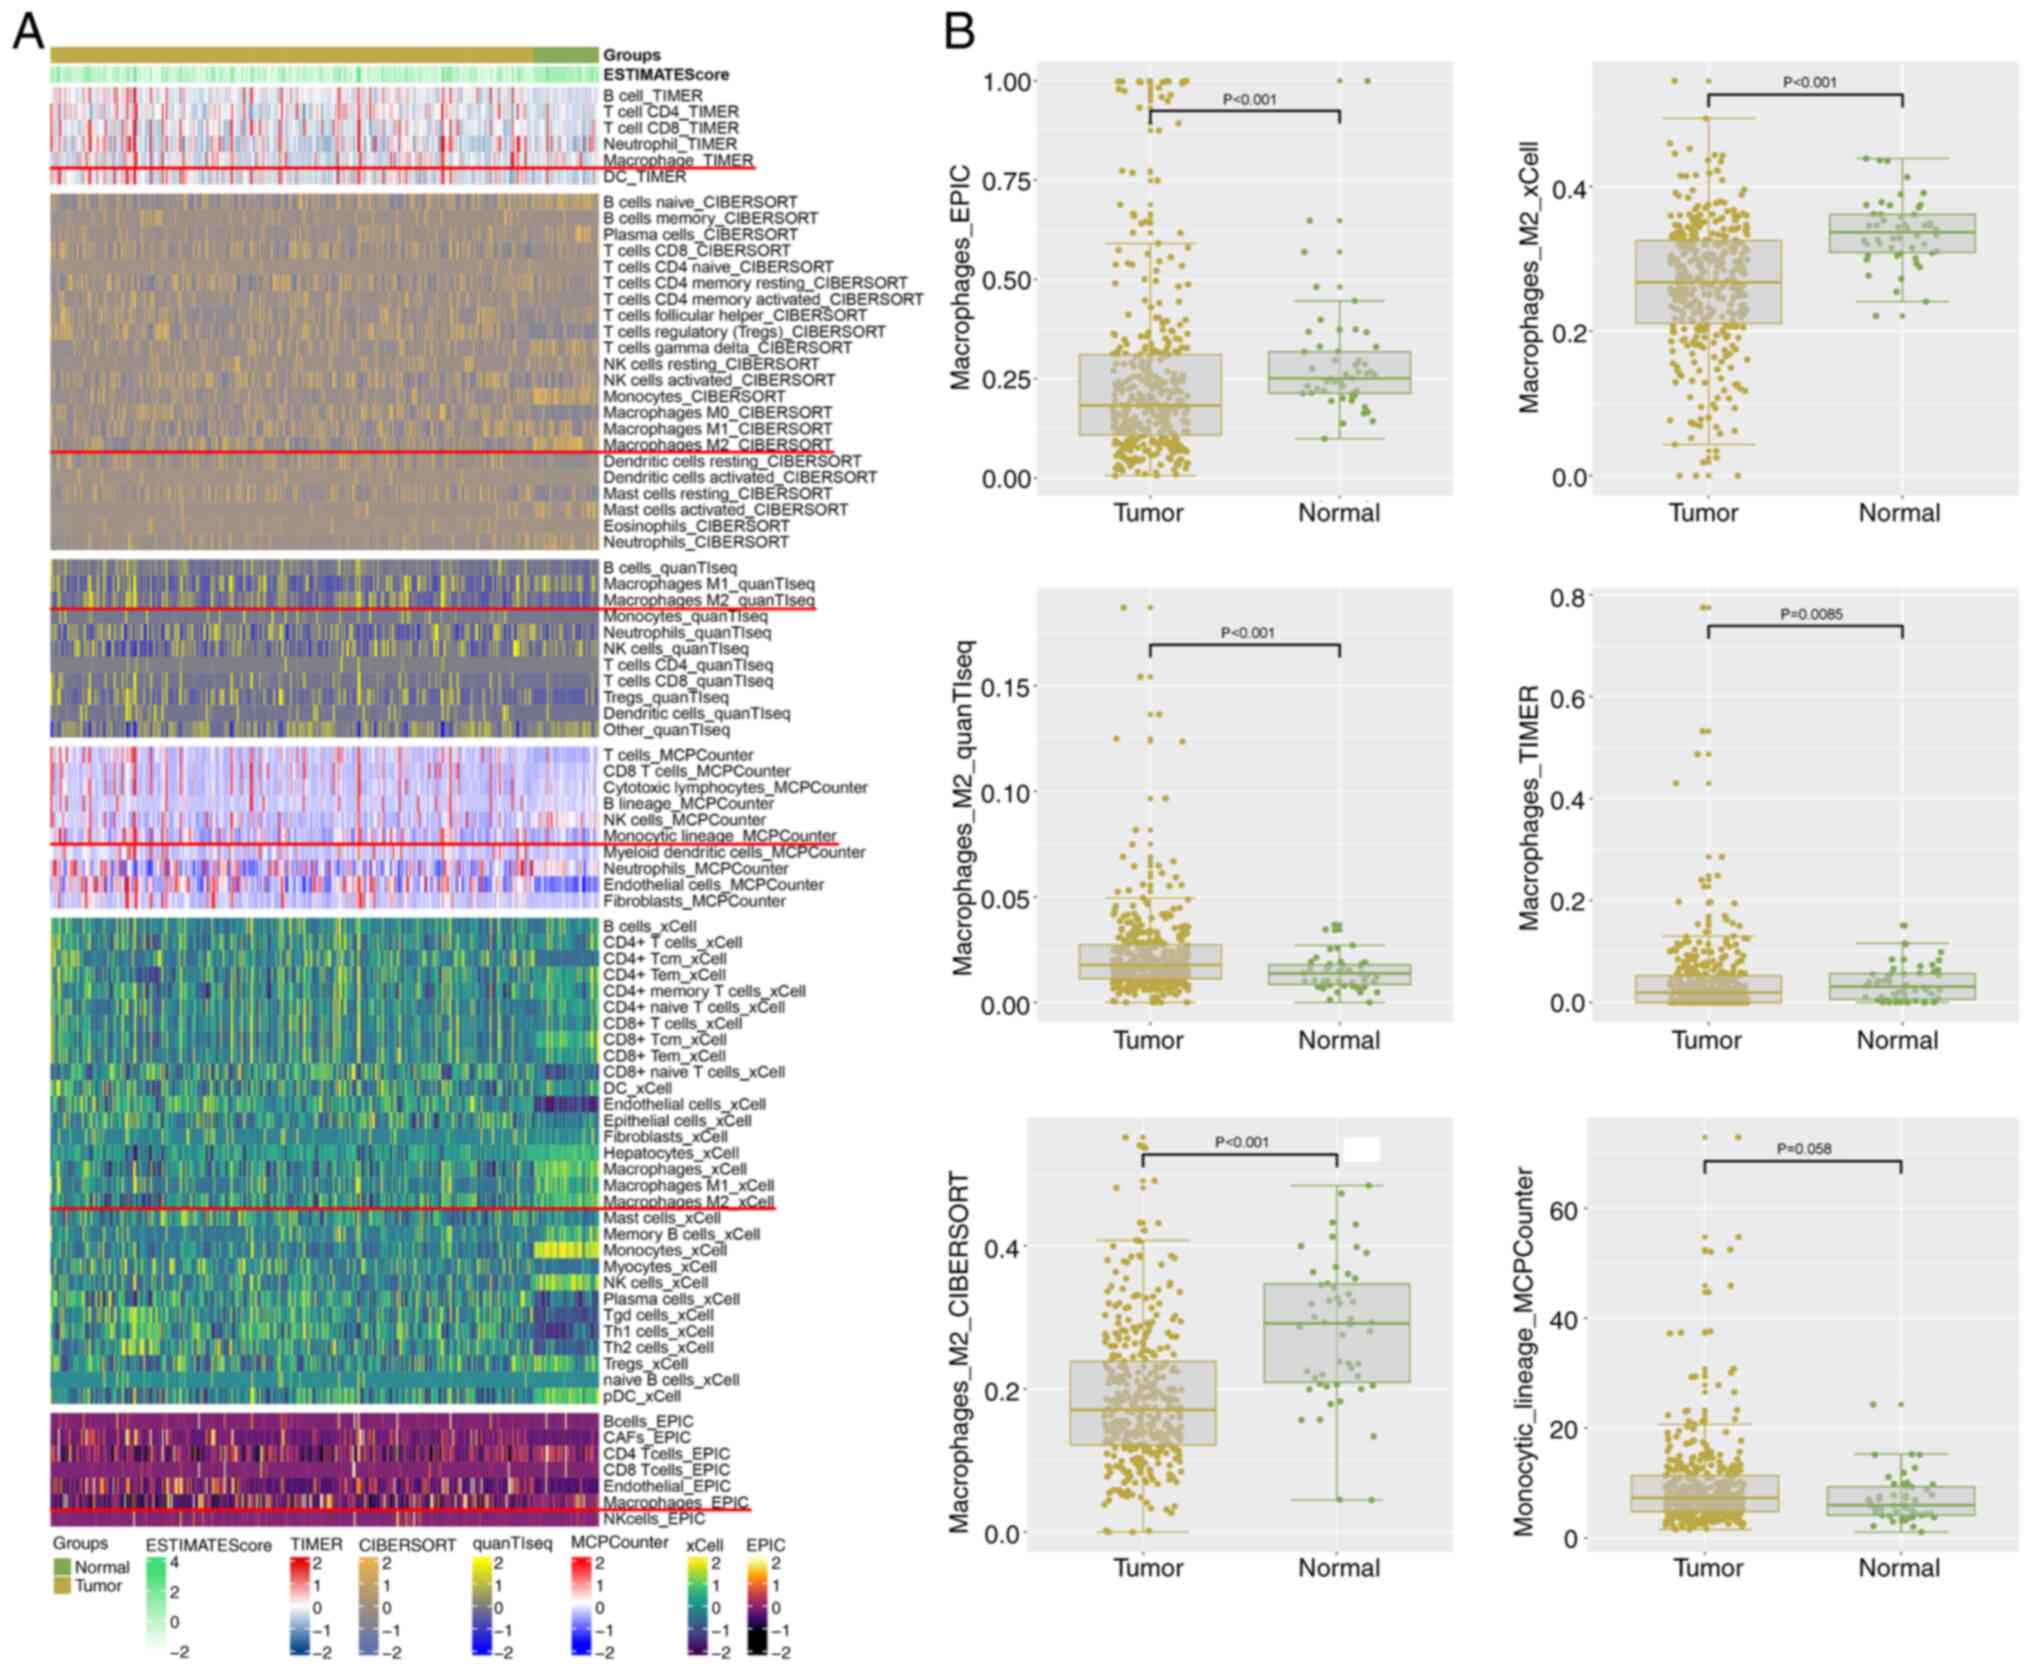
Macrophage infiltration levels in LIHC and normal
tissue samples were evaluated using six immune infiltration
analysis methods. The heatmap shown in Fig. 1A illustrates the distribution of
infiltrating macrophages in both LIHC and normal samples across the
different methods. Differential expression analysis of M2
macrophages (Fig. 1B) revealed
significant differences between patients with LIHC and normal
controls. Notably, all analysis methods indicated relevant
findings, except for the MCPCOUNTER method, which did not show a
statistically significant difference. Specifically, quantTIseq
exhibited a significant decrease, while the other methods
demonstrated increases in expression. Consequently, the results are
inconsistent across the different approaches. These results
underscore the potential involvement of M2 macrophages in the
immune microenvironment of LIHC.
Identification of M2
macrophage-related gene modules
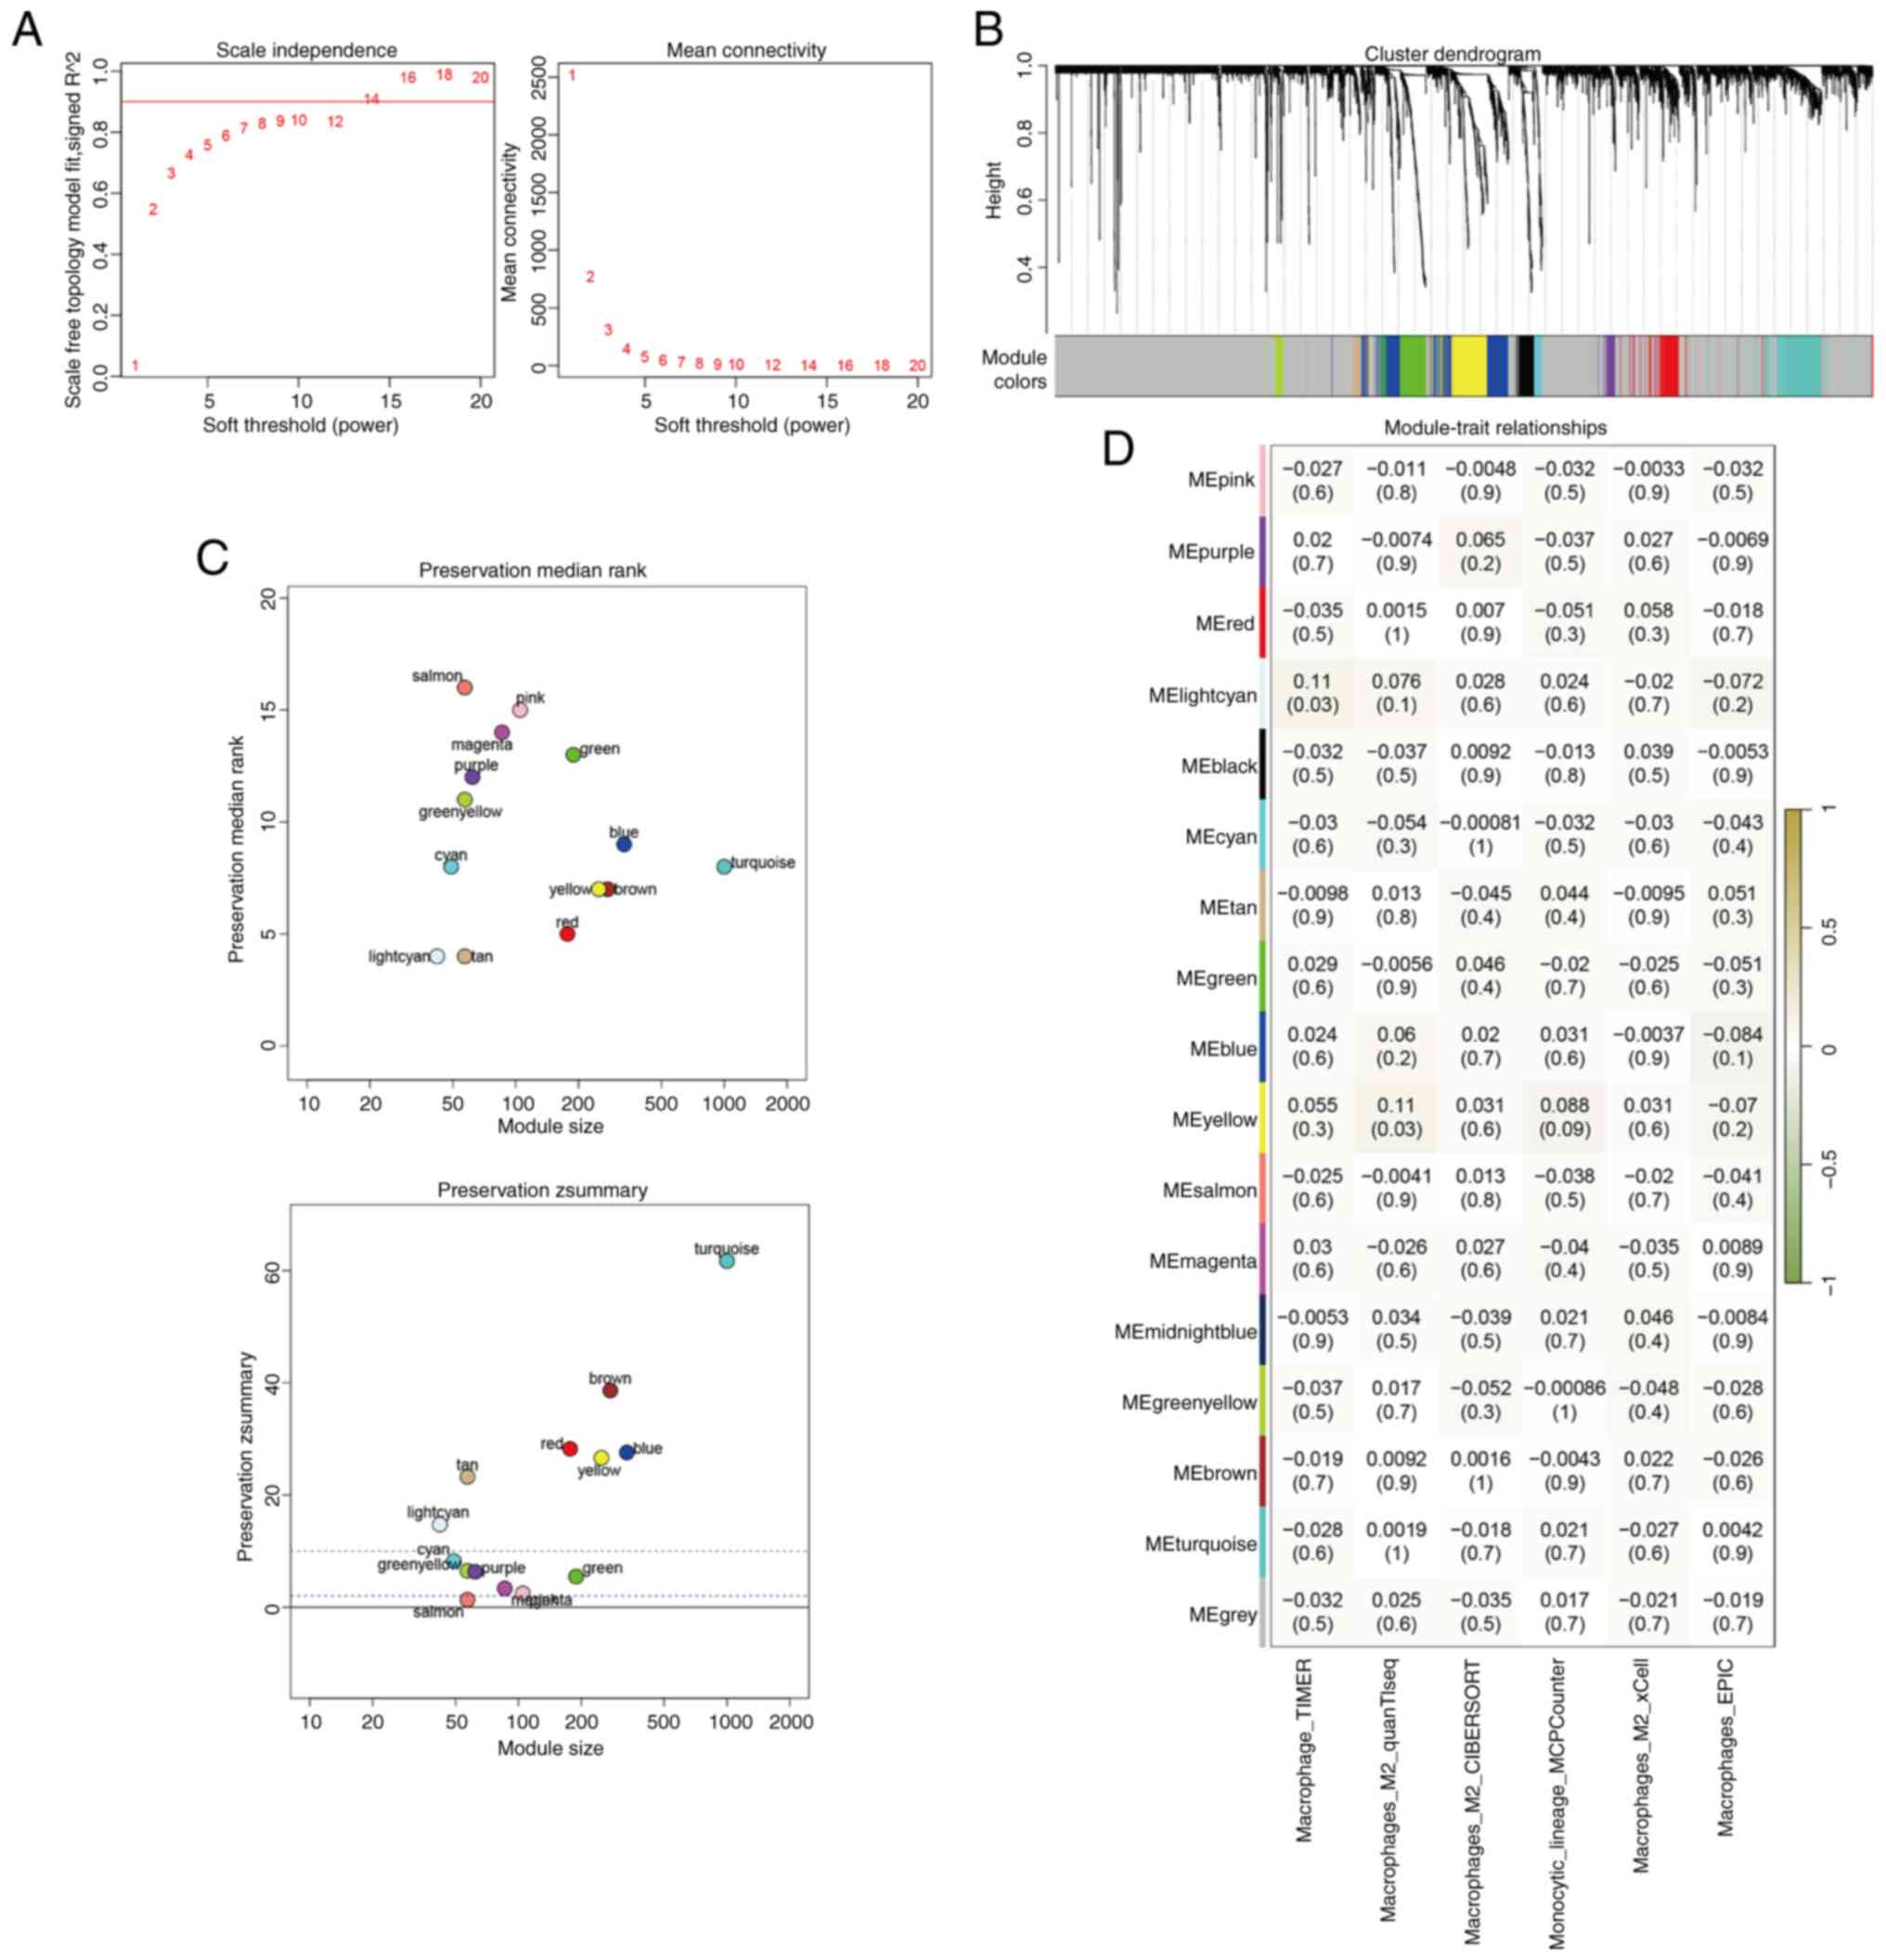
The optimal soft threshold for constructing the gene
co-expression network was determined to be 14, which yielded a
scale-free topology model fit value approaching 0.9 (Fig. 2A). A total of 16 distinct gene
modules were identified using WGCNA (Fig. 2B). Preservation analysis indicated
that four modules (grey, gold, midnight blue and black)
demonstrated Z scores <2, thereby indicating poor preservation;
thus, these modules were excluded from further analysis (Fig. 2C). Correlation analysis between M2
macrophage expression levels and the gene modules revealed that the
light cyan and yellow modules were the most strongly correlated
with M2 macrophages (Fig. 2D).
Genes from these two modules were selected for subsequent
prognostic modelling.
Development and validation of the M2
macrophage-related genes prognostic model
Univariate Cox regression analysis identified 14
genes with significant associations with patient prognosis
(P<0.05) in the LIHC cohort (Fig.
3A). LASSO regression analysis (with a λ value of 0.0514)
revealed three genes for inclusion in the final model, including
KLRB1 (Fig. 3B). Multivariate Cox
regression analysis validated the independent prognostic value of
these three genes. The prognostic risk score model was constructed
based on the following formula:
RiskScore=phosphatidylinositol-5-phosphate 4-kinase type 2α
(PIP4K2A) × 1.0165 + KLRB1 × 0.8897 (Fig. 3C). Kaplan-Meier survival analysis
revealed significant differences in survival between the two risk
groups (Fig. 3D). The model's
performance was validated using time-dependent ROC analysis, which
demonstrated a certain predictive ability across three separate
cohorts, including TCGA LIHC, GSE76427 (GEO) and LIRI-JP (ICGC)
(Fig. 3E).
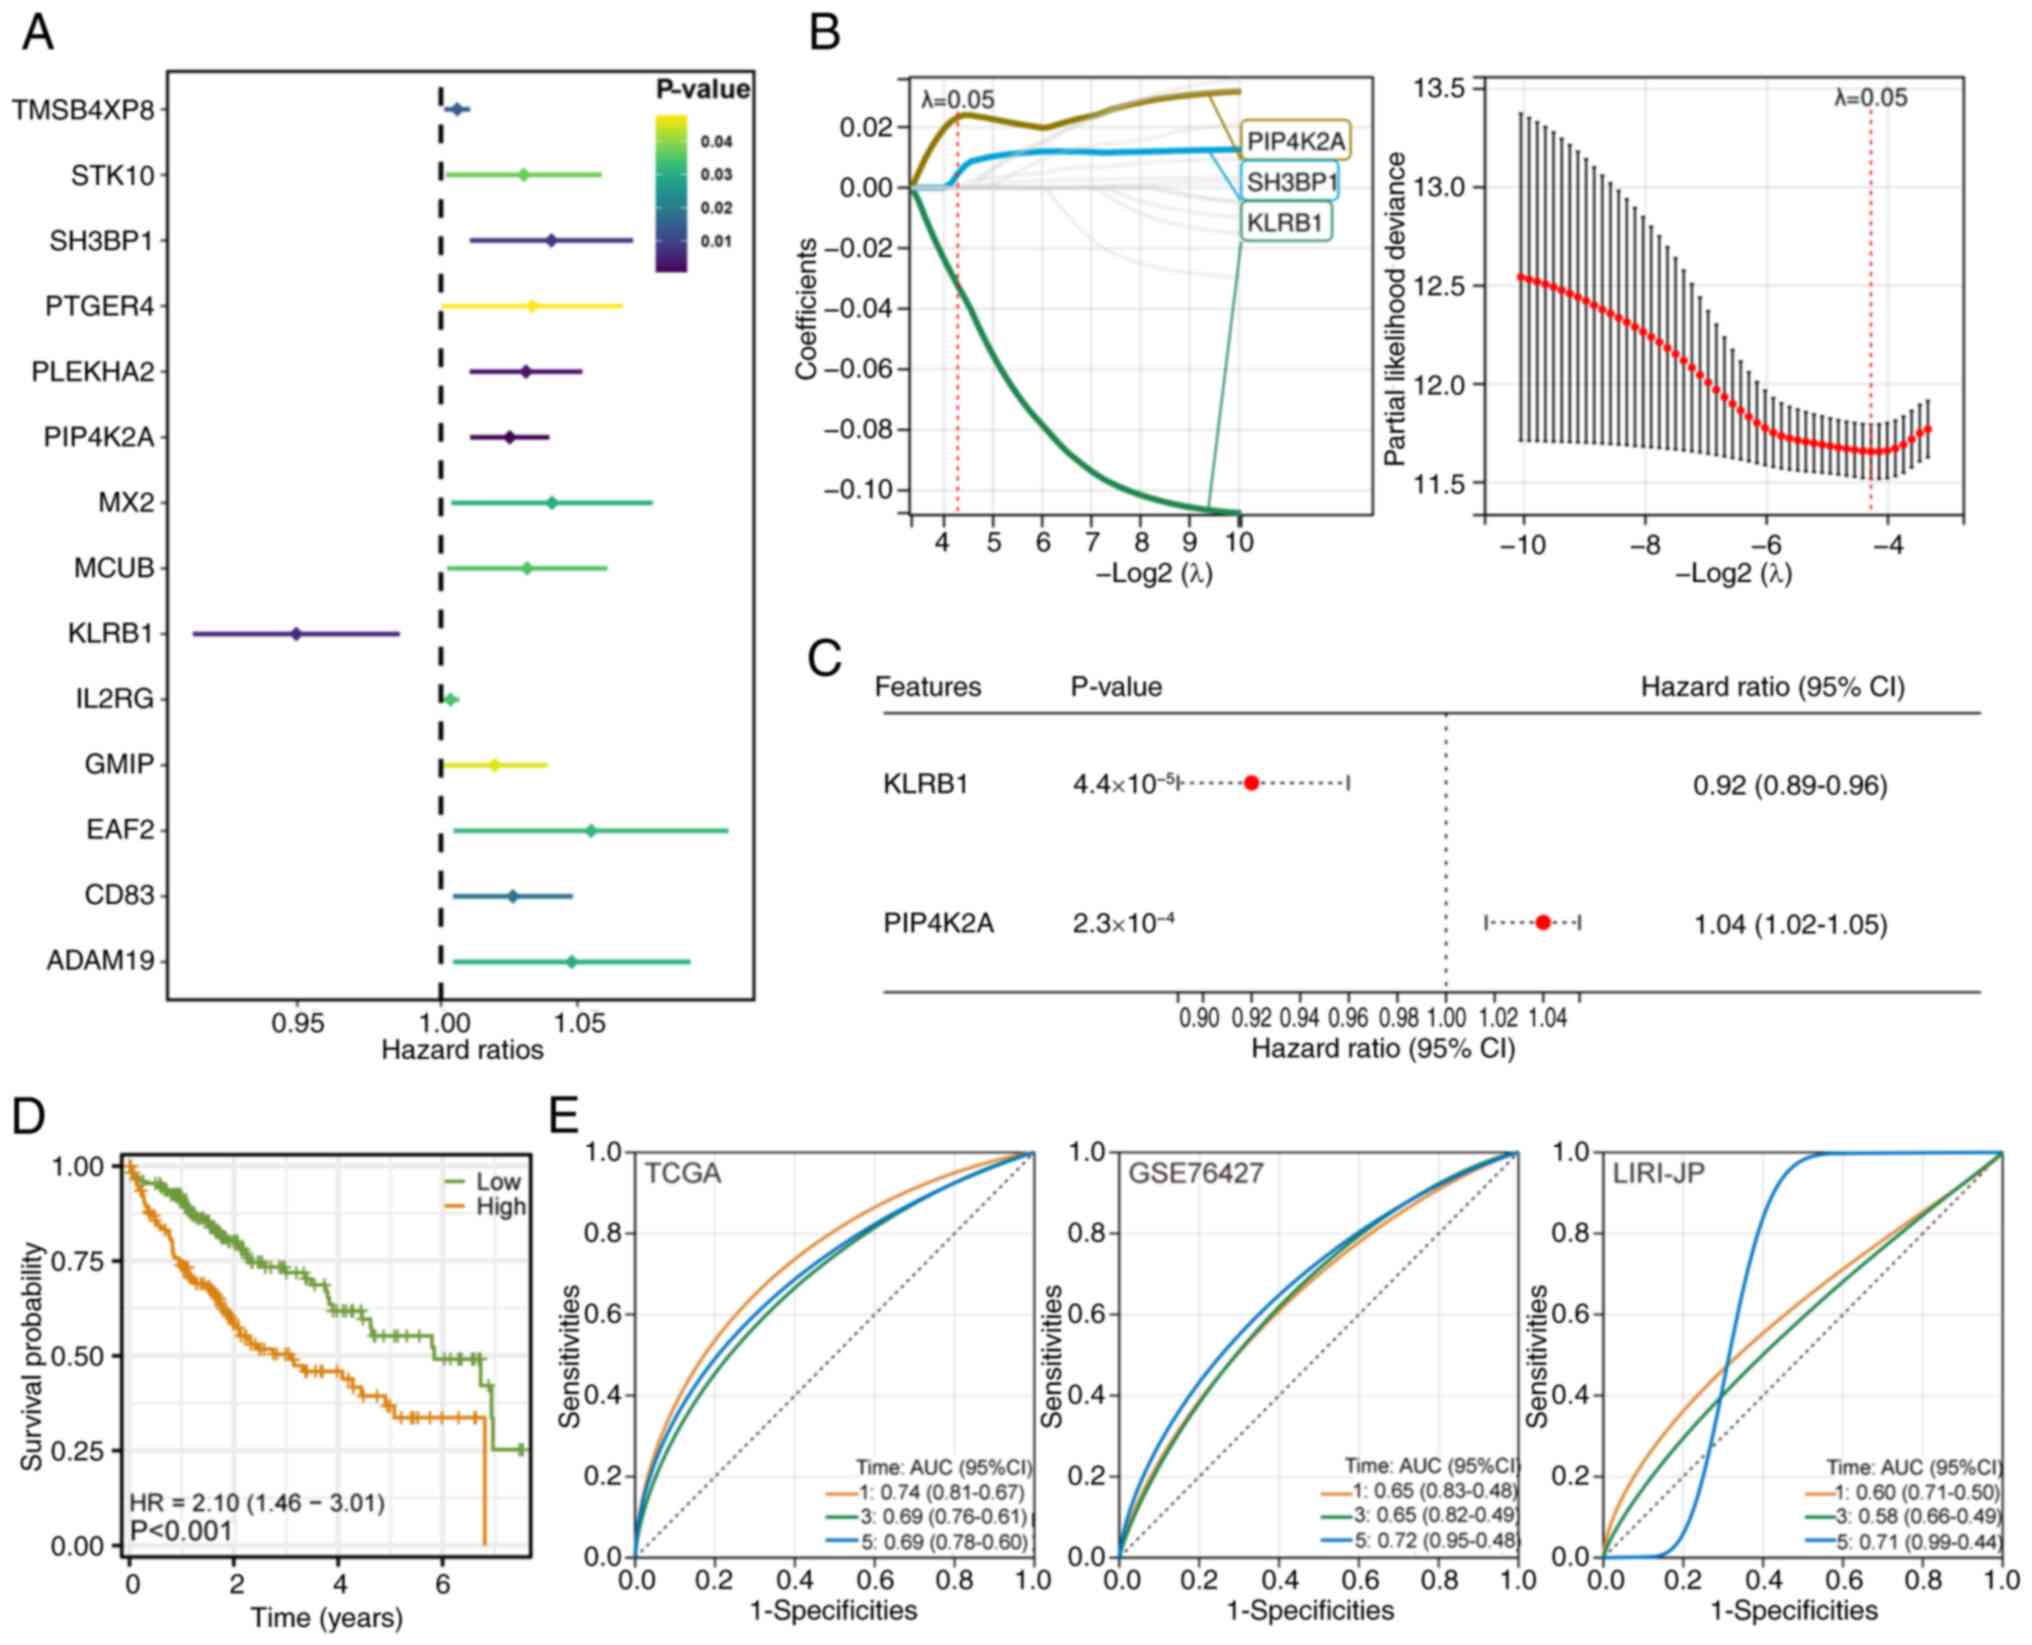 | Figure 3.Development and validation of the M2
macrophage-related prognostic model. (A) Univariate Cox regression
analysis identified 14 genes with significant prognostic value
(P<0.05) in patients with LIHC. (B) Least Absolute Shrinkage and
Selection Operator-Cox regression was applied to refine the gene
set, selecting three key genes based on a λ value of 0.0514
(10-fold cross-validation). (C) Multivariate Cox regression
confirmed the independent prognostic significance of the two
selected genes. A prognostic risk score model was constructed using
the following formula: RiskScore = PIP4K2A × 1.0165 + KLRB1 ×
0.8897. (D) Kaplan-Meier survival curves comparing two risk groups
in the TCGA-LIHC cohort. A significant difference in overall
survival was observed between the groups. (E) Time-dependent
receiver operating characteristic curve analysis of the prognostic
risk score model, showing certain predictive performance across
three independent cohorts: TCGA-LIHC, GSE76427 (Gene Expression
Omnibus) and LIRI-JP (International Cancer Genome Consortium).
LIHC, liver hepatocellular carcinoma; TCGA, The Cancer Genome
Atlas; PIP4K2A, phosphatidylinositol-5-phosphate 4-kinase type 2α;
SH3BP1, SH3 domain binding protein 1; KLRB1, killer cell lectin
like receptor B1; AUC, area under the curve; TMSB4XP8, TMSB4X
pseudogene 8; STK10, serine/threonine kinase 10; PTGER4,
prostaglandin E receptor 4; PLEKHA2, pleckstrin homology domain
containing A2; MX2, MX dynamin like GTPase 2; MCUB, mitochondrial
calcium uniporter dominant negative subunit β; IL2RG, IL2 receptor
subunit γ; GMIP, GEM interacting protein; EAF2, ELL associated
factor 2; ADAM19, ADAM metallopeptidase domain 19; HR, hazard
ratio. |
Differential pathway and functional
enrichment between the two risk groups
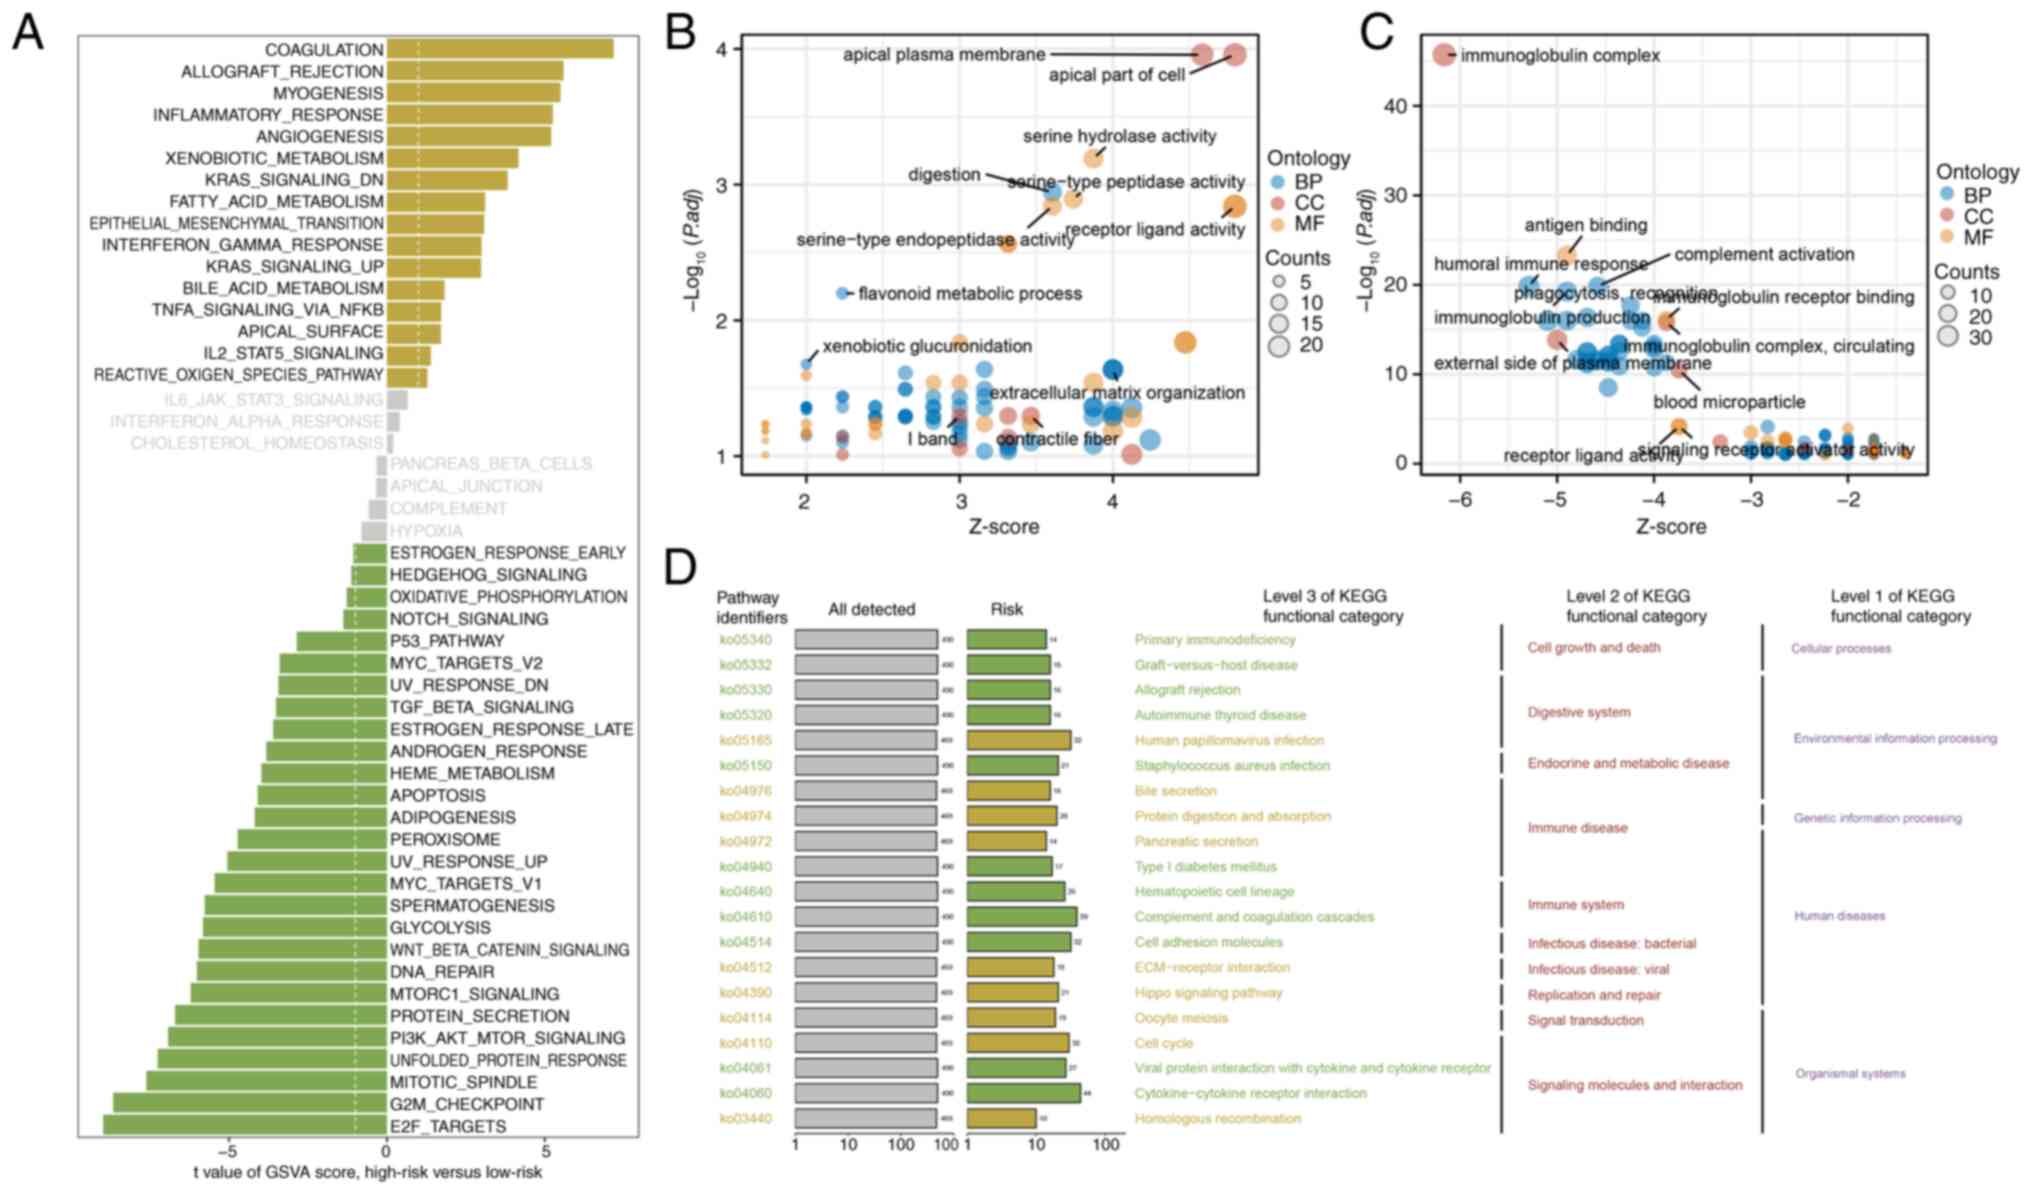
GSVA of the hallmark gene sets revealed distinct
differences in pathway activation between the two risk groups. The
high-risk group exhibited upregulation of pathways associated with
coagulation, allograft rejection and myogenesis, thus suggesting an
active inflammatory and tissue remodeling environment. By contrast,
the low-risk group exhibited increased activity in pathways
involved in cell cycle regulation, including ‘E2F_TARGETS’,
‘G2M_CHECKPOINT’ and ‘MITOTIC_SPINDLE’, thereby indicating
increased cell proliferation and division (Fig. 4A). GO enrichment analysis further
highlighted functional differences between the groups. The
high-risk group was significantly enriched for pathways associated
with cellular polarity and membrane organization, including the
‘apical plasma membrane’ and ‘apical part of the cell’ (Fig. 4B). Conversely, the low-risk group
was enriched in immune-related pathways, particularly those
associated with immunoglobulin antigen binding, thus reflecting an
active immune response (Fig. 4C).
KEGG pathway analysis also revealed several signaling pathways,
such as ‘Primary immunodeficiency’, ‘Graft-versus-host disease’ and
‘Hippo signaling pathway’, that were differentially enriched
between the two risk groups. The KEGG pathways with similar
biological functions were further categorized to highlight shared
themes across the risk groups (Fig.
4D).
Immunotherapy prediction analysis
based on the TIDE and Submap algorithms
A strong negative correlation was observed between
the risk score and all three ESTIMATE scores (immune, stromal and
overall ESTIMATE scores), thereby indicating that higher scores
were associated with lower levels of immune and stromal cell
infiltration (Fig. 5A). By
contrast, no significant correlation was observed between the risk
score and the TMB, thereby suggesting that the TMB is not a major
factor influencing risk stratification in the present cohort
(Fig. 5B). Subsequently,
differential expression analysis of common inhibitory immune
checkpoint genes was performed. The results revealed that most
inhibitory checkpoint genes (including IL2, CD40 ligand and CD70)
were significantly differentially expressed, with higher expression
levels being observed in the high-risk group (Fig. 5C). Conversely, the expression of
stimulatory immune checkpoint genes did not significantly differ
between the two groups (Fig. 5D).
TIDE analysis revealed that low-risk patients exhibited
significantly lower TIDE and dysfunction scores, thus indicating a
potentially stronger immune response and a lower risk of immune
escape. The exclusion score of low-risk patients was significantly
higher, which was inconsistent with the overall prediction result.
This may be due to reasons such as sample differences. Due to
sample differences and other reasons, dysfunction and exclusion
alone may not be able to make good predictions. Therefore, the TIDE
total score, which combined the scores of dysfunction and
exclusion, was usually adopted as the final prediction result of
the TIDE analysis. (Fig. 5E).
Finally, Submap analysis revealed that patients in the low-risk
group were more likely to respond favorably to ICB therapy, thereby
further suggesting that the low-risk group demonstrates greater
potential for immunotherapy responsiveness (Fig. 5F).
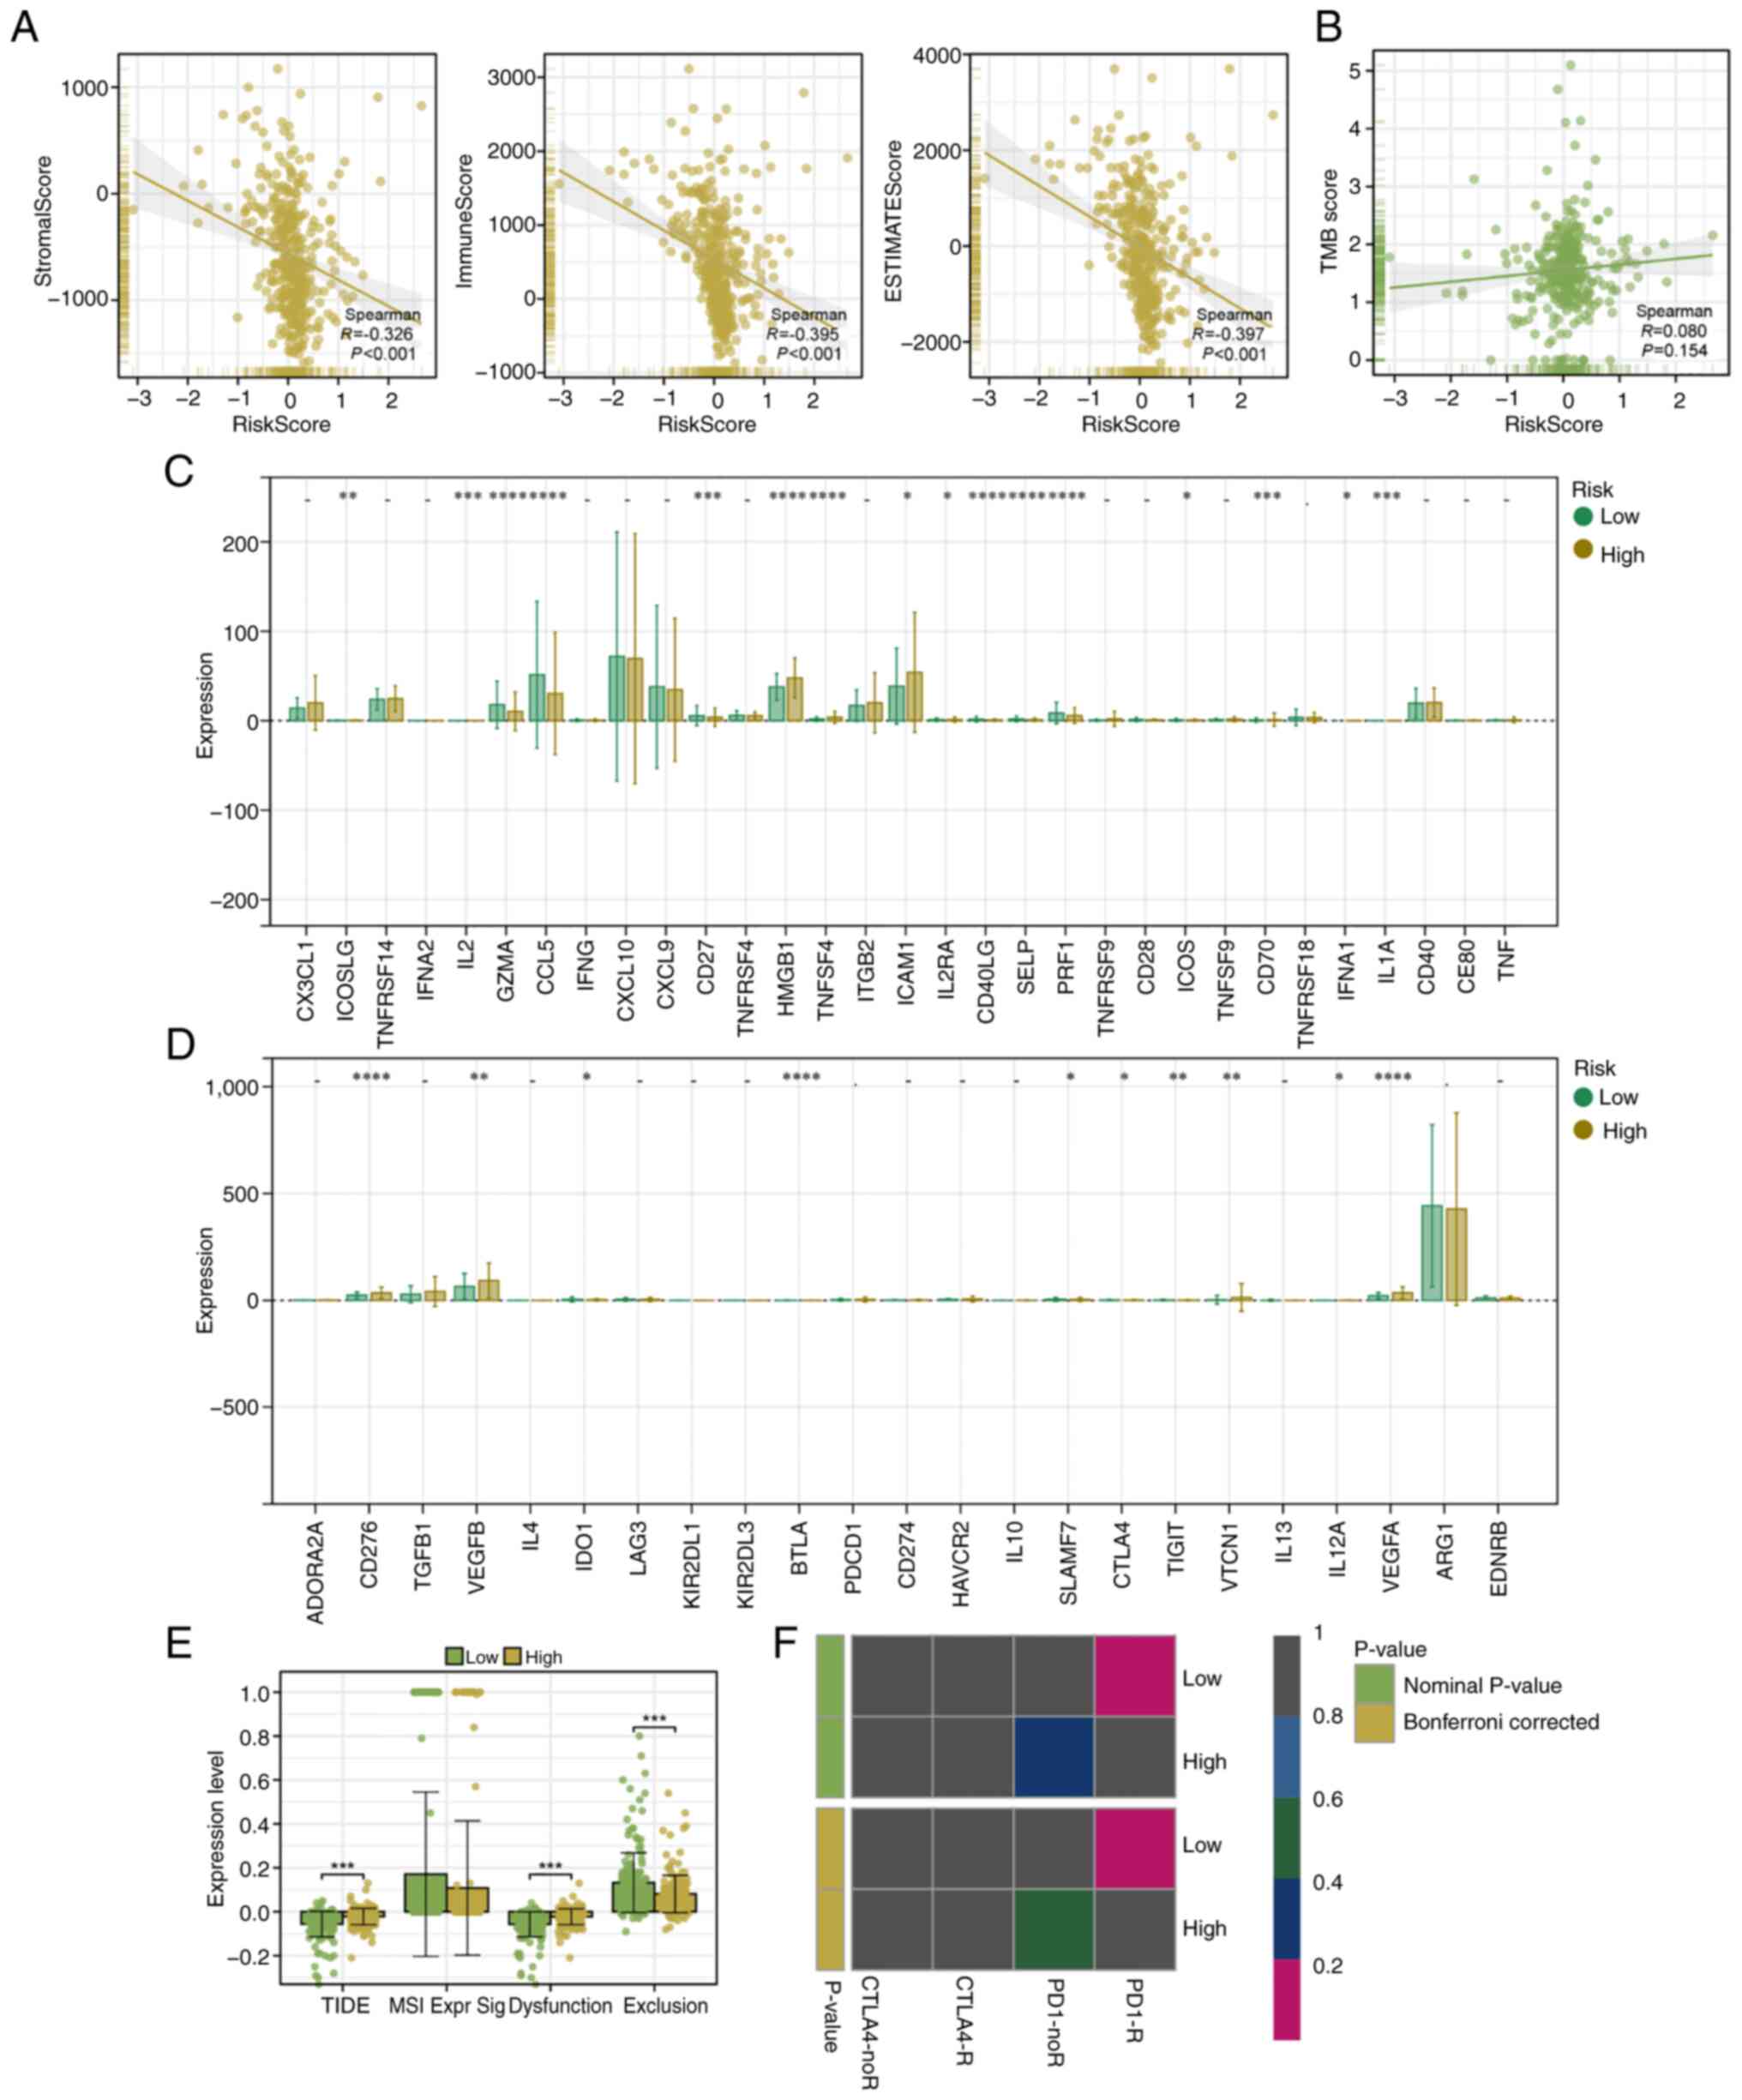 | Figure 5.Immune infiltration, TMB, immune
checkpoint expression and immunotherapy response in two risk
groups. (A) Correlation between the prognostic risk score and the
immune, stromal and ESTIMATE scores, calculated using the ESTIMATE
algorithm. (B) Correlation analysis between the risk score and TMB
showed no significant association. (C) Differential expression
analysis of inhibitory immune checkpoint genes revealed significant
differences between two risk groups. (D) Differential expression of
stimulatory immune checkpoint genes showed no significant
differences between the two groups. (E) TIDE analysis demonstrated
that low-risk patients had significantly lower TIDE scores,
suggesting they have an improved immune response and a reduced
potential for immune escape. (F) SubMap analysis predicted that
low-risk patients are more likely to respond to immune checkpoint
blockade therapy, highlighting their greater potential for
benefiting from immunotherapy. PD1-R indicates a response to PD1
treatment, while PD1-noR indicates no response to PD1 treatment.
CTLA4-R indicates a response to CTLA4 treatment, while CTLA4-noR
indicates no response to CTLA4 treatment. *P<0.05; **P<0.01;
***P<0.001; ****P<0.0001; t-test based P-value. TMB, tumor
mutational burden; TIDE, Tumor Immune Dysfunction and Exclusion;
PD1, programmed cell death protein 1; CTLA4, cytotoxic T-lymphocyte
associated protein 4. |
Expression and ligand-receptor
interactions of KLRB1 in single-cell datasets
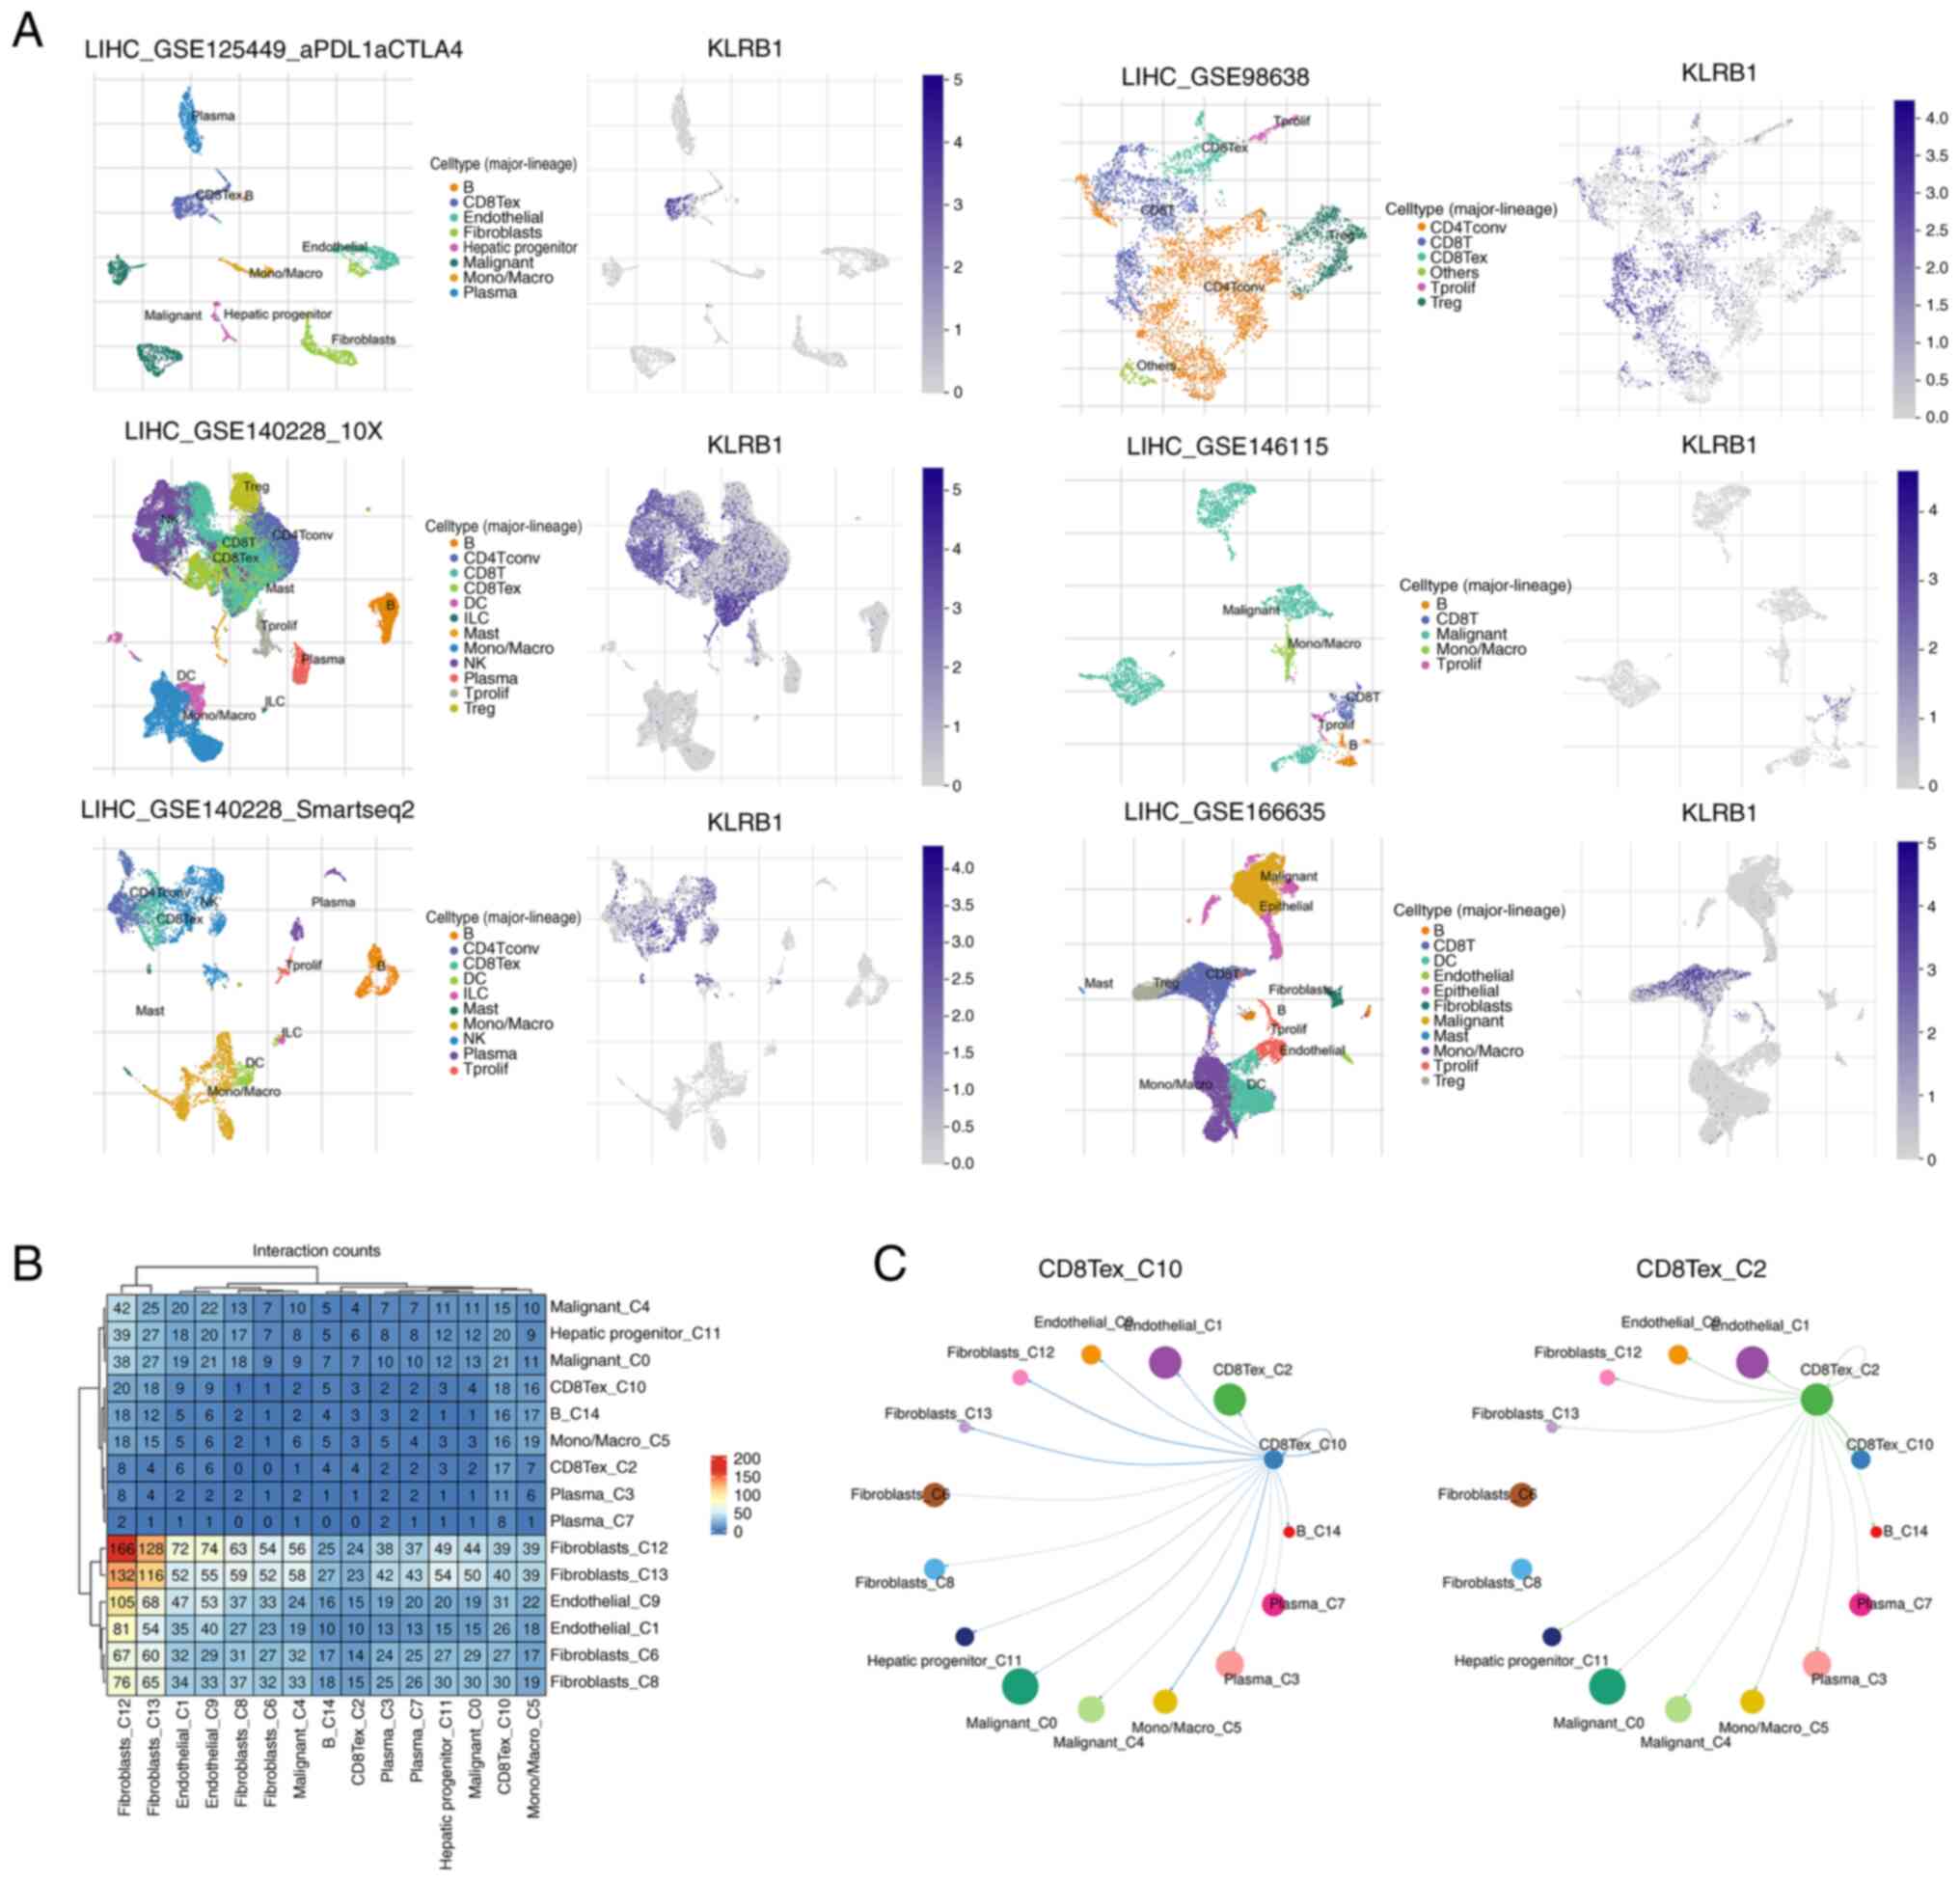
To understand the role of KLRB1 in immune cell
populations, its expression was analyzed in six distinct
single-cell datasets from the TISCH2 database. KLRB1 was observed
to be predominantly expressed in CD8+ T cells,
CD8+ Tex and NK cells, thus indicating its potential
involvement in immune regulation and response within these cell
types (Fig. 6A). The heatmap
displays strong ligand-receptor interactions between various immune
cell types, with notable interaction intensities being observed
between CD8+ T cells and other immune populations
(Fig. 6B). Finally, the network
diagram depicts the dynamic interactions between CD8+ T
cells and surrounding cell populations, thus highlighting the
strength and activity of these interactions. The analysis
demonstrated that CD8+ T cells exhibit significant
signaling crosstalk with other immune cell populations (Fig. 6C).
Expression and prognostic importance
of KLRB1
KLRB1 expression was first assessed in multiple
cancer types using TCGA pan-cancer data. KLRB1 was observed to be
significantly differentially expressed in a majority of cancer
types, including LIHC, thereby highlighting its relevance in tumor
biology (Fig. 7A). Prognostic
analysis revealed that KLRB1 expression was associated with
favorable outcomes (including DFI, DSS, OS and PFI) in most cancer
types (Fig. 7B). Furthermore, high
expression of KLRB1 was found to be closely related to poor OS
(Fig. 7C). The LIHC samples were
then stratified into high- and low-KLRB1 expression groups. GSEA of
these groups revealed significant enrichment of specific biological
pathways such as wnt-β-catenin signaling, TGF-β signaling and
PI3K-AKT-mTOR signaling in both the high- and low-expression
groups, thus suggesting that KLRB1 may serve a key role in
regulating various tumor-related processes (Fig. 7D).
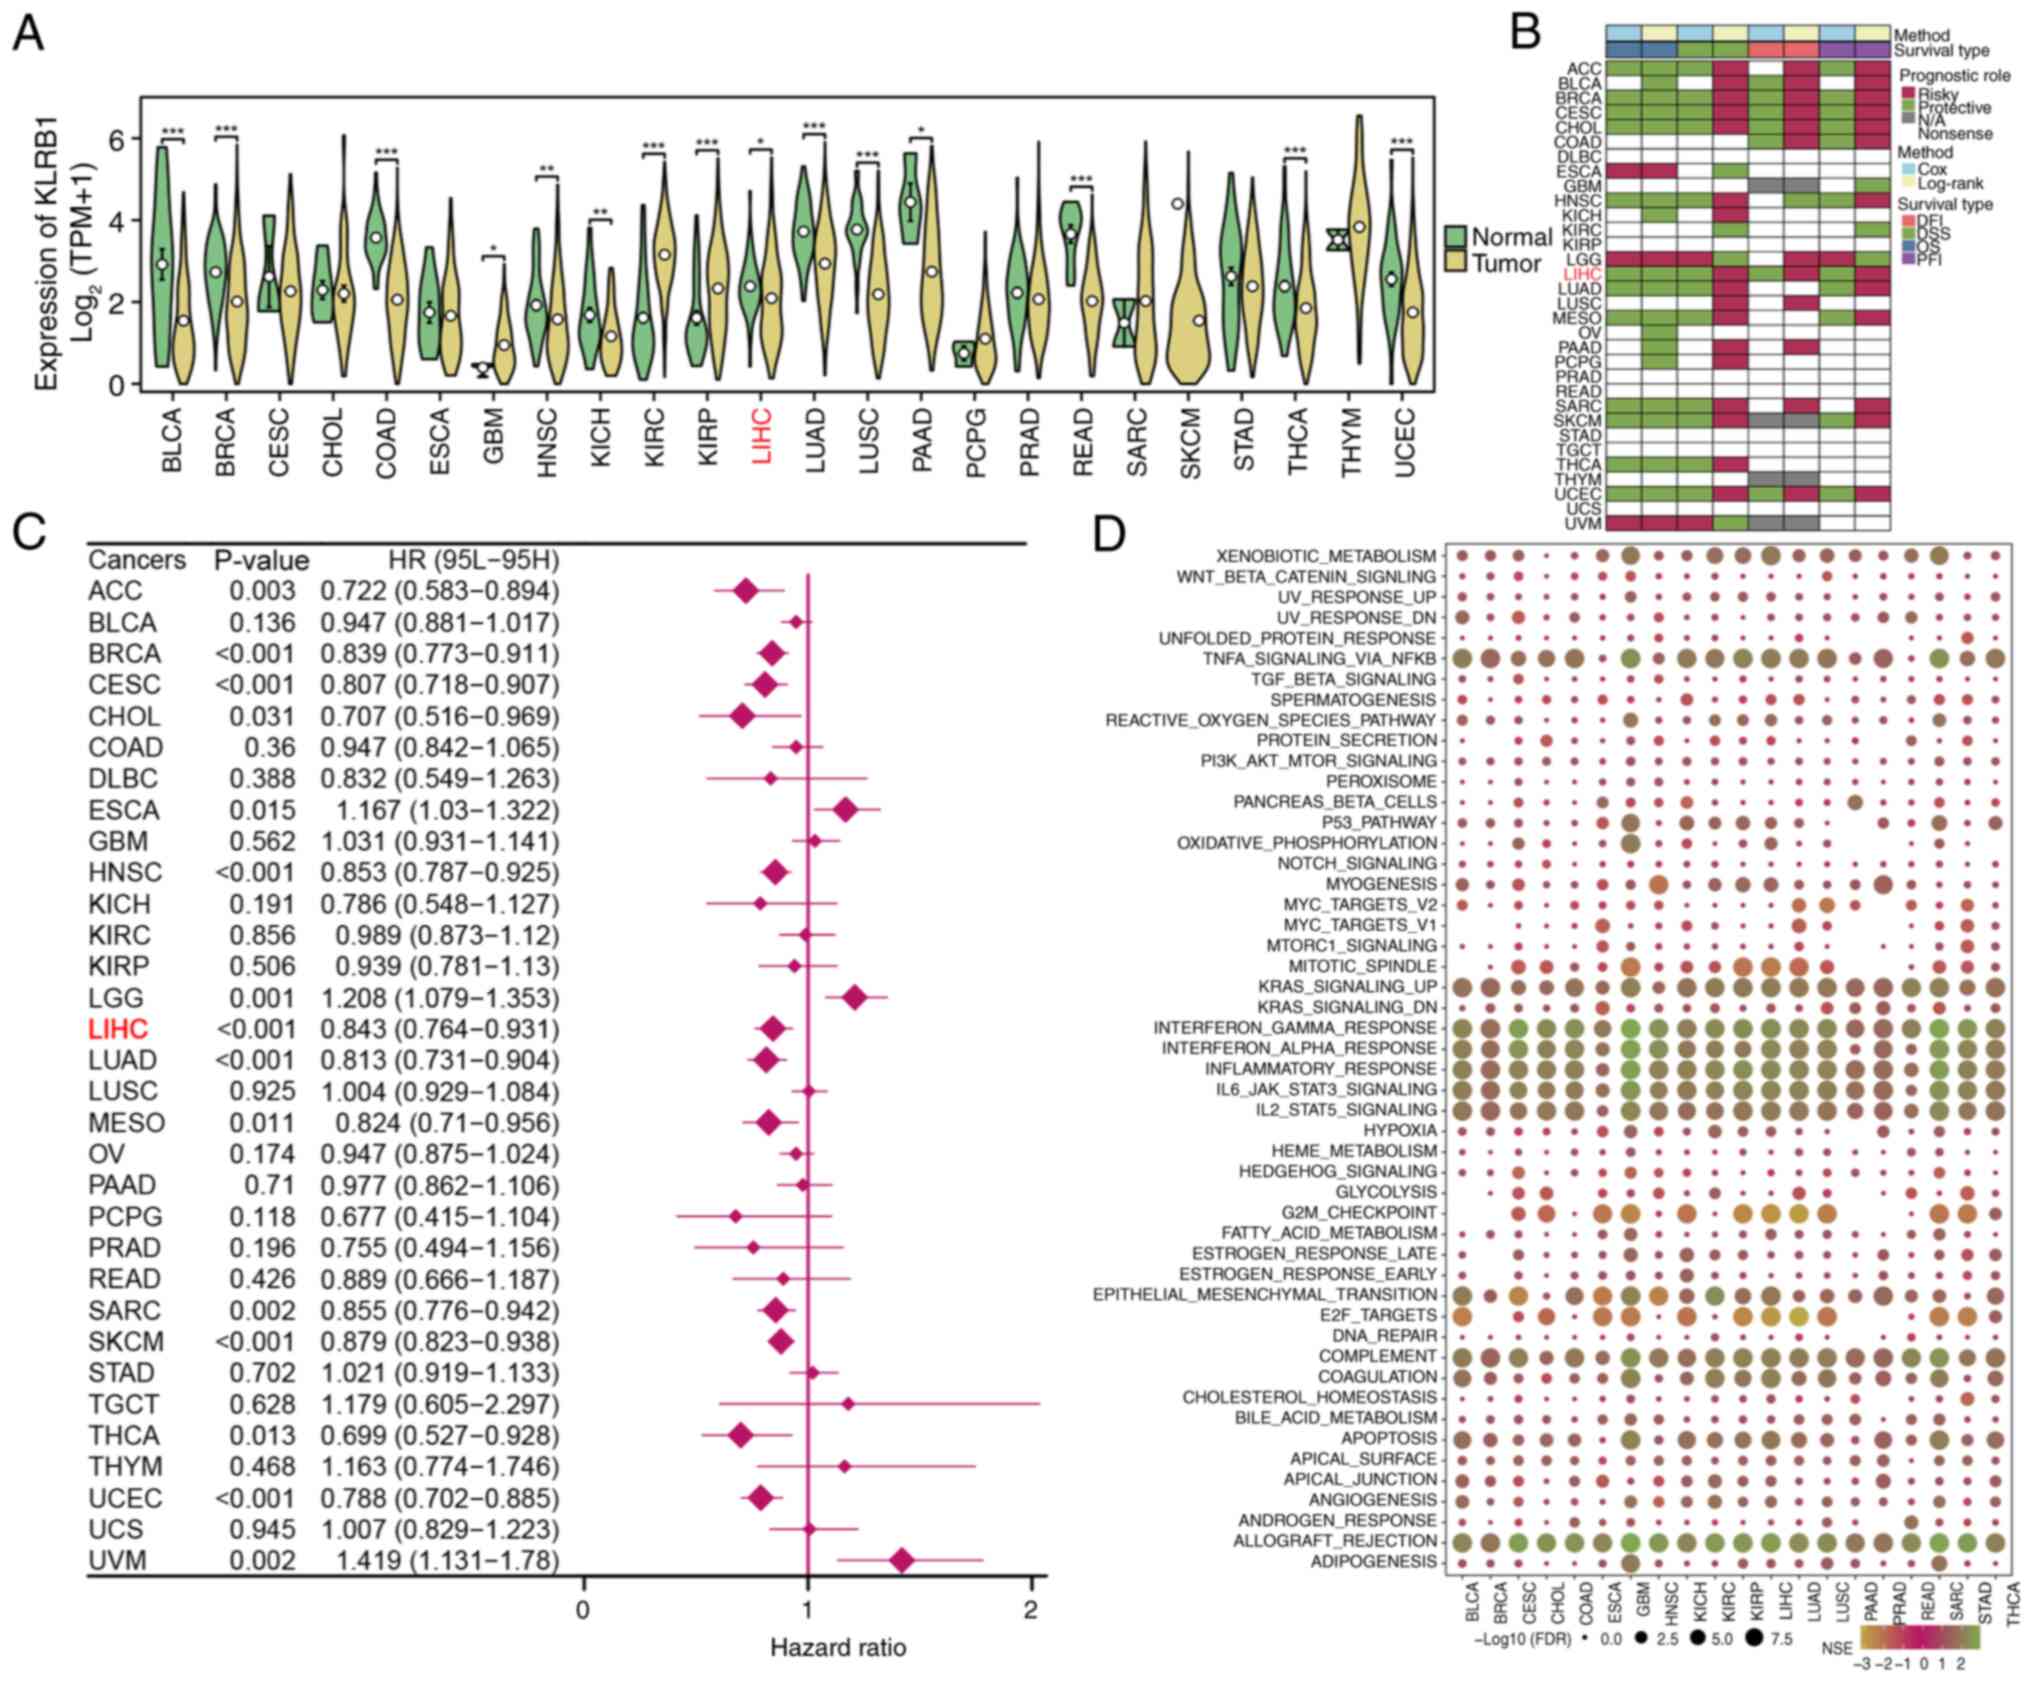 | Figure 7.Pan-cancer analysis of KLRB1
expression and prognostic impact. (A) Expression of KLRB1 across
multiple cancer types in The Cancer Genome Atlas. Significant
differences in KLRB1 expression were observed in several cancer
types, including LIHC. (B) Prognostic analysis of KLRB1 expression
in pan-cancer datasets, including DFI, DSS, OS and PFI. (C) Forest
plot analysis of OS based on KLRB1 expression in pan-cancer. (D)
Gene Set Enrichment Analysis revealed significant biological
pathways enriched in both high- and low-expression groups,
suggesting that KLRB1 may regulate important tumor-related
processes. *P<0.05; **P<0.01; ***P<0.001; t-test based
P-value. KLRB1, killer cell lectin like receptor B1; LIHC, liver
hepatocellular carcinoma; DFI, disease-free interval; DSS,
disease-specific survival; OS, overall survival; PFI, platinum-free
interval; FDR, false discovery rate; NES, normalized enrichment
score; ACC, adrenocortical carcinoma; BLCA, bladder cancer; BRCA,
breast invasive carcinoma; CESC, cervical squamous cell carcinoma;
CHOL, cholangiocarcinoma; COAD, colon adenocarcinoma; DLBC, diffuse
large B-cell lymphoma; ESCA, esophageal carcinoma; GBM,
glioblastoma multiforme; HNSC, head and neck squamous cell
carcinoma; KICH, kidney chromophobe; KIRC, kidney clear cell
carcinoma; KIRP, kidney renal papillary cell carcinoma; LGG, brain
lower grade glioma; LIHC, liver hepatocellular carcinoma; LUAD,
lung adenocarcinoma; LUSC, lung squamous cell carcinoma; MESO,
mesothelioma; OV, ovarian serous cystadenocarcinoma; PAAD,
pancreatic adenocarcinoma; PCPG, pheochromocytoma and
paraganglioma; PRAD, prostate adenocarcinoma; READ, rectum
adenocarcinoma; SARC, sarcoma; SKCM, skin cutaneous melanoma; STAD,
stomach adenocarcinoma; TGCT, testicular germ cell tumor; THCA,
thyroid carcinoma; THYM, thymoma; UCEC, uterine corpus endometrioid
carcinoma; UCS, uterine carcinosarcoma; UVM, uveal melanoma. |
Regulation of tumors by KLRB1 and its
associated secretory factors on macrophage polarization
qPCR was used to assess the mRNA levels of KLRB1 in
HuH-7 and HuH-1 cells. The results revealed that KLRB1 expression
was higher in HuH-7 cells compared with HuH-1 cells (Fig. 8A). To knock down KLRB1 in HuH-7
cells (sh-KLRB1-2), shRNA was used and the knockdown cell line was
selected using puromycin. For stable overexpression of KLRB1 in
HuH-1 cells (OE-KLRB1), lentiviral vectors were used, followed by
puromycin selection to generate stable overexpression cell lines
(Fig. 8B). To evaluate the impact
of KLRB1 on tumor cell proliferation, CCK-8 assays were performed.
The results demonstrated that KLRB1 knockdown significantly
increased cell proliferation compared with the control group,
whereas overexpression significantly decreased cell proliferation
(Fig. 8C). Transwell assays were
performed to assess the effect of KLRB1 on cell migration. KLRB1
knockdown enhanced cell migration, whereas KLRB1 overexpression
reduced migration (Fig. 8D and E).
Additionally, the influence of KLRB1 on cell apoptosis was
examined. The flow cytometry results indicated that KLRB1 knockdown
inhibited apoptosis, whereas KLRB1 overexpression promoted
apoptosis (Fig. 8F). And through WB
experiments, it was found that knocking out KLRB1 could
significantly inhibit the expression of Bax and c-caspase-3, and
enhance the expression of Bcl-2 and caspase-3, while overexpression
achieved the opposite result (Fig.
S1). Furthermore, the tube formation assay demonstrated that,
compared with the controls, the culture supernatant from KLRB1
knockdown cells increased the tube forming ability of HUVECs,
whereas the supernatant from KLRB1-overexpressing cells reduced the
tube forming ability of HUVECs (Fig.
8G).
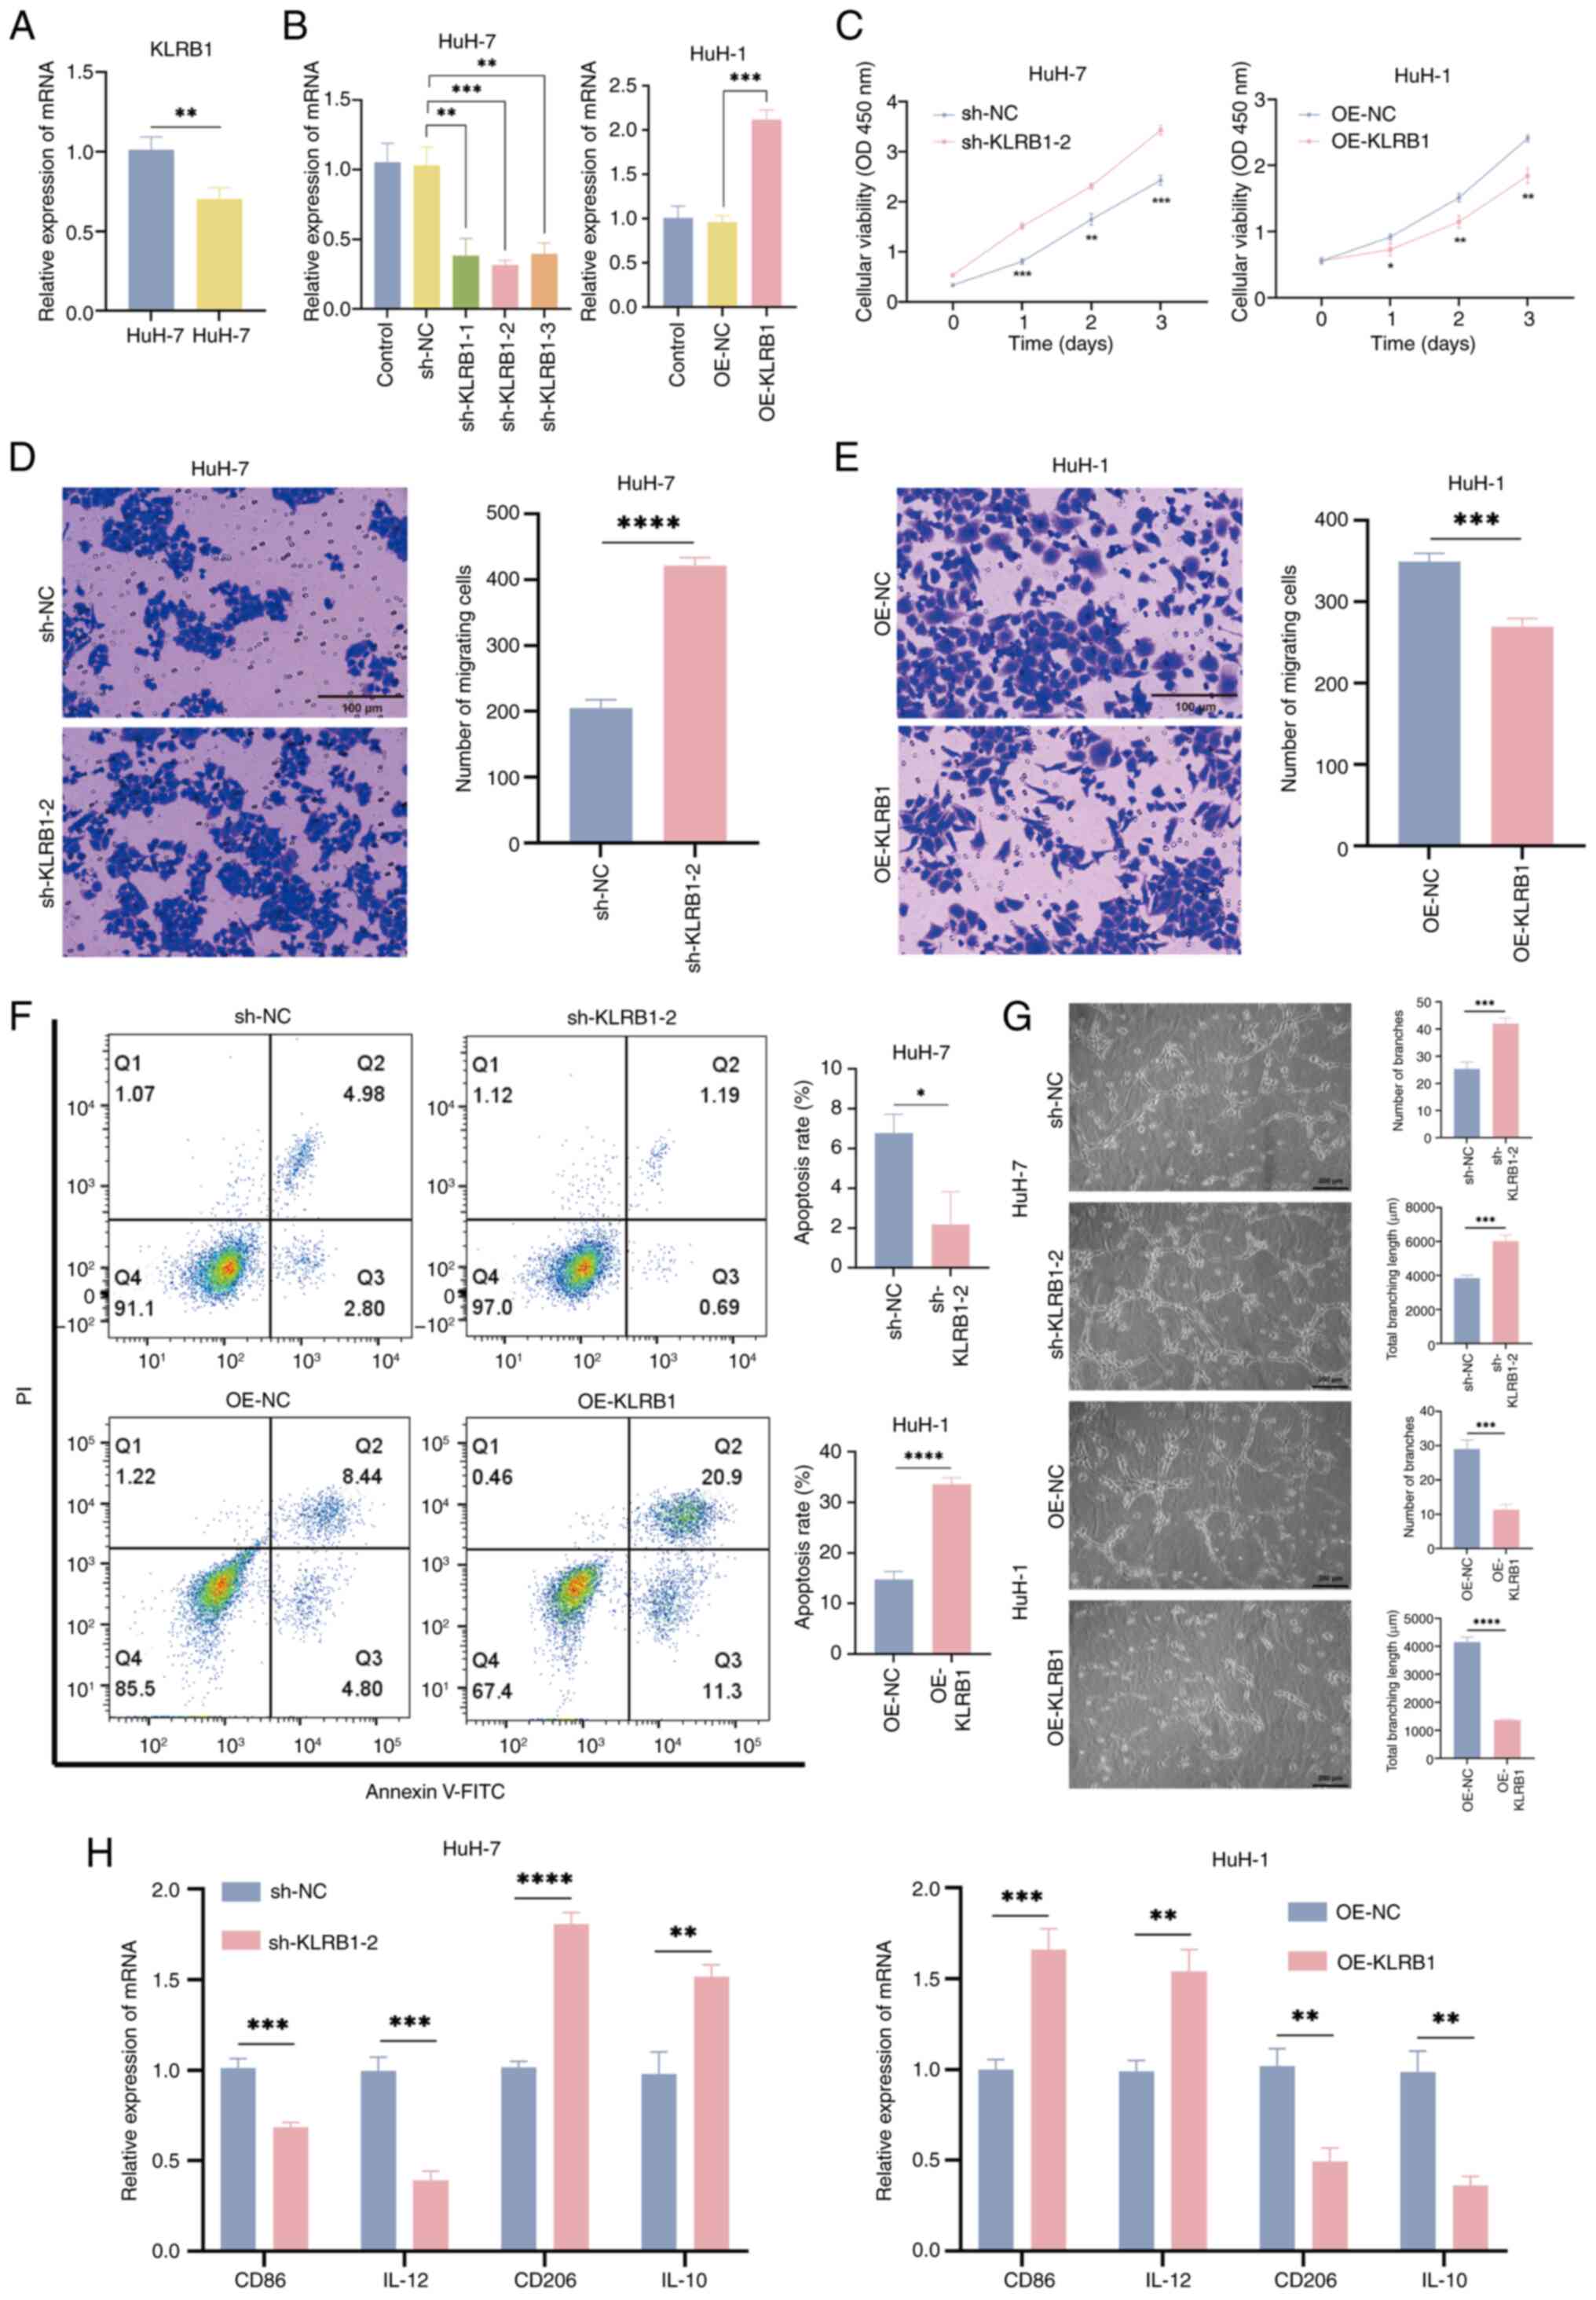 | Figure 8.KLRB1 regulates the activity of LIHC
cells and its influence on macrophages through LIHC cells. (A) qPCR
detection of KLRB1 expression in HuH-7 and HuH-1 cells. (B)
Validation of shRNA knockdown KLRB1 in the HuH-7 cell line and
lentivirus overexpression of KLRB1 in the HuH-1 cell line. (C) Cell
proliferation curve of sh-KLRB1-2 and OE-KLRB1. Cell migration
assay of (D) sh-KLRB1-2 and (E) OE-KLRB1 cells (scale bars, 100
µm). (F) Annexin V-FITC/PI assessed apoptosis in sh-KLRB1-2 and
OE-KLRB1 transfected cells. (G) Tube formation assay of HUVECs
treated with sh-KLRB1-2 and OE-KLRB1 cell conditioned media (scale
bar, 200 µm). (H) qPCR detection of polarization markers in M0 to
M1/M2 cells, treated with sh-KLRB1-2 or OE-KLRB1 cell conditioned
media. *P<0.05; **P<0.01; ***P<0.001; ****P<0.0001;
t-test based P-value. LIHC, liver hepatocellular carcinoma; PI,
propidium iodide qPCR, quantitative PCR; KLRB1, killer cell lectin
like receptor B1; sh, short hairpin; OE, overexpression; NC,
negative control; OD, optical density. |
To investigate how KLRB1 affects the secretion of
tumor cell-derived factors involved in macrophage polarization,
culture supernatants were collected from KLRB1-knockdown and
KLRB1-overexpressing cells and incubated with THP-1 cell-derived M0
macrophages. The polarization status of M1 and M2 macrophages was
then assessed using qPCR. The results demonstrated that KLRB1
knockdown culture supernatant increased the expression of M2
markers CD206 and IL-10, whereas KLRB1-overexpressing cell culture
supernatant reduced the expression of CD206 and IL-10. By contrast,
the M1 markers CD86 and IL-12 were downregulated following KLRB1
knockdown culture supernatant treatment and upregulated after
overexpression supernatant treatment (Fig. 8H). These findings suggest that KLRB1
may inhibit the polarization of M0 macrophages towards the M2
phenotype. In summary, the upregulation of KLRB1 inhibits the
activity of LIHC cells and facilitates the polarization of
macrophages from the M0 phenotype to the M1 phenotype through
changes in the cell secretome.
Discussion
LIHC is one of the most prevalent and fatal
malignancies worldwide, with a poor prognosis being observed,
primarily due to late-stage diagnoses, high recurrence rates and
resistance to conventional treatments (29). The TME serves a crucial role in the
progression of LIHC, with macrophages (particularly M2 macrophages)
being key contributors to tumor growth, metastasis and immune
evasion (30). M2 macrophages are
characterized by their immunosuppressive properties, which promote
tumor progression through the cells, thereby fostering immune
escape (31). Additionally, M2
macrophages facilitate angiogenesis and ECM remodeling, thus
further enhancing the pro-tumorigenic environment in LIHC (32). Previous advances in bioinformatics
have enabled the integration of large-scale genomic data, thus
allowing for the identification of key molecular signatures
associated with immune infiltration and tumor progression (33,34).
Using techniques such as WGCNA, researchers have identified M2
macrophage-related genes as potential biomarkers for prognosis in
LIHC (35). Given the pivotal role
of M2 macrophages in modulating the TME and influencing immune
responses, a deeper understanding of their gene expression profiles
could offer novel insights into prognostic prediction and
therapeutic strategies for LIHC.
In the present study, M2 macrophage-related genes
that serve significant roles in the prognosis of LIHC were
identified. Using bioinformatics analyses, a prognostic risk model
was constructed based on these genes, which demonstrated promising
predictive power in both the training and external validation
datasets. These findings reinforce the growing body of evidence
suggesting that M2 macrophages are key players in the TME of LIHC
and contribute to tumor progression (9,36).
However, unlike some studies that have established associations
between high M2 macrophage infiltration and poor clinical outcomes,
the present results focused on the identification of gene
expression patterns associated with M2 macrophages that may provide
more reliable prognostic information for patients with LIHC.
Although increased infiltration of M2 macrophages
has been associated with poor prognoses in various cancers, the
present study did not identify direct correlations between M2
macrophage infiltration and various clinical outcomes (such as OS
or progression-free survival) in patients with LIHC. This
discrepancy may be due to the complex nature of the liver TME,
where multiple factors, including hepatic fibrosis, viral
infections and cirrhosis, contribute to disease progression beyond
macrophage infiltration. Therefore, although M2 macrophage-related
genes demonstrate potential as biomarkers for predicting disease
progression, additional studies are necessary to elucidate the
precise mechanisms through which M2 macrophages influence the
clinical course of LIHC.
Notably, the present study suggests that M2
macrophages may influence the efficacy of immunotherapies in LIHC.
Although immune checkpoint inhibitors have demonstrated promising
results in various cancers, their effectiveness in LIHC is often
hindered by the immunosuppressive TME, which is partly shaped by M2
macrophages (37). The analysis
revealed that the preoperative risk model, which was constructed
based on M2 macrophage-related genes, was associated with improved
immune responses and improved outcomes in the low-risk group.
Therefore, the targeting of M2 macrophages or their associated
signaling pathways may provide a promising strategy to increase the
effectiveness of immunotherapy in LIHC, particularly in low-risk
patients who are identified using this model.
Although M2 macrophages serve a critical role in the
TME and have been associated with poor prognoses in various
cancers, the present study identified KLRB1 as an important factor
in LIHC. KLRB1 is primarily expressed on NK cells and certain
T-cell subsets and has been implicated in immune regulation and
tumor immune surveillance (38). In
LIHC, KLRB1 may influence the tumor immune landscape by modulating
immune cell interactions, thereby potentially affecting tumor
progression and patient outcomes. The findings suggest that KLRB1
expression may serve a protective role in LIHC, as higher levels of
this gene were observed to be associated with improved survival
outcomes. This result indicates the involvement of KLRB1 in
promoting antitumor immune responses. However, the precise
mechanisms through which KLRB1 modulates tumor progression and
immune evasion in LIHC remain to be fully elucidated. Based on the
present research findings, it may be speculated that KLRB1 may
promote the progression of LIHC disease by regulating the polarity
transformation of macrophages. Therefore, the targeting of KLRB1 or
its associated signaling pathways may represent a promising
therapeutic approach to improve patient prognosis and enhance the
efficacy of immunotherapies in LIHC.
KLRB1 serves a crucial role in tumor regulation,
with previous studies involving LIHC and lung adenocarcinoma (LUAD)
highlighting its complex dual function. The expression levels and
functions of KLRB1 vary markedly across different tumor types. For
instance, in breast cancer and LUAD, low expression of KLRB1 is
typically associated with poor prognosis, and its functions involve
immune regulation, cell proliferation and migration (39). Similarly, in other cancer types, low
expression of KLRB1 is generally associated with poor survival
outcomes. In conclusion, the present study provides strong evidence
that KLRB1 serves a multifaceted role in regulating both tumor cell
behavior and macrophage polarization. The upregulation of KLRB1
appears to inhibit the proliferation and migration of LIHC cells,
promote apoptosis and facilitate the polarization of macrophages
towards the M1 phenotype. As KLRB1 is a membrane protein, the
conditioned media may also contain exosomes or microvesicles
secreted by the KLRB1 knockdown or OE cells. These vesicles can
carry not only proteins and lipids but also mRNA and miRNA that can
have an impact on recipient cells, including macrophages. For
instance, specific miRNAs may influence macrophage gene expression
related to polarization. Furthermore, changes in KLRB1 expression
can alter the metabolic state of the transfected cells, which in
turn could affect the composition of metabolites and extracellular
vesicles released into the conditioned media. This is typically
more effective in combating tumors. These findings highlight the
potential of KLRB1 as a therapeutic target in LIHC and emphasize
the importance of understanding the complex interactions between
immune cells and cancer cells in the development of novel cancer
treatments.
Despite the promising results associated with the M2
macrophage-related prognostic signature, several limitations must
be acknowledged in the current study. Firstly, the research
primarily relied on data retrieved from public databases, which
often contain relatively small sample sizes and may not be promptly
updated. In addition, the focal point of the investigation involved
M2 macrophage-related genes; however, the specific molecular
mechanisms by which these genes regulate the progression of LIHC
necessitate further in-depth explorations. Consequently, the
interpretation of the results presented requires additional
validation and enhancement. Furthermore, the prognostic signature
was predominantly verified using public datasets, which may harbor
intrinsic biases and do not provide clinical validation within
independent, real-world patient cohorts. Secondly, although
analyses of immune-cell infiltration and predictions regarding
immunotherapy offer valuable insights, the exact mechanisms linking
M2 macrophage-related genes to immune responses in LIHC remain
inadequately understood and warrant additional experimental
investigations. Furthermore, the present study suggested that KLRB1
may serve a role in modulating immune responses and facilitating
the progression of LIHC. A thorough review of the literature
regarding KLRB1 indicates that this gene represents a novel
therapeutic target; however, the molecular mechanisms through which
KLRB1 regulates LIHC remain largely unexplored and should be
further investigated. Additionally, the present research did not
evaluate potential interactions between other key genes and
molecular pathways that could influence the progression of LIHC,
thereby highlighting the need for further explorations in this
area. Finally, although the prognostic signature demonstrates
promise in guiding immunotherapy strategies, its clinical
applicability is constrained by the absence of prospective clinical
trials to validate its predictive power. Future studies should
focus on validating the prognostic signature within larger, more
diverse patient populations and elucidating the mechanistic roles
of M2 macrophages in the context of LIHC.
Supplementary Material
Supporting Data
Supporting Data
Acknowledgements
Not applicable.
Funding
The present work was supported by the Evaluation of the Efficacy
of Liver-Coursing Spleen-Rectifying Decoction in Treating
Non-Alcoholic Fatty Liver Disease and its Effects on Intestinal
Flora and Serum LPS of Patients (grant no. S202406060003).
Availability of data and materials
The data generated in the present study may be
requested from the corresponding author.
Authors' contributions
LC was involved in the study conception and design
and reviewed the manuscript. AW, XL and ZW performed the literature
search, performed experiments, acquired and analyzed data,
performed the statistical analysis and wrote and reviewed the
manuscript. LC serves as a guarantor for the integrity of the
entire study. LC, AW, XL and ZW confirm the authenticity of the raw
data. All authors have read and approved the final manuscript.
Ethics approval and consent to
participate
Not applicable.
Patient consent for publication
Not applicable.
Competing interests
The authors declare that they have no competing
interests.
Glossary
Abbreviations
Abbreviations:
|
LIHC
|
liver hepatocellular carcinoma
|
|
TME
|
tumor microenvironment
|
|
NK
|
natural killer
|
|
TCGA
|
The Cancer Genome Atlas
|
|
GEO
|
Gene Expression Omnibus
|
|
ICGC
|
International Cancer Genome
Consortium
|
|
WGCNA
|
weighted gene co-expression network
analysis
|
|
ROC
|
receiver operating characteristic
|
|
scRNA-seq
|
single-cell RNA sequencing
|
|
Tex
|
CD8+ exhausted T cells
|
|
OS
|
overall survival
|
|
CCK-8
|
Cell Counting Kit-8
|
|
PI
|
propidium iodide
|
|
RT-qPCR
|
reverse transcription quantitative
PCR
|
|
LUAD
|
lung adenocarcinoma
|
References
|
1
|
Siegel RL, Giaquinto AN and Jemal A:
Cancer statistics, 2024. CA Cancer J Clin. 74:12–49.
2024.PubMed/NCBI
|
|
2
|
Zheng Z, Mei J, Guan R, Zhang J, Xiong X,
Gan J, Li S and Guo R: A novel liver-function-indicators-based
prognosis signature for patients with hepatocellular carcinoma
treated with anti-programmed cell death-1 therapy. Cancer Immunol
Immunother. 73:1582024. View Article : Google Scholar : PubMed/NCBI
|
|
3
|
Antonius Y, Kharisma VD, Widyananda MH,
Ansori ANM, Trinugroho JP, Ullah Md E, Naw SW, Jakhmola V and
Wahjudi M: Prediction of aflatoxin-B1 (AFB1) molecular mechanism
network and interaction to oncoproteins growth factor in
hepatocellular carcinoma. J Pure Appl Microbiol. 16:1844–1854.
2022. View Article : Google Scholar
|
|
4
|
Jia G, He P, Dai T, Goh D, Wang J, Sun M,
Wee F, Li F, Lim JCT, Hao S, et al: Spatial immune scoring system
predicts hepatocellular carcinoma recurrence. Nature.
640:1031–1041. 2025. View Article : Google Scholar : PubMed/NCBI
|
|
5
|
Yu B and Ma W: Biomarker discovery in
hepatocellular carcinoma (HCC) for personalized treatment and
enhanced prognosis. Cytokine Growth Factor Rev. 79:29–38. 2024.
View Article : Google Scholar : PubMed/NCBI
|
|
6
|
Li M, Yang Y, Xiong L, Jiang P, Wang J and
Li C: Metabolism, metabolites, and macrophages in cancer. J Hematol
Oncol. 16:802023. View Article : Google Scholar : PubMed/NCBI
|
|
7
|
Brockmann L, Tran A, Huang Y, Edwards M,
Ronda C, Wang HH and Ivanov II: Intestinal microbiota-specific Th17
cells possess regulatory properties and suppress effector T cells
via c-MAF and IL-10. Immunity. 56:2719–2735.e7. 2023. View Article : Google Scholar : PubMed/NCBI
|
|
8
|
Pascual-García M, Bonfill-Teixidor E,
Planas-Rigol E, Rubio-Perez C, Iurlaro R, Arias A, Cuartas I,
Sala-Hojman A, Escudero L, Martínez-Ricarte F, et al: LIF regulates
CXCL9 in tumor-associated macrophages and prevents CD8+ T cell
tumor-infiltration impairing anti-PD1 therapy. Nat Commun.
10:24162019. View Article : Google Scholar : PubMed/NCBI
|
|
9
|
Han S, Bao X, Zou Y, Wang L, Li Y, Yang L,
Liao A, Zhang X, Jiang X, Liang D, et al: d-lactate modulates M2
tumor-associated macrophages and remodels immunosuppressive tumor
microenvironment for hepatocellular carcinoma. Sci Adv.
9:eadg26972023. View Article : Google Scholar : PubMed/NCBI
|
|
10
|
Li D, Zhang T, Guo Y, Bi C, Liu M and Wang
G: Biological impact and therapeutic implication of
tumor-associated macrophages in hepatocellular carcinoma. Cell
Death Dis. 15:4982024. View Article : Google Scholar : PubMed/NCBI
|
|
11
|
Zhang Y, Han G, Gu J, Chen Z and Wu J:
Role of tumor-associated macrophages in hepatocellular carcinoma:
impact, mechanism, and therapy. Front Immunol. 15:14298122024.
View Article : Google Scholar : PubMed/NCBI
|
|
12
|
Sun Y, Zhao M, Cheng L, He X, Shen S, Lv
J, Zhang J, Shao Q, Yin W, Zhao F, et al: Reduction of alternative
polarization of macrophages by short-term activated hepatic
stellate cell-derived small extracellular vesicles. J Exp Clin
Cancer Res. 44:1172025. View Article : Google Scholar : PubMed/NCBI
|
|
13
|
Du Y, Wu S, Xi S, Xu W, Sun L, Yan J, Gao
H, Wang Y, Zheng J, Wang F, et al: ASH1L in hepatoma cells and
hepatic stellate cells promotes fibrosis-associated hepatocellular
carcinoma by modulating tumor-associated macrophages. Adv Sci
(Weinh). 11:e24047562024. View Article : Google Scholar : PubMed/NCBI
|
|
14
|
Jeong JM, Choi SE, Shim YR, Kim HH, Lee
YS, Yang K, Kim K, Kim MJ, Chung KPS, Kim SH, et al: CX 3 CR1 +
macrophages interact with HSCs to promote HCC through CD8 + T-cell
suppression. Hepatology. 82:655–668. 2025. View Article : Google Scholar : PubMed/NCBI
|
|
15
|
Cai J, Song L, Zhang F, Wu S, Zhu G, Zhang
P, Chen S, Du J, Wang B, Cai Y, et al: Targeting SRSF10 might
inhibit M2 macrophage polarization and potentiate anti-PD-1 therapy
in hepatocellular carcinoma. Cancer Commun (Lond). 44:1231–1260.
2024. View Article : Google Scholar : PubMed/NCBI
|
|
16
|
Newman AM, Liu CL, Green MR, Gentles AJ,
Feng W, Xu Y, Hoang CD, Diehn M and Alizadeh AA: Robust enumeration
of cell subsets from tissue expression profiles. Nat Methods.
12:453–457. 2015. View Article : Google Scholar : PubMed/NCBI
|
|
17
|
Aran D, Hu Z and Butte AJ: xCell:
Digitally portraying the tissue cellular heterogeneity landscape.
Genome Biol. 18:2202017. View Article : Google Scholar : PubMed/NCBI
|
|
18
|
Mellman I, Chen DS, Powles T and Turley
SJ: The cancer-immunity cycle: Indication, genotype, and
immunotype. Immunity. 56:2188–2205. 2023. View Article : Google Scholar : PubMed/NCBI
|
|
19
|
Finotello F, Mayer C, Plattner C,
Laschober G, Rieder D, Hackl H, Krogsdam A, Loncova Z, Posch W,
Wilflingseder D, et al: Molecular and pharmacological modulators of
the tumor immune contexture revealed by deconvolution of RNA-seq
data. Genome Med. 11:342019. View Article : Google Scholar : PubMed/NCBI
|
|
20
|
Racle J, de Jonge K, Baumgaertner P,
Speiser DE and Gfeller D: Simultaneous enumeration of cancer and
immune cell types from bulk tumor gene expression data. Elife.
6:e264762017. View Article : Google Scholar : PubMed/NCBI
|
|
21
|
Becht E, Giraldo NA, Lacroix L, Buttard B,
Elarouci N, Petitprez F, Selves J, Laurent-Puig P, Sautès-Fridman
C, Fridman WH and de Reyniès A: Estimating the population abundance
of tissue-infiltrating immune and stromal cell populations using
gene expression. Genome Biol. 17:2182016. View Article : Google Scholar : PubMed/NCBI
|
|
22
|
Langfelder P and Horvath S: WGCNA: An R
package for weighted correlation network analysis. BMC
Bioinformatics. 9:5592008. View Article : Google Scholar : PubMed/NCBI
|
|
23
|
Hänzelmann S, Castelo R and Guinney J:
GSVA: Gene set variation analysis for microarray and RNA-seq data.
BMC Bioinformatics. 14:72013. View Article : Google Scholar : PubMed/NCBI
|
|
24
|
Wang G, Liu T and He WT: Visualization
analysis of research hotspots and trends on gastrointestinal tumor
organoids. World J Gastrointest Oncol. 16:2826–2841. 2024.
View Article : Google Scholar : PubMed/NCBI
|
|
25
|
Jiang P, Gu S, Pan D, Fu J, Sahu A, Hu X,
Li Z, Traugh N, Bu X, Li B, et al: Signatures of T cell dysfunction
and exclusion predict cancer immunotherapy response. Nat Med.
24:1550–1558. 2018. View Article : Google Scholar : PubMed/NCBI
|
|
26
|
Kalhor K, Chen CJ, Lee HS, Cai M, Nafisi
M, Que R, Palmer CR, Yuan Y, Zhang Y, Li X, et al: Mapping human
tissues with highly multiplexed RNA in situ hybridization. Nat
Commun. 15:25112024. View Article : Google Scholar : PubMed/NCBI
|
|
27
|
Han Y, Wang Y, Dong X, Sun D, Liu Z, Yue
J, Wang H, Li T and Wang C: TISCH2: expanded datasets and new tools
for single-cell transcriptome analyses of the tumor
microenvironment. Nucleic Acids Res. 51:D1425–D1431. 2023.
View Article : Google Scholar : PubMed/NCBI
|
|
28
|
Livak KJ and Schmittgen TD: Analysis of
relative gene expression data using real-time quantitative PCR and
the 2(−Delta Delta C(T)) method. Methods. 25:402–408. 2001.
View Article : Google Scholar : PubMed/NCBI
|
|
29
|
Yang X, Yang C, Zhang S, Geng H, Zhu AX,
Bernards R, Qin W, Fan J, Wang C and Gao Q: Precision treatment in
advanced hepatocellular carcinoma. Cancer Cell. 42:180–197. 2024.
View Article : Google Scholar : PubMed/NCBI
|
|
30
|
Ruf B, Bruhns M, Babaei S, Kedei N, Ma L,
Revsine M, Benmebarek MR, Ma C, Heinrich B, Subramanyam V, et al:
Tumor-associated macrophages trigger MAIT cell dysfunction at the
HCC invasive margin. Cell. 186:3686–3705.e32. 2023. View Article : Google Scholar : PubMed/NCBI
|
|
31
|
Jin R, Neufeld L and McGaha TL: Linking
macrophage metabolism to function in the tumor microenvironment.
Nat Cancer. 6:239–252. 2025. View Article : Google Scholar : PubMed/NCBI
|
|
32
|
Zeng W, Li F, Jin S, Ho PC, Liu PS and Xie
X: Functional polarization of tumor-associated macrophages dictated
by metabolic reprogramming. J Exp Clin Cancer Res. 42:2452023.
View Article : Google Scholar : PubMed/NCBI
|
|
33
|
Zhang D, Zhao K, Han T, Zhang X, Xu X, Liu
Z, Ren X, Zhang X, Lu Z and Qin C: Bisphenol A promote the cell
proliferation and invasion ability of prostate cancer cells via
regulating the androgen receptor. Ecotoxicol Environ Saf.
269:1158182024. View Article : Google Scholar : PubMed/NCBI
|
|
34
|
Cai J, Chen T, Jiang Z, Yan J, Ye Z, Ruan
Y, Tao L, Shen Z, Liang X, Wang Y, et al: Bulk and single-cell
transcriptome profiling reveal extracellular matrix mechanical
regulation of lipid metabolism reprograming through YAP/TEAD4/ACADL
axis in hepatocellular carcinoma. Int J Biol Sci. 19:2114–2131.
2023. View Article : Google Scholar : PubMed/NCBI
|
|
35
|
Qu X, Zhao X, Lin K, Wang N, Li X, Li S,
Zhang L and Shi Y: M2-like tumor-associated macrophage-related
biomarkers to construct a novel prognostic signature, reveal the
immune landscape, and screen drugs in hepatocellular carcinoma.
Front Immunol. 13:9940192022. View Article : Google Scholar : PubMed/NCBI
|
|
36
|
Chen S, Zhang P, Zhu G, Wang B, Cai J,
Song L, Wan J, Yang Y, Du J, Cai Y, et al: Targeting GSDME-mediated
macrophage polarization for enhanced antitumor immunity in
hepatocellular carcinoma. Cell Mol Immunol. 21:1505–1521. 2024.
View Article : Google Scholar : PubMed/NCBI
|
|
37
|
Vizcaino Castro A, Daemen T and Oyarce C:
Strategies to reprogram anti-inflammatory macrophages towards
pro-inflammatory macrophages to support cancer immunotherapies.
Immunol Lett. 267:1068642024. View Article : Google Scholar : PubMed/NCBI
|
|
38
|
Mace EM: Human natural killer cells: Form,
function, and development. J Allergy Clin Immunol. 151:371–385.
2023. View Article : Google Scholar : PubMed/NCBI
|
|
39
|
Huang G, Xiao S, Jiang Z, Zhou X, Chen L,
Long L, Zhang S, Xu K, Chen J and Jiang B: Machine learning
immune-related gene based on KLRB1 model for predicting the
prognosis and immune cell infiltration of breast cancer. Front
Endocrinol (Lausanne). 14:11857992023. View Article : Google Scholar : PubMed/NCBI
|