Introduction
Pancreatic cancer (PC) is characterized by high
fatality rates, with a 5-year survival rate of ~4% (1,2).
Notably, targeted therapies have proven inadequate, due to the
substantial heterogeneity within PC (3). In recent years, immunotherapy has
offered potential for the treatment of various solid tumors,
including melanoma, lung cancer, breast cancer, renal cell
carcinoma, head and neck cancer, esophageal cancer and bladder
cancer (4,5); however, prior studies have suggested
that unselected patients with PC often exhibit minimal or no
response to immunotherapy (6–8).
Cell death mechanisms serve pivotal roles in
maintaining physiological homeostasis, eliminating damaged cells
and responding to pathological stimuli (9). Traditionally, apoptosis was considered
the primary form of programmed cell death; however, recent
advancements in tumor cell biology have identified various subtypes
of programmed cell death, such as necroptosis, pyroptosis and
ferroptosis, each associated with distinct biological contexts
(10,11). Copper ions are indispensable for
cellular physiology, including energy metabolism, mitochondrial
respiration and antioxidant activity (12,13).
Dysregulation of copper ions can disturb lipid metabolism, and one
distinctive form of cell death, known as cuproptosis, emerges due
to copper excess, resulting in oxidative stress, mitochondrial
damage and endothelial cell dysfunction (14–16).
In addition, recent research has revealed a novel mechanism of
copper-induced cell death involving the aggregation of lipoylated
dihydrolipoamide S-acetyltransferase (DLAT), a component of the
mitochondrial tricarboxylic acid cycle, ultimately leading to
proteotoxic stress and cell death termed cuproptosis (17,18).
Mounting evidence has suggested that disrupted copper homeostasis
can impact tumor growth (19–21),
and targeted cuproptosis therapy holds promise, particularly for
highly fatal tumors with limited therapeutic options, such as PC
(22,23). In the past decade, research into
programmed cell death in tumors has indicated the immunogenicity of
the tumor microenvironment (TME), rendering it amenable to
anticancer interventions (24–26).
Notably, various TME components undergoing programmed cell death
can elicit immune responses against tumor cells, thereby enhancing
antitumor effects. For example, tumor destruction facilitates
antigen acquisition by conventional dendritic cells, promotes the
recruitment of myeloid cells and restricts T-cell cytotoxic
activity (27–29).
The latest research has suggested a novel connection
between TME composition, cancer-associated fibroblasts (CAFs) and
malignant cell stemness, as well as patient survival, which may
lead to improved upfront risk stratification and more personalized
clinical decision-making (30,31).
Some studies have demonstrated the role of cuproptosis in
tumorigenesis, tumor progression and prognosis (19,32).
However, the unique molecular signature of cuproptosis and its
interplay with the TME remain unexplored in PC. Therefore,
investigating whether cuproptosis alters the TME and impacts
anticancer therapy outcomes is a key research avenue.
The present study provides a comprehensive analysis
of the difference in expression of cuproptosis-related genes (CGs)
and gene variation, focusing on their latent roles in PC
tumorigenesis, prognosis, TME and treatment outcomes using
multi-omics data. Two distinct cuproptosis-related subtypes within
PC were identified, and their molecular characteristics, prognostic
significance and interactions with the tumor immune
microenvironment were evaluated. Furthermore, a CG scoring system
was established to predict clinical outcomes and immunotherapy
responses in patients with PC. In conclusion, the present study
established a risk score as a robust prognostic indicator for
patients with PC, offering potential for precise risk
stratification, insights into TME characteristics and the
exploration of more effective immunotherapy strategies.
Materials and methods
PC data sources and preprocessing
The present study used multi-omics data from cohorts
of patients with PC extracted from The Cancer Genome Atlas (TCGA),
Genome Tissue Expression (GTEx), International Cancer Genome
Consortium (ICGC), Gene Expression Omnibus (GEO), the Human Protein
Atlas (HPA) and Clinical Proteomic Tumor Analysis Consortium
(CPTAC) databases. The normalized mRNA expression data and
corresponding clinical information from 160 patients with
pancreatic adenocarcinoma (PAAD), including survival status, grade,
sex and age, were obtained from TCGA (https://portal.gdc.cancer.gov/). Furthermore, another
independent cohort was retrieved from the ICGC database (https://dcc.icgc.org/, which contained 101 PAAD cases.
Samples from patients with a deficiency of clinical information
were excluded from subsequent analysis. In addition, transcriptome
data from 167 normal pancreatic tissues were downloaded from the
public database GTEx project (https://www.gtexportal.org;
gtex_RSEM_gene_fpkm).
Cell-free DNA data from liquid biopsies were
obtained from the GEO (https://www.ncbi.nlm.nih.gov/geo/) database. Two GEO
datasets containing 47 blood plasma samples of PC were included in
the analysis, namely GSE136651 [normal=22 vs. tumor=10] (33) and GSE81314 (34) (normal=8 vs. tumor=7).
The protein level verification of CGs in PC tissues
was investigated using immunohistochemistry from the HPA
(https://www.proteinatlas.org/) database
(35). The PC proteome and
corresponding clinical data were sourced from the CPTAC database
(https://cptac-data-portal.georgetown.edu/cptacPublic),
which included 90 normal and 145 tumor samples. Relative protein
abundance was log2 transformed and zero centered for
each gene to obtain final relative abundance values.
Establishment of cuproptosis
subtypes
A total of 10 CGs [ferredoxin 1 (FDX1), DLAT, metal
regulatory transcription factor 1 (MTF1), CDK inhibitor 2A
(CDKN2A), glutaminase (GLS), dihydrolipoamide dehydrogenase (DLD),
pyruvate dehydrogenase E1 subunit α1 (PDHA1), lipoic acid
synthetase (LIAS), lipoyltransferase 1 (LIPT1) and pyruvate
dehydrogenase E1 subunit β (PDHB)] were identified based on the
related genes that regulate cuproptosis mentioned in a previous
article (15). Consensus clustering
was applied to identify distinct cuproptosis-associated patterns
using the k-means algorithm in the ‘ConsensusClusterPlus’ package
(36,37). A total of 1,000 iterations were
applied to guarantee the stability of the classification. To
explore the biological behaviors of CGs in PC, gene set variation
analysis was performed on the Kyoto Encyclopedia of Genes and
Genomes gene set (c2.cp.kegg.v7.5) from the Molecular Signatures
Database (https://www.gsea-msigdb.org/gsea/msigdb/) (38).
Analysis of immune infiltration
The TME scores (including immune and stromal scores)
of TCGA-PAAD tissues were estimated using several acknowledged
methods, including XCELL (https://comphealth.ucsf.edu/app/xcell), TIMER
(http://timer.cistrome.org/), QUANTISEQR
(https://bioconductor.org/packages/quantiseqr/),
MCPOUNTER (https://github.com/cit-bioinfo/mMCP-counter), EPIC
(https://github.com/GfellerLab/EPIC),
CIBERSORT-ABS and CIBERSORT (https://cibersortx.stanford.edu/) (39). ImmuneScore (indicating the level of
immune cell infiltration), StromalScore (indicating the level of
stromal cell infiltration) and ESTIMATEScore (reflecting the sum of
both) for each patient were measured using the R package ‘ESTIMATE’
(https://bioinformatics.mdanderson.org/public-software/estimate/)).
In addition, the infiltrating proportions of immune cells were
assessed with the single-sample gene set enrichment analysis
(ssGSEA) algorithm (https://cloud.genepattern.org) (40).
Development of the
cuproptosis-associated prognostic score
The ‘limma’ package (https://www.plob.org/tag/limma/) (41) was used to screen the differentially
expressed genes (DEGs) in the distinct CG subtypes with criteria of
|log2-fold change| ≥1 and P<0.05. Next,
prognosis-associated genes were acquired by a univariate Cox
regression analysis based on DEGs. Subsequently, the least absolute
shrinkage and selection operator (LASSO) penalties were used to
identify the most robust prognostic biomarkers. Finally, candidate
biomarkers and their correlation coefficients were acquired to
establish a CG gene signature, defined as the risk score. The risk
score was calculated as follows: Risk score=Σ (expression ×
corresponding coefficient).
PC cell line culture
Human PC cell lines (PATU-8988T, AsPC-1 and BxPC-3)
and one normal pancreatic duct cell line (hTERT-HPNE were obtained
from the China Infrastructure of Cell Line Resources, Institute of
Basic Medical Sciences, Chinese Academy of Medical Sciences. The
PATU-8988T, AsPC-1 and BxPC-3 cells were cultured in RPMI 1640
medium (HyClone; Cytiva), and hTERT-HPNE cells were cultured in
DMEM (HyClone; Cytiva) supplemented with 100 U/ml
penicillin-streptomycin (Corning, Inc.) and 10% FBS (Gibco; Thermo
Fisher Scientific, Inc.) at 37°C with 5% CO2.
Reverse transcription-quantitative PCR
(RT-qPCR)
Cellular total RNA was extracted using the E.Z.N.A
total RNA Kit I (Omega Bio-Tek, Inc.) and cDNA was synthesized by
RT with a PrimerScript RT reagent Kit (Takara Bio, Inc.) according
to the manufacturer's protocol. qPCR was performed to examine the
mRNA expression levels of the FDX1, DLAT, MTF1 and CDKN2A using the
SYBR Premix Ex Taq kit (Takara Bio, Inc.) with the Roche
LightCycler480 PCR instrument (Roche Diagnostics). The
thermocycling conditions were as follows: cDNA pre-denaturation,
95°C for 30 sec; cDNA denaturation, 95°C for 10 sec; and primer
annealing and new strand extension, 60°C for 30 sec. The
denaturation, annealing and extension steps were repeated for a
total of 40 cycles. All primers used in the present study are
listed in Table I. β-actin was used
as an internal control and the relative mRNA levels were calculated
based on the 2−ΔΔCq method (42).
 | Table I.Primers utilized in our
investigation. |
Table I.
Primers utilized in our
investigation.
| Gene symbol | Primer sequence,
5′-3′ |
|---|
| PDX1 | F:
GGAGCAGGATTGTGCCGTAA |
|
| R:
CTGTGGGGACGCACTAAGG |
| DLAT | F:
GAGATGTCCCTCTAGGAACCC |
|
| R:
ACAAACACCCTTCCCTTTGGT |
| MTF1 | F:
CACAGTCCAGACAACAACATCA |
|
| R:
GCACCAGTCCGTTTTTATCCAC |
| CDKN2A | F:
GGGTTTTCGTGGTTCACATCC |
|
| R:
CTAGACGCTGGCTCCTCAGTA |
| β-actin | F:
CATGTACGTTGCTATCCAGGC |
|
| R:
CTCCTTAATGTCACGCACGAT |
Genomic mutation analysis and drug
response prediction
To identify the differences in somatic mutations
between high- and low-risk groups of patients with PC, the mutation
annotation format in TCGA cohort was created with the ‘maftools’ R
package (43). To further screen
therapeutic responses to chemotherapeutics in the two groups of
patients, the ‘pRRophetic’ package was used to evaluate the
half-maximal inhibitory concentration (IC50) values of
chemotherapeutic drugs commonly applied to treat tumors, based on
drug sensitivity data from the Genomics of Drug Sensitivity in
Cancer (GDSC) dataset (https://www.cancerrxgene.org/) (44).
Additional bioinformatics and
statistical analyses
The R software (version 4.4.0; R Development Core
Team; http://www.r-project.org/) and its
corresponding packages were applied to process, analyze and present
the data. The principal component analysis (PCA) (45) was performed to assess patterns of
CGs associated with cuproptosis subtypes. Data are presented as the
mean ± SD from three independent experiments. Two-tailed unpaired
Student's t-test or Mann-Whitney U test was applied to analyze the
differences between two groups. One-way ANOVA with Tukey's post hoc
test was used for differential analysis among three or more groups.
Correlation was analyzed using Spearman's rank correlation
coefficient. The genomic location of copy number variant (CNV)
alterations in the 10 CGs across chromosomes was analyzed using the
‘circlize’ R package (https://github.com/jokergoo/circlize). The difference
in overall survival (OS) between the two groups was estimated using
the Kaplan-Meier survival curve with the R package
‘survminer’(https://cran.r-project.org/web/packages/survminer/index.html)
using log-rank test. Additionally, Cox regression for survival
analysis was conducted using the ‘survival’ package (https://github.com/therneau/survival).
The time-dependent receiver operating characteristic (ROC) curve
was plotted using the R package ‘timeROC’ (https://www.rdocumentation.org/packages/timeROC/). All
heatmaps were generated using ‘pheatmap’ package. P<0.05 was
considered to indicate a statistically significant difference.
Results
Cuproptosis ssGSEA score is associated
with improved OS in patients with PC
The flow chart of the present study is shown in
Fig. S1. Regarding the
intertumoral heterogeneity of cell death in patients with PC, the
enrichment scores of five reported cell death modes were estimated
using ssGSEA in pancreatic tumor and healthy pancreatic tissue
samples from TCGA-PAAD and GTEx cohorts. The results revealed that
apoptosis, necroptosis, pyroptosis and ferroptosis were aberrantly
hyperactivated in tumor tissues, whereas there were no significant
differences in terms of cuproptosis (Fig. 1A). Utilizing ssGSEA scores for each
cell death pathway and survival data, Cox coefficient analysis was
conducted for these pathways in patients with PC. Notably, among
all cell death pathways, cuproptosis was the only one associated
with a longer OS (Fig. 1B). These
findings suggested that cuproptosis may have a key role as a
positive predictive factor of improved OS in patients with PC.
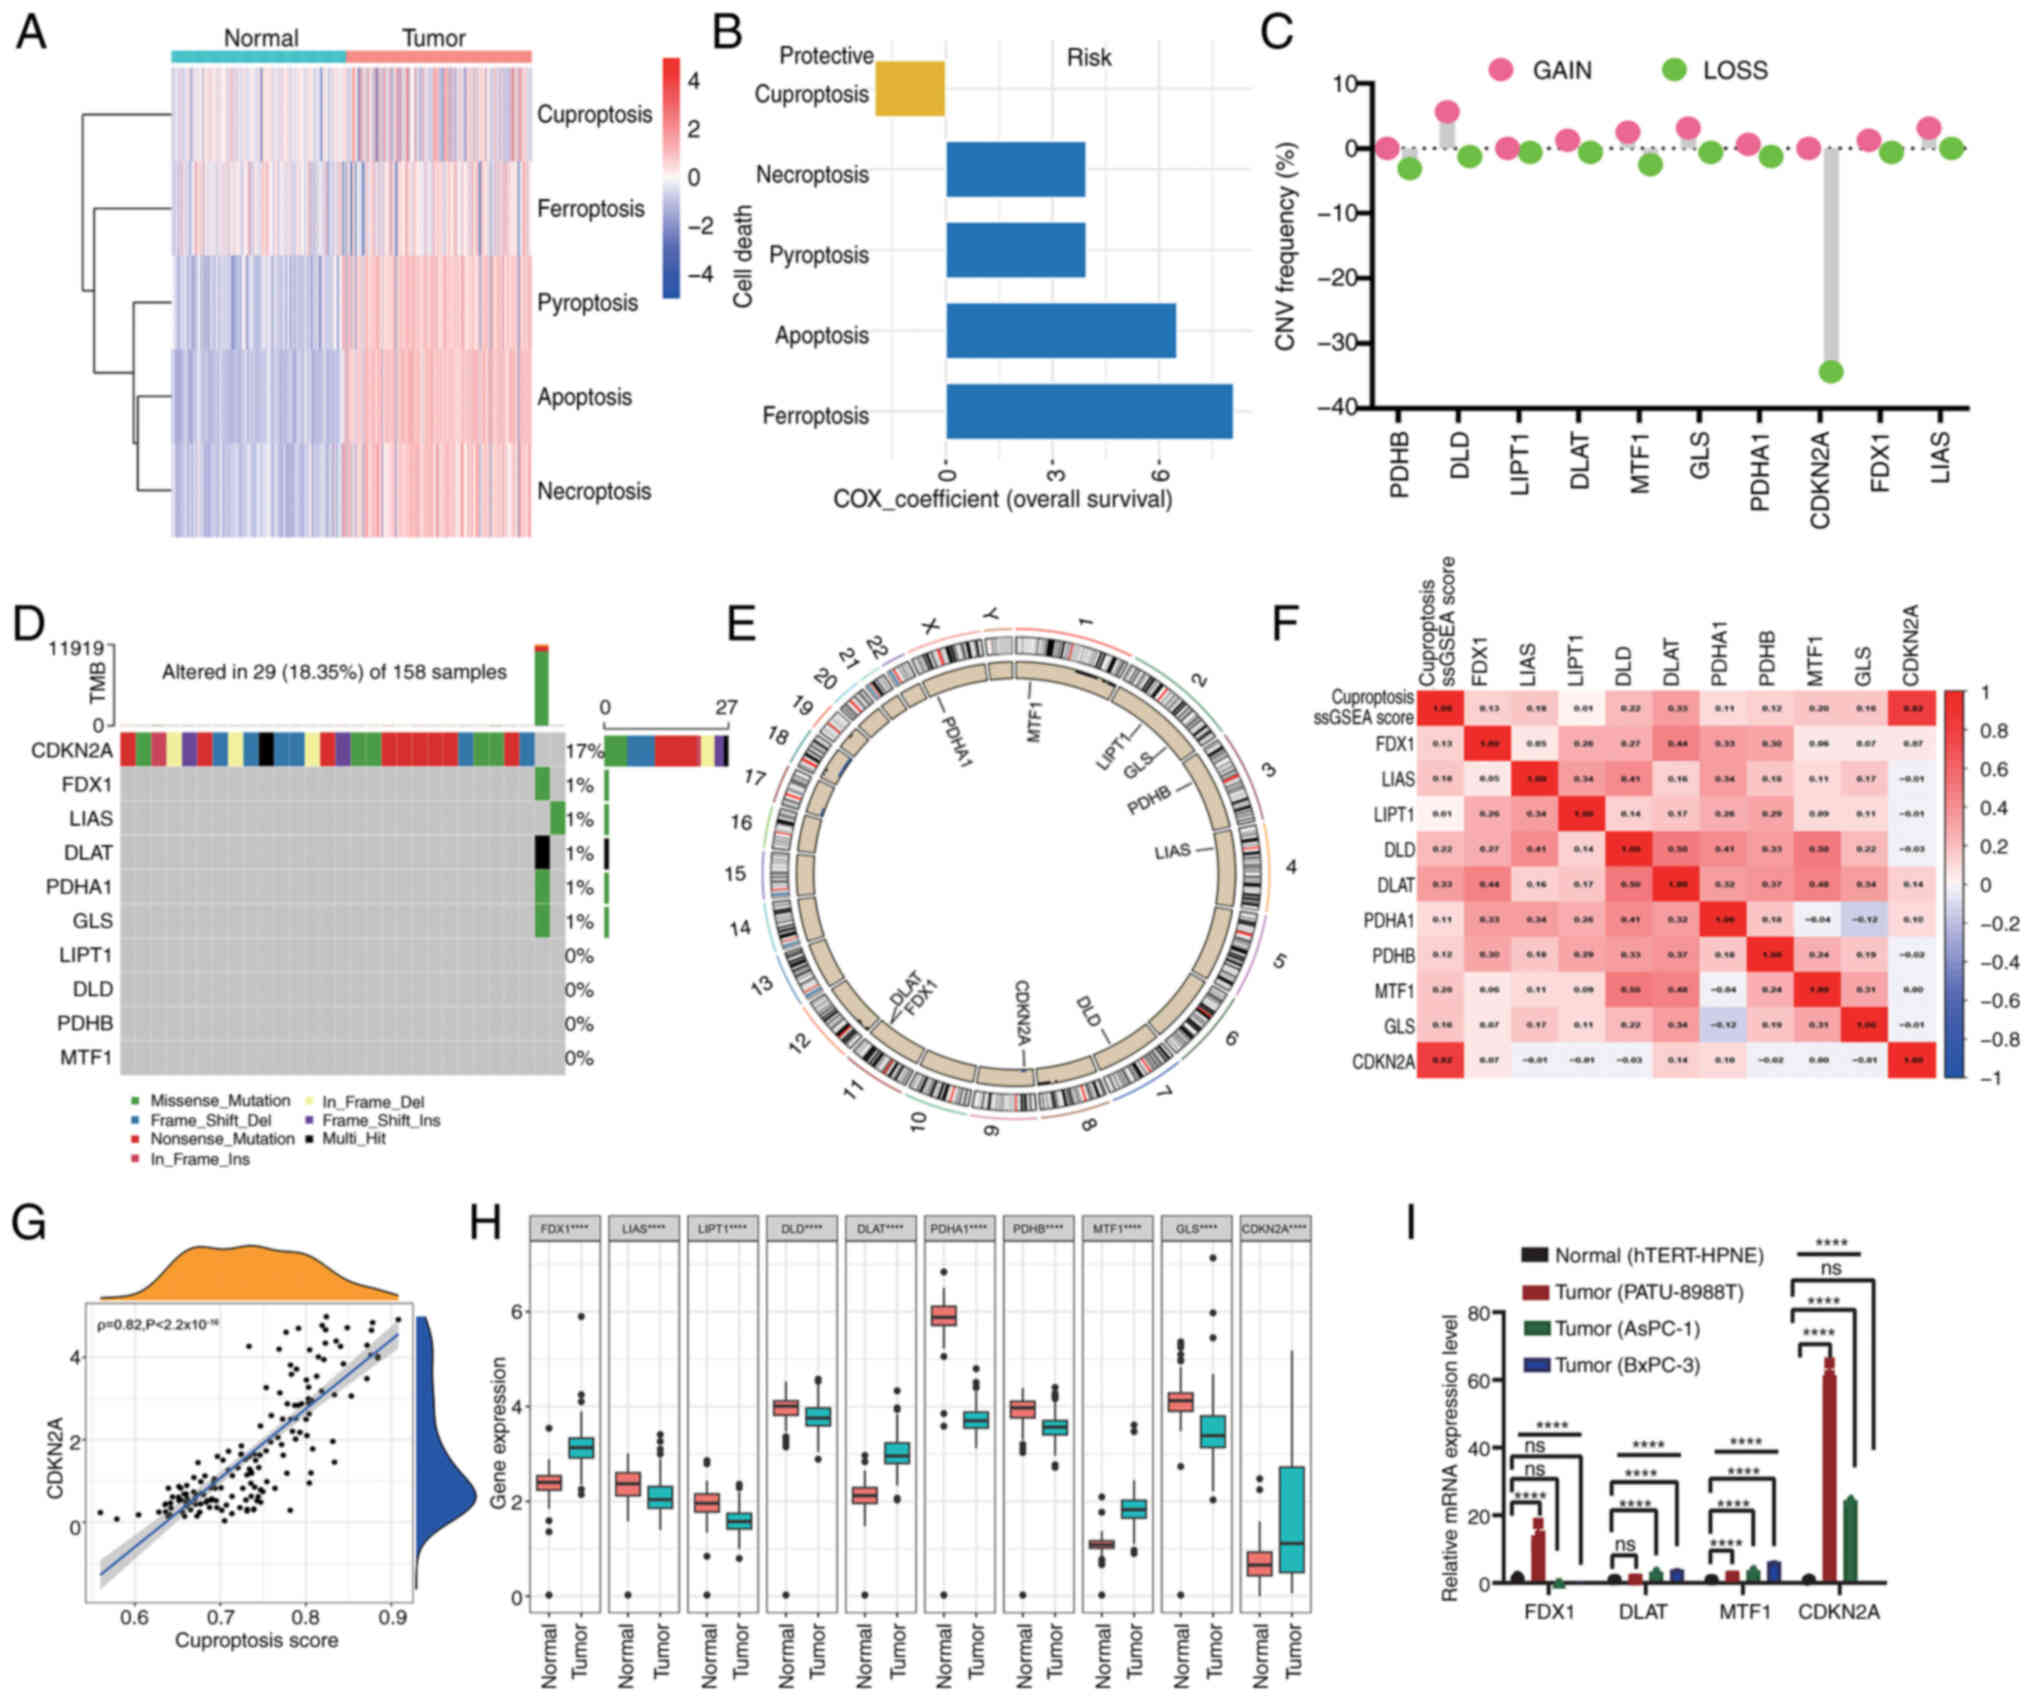 | Figure 1.Genetic mutation landscape of CGs and
cuproptosis subtypes in PC tumorigenesis. (A) Heatmap indicating
the enrichment scores of five reported cell death pathways in
pancreatic tumors and normal pancreatic samples. (B) Distribution
of Cox coefficients of cell death pathways determined by univariate
Cox regression analysis. (C) Frequencies of CNV gain and loss among
CGs. (D) Mutation frequencies of CGs in 158 patients with PC from
TCGA cohort. (E) Circular plots of chromosome distributions of CGs.
(F) Heatmap displaying the correlation between cuproptosis score
and mRNA expression of CGs. Red represents a positive correlation,
whereas blue represents a negative correlation. (G) Correlations
between the cuproptosis score and the expression of CDKN2A. (H)
Expression of CGs in pancreatic tumor and healthy pancreatic
samples (****P<0.0001, determined by Mann-Whitney U test). (I)
Reverse transcription-quantitative PCR analyses of the mRNA
expression levels of FDX1, DLAT, MTF1 and CDKN2A in PC cell lines
(PATU-8988T, AsPC-1 and BxPC-3) and normal pancreatic cells
(hTERT-HPNE). The results were presented as means ± SD from three
times of independent experiments. A one-way ANOVA with Tukey's post
hoc test was performed to analyze data. ****P<0.001. CG,
cuproptosis-related gene; CNV, copy number variant; PC, pancreatic
cancer; FDX1, ferredoxin 1; DLAT, dihydrolipoamide
S-acetyltransferase; MTF1, metal regulatory transcription factor 1;
CDKN2A, CDK inhibitor 2A; TCGA, The Cancer Genome Atlas. |
Genomic mutation landscape of CGs in
PC
To comprehensively elucidate the genetic landscape
of CGs involved in tumorigenesis, an analysis was conducted
encompassing the total somatic mutation frequency and CNVs of CGs
in a cohort of 160 patients with PC sourced from TCGA dataset.
Complete information of these patients is listed in Table SI. Notably, DLD, DLAT and GLS
exhibited CNV amplifications, whereas PDHB and CDKN2A displayed CNV
reductions (Fig. 1C). As depicted
in Fig. 1D, the frequency of CDKN2A
mutations was the highest, with 17% of patients harboring CDKN2A
mutations, Missense and nonsense mutations were the main types of
CDKN2A mutations. Fig. 1E indicates
the genomic location of CNV alterations in the 10 CGs across
chromosomes. The mRNA expression levels of genes are regulated by
gene variants and the present findings underscored notable
disparities in the genetic landscape of CGs between PC and normal
samples, providing information on the potential involvement of CGs
in PC tumorigenesis.
Expression and prognostic relevance of
CGs in PC
Further analysis revealed that the cuproptosis score
was significantly positively correlated with the expression levels
of CDKN2A, followed by DLAT, suggesting that CDKN2A is the core
gene involved in PC cuproptosis status; by contrast, there was no
significant correlation between cuproptosis score and FDX1, MTF1,
GLS, DLD, PDHA1, LIAS, LIPT1 and PDHB (Fig. 1F and G). Next, an analysis was
conducted to evaluate the mRNA expression levels of CGs in PC.
Compared with normal pancreatic cancer tissue from the GTEx cohort,
FDX1, DLAT, metal regulatory transcription factor 1 (MTF1) and
CDKN2A were significantly highly expressed in PC from TCGA cohort;
whereas GLS, DLD, PDHA1, LIAS, LIPT1 and PDHB were downregulated in
PC (Fig. 1H). Subsequently, four
genes (FDX1, DLAT, MTF1 and CDKN2A) were selected, which were
highly expressed in tumor tissues, for validation in PC cell lines
using RT-qPCR analysis. The results indicated that the mRNA
expression levels of DLAT, MTF1 and CDKN2A exhibited substantial
elevation in PC cells (PATU-8988T, AsPC-1 and BxPC-3) compared with
those in the normal pancreas cell line (hTERT-HPNE). However, the
expression levels of FDX1 was inconsistent among different PC cell
lines; it was upregulated in PATU-8988T cells but downregulated in
AsPC-1 and BxPC-3 cells compared with that in normal pancreas cells
(Fig. 1I), which may be potentially
attributable to the inherent heterogeneity among cell lines.
To evaluate the potential of FDX1, DLAT, MTF1 and
CDKN2A as non-invasive biomarkers of risk assessment, their levels
in cell-free DNA derived from blood plasma samples of patients with
PC and healthy donors were analyzed. The results revealed that
compared with in samples from healthy donors, the blood plasma DNA
levels of DLAT was significantly increased in samples from patients
with PC, whereas FDX1 was significantly decreased (Fig. 2C, G, K and O). Notably, there was no
significant difference in MTF1 and CDKN2A between samples from
patients with PC and healthy donors (Fig. 2K and O). Further survival analysis
demonstrated that the expression of DLAT was positively associated
with worse prognosis (Fig. 2H),
whereas the expression of FDX1, MTF1 and CDKN2A was not related to
the survival of pancreatic cancer (Fig.
2D, L and P).
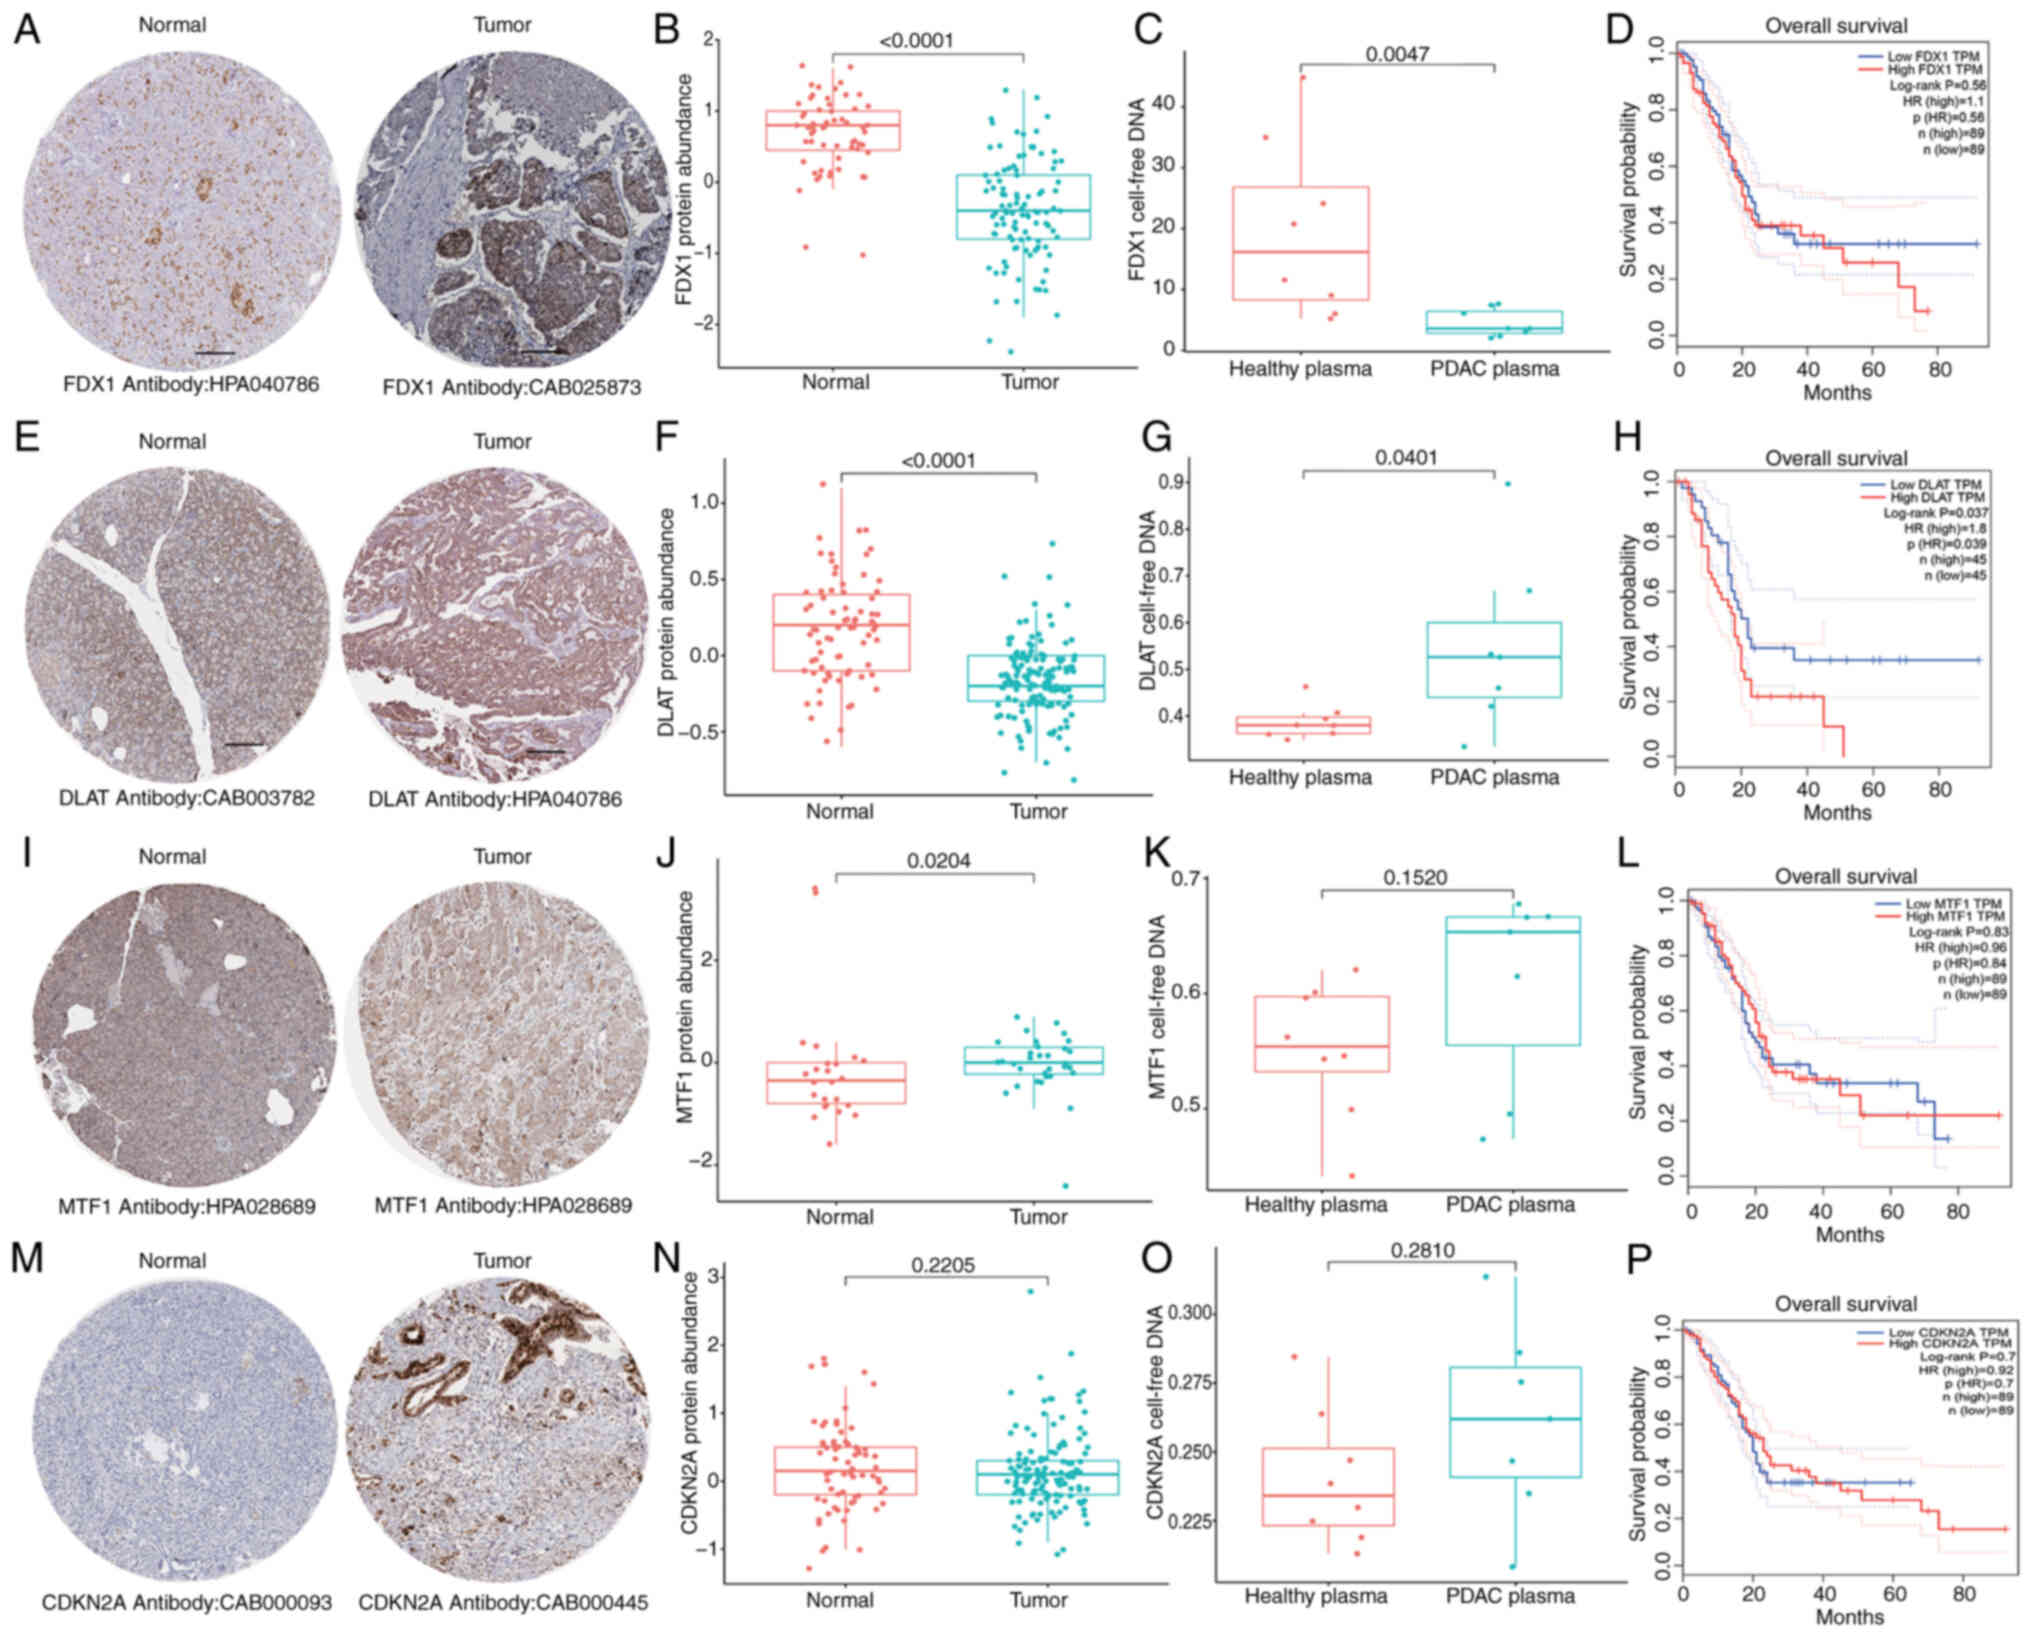 | Figure 2.Expression and prognosis of
cuproptosis-related genes in PC. Histological expression levels of
(A) FDX1, (E) DLAT, (I) MTF1 and (M) CDKN2A from the Human Protein
Atlas database; the antibody type used in immunohistochemistry and
the patient ID of tissue specimens are shown at the bottom of each
image. Different protein levels of (B) FDX1, (F) DLAT, (J) MTF1 and
(N) CDKN2A in pancreatic tumor and healthy pancreas samples from
the Clinical Proteomic Tumor Analysis Consortium database (the
Mann-Whitney U test was performed to analyze data). Different
cell-free DNA levels of (C) FDX1, (G) DLAT, (K) MTF1 and (O) CDKN2A
in blood plasma samples of normal healthy donors and pancreatic
cancer from the GEO database (the Mann-Whitney U test was performed
to analyze data). (D, H, L and P) Survival analysis of (D) FDX1,
(H) DLA, (L) MTF1 and (P) CDKN2A in The Cancer Genome
Atlas-pancreatic adenocarcinoma cohort. FDX1, ferredoxin 1; DLAT,
dihydrolipoamide S-acetyltransferase; MTF1, metal regulatory
transcription factor 1; CDKN2A, CDK inhibitor 2A; PC, pancreatic
cancer. |
Verification of protein levels of CGs was also
conducted using PC proteomics analysis. The results indicated that
the protein levels of FDX1 and DLAT were significantly reduced in
PC tumors compared with those in normal pancreatic tissues from the
GTEx project (Fig. 2A, B, E and F),
while MTF1 exhibited a significant increase in PC tumors (Fig. 2I and J). No significant differences
in expression were observed for CDKN2A (Fig. 2M and N). Notably, while FDX1 was
shown to be increased in tumor tissues (Fig. 1H), it was decreased in in plasma
samples (Fig. 2C). Although the
inconsistency between the protein and transcription levels of CGs
may be due to tumor heterogeneity, the present results indicated
that dysregulated CG expression is involved in PC
tumorigenesis.
Immunological characteristics and
pathway scores of cuproptosis subtypes
Based on ‘ConsensusClusterPlus’, the optimal number
of clusters was determined to be k=2, indicating that a division
into CG cluster A (n=70) and CG cluster B (n=90) was the optimal
choice for the cohort (Fig. 3A).
The results of PCA also confirmed the notable intergroup
distribution (Fig. 3B).
Furthermore, a CGs network was constructed (Fig. 3C) to provide insights into the
comprehensive genetic patterns, regulatory connections and clinical
significance of CGs in patients with PC. Patients within CG cluster
B exhibited worse OS compared with those in CG cluster A within
TCGA cohort (log-rank test; P=0.032; Fig. 3D). The validation of clustering
repeatability using the ICGC cohort is presented in Fig. S2.
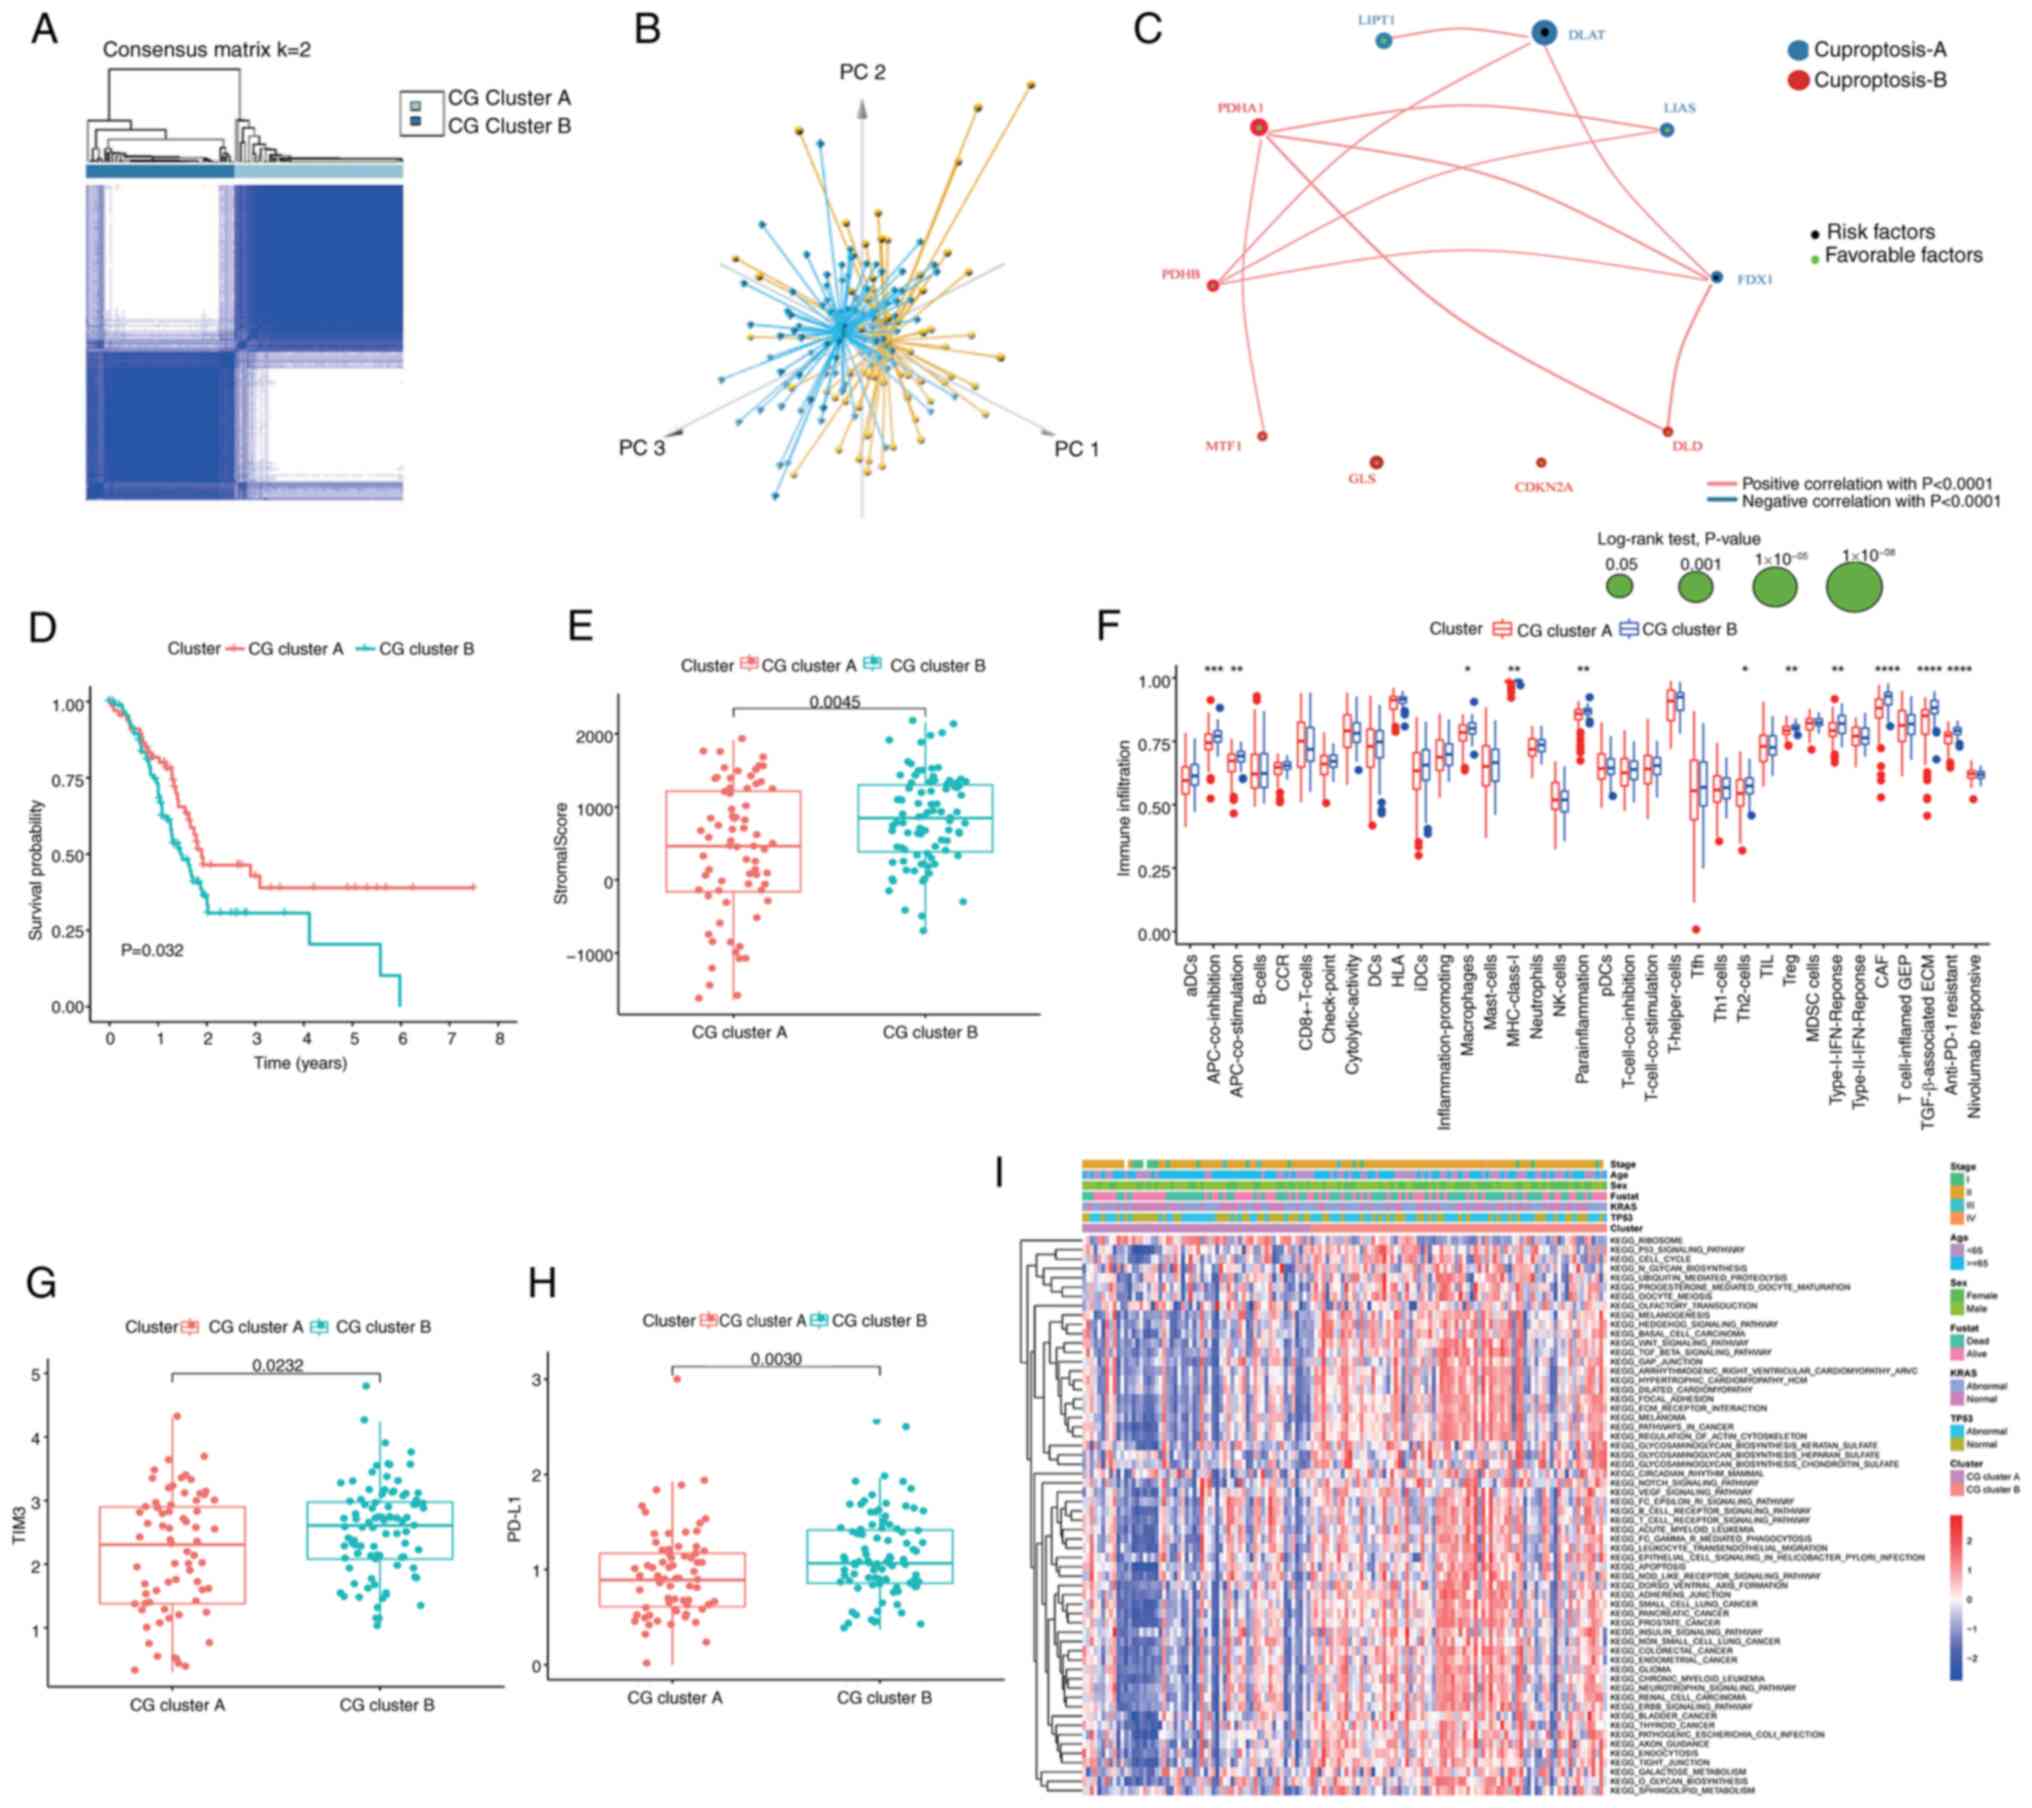 | Figure 3.Immunological characteristics and
pathway scores of cuproptosis subtypes. (A) Consensus matrix
heatmap defining two clusters (k=2) and their correlation area. (B)
Principal component analysis demonstrating two distinct subtypes of
cuproptosis in TCGA cohort. (C) A network of correlations including
CGs in TCGA-pancreatic adenocarcinoma cohort. (D) Kaplan-Meier plot
of overall survival of patients with PC split according to CG
clusters, analyzed by log-rank test. (E) Association between the
two cuproptosis subtypes and stromal score in PC. (F) Abundance of
the infiltration of 35 tumor microenvironment cells of patients
with PC split according to two cuproptosis subtypes. Expression
levels of (G) TIM3 and (H) PD-L1 in the patients with PC split
according to two cuproptosis subtypes. (I) Gene Set Variation
Analysis of the biological pathways of two cuproptosis subtypes in
PC samples from TCGA and International Cancer Genome Consortium
cohorts. ****P<0.0001, ***P<0.001, **P<0.01, *P<0.05,
not significant (P>0.05), analyzed using the Mann-Whitney U
test. CG, cuproptosis-related gene; PC, pancreatic cancer; TCGA,
The Cancer Genome Atlas; TIM3, T-cell immunoglobulin and mucin
domain-containing protein 3; PD-L1, programmed cell death
ligand-1. |
The TME serves a key role in the progression of PC
and has been notably associated with the limited efficacy of
conventional therapeutic modalities, including chemotherapy,
radiotherapy and immunotherapy (46). To comprehensively assess the TME
within distinct CG subtypes, the present study quantified the
immune and stromal components using the ‘ESTIMATE’ algorithm.
Compared with CG cluster A, CG cluster B was characterized by
elevated stromal score (Fig. 3E).
Further analysis revealed enhanced enrichment of various immune
signatures in CG cluster B, including those associated with
antigen-presenting cell (APC) co-inhibition, APC co-stimulation,
inflammation-promoting processes, mast cells, parainflammation, T
helper 2 cells, regulatory T cells (Tregs), CAFs, TGF-β-associated
extracellular matrix (ECM) and resistance to anti-programmed cell
death protein (PD)-1 immunotherapy (Fig. 3F). Similarly, it was observed that
the expression levels of the key immune checkpoint molecules
programmed cell death ligand-1 (PD-L1) and T-cell immunoglobulin
and mucin domain-containing protein 3 (TIM3) were higher within CG
cluster B (Fig. 3G and H).
Collectively, these findings suggested that CG cluster B may be a
hallmark of stromal activation coupled with immunosuppression in
PC, which offers potential options for therapeutic intervention,
particularly employing PD-L1 and TIM3 inhibitors.
The results of GSEA demonstrated that CG cluster B
exhibited notable enrichment in KEGG tumor-related pathways,
encompassing the ‘TGF-beta signaling pathway’ and ‘Wnt signaling
pathway’, as well as ‘ECM receptor interaction’, alongside
immune-related pathways, notably ‘T-cell receptor signaling
pathway’ and ‘B-cell receptor signaling pathway’ (Fig. 3I; Table
SII), suggesting that alterations in these pathways affect the
infiltration of immune cells in different cuproptosis subtypes.
Construction of the
cuproptosis-related signature in different cohorts
In the two subclusters, a total of 224 DEGs
associated with CG subtypes were identified (Table SIII). Subsequently, these DEGs were
subjected to a univariate Cox regression analysis, identifying 161
prognostically significant genes (P<0.05; Table SIV). To identify the most robust
candidates, LASSO and multivariate Cox analyses were employed, as
illustrated in Fig. 4A, along with
a distribution of LASSO coefficients for the gene signature shown
in Fig. 4B. Consequently, a set of
five central candidates were derived, comprising three
risk-associated genes [uroplakin-2 (UPK2), lactate dehydrogenase A
pseudogene 7 (LDHAP7) and family member with sequence similarity 83
(FAM83A)] and two protective genes [microRNA-3677 (MIR3677) and
AC068620.2], to generate a cuproptosis-related signature with the
following algorithm: Risk score=(−0.426 × expression of MIR3677) +
(−0.827 × expression of AC068620.2) + (0.312 × expression of UPK2)
+ (0.306 × expression of LDHAP7) + (0.336 × expression of FAM83A).
Patients were divided into high- and low-risk score groups based on
the median risk score value.
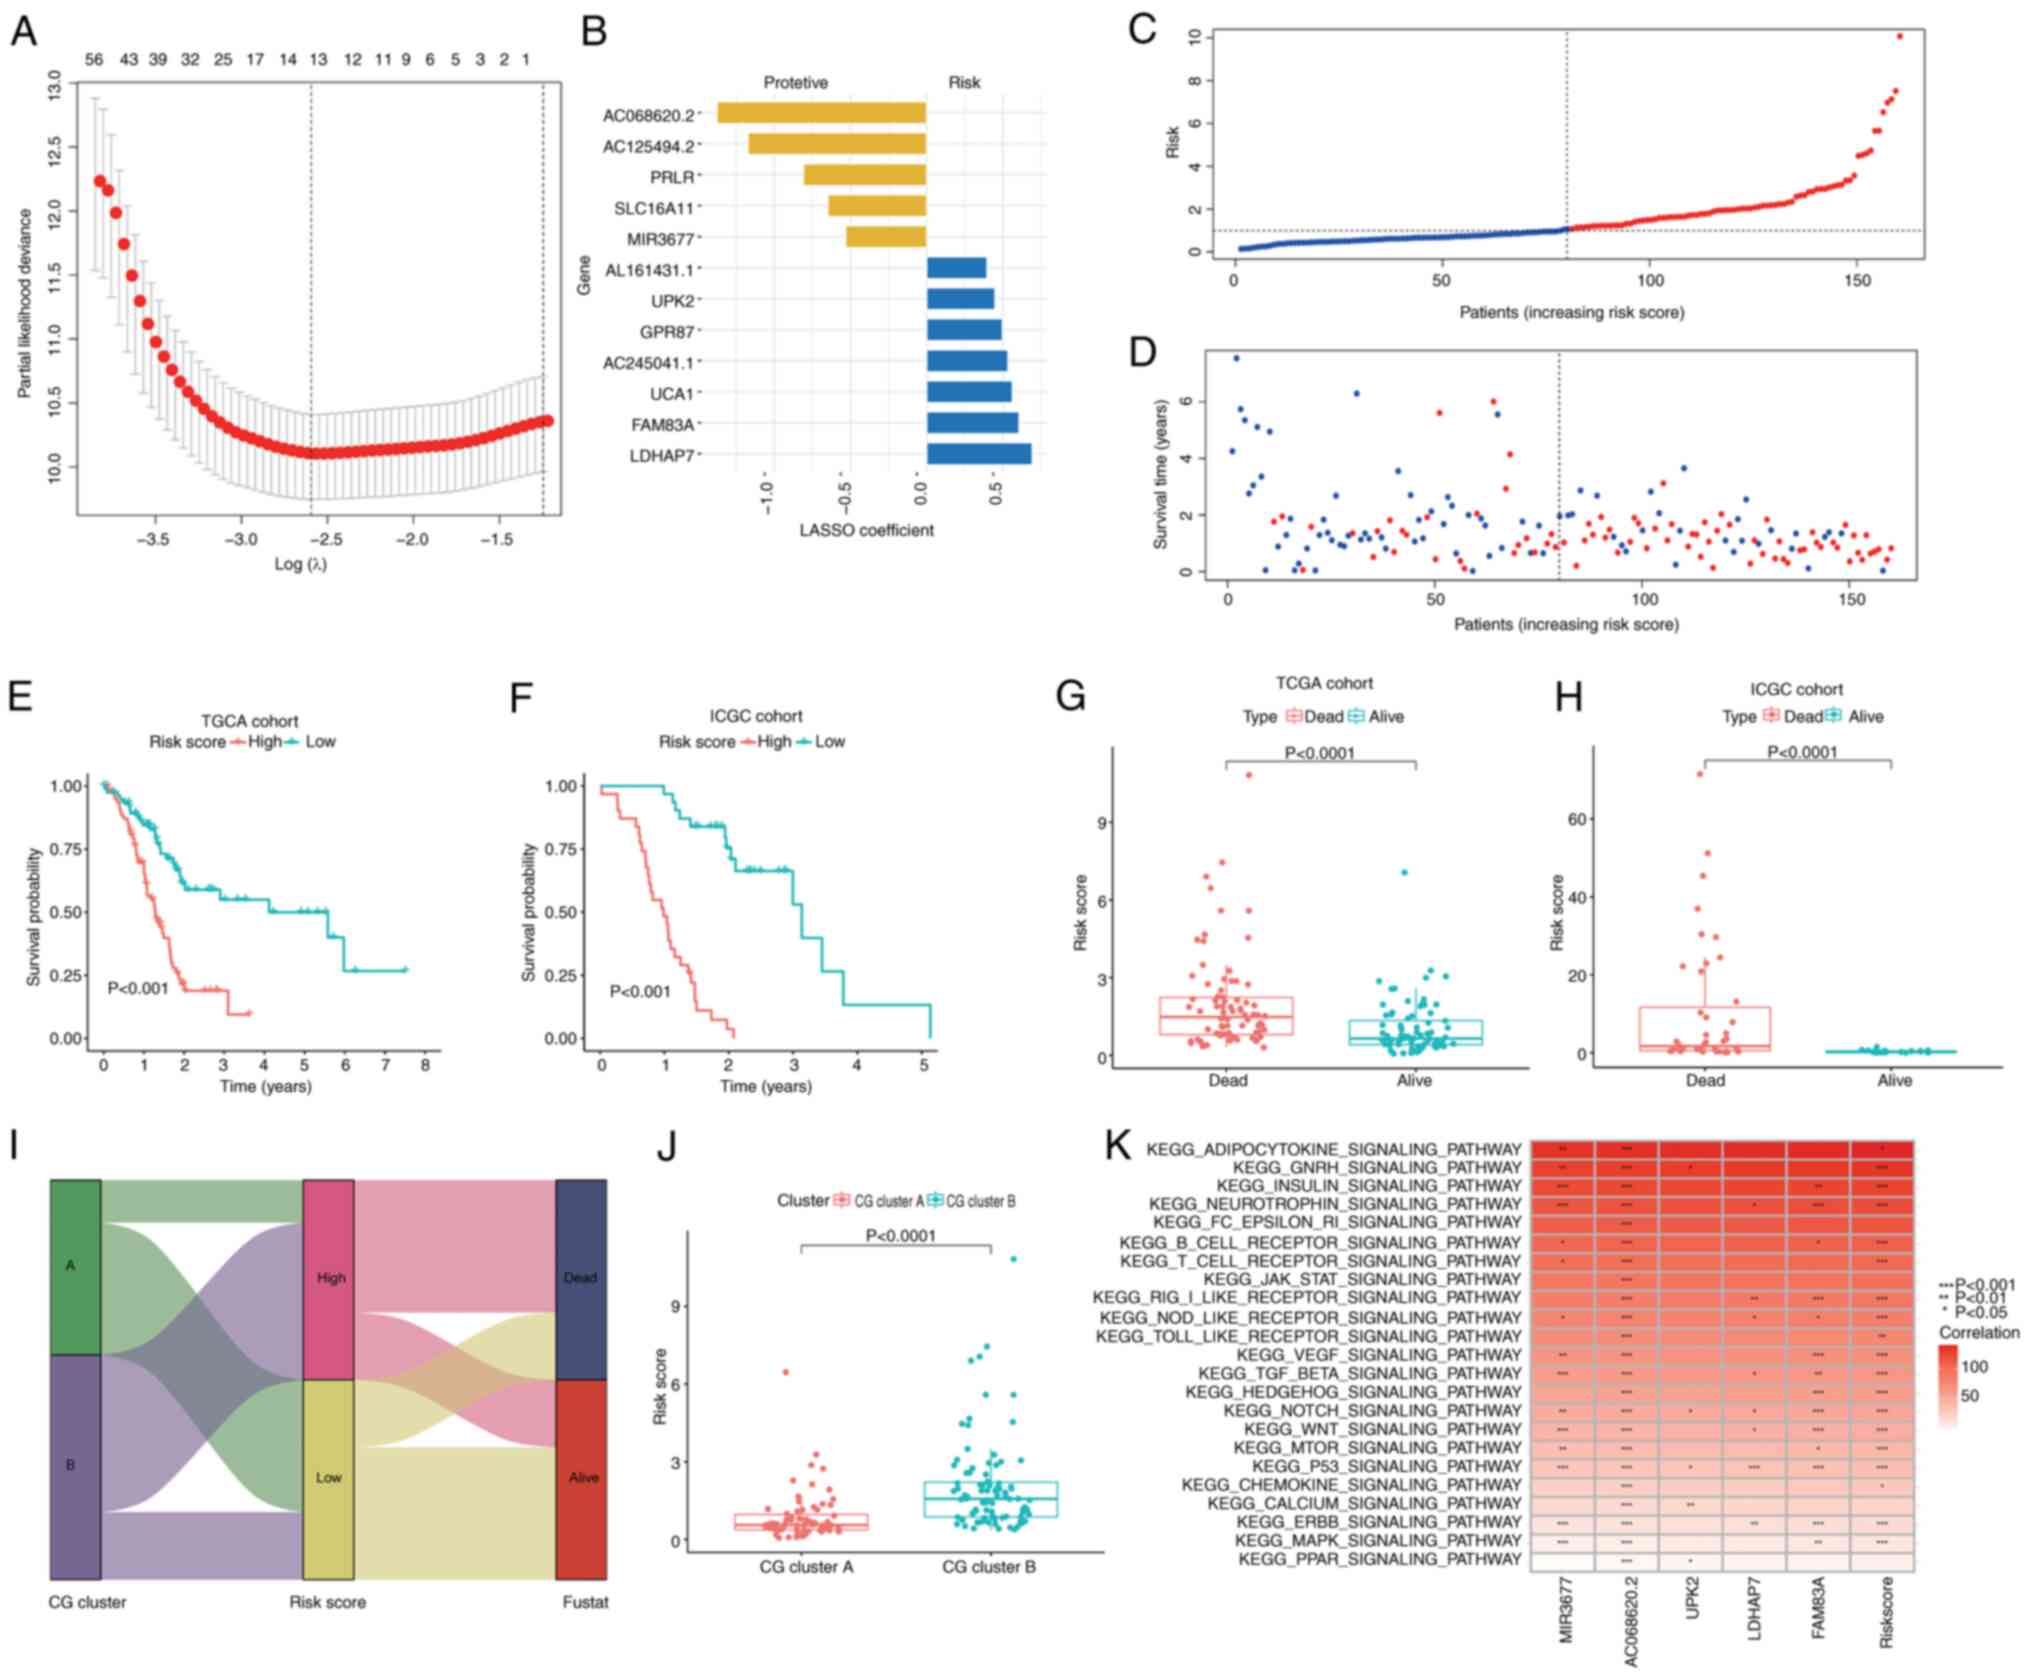 | Figure 4.Construction and validation of the
cuproptosis-related signature in different cohorts. (A) LASSO Cox
regression model was applied to identify the most robust
biomarkers. (B) Distribution of LASSO coefficients of the CG
signature. (C) Ranked dot plot demonstrating the risk score
distribution and patient survival status. (D) Scatter plot
demonstrating the patient survival status. (E and F) Kaplan-Meier
curves were used to analyze the survival of patients with PC with
high- and low-risk scores in TCGA and ICGC cohorts. (G and H)
Differences in risk score between dead and alive patients with PC.
(I) Alluvial diagram of cuproptosis subtype distributions in groups
with different risk scores, molecular subtypes and survival
outcomes. (J) Differences in risk score between CG clusters and
gene subtypes (data were analyzed using the Mann-Whitney U test).
(K) Association analysis between tumorigenesis-associated pathways
and the selected genes. LASSO, least absolute shrinkage and
selection operator; CG, cuproptosis-related gene; PC, pancreatic
cancer; TCGA, The Cancer Genome Atlas; ICGC, International Cancer
Genome Consortium; PC, pancreatic cancer; MIR3677, microRNA-3677;
UPK2, uroplakin-2; LDHAP7, lactate dehydrogenase A pseudogene 7;
FAM83A, family member with sequence similarity 83. |
The risk score profile, as depicted in Fig. 4C and D, demonstrated a direct
association between an elevated risk score, decreased OS and
heightened mortality. A heatmap indicating the selected candidates
is provided in Fig. S3.
Kaplan-Meier analyses robustly affirmed that a high-risk score was
predictive of significantly lower OS compared with a low-risk score
in TCGA cohort (P<0.001; Fig.
4E) and the ICGC cohort (P<0.001; Fig. 4F). Notably, the risk score was
significantly higher in deceased patients compared with those
patients who were alive at the time of follow-up in both TCGA and
ICGC cohorts (Fig. 4G and H).
Fig. 4I displayed the distribution
of patients in the two CG clusters and two risk score groups.
Furthermore, Fig. 4J illustrated
the patient distribution across the two CG clusters and two risk
score groups. Notably, patients within CG cluster A displayed a
lower risk score, whereas those in CG cluster B exhibited a higher
risk score. The present study then explored the correlation between
MIR3677, AC068620.2, UPK2, LDHAP7 and FAM83A in the prognostic gene
signature and the enrichment of tumorigenesis-associated pathways;
it was concluded that the majority of tumorigenesis-associated
pathways, such as the ‘TGF-β signaling pathway’, ‘Wnt signaling
pathway’ and ‘TP53 signaling pathway’, were closely associated with
the expression of MIR3677, AC068620.2, LDHAP7 and FAM83A) (Fig. 4K).
Prognostic potential of the
cuproptosis-related signature in different cohorts
Subsequently, nomograms were developed to predict
patient outcomes across different datasets, due to the notable
association between risk score and prognosis. The results
demonstrated that risk score functioned as an independent
prognostic factor for OS, even when accounting for clinical
variables, in patients with PC from both TCGA and ICGC cohorts
(Fig. 5A and D). Furthermore, the
predictive accuracy of the risk score for 1-, 2- and 3-year
survival rates was quantified by calculating the area under the
curve (AUC) in TCGA cohort (0.732, 0.764 and 0.785, respectively)
and the ICGC cohort (0.939, 0.914 and 0.890, respectively)
(Fig. 5B and E). To assess the
predictive precision of risk score compared with clinical variables
for patients with PC, the AUC values for these factors were
calculated (Fig. 5C and F).
Notably, risk score consistently exhibited robust AUC values
comparable with other clinical variables, underscoring its
performance in prognostic assessment for patients with PC.
Furthermore, nomograms were constructed incorporating risk score
and various clinical features tailored to individual patients with
PC (Fig. 5G and H). The results
demonstrated that risk score had notable predictive
performance.
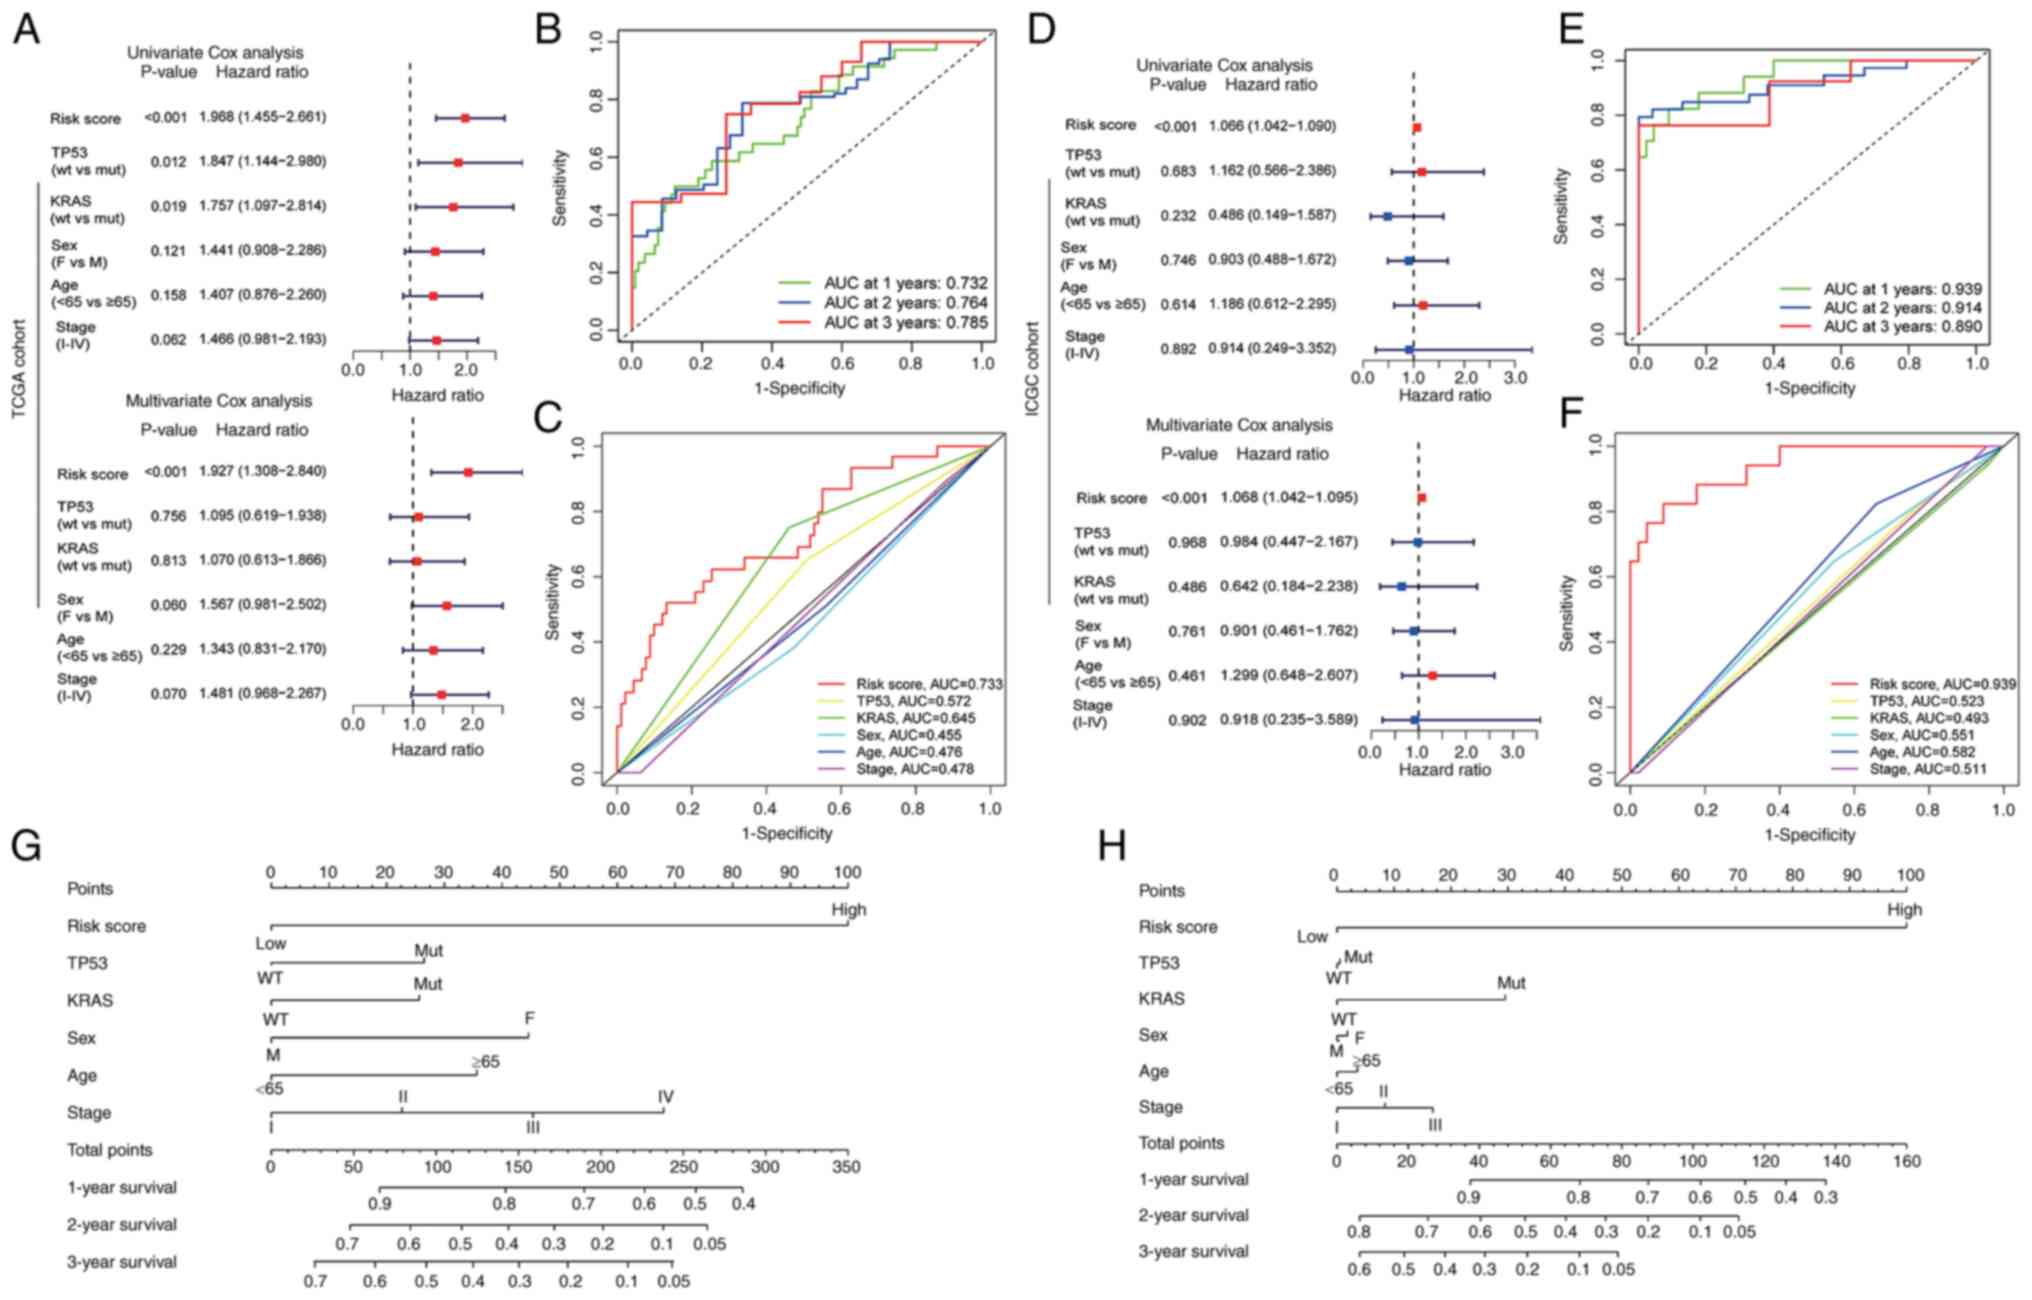 | Figure 5.Prognostic potential of the
cuproptosis-related signature in different cohorts. (A and D)
Univariate and multivariate Cox regression analyses demonstrated
that risk score was an independent risk factor for OS in the (A)
training cohort and (D) validation cohort. (B) ROC curve to predict
the sensitivity and specificity of 1-, 2- and 3-year survival
according to the risk score in TCGA cohort. (E) ROC curve to
predict the sensitivity and specificity of 1-, 2- and 3-year
survival according to the risk score in ICGC cohort. (C)
Time-dependent ROC curve depicting the predictive precision of risk
score and clinical features in TCGA cohort. (F) Time-dependent ROC
curve depicting the predictive precision of risk score and clinical
features in ICGC cohort. (G) Nomogram to predict the 1-, 2- and
3-year OS of patients with pancreatic cancer in TCGA cohort. (H)
Nomogram to predict the 1-, 2- and 3-year OS of patients with
pancreatic cancer in ICGC cohort. ICGC, International Cancer Genome
Consortium; OS, overall survival; ROC, receiver operating
characteristic; TCGA, The Cancer Genome Atlas; AUC, area under the
curve; wt, wild-type; mut, mutant; M, male; F, female. |
Association of immune status and
immunotherapy with the cuproptosis-related signature in PC
The present findings suggested a substantial
association between CG subtypes and stromal accumulation in PC.
Consequently, a comprehensive analysis of the immune interactions
within both high- and low-risk score groups was conducted. A
high-risk score exhibited an inverse relationship with key immune
cell populations, including CD8 and CD4 T cells, B cells, monocytes
and natural killer cells, while demonstrating positive associations
with M0 macrophages, M1 macrophages, neutrophils and CAFs (Fig. 6A; Table
SV). These observations suggested an intricate immune
microenvironment characterized by stromal activation and
immunosuppression in the high-risk score group. Furthermore, the
expression profiles of immune checkpoint proteins (ICPs) were
examined. Within the high-risk score group, significant
upregulation of certain ICPs was observed, including CD70, CD44,
CD276 and VTCN1, while others such as CD200, TNFRSF4, CD160,
ADORA2A and TNFRSF14 exhibited significant downregulation (Fig. 6B). These findings hold promise in
offering potential immunotherapeutic options for the clinical
management of patients with PC.
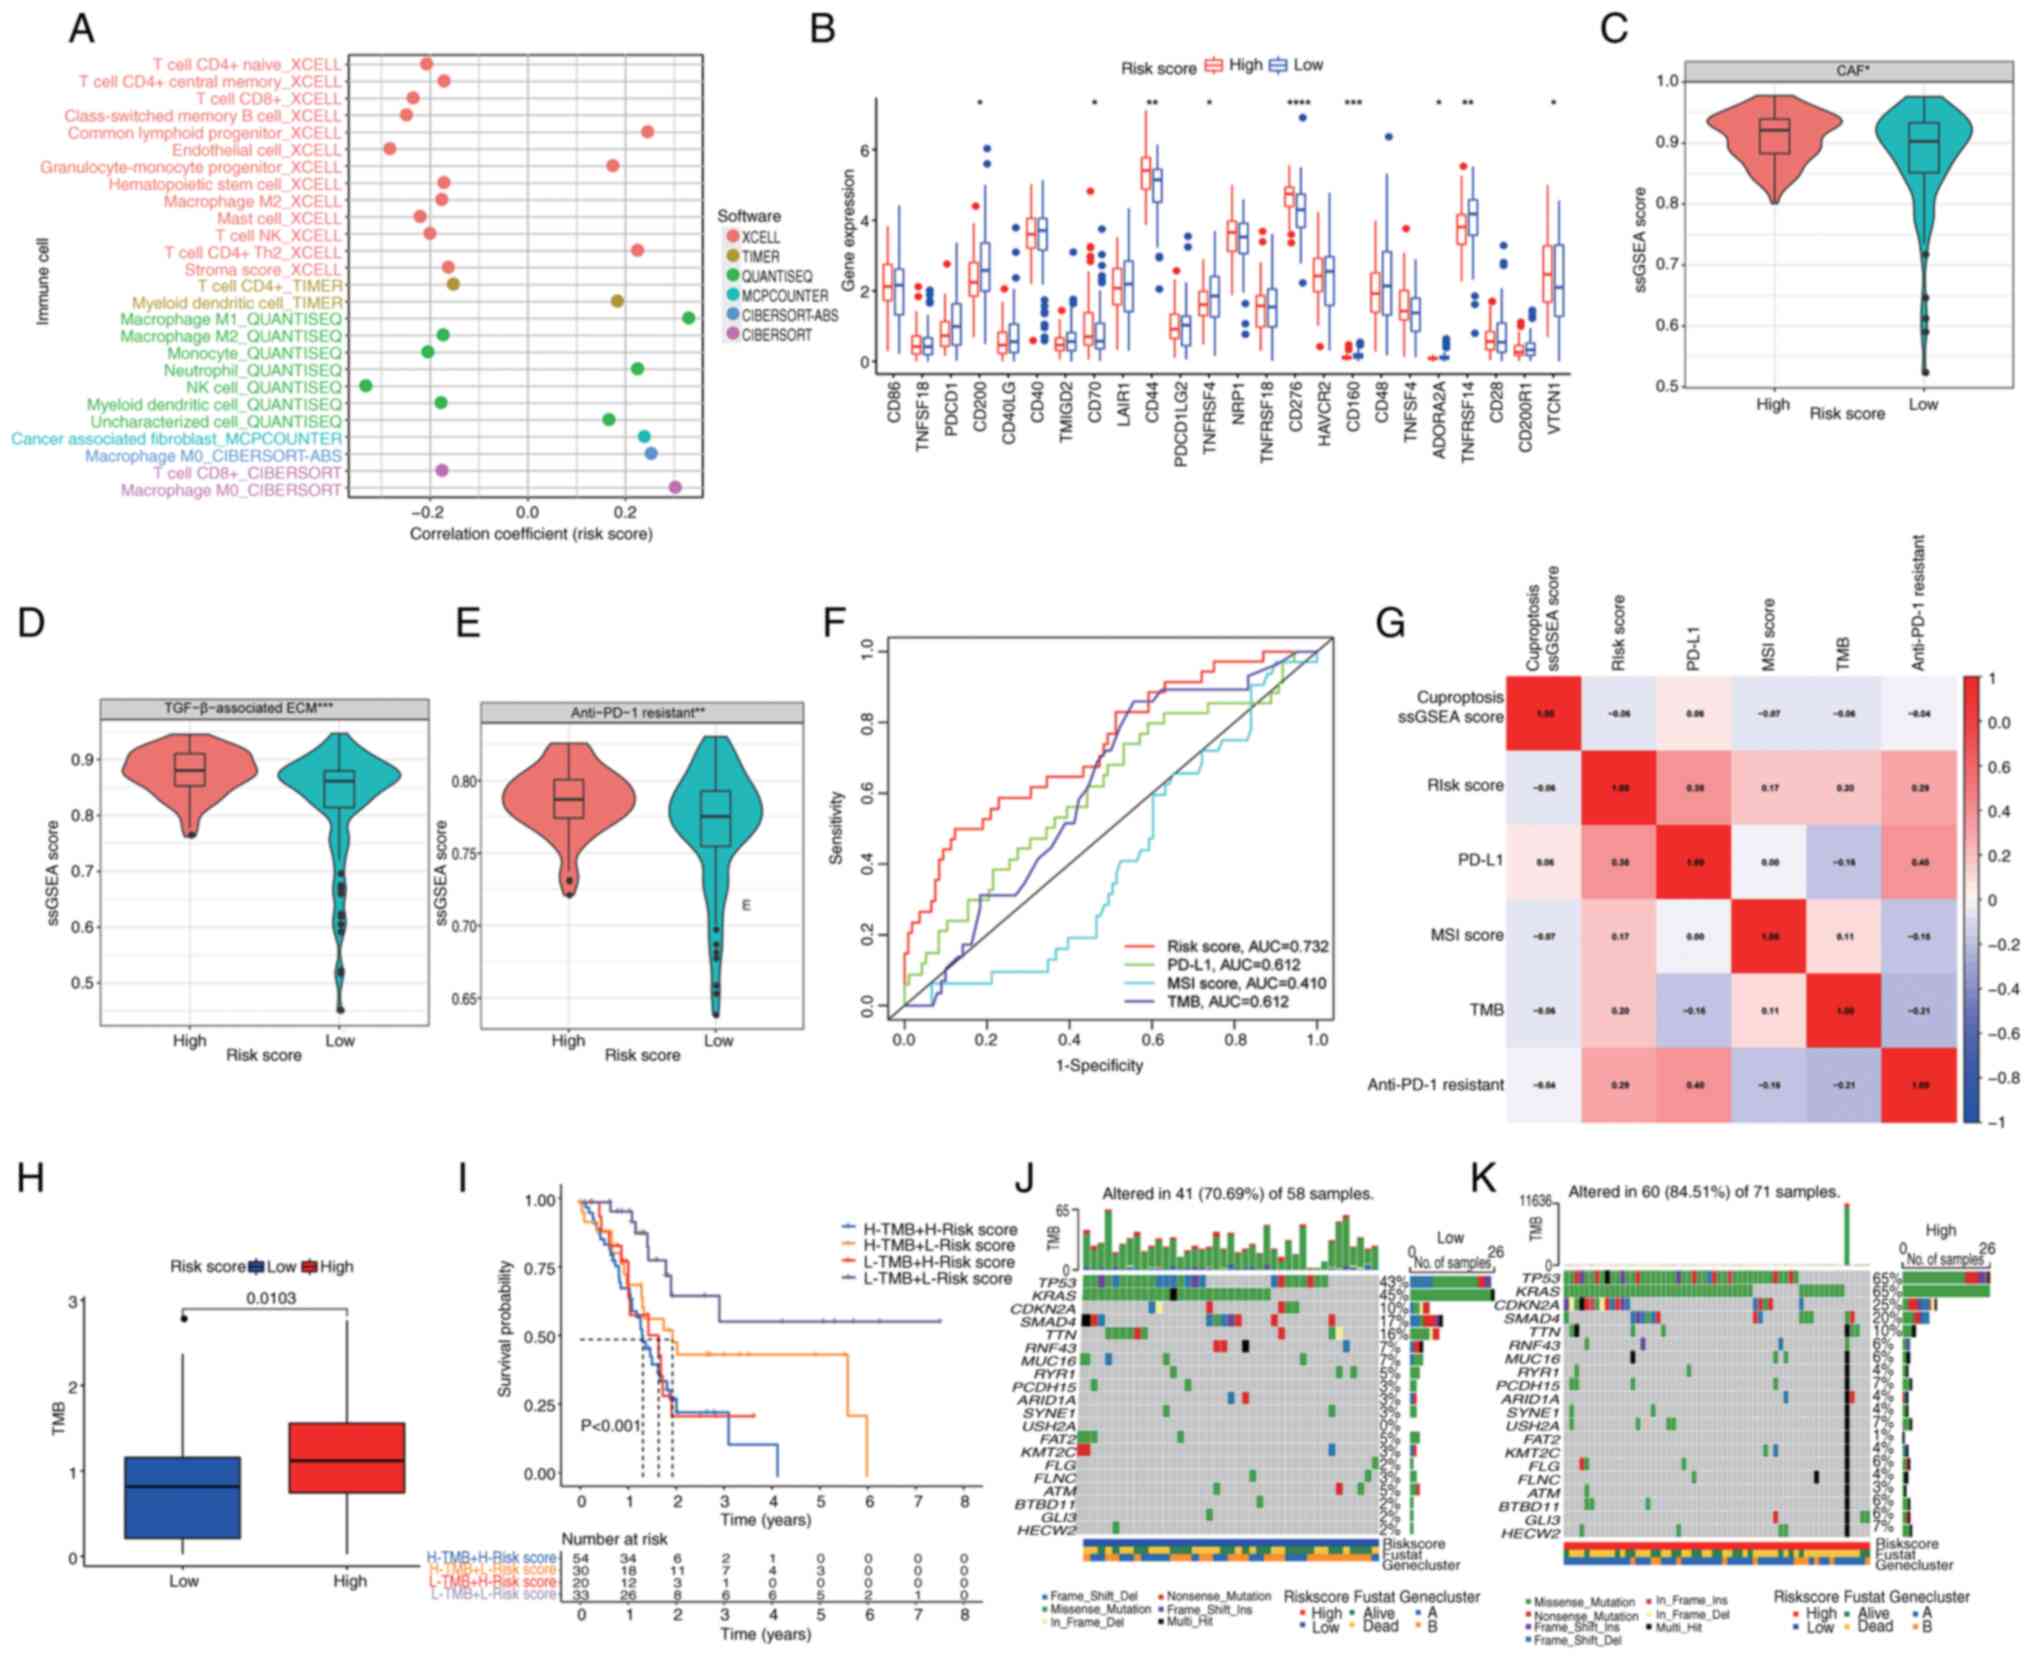 | Figure 6.Association of immune status and
immunotherapy with the cuproptosis-related signature in pancreatic
cancer. (A) Correlation of immune infiltration with risk score. (B)
Boxplots of immune checkpoint gene expression in distinct risk
score groups. Boxplots indicating ssGSEA score of (C) CAFs, (D)
TGF-β-associated ECM and (E) anti-PD-1 immunotherapy response in
different risk score groups. (F) Time-dependent receiver operating
characteristic curves depicting the predictive precision of risk
score and existing biomarkers (PD-L1, MSI score and TMB) for
evaluating the efficacy of immunotherapy. (G) Correlation analysis
between risk score, cuproptosis ssGSEA score, PD-L1, MSI score, TMB
and anti-PD-1 immunotherapy response. (H) TMB in different risk
score groups. (I) Survival analysis among four patient groups
stratified by both TMB and risk score. (J and K) Waterfall plot of
somatic mutation features established with low and high-risk
scores. Each column represents an individual patient. The upper bar
plot indicates TMB, the number on the right indicates the mutation
frequency in each gene. The right bar plot demonstrates the
proportion of each variant type. ****P<0.0001, ***P<0.001,
**P<0.01, *P<0.05, analyzed using the Mann-Whitney U test.
MSI, microsatellite instability; TMB, tumor mutational burden;
ssGSEA, single-sample gene set enrichment analysis; CAFs,
cancer-associated fibroblasts; ECM, extracellular matrix; PD-1,
programmed cell death protein-1; PD-L1, programmed cell death
ligand-1; AUC, area under the curve. |
Considering the well-established association between
stromal activation and tumor immune evasion (47–49),
the present investigation was extended to delineate distinct gene
signatures among patients with different risk scores. Among
patients with a high-risk score, heightened expression of stromal
activation-associated signatures, such as CAFs and the
TGF-β-associated ECM, was observed (Fig. 6C and D). The expression of a
signature associated with resistance to anti-PD-1 therapy was also
more pronounced in patients with a high-risk score (Fig. 6E), suggesting a potential challenge
in achieving favorable responses to anti-PD-1 immunotherapy within
this subgroup. In addition, risk score was compared with currently
known biomarkers [such as PD-L1, microsatellite instability score
and tumor mutational burden (TMB)] to evaluate the efficacy of
immunotherapy and the results revealed that the risk score had
enhanced potential to predict prognosis (Fig. 6F), despite the higher correlation
between PD-L1 and resistance to anti-PD-1 score (Fig. 6G). The aforementioned results
suggested that the risk score may be closely associated with tumor
immunotherapeutic markers and has the potential to be used as a
novel immunotherapeutic marker.
Genomic mutation analysis for the
cuproptosis-related signature
Prior research has consistently demonstrated an
association between TMB and immune infiltration, as well as its
prognostic implications across various types of cancer (50–52).
In the present comprehensive mutation dataset analysis, a
significantly elevated TMB score was observed in the high-risk
score group when compared with the low-risk score group (Fig. 6H). Furthermore, survival analysis
revealed a markedly improved prognosis among patients with lower
TMB scores and lower risk scores compared with higher TMB scores
and higher risk scores (P<0.001; Fig. 6I). PC is characterized by a complex
genetic landscape, with frequent somatic mutations occurring in key
driver genes, notably KRAS, CDKN2A, TP53 and SMAD4 (53). In this context, an in-depth
assessment of the distribution patterns of somatic alterations
between the two distinct risk score groups within TCGA-PAAD cohort
was conducted. Notably, TP53, KRAS, CDKN2 and SMAD4 emerged as the
primary mutated genes in both high- and low-risk score groups
(Fig. 6J and K). Patients
classified in the high-risk score category exhibited substantially
higher frequencies of TP53, KRAS, CDKN2 and SMAD4 mutations
compared with their counterparts in the low-risk score group.
Conversely, the mutation percentages for TTN, RNF43, MUC16 and RYR1
were not significantly different between the groups. These findings
underscore the complex interplay between TMB, risk score and the
genetic landscape of PC, shedding light on potential prognostic
markers and therapeutic options.
Association of the cuproptosis-related
signature with cancer stem cell (CSC) score and clinical outcomes
in PC
CSCs promote tumorigenesis and metastasis in PC
(54,55). PC stem cell proliferation is notably
inhibited by diethyldithiocarbamate-copper complex loaded into
hyaluronic acid-decorated liposomes (56). Therefore, the present study analyzed
the correlation between the cuproptosis-related signature and CSC
index values and a weak correlation was observed between the risk
score and the CSC index (ρ=0.23, P=0.0057; Fig. 7A). There was a higher CSC score in
the high-risk score group compared with that in the low-risk score
group (P=0.0024; Fig. 7B), which
indicates that stem cells have more notable stemness and lower
differentiation characteristics in the high-risk score group.
Furthermore, to investigate the impact of risk score on clinical
outcomes in patients with PC, therapeutic information and clinical
outcomes from TCGA were assessed. As shown in Fig. 7C and D, a high-risk score was
associated with a higher rate of progressive disease and stable
disease.
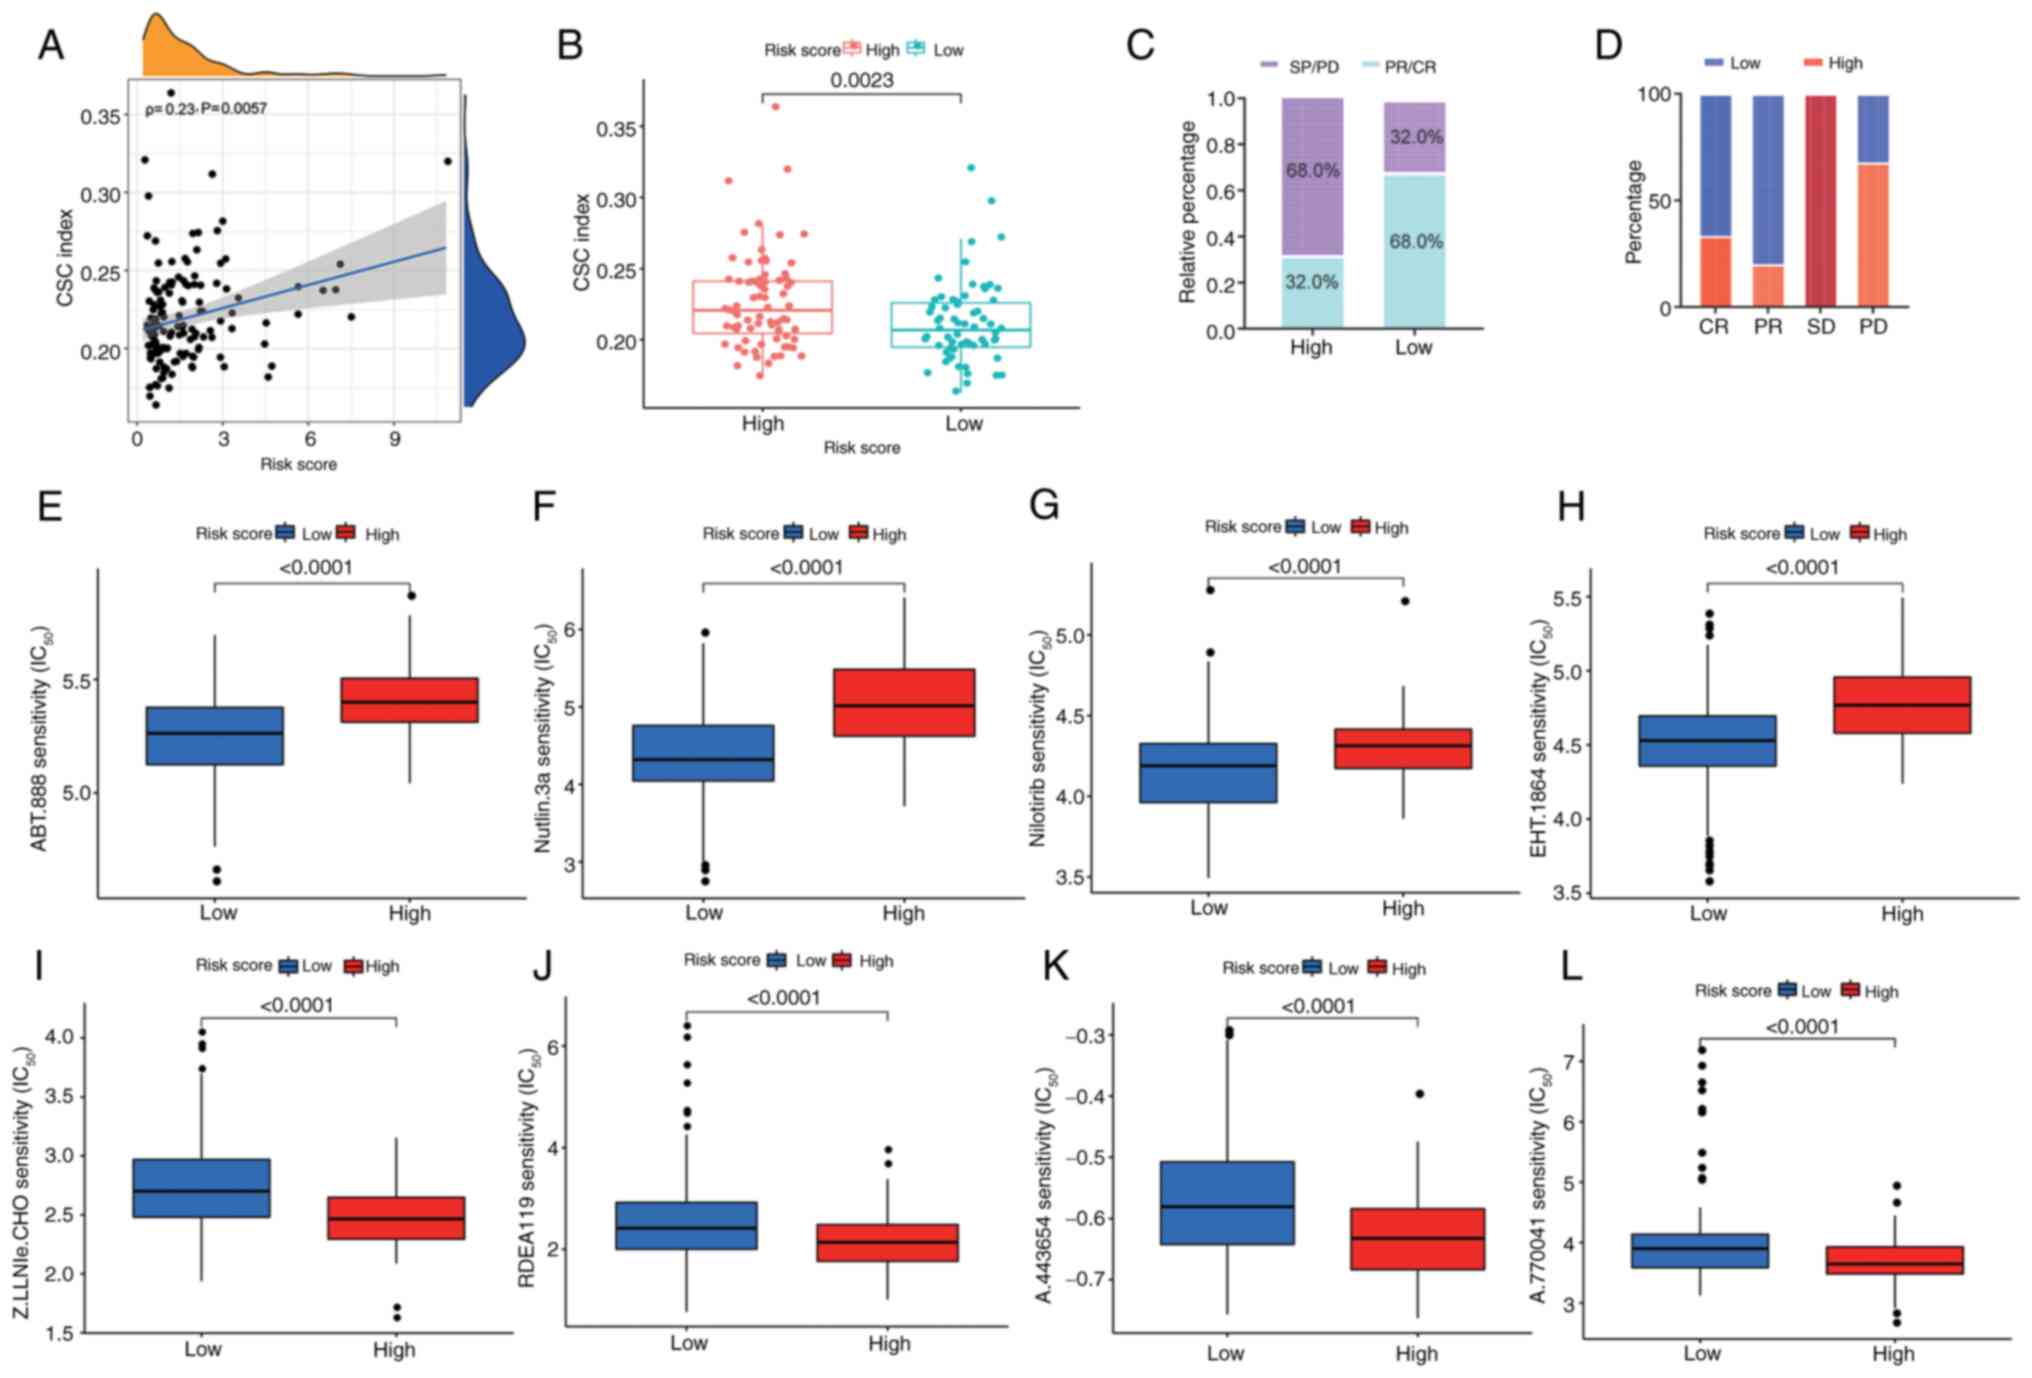 | Figure 7.Associations between
cuproptosis-related signature and CSC score, clinical outcomes and
drug susceptibility in PC. (A) Spearman's rank correlation analysis
of risk score and CSC index. (B) CSC score in distinct risk score
groups. (C) Ratio of worse outcomes after surgery was notably
elevated in the higher risk score group. (D) Proportion of clinical
outcomes in patients with PC with high- and low-risk scores after
surgery. Top four chemotherapeutic drugs, (E) ABT-888, (F)
nutlin-3a, (G) nilotinib and (H) EHT 1864 exhibiting sensitivity
for patients with PC with a low-risk score. Top four
chemotherapeutic drugs (I) Z-LLNle-CHO, (J) RDEA119, (K) A-443654
and (L) A-770041 exhibiting sensitivity for patients with PC with a
high-risk score. Data were analyzed using the Mann-Whitney U test.
CSC, cancer stem cell; PC, pancreatic cancer; SD, stable disease;
PD, progressive disease; CR, complete response; PR, partial
response; IC50, half maximal inhibitory
concentration. |
Drug susceptibility according to the
cuproptosis-related signature
Subsequently, to confirm the efficacy of risk score
as a predictive biomarker for therapeutic response in patients with
PC, the IC50 values of 138 chemotherapeutic drugs from
the GDSC dataset were assessed in TCGA-PAAD dataset. A total of 29
drugs were more sensitive in patients with a low-risk score
(P<0.05; Table SVI), among
which the leading chemotherapeutic agents were: ABT-888, nutlin-3a,
nilotinib and EHT 1864 (Fig. 7E-H).
A total of 54 drugs demonstrated an improved response in patients
with a high-risk score (P<0.05; Table SVII), among which the top four
chemotherapeutic drugs were Z-LLNle-CHO, RDEA119, A-443654 and
A-770041 (Fig. 7I-L). Together,
these findings indicated that risk score may be associated with
drug sensitivity.
Discussion
For patients with advanced PC, conventional
treatments including chemotherapy and targeted therapy have little
effect on improving prognoses and limiting tumor progression
(3,7,23,47,49).
It is therefore urgent to screen valuable biomarkers that can
classify patients with different molecular characteristics into
diverse subgroups, and predict prognosis and treatment. Copper
accumulation triggers mitochondrial-driven cell death, known as
cuproptosis, which is associated with tumor progression (20,21,32,57).
Hence, exploring the regulatory effects of cuproptosis on tumors
and its molecular mechanisms is key, as it may provide novel
directions and strategies for clinical cancer treatment.
The present study indicated that apoptosis,
necroptosis, pyroptosis and ferroptosis were aberrantly
hyperactivated in PC tissues and cuproptosis exhibited the only
protective effect on survival compared with the other cell death
modes. The present study further analyzed the gene variants of CGs.
Among 10 CGs, the frequency of CDKN2A mutations was the highest.
Correlation analysis revealed that CDKN2A and DLAT were associated
with cuproptosis score. The aggregation of gene mutations leads to
tumorigenesis and gene mutations in PC, which may notably impact
immunotherapy response. It has been reported that mutations in
CDKN2A are frequently identified in a number of primary tumors and
patients with melanoma carrying CDKN2A gene mutations respond
better to immunotherapy (50). The
latest research has indicated that copper nanoparticles enhance
cuproptosis and immunotherapy response in PC (58). This evidence suggests that CDKN2A
mutations may be associated with cuproptosis and could affect
immunotherapy. The present study further verified the protein level
of CGs using PC proteomics analysis and the results indicated an
inconsistency between the protein and transcription levels of CGs,
which may be associated with the heterogeneity in human tissue and
plasma samples.
Previous studies have shown that the combination of
Tussah silk fibroin nanoparticles and PD-L1 effectively induces
cuproptosis and reshapes the TME in PC (59,60).
In addition, advanced cancer-infiltrating and killing abilities of
natural killer, CD8+ T cells and neutrophils have been
reported to be associated with FDX1 expression; the levels of FDX1
are decreased in several types of cancer and reflect the level of
immune cell infiltration (61).
Targeted activation of cuproptosis pathways may favor re-activation
of the TME towards the eradication of cancer cells (57). Targeted activation of CGs may be
investigated as priming or contributing factors for improving
current immune checkpoint inhibitor (ICI) immunotherapy (20,24).
PC is characterized by extensive stromal
involvement, which makes classifying precise tumor-specific
molecular subtypes difficult (47).
Stromal cells, as a vital component of the TME, serve an important
role in monitoring tumor immune evasion, even in the presence of
abundant immune cells. Increasing evidence has also shown the
effects of stromal cells on tumor progression and therapeutic
resistance (30,46). Consistently, the present study
revealed that the patients with PC in CG cluster B had a worse OS
and a higher stromal score, as well as increased enrichment of
Tregs, CAFs, TGF-β-associated ECM and anti-PD-1 resistance, thus
limiting antitumor immunity and leading to poor survival. Previous
studies have demonstrated that CAFs can attract Tregs and enhance
the capacity of inhibiting effector T-cell proliferation (62,63).
In addition, TGF-β-associated ECM has been shown to be associated
with CAFs, immune evasion and immunotherapy failure (48,64).
Furthermore, stromal activation signatures, such as CAFs and
TGF-β-associated ECM, were highly expressed in patients with a
high-risk score. Notably, a higher anti-PD-1 resistant-related
signature was also observed in the high-risk score group,
confirming the existing conclusions. Thus, based on the
aforementioned results, one possible mechanism for CGs in the PC
TME was suggested: CGs could stimulate extensive stromal
involvement of tumors and regulate CAF activation, as well as
TGF-β-associated ECM hyperactivation, which in turn may recruit
immunosuppressive cell populations, such as Tregs, causing tumor
immune escape.
In addition, a CG signature was established to
predict clinical outcome, immunotherapy response and chemotherapy
susceptibility in PC. By integrating the risk score and clinical
variables, a quantitative nomogram was generated to further improve
the performance and facilitate the clinical utility of the
signature. To determine potential drug therapy targets for patients
with PC, the present study identified the potential sensitive drugs
for patients in diverse risk score groups. The results indicated
that the risk score may be a robust prognostic biomarker, which
could contribute to precise risk stratifications and offer clues
for combining customized prognostic prediction with individualized
therapy. For patients with a high-risk score, the present study
identified the latent therapeutic drugs that could effectively
improve their survival. For patients with a low-risk score,
clinicians may consider adopting ICI immunotherapy to improve the
survival of patients with PC.
In conclusion, these findings highlighted the
overall phenotypic role of CGs in PC and identified obvious
differences in prognosis, clinical features and TME characteristics
between two CG subtypes. Furthermore, a novel prognostic CG
signature was defined in PC; this CG score may act as a robust
prognostic indicator for patients with PC, which offers potential
for precise risk stratification and predictive markers for
effective immunotherapy strategies.
However, certain limitations of the present study
should be acknowledged. First, the present study did not include
any datasets associated with immunotherapy for PC and could not be
verified, therefore future research is warranted for the validation
in PC immunotherapy datasets. Second, the CG scoring system is a
gene set consisting of five genes, thus, it cannot be quantified in
in vivo and in vitro experiments. The utility of the
CG scoring system is limited to retrospective studies of tumor
tissue specimens; therefore, future studies can evaluate and select
the most valuable genes for experimental verification.
Supplementary Material
Supporting Data
Supporting Data
Acknowledgements
Not applicable.
Funding
The present study was funded by the National Natural Science
Foundation of China (grant no. 82403378), the China National
Postdoctoral Program for Innovative Talents (grant no. BX20240072)
and the China Postdoctoral Science Foundation (grant no.
2024M750525).
Availability of data and materials
The data generated in the present study may be
requested from the corresponding author.
Authors' contributions
WG conceptualized and designed the present study,
prepared the materials, collected data, performed the data analysis
and wrote first draft of the manuscript. YoW and DS prepared the
materials, collected data and revised the manuscript. MY and YaW
cultivated pancreatic cancer cell lines, prepared the total
cellular RNA samples and reviewed the manuscript. WG, YoW, DS, MY
and YaW confirm the authenticity of the data in the present study.
All authors read and approved the final manuscript.
Ethics approval and consent to
participate
Not applicable.
Patient consent for publication
Not applicable.
Competing interests
The authors declare that they have no competing
interests.
References
|
1
|
Siegel RL, Giaquinto AN and Jemal A:
Cancer statistics, 2024. CA Cancer J Clin. 74:12–49.
2024.PubMed/NCBI
|
|
2
|
Stoop TF, Javed AA, Oba A, Koerkamp BG,
Seufferlein T, Wilmink JW and Besselink MG: Pancreatic cancer.
Lancet. 405:1182–1202. 2025. View Article : Google Scholar : PubMed/NCBI
|
|
3
|
Cai J, Chen H, Lu M, Zhang Y, Lu B, You L,
Zhang T, Dai M and Zhao Y: Advances in the epidemiology of
pancreatic cancer: Trends, risk factors, screening, and prognosis.
Cancer Lett. 520:1–11. 2021. View Article : Google Scholar : PubMed/NCBI
|
|
4
|
Bergman PJ: Cancer immunotherapy. Vet Clin
North Am Small Anim Pract. 54:441–468. 2024. View Article : Google Scholar : PubMed/NCBI
|
|
5
|
Yang K, Halima A and Chan TA: Antigen
presentation in cancer-mechanisms and clinical implications for
immunotherapy. Nat Rev Clin Oncol. 20:604–623. 2023. View Article : Google Scholar : PubMed/NCBI
|
|
6
|
Bednar F and Pasca di Magliano M:
Context-dependent immune responses explain pancreatic cancer
immunoresistance. Cancer Cell. 37:261–263. 2020. View Article : Google Scholar : PubMed/NCBI
|
|
7
|
Farhangnia P, Khorramdelazad H, Nickho H
and Delbandi AA: Current and future immunotherapeutic approaches in
pancreatic cancer treatment. J Hematol Oncol. 17:402024. View Article : Google Scholar : PubMed/NCBI
|
|
8
|
Fan JQ, Wang MF, Chen HL, Shang D, Das JK
and Song J: Current advances and outlooks in immunotherapy for
pancreatic ductal adenocarcinoma. Mol Cancer. 19:322020. View Article : Google Scholar : PubMed/NCBI
|
|
9
|
Gibellini L and Moro L: Programmed cell
death in health and disease. Cells. 10:17652021. View Article : Google Scholar : PubMed/NCBI
|
|
10
|
Tong X, Tang R, Xiao M, Xu J, Wang W,
Zhang B, Liu J, Yu X and Shi S: Targeting cell death pathways for
cancer therapy: Recent developments in necroptosis, pyroptosis,
ferroptosis, and cuproptosis research. J Hematol Oncol. 15:1742022.
View Article : Google Scholar : PubMed/NCBI
|
|
11
|
Liu Y, Fleishman JS, Wang H and Huo L:
Pharmacologically targeting ferroptosis and cuproptosis in
neuroblastoma. Mol Neurobiol. 62:3863–3876. 2025. View Article : Google Scholar : PubMed/NCBI
|
|
12
|
Tsang T, Davis CI and Brady DC: Copper
biology. Curr Biol. 31:R421–R427. 2021. View Article : Google Scholar : PubMed/NCBI
|
|
13
|
Chen L, Min J and Wang F: Copper
homeostasis and cuproptosis in health and disease. Signal Transduct
Target Ther. 7:3782022. View Article : Google Scholar : PubMed/NCBI
|
|
14
|
Kahlson MA and Dixon SJ: Copper-induced
cell death. Science. 375:1231–1232. 2022. View Article : Google Scholar : PubMed/NCBI
|
|
15
|
Tsvetkov P, Coy S, Petrova B, Dreishpoon
M, Verma A, Abdusamad M, Rossen J, Joesch-Cohen L, Humeidi R,
Spangler RD, et al: Copper induces cell death by targeting
lipoylated TCA cycle proteins. Science. 375:1254–1261. 2022.
View Article : Google Scholar : PubMed/NCBI
|
|
16
|
Tang D, Chen X and Kroemer G: Cuproptosis:
A copper-triggered modality of mitochondrial cell death. Cell Res.
32:417–418. 2022. View Article : Google Scholar : PubMed/NCBI
|
|
17
|
Sun L, Zhang Y, Yang B, Sun S, Zhang P,
Luo Z, Feng T, Cui Z, Zhu T, Li Y, et al: Lactylation of METTL16
promotes cuproptosis via m6A-modification on FDX1 mRNA
in gastric cancer. Nat Commun. 14:65232023. View Article : Google Scholar : PubMed/NCBI
|
|
18
|
Jiang Y, Huo Z, Qi X, Zuo T and Wu Z:
Copper-induced tumor cell death mechanisms and antitumor
theragnostic applications of copper complexes. Nanomedicine (Lond).
17:303–324. 2022. View Article : Google Scholar : PubMed/NCBI
|
|
19
|
Tang D, Kroemer G and Kang R: Targeting
cuproplasia and cuproptosis in cancer. Nat Rev Clin Oncol.
21:370–388. 2024. View Article : Google Scholar : PubMed/NCBI
|
|
20
|
Liu WQ, Lin WR, Yan L, Xu WH and Yang J:
Copper homeostasis and cuproptosis in cancer immunity and therapy.
Immunol Rev. 321:211–227. 2024. View Article : Google Scholar : PubMed/NCBI
|
|
21
|
Xie J, Yang Y, Gao Y and He J:
Cuproptosis: Mechanisms and links with cancers. Mol Cancer.
22:462023. View Article : Google Scholar : PubMed/NCBI
|
|
22
|
Tarin M, Babaie M, Eshghi H, Matin MM and
Saljooghi AS: Elesclomol, a copper-transporting therapeutic agent
targeting mitochondria: From discovery to its novel applications. J
Transl Med. 21:7452023. View Article : Google Scholar : PubMed/NCBI
|
|
23
|
O'Day S, Gonzalez R, Lawson D, Weber R,
Hutchins L, Anderson C, Haddad J, Kong S, Williams A and Jacobson
E: Phase II, randomized, controlled, double-blinded trial of weekly
elesclomol plus paclitaxel versus paclitaxel alone for stage IV
metastatic melanoma. J Clin Oncol. 27:5452–5458. 2009. View Article : Google Scholar : PubMed/NCBI
|
|
24
|
Qin Y, Liu Y, Xiang X, Long X, Chen Z,
Huang X, Yang J and Li W: Cuproptosis correlates with
immunosuppressive tumor microenvironment based on pan-cancer
multiomics and single-cell sequencing analysis. Mol Cancer.
22:592023. View Article : Google Scholar : PubMed/NCBI
|
|
25
|
Gadiyar V, Lahey KC, Calianese D, Devoe C,
Mehta D, Bono K, Desind S, Davra V and Birge RB: Cell death in the
tumor microenvironment: Implications for cancer immunotherapy.
Cells. 9:22072020. View Article : Google Scholar : PubMed/NCBI
|
|
26
|
Gao L, Shay C and Teng Y: Cell death
shapes cancer immunity: Spotlighting PANoptosis. J Exp Clin Cancer
Res. 43:1682024. View Article : Google Scholar : PubMed/NCBI
|
|
27
|
Hänggi K and Ruffell B: Cell death,
therapeutics, and the immune response in cancer. Trends Cancer.
9:381–396. 2023. View Article : Google Scholar : PubMed/NCBI
|
|
28
|
Zhou Q, Meng Y, Li D, Yao L, Le J, Liu Y,
Sun Y, Zeng F, Chen X and Deng G: Ferroptosis in cancer: From
molecular mechanisms to therapeutic strategies. Signal Transduct
Target Ther. 9:552024. View Article : Google Scholar : PubMed/NCBI
|
|
29
|
Du T, Gao J, Li P, Wang Y, Qi Q, Liu X, Li
J, Wang C and Du L: Pyroptosis, metabolism, and tumor immune
microenvironment. Clin Transl Med. 11:e4922021. View Article : Google Scholar : PubMed/NCBI
|
|
30
|
Han X, Zhang WH, Wang WQ, Yu XJ and Liu L:
Cancer-associated fibroblasts in therapeutic resistance of
pancreatic cancer: Present situation, predicaments, and
perspectives. Biochim Biophys Acta Rev Cancer. 1874:1884442020.
View Article : Google Scholar : PubMed/NCBI
|
|
31
|
Storrs EP, Chati P, Usmani A, Sloan I,
Krasnick BA, Babbra R, Harris PK, Sachs CM, Qaium F, Chatterjee D,
et al: High-dimensional deconstruction of pancreatic cancer
identifies tumor microenvironmental and developmental stemness
features that predict survival. NPJ Precis Oncol. 7:1052023.
View Article : Google Scholar : PubMed/NCBI
|
|
32
|
Wang W, Lu K, Jiang X, Wei Q, Zhu L, Wang
X, Jin H and Feng L: Ferroptosis inducers enhanced cuproptosis
induced by copper ionophores in primary liver cancer. J Exp Clin
Cancer Res. 42:1422023. View Article : Google Scholar : PubMed/NCBI
|
|
33
|
Reggiardo RE, Maroli SV, Peddu V, Davidson
AE, Hill A, LaMontagne E, Aaraj YA, Jain M, Chan SY and Kim DH:
Profiling of repetitive RNA sequences in the blood plasma of
patients with cancer. Nat Biomed Eng. 7:1627–1635. 2023. View Article : Google Scholar : PubMed/NCBI
|
|
34
|
Song CX, Yin S, Ma L, Wheeler A, Chen Y,
Zhang Y, Liu B, Xiong J, Zhang W, Hu J, et al:
5-Hydroxymethylcytosine signatures in cell-free DNA provide
information about tumor types and stages. Cell Res. 27:1231–1242.
2017. View Article : Google Scholar : PubMed/NCBI
|
|
35
|
Digre A and Lindskog C: The human protein
atlas-spatial localization of the human proteome in health and
disease. Protein Sci. 30:218–233. 2021. View Article : Google Scholar : PubMed/NCBI
|
|
36
|
Sabah A, Tiun S, Sani NS, Ayob M and Taha
AY: Enhancing web search result clustering model based on multiview
multirepresentation consensus cluster ensemble (mmcc) approach.
PLoS One. 16:e02452642021. View Article : Google Scholar : PubMed/NCBI
|
|
37
|
Seiler M, Huang CC, Szalma S and Bhanot G:
ConsensusCluster: A software tool for unsupervised cluster
discovery in numerical data. OMICS. 14:109–113. 2010. View Article : Google Scholar : PubMed/NCBI
|
|
38
|
Hänzelmann S, Castelo R and Guinney J:
GSVA: Gene set variation analysis for microarray and RNA-seq data.
BMC. 14:72013.
|
|
39
|
Wu D, Liu Y, Liu J, Ma L and Tong X:
Myeloid cell differentiation-related gene signature for predicting
clinical outcome, immune microenvironment, and treatment response
in lung adenocarcinoma. Sci Rep. 14:174602024. View Article : Google Scholar : PubMed/NCBI
|
|
40
|
Huang L, Wu C, Xu D, Cui Y and Tang J:
Screening of important factors in the early sepsis stage based on
the evaluation of ssGSEA algorithm and ceRNA regulatory network.
Evol Bioinform Online. 17:117693432110584632021. View Article : Google Scholar : PubMed/NCBI
|
|
41
|
Ritchie ME, Phipson B, Wu D, Hu Y, Law CW,
Shi W and Smyth GK: limma powers differential expression analyses
for RNA-sequencing and microarray studies. Nucleic Acids Res.
43:e472015. View Article : Google Scholar : PubMed/NCBI
|
|
42
|
Livak KJ and Schmittgen TD: Analysis of
relative gene expression data using real-time quantitative PCR and
the 2(−Delta Delta C(T)) method. Methods. 25:402–408. 2001.
View Article : Google Scholar : PubMed/NCBI
|
|
43
|
Mayakonda A, Lin DC, Assenov Y, Plass C
and Koeffler HP: Maftools: Efficient and comprehensive analysis of
somatic variants in cancer. Genome Res. 28:1747–1756. 2018.
View Article : Google Scholar : PubMed/NCBI
|
|
44
|
Geeleher P, Cox N and Huang RS:
pRRophetic: An R package for prediction of clinical
chemotherapeutic response from tumor gene expression levels. PLoS
One. 9:e1074682014. View Article : Google Scholar : PubMed/NCBI
|
|
45
|
Ringnér M: What is principal component
analysis? Nat Biotechnol. 26:303–304. 2008. View Article : Google Scholar : PubMed/NCBI
|
|
46
|
Sherman MH and Beatty GL: Tumor
microenvironment in pancreatic cancer pathogenesis and therapeutic
resistance. Annu Rev Pathol. 18:123–148. 2023. View Article : Google Scholar : PubMed/NCBI
|
|
47
|
Moffitt RA, Marayati R, Flate EL, Volmar
KE, Loeza SG, Hoadley KA, Rashid NU, Williams LA, Eaton SC, Chung
AH, et al: Virtual microdissection identifies distinct tumor- and
stroma-specific subtypes of pancreatic ductal adenocarcinoma. Nat
Genet. 47:1168–1178. 2015. View Article : Google Scholar : PubMed/NCBI
|
|
48
|
Chakravarthy A, Khan L, Bensler NP, Bose P
and De Carvalho DD: TGF-β-associated extracellular matrix genes
link cancer-associated fibroblasts to immune evasion and
immunotherapy failure. Nat Commun. 9:46922018. View Article : Google Scholar : PubMed/NCBI
|
|
49
|
Collisson EA, Sadanandam A, Olson P, Gibb
WJ, Truitt M, Gu S, Cooc J, Weinkle J, Kim GE, Jakkula L, et al:
Subtypes of pancreatic ductal adenocarcinoma and their differing
responses to therapy. Nat Med. 17:500–503. 2011. View Article : Google Scholar : PubMed/NCBI
|
|
50
|
Samstein RM, Lee CH, Shoushtari AN,
Hellmann MD, Shen R, Janjigian YY, Barron DA, Zehir A, Jordan EJ,
Omuro A, et al: Tumor mutational load predicts survival after
immunotherapy across multiple cancer types. Nat Genet. 51:202–206.
2019. View Article : Google Scholar : PubMed/NCBI
|
|
51
|
Kang K, Xie F, Mao J, Bai Y and Wang X:
Significance of tumor mutation burden in immune infiltration and
prognosis in cutaneous melanoma. Front Oncol. 10:5731412020.
View Article : Google Scholar : PubMed/NCBI
|
|
52
|
McNamara MG, Jacobs T, Lamarca A, Hubner
RA, Valle JW and Amir E: Impact of high tumor mutational burden in
solid tumors and challenges for biomarker application. Cancer Treat
Rev. 89:1020842020. View Article : Google Scholar : PubMed/NCBI
|
|
53
|
Hayashi A, Hong J and Iacobuzio-Donahue
CA: The pancreatic cancer genome revisited. Nat Rev Gastroenterol
Hepatol. 18:469–481. 2021. View Article : Google Scholar : PubMed/NCBI
|
|
54
|
Leng S, Huang W, Chen Y, Yang Y, Feng D,
Liu W, Gao T, Ren Y, Huo M, Zhang J, et al: SIRT1 coordinates with
the CRL4B complex to regulate pancreatic cancer stem cells to
promote tumorigenesis. Cell Death Differ. 28:3329–3343. 2021.
View Article : Google Scholar : PubMed/NCBI
|
|
55
|
Li C, Heidt DG, Dalerba P, Burant CF,
Zhang L, Adsay V, Wicha M, Clarke MF and Simeone DM: Identification
of pancreatic cancer stem cells. Cancer Res. 67:1030–1037. 2007.
View Article : Google Scholar : PubMed/NCBI
|
|
56
|
Marengo A, Forciniti S, Dando I, Dalla
Pozza E, Stella B, Tsapis N, Yagoubi N, Fanelli G, Fattal E,
Heeschen C, et al: Pancreatic cancer stem cell proliferation is
strongly inhibited by diethyldithiocarbamate-copper complex loaded
into hyaluronic acid decorated liposomes. Biochim Biophys Acta Gen
Subj. 1863:61–72. 2019. View Article : Google Scholar : PubMed/NCBI
|
|
57
|
Babak MV and Ahn D: Modulation of
intracellular copper levels as the mechanism of action of
anticancer copper complexes: Clinical relevance. Biomedicines.
9:8522021. View Article : Google Scholar : PubMed/NCBI
|
|
58
|
Helgadottir H, Ghiorzo P, van Doorn R,
Puig S, Levin M, Kefford R, Lauss M, Queirolo P, Pastorino L,
Kapiteijn E, et al: Efficacy of novel immunotherapy regimens in
patients with metastatic melanoma with germline CDKN2A mutations. J
Med Genet. 57:316–321. 2020. View Article : Google Scholar : PubMed/NCBI
|
|
59
|
Wang P, Guo W, Liu S, Li S, Li J, Ding B,
Yin F, Yang Y, Li X, Cao P, et al: Novel simplePt@PCN-Cu-induced
cuproptosis amplifies αPD-L1 immunotherapy in pancreatic ductal
adenocarcinoma through mitochondrial HK2-mediated PD-L1
upregulation. J Exp Clin Cancer Res. 44:1492025. View Article : Google Scholar : PubMed/NCBI
|
|
60
|
Gao S, Ge H, Gao L, Gao Y, Tang S, Li Y,
Yuan Z and Chen W: Silk Fibroin nanoparticles for enhanced
cuproptosis and immunotherapy in pancreatic cancer treatment. Adv
Sci (Weinh). 12:e24176762025. View Article : Google Scholar : PubMed/NCBI
|
|
61
|
Zhang C, Zeng Y, Guo X, Shen H, Zhang J,
Wang K, Ji M and Huang S: Pan-cancer analyses confirmed the
cuproptosis-related gene FDX1 as an immunotherapy predictor and
prognostic biomarker. Front Genet. 13:9237372022. View Article : Google Scholar : PubMed/NCBI
|
|
62
|
Costa A, Kieffer Y, Scholer-Dahirel A,
Pelon F, Bourachot B, Cardon M, Sirven P, Magagna I, Fuhrmann L,
Bernard C, et al: Fibroblast heterogeneity and immunosuppressive
environment in human breast cancer. Cancer Cell. 33:463–479.e10.
2018. View Article : Google Scholar : PubMed/NCBI
|
|
63
|
Huang H, Wang Z, Zhang Y, Pradhan RN,
Ganguly D, Chandra R, Murimwa G, Wright S, Gu X, Maddipati R, et
al: Mesothelial cell-derived antigen-presenting cancer-associated
fibroblasts induce expansion of regulatory T cells in pancreatic
cancer. Cancer Cell. 40:656–673.e7. 2022. View Article : Google Scholar : PubMed/NCBI
|
|
64
|
Derynck R, Turley SJ and Akhurst RJ: TGFβ
biology in cancer progression and immunotherapy. Nat Rev Clin
Oncol. 18:9–34. 2021. View Article : Google Scholar : PubMed/NCBI
|


