Introduction
Adrenocortical carcinoma (ACC) is a rare and highly
aggressive malignancy arising from steroidogenic cells of the
adrenal cortex, characterized by a 5-year overall survival rate of
>35% (1). Radical surgical
resection remains the only curative approach for localized ACC;
however, postoperative recurrence rates are high, ranging between
70–80% (2). For advanced or
metastatic ACC, therapeutic options are limited. Mitotane, the only
Food and Drug Administration (FDA)-approved agent, demonstrates
suboptimal efficacy and substantial toxicity (3). Combination chemotherapy regimens such
as mitotane with etoposide, doxorubicin and cisplatin yields modest
clinical benefit, with an objective response rate of ~30% and a
median progression-free survival of 5.6 months (4). These limitations underscore an urgent
need to elucidate the molecular mechanisms underlying ACC
progression and to identify robust biomarkers for early diagnosis,
risk stratification and development of targeted therapeutics.
Reprogramming of cancer cell metabolism is a
hallmark of malignancy, with aerobic glycolysis (‘Warburg effect’)
facilitating increased glucose uptake and lactate production, which
acidifies the tumor microenvironment (TME) and supports migration
and immune evasion (5–7). Dysregulated expression and activity of
glycolytic enzymes are central to this phenotype (8). Ephrin-A3 (EFNA3), a transmembrane
ligand of the Eph receptor tyrosine kinase family, has been
implicated in metabolic regulation and tumor progression (9,10).
EFNA3 participates in bidirectional cell-cell communication through
interactions with Eph receptors, modulating processes such as
angiogenesis, cellular motility and tissue remodeling (11). Notably, EFNA3 functions as a
glycolysis-related gene. Previous studies indicate that EFNA3
upregulation promotes glycolytic flux and proliferation in lung
adenocarcinoma, correlating with unfavorable prognosis (12–14),
suggesting potential roles as both a metabolic regulator and
oncogenic driver.
Members of the EFNA gene family, including EFNA1 and
EFNA2, exhibit distinct expression and functional profiles across
tumor types. EFNA1 is frequently upregulated in various types of
cancer, such as gastric cancer and melanomas, and is linked to
angiogenesis, immune modulation and metastatic potential via
interactions with EphA2 and hypoxia-inducible signaling (15–18).
Conversely, EFNA2 expression is reduced in certain types of cancer
such as gastric carcinoma, with inverse associations to
CD8+ T-cell and dendritic cell infiltration, implicating
it in immune surveillance escape (19–21).
High EFNA3 expression levels are predictive of poorer survival in
gastric cancer and correlate negatively with infiltration of B
cells, T cells and dendritic cells, as well as with immune
checkpoint activity, which indicates a role in immune evasion
(22,23). Beyond its prognostic role, EFNA3
expression has been correlated with immune cell infiltration and
chemotherapeutic response, indicating potential relevance to tumor
immunology and therapeutic resistance (24–26).
The present study aimed to perform an integrative
pan-cancer analysis of EFNA3 to evaluate its transcriptional
deregulation, genetic and epigenetic alterations, prognostic
relevance, associations with tumor immune infiltration and drug
sensitivity, and to construct an EFNA3 ceRNA regulatory network.
Furthermore, the present study aimed to investigate the effects of
EFNA3 on the proliferative, migratory and anti-apoptotic capacities
of ACC cells via in vitro experiments.
Materials and methods
Pan-cancer expression profiling of
EFNA3
Transcriptome data from 15,776 samples were
retrieved via the UCSC Xena Browser (https://xenabrowser.net; The Regents of the University
of California), integrating The Cancer Genome Atlas (TCGA)
(https://portal.gdc.cancer.gov/) and
Genotype-Tissue Expression databases (https://www.gtexportal.org/home/). Raw RNA-Seq data
(TPM+1) were log-transformed and normalized using the rms
package in R (version 4.2.1; Posit Software, PBC). Batch-corrected
data were visualized using ggplot2 (version 3.4.0; Posit
Software, PBC) as boxplots to depict EFNA3 expression across tumor
and normal tissues. Differential expression was analyzed with
DESeq2 (version 1.38.3; Bioconducter), using thresholds of
|log2FC|≥1 and FDR ≤0.05 (Benjamini-Hochberg correction). Tumor
stage association was analyzed using the ‘Stage Plot’ module in
GEPIA2 (http://gepia2.cancer-pku.cn/). The
flowchart of the present study is shown in Fig. S1.
Prognostic and diagnostic evaluation
of EFNA3
TCGA clinical and expression datasets were used to
assess prognostic and diagnostic relevance of EFNA3. Univariate Cox
proportional hazards models were constructed using the
survival package (version 3.5–5; Posit Software, PBC), with
calculated hazard ratios (HR) and 95% confidence intervals (CI).
P<0.05 was considered to indicate a statistically significant
difference. Samples lacking complete survival data were excluded.
Kaplan-Meier survival curves for OS, disease-free survival (DFS)
and progression-free interval (PFI) were plotted using
survminer (version 0.4.9; Posit Software, PBC) and
ggplot2 (version 3.4.0; Posit Software, PBC). Diagnostic
value was evaluated using ROC curves generated by the pROC
package (version 1.18.0; Posit Software, PBC).
Clinicopathological correlation in
ACC
Based on median the expression level of EFNA3,
patients with ACC were stratified into high- and low-EFNA3
expression groups (n=40 and n=39, respectively). Clinical
parameters were compared using appropriate tests using the
stats (version 4.2.1) and car (version 3.1.0) R
packages (Posit Software, PBC). Visualization was performed with
ggplot2 (version 3.4.0; Posit Software, PBC). The diagnostic
performance of EFNA3 in ACC was evaluated via ROC analysis
(pROC; version 1.18.0; Posit Software, PBC) using TCGA and
UCSC-derived datasets.
Somatic mutation and copy number
analysis
Mutation data were obtained from cBioPortal
(http://www.cbioportal.org) and TCGA.
EFNA3 alterations [mutation type, copy number alterations (CNAs)
and frequency] were analyzed using 2,683 samples from 2,565
patients. Additional ACC-specific data (n=76) were retrieved from
the UCSC Xena (https://xenabrowser.net/) and the International Cancer
Genome Consortium (https://dcc.icgc.org/) databases. Kaplan-Meier
survival analyses were used to assess survival outcomes based on
EFNA3 mutation status. Differential mutation profiles in EFNA3-high
vs. -low expression groups were also analyzed.
Epigenetic and mRNA modification
analysis
DNA methylation profiles for EFNA3 in ACC were
obtained from the MethSurv (https://biit.cs.ut.ee/methsurv/) database. mRNA
modification regulator correlations including n1-methyladenosine
(m1A), 5-methylcytosine (m5C) and n6-methyladenosine (m6A), were
analyzed across various types of cancer from TCGA database using
the SangerBox software (version 3.0; http://vip.sangerbox.com). Pearson correlation
coefficients and significance levels were reported.
Immune cell infiltration analysis
TME scores (stromal, immune and ESTIMATE scores)
were computed using the ESTIMATE R package (version 1.0.13;
Posit Software, PBC). Immune infiltration profiling was performed
using markers from 22 immune cell types provided by the CIBERSORTx
website (https://cibersortx.stanford.edu/) (27). Data were visualized as heatmaps
using ggplot2 (version 3.4.0; Posit Software, PBC).
Spearman's correlation coefficients were used to assess statistical
associations.
Competitive endogenous RNA (ceRNA)
regulatory network construction
Candidate EFNA3-targeting microRNAs (miRNAs) were
predicted using PITA (version 1.0; https://genie.weizmann.ac.il/pubs/mir07/mir07_data.html),
miRanda (version 3.3; http://www.microrna.org/) and TargetScan (version 8.0;
http://www.targetscan.org/) software.
miRNAs with a negative correlation to EFNA3 were prioritized using
the StarBase (version 2.0; http://starbase.sysu.edu.cn/). lncRNA-miRNA
interactions were derived from miRNet (version 2.0; http://www.mirnet.ca/) and StarBase (version 2.0;
http://starbase.sysu.edu.cn/) under the
criteria: Species=human; CLIP-Data=yes; and min stringency=5. Venn
diagrams were used for intersecting target prediction using
ggplot2 (version 3.4.0; Posit Software, PBC), and
VennDiagram (version 1.7.3; Posit Software, PBC). Final
lncRNA-miRNA-EFNA3 networks were visualized using mulberry plots
using ggplot2 (version 3.4.0; Posit Software, PBC) and
ggalluvial (version 0.12.3; Posit Software, PBC).
Drug sensitivity and interaction
network analysis
Drug sensitivity data were obtained from the
GSCALite (http://bioinfo.life.hust.edu.cn/web/GSCALite/)
database, which integrates TCGA, Genomics of Drug Sensitivity in
Cancer (GDSC) and Cancer Therapeutics Response Portal (CTRP)
datasets. EFNA3-associated drug responses were identified based on
Pearson correlations analysis with mRNA expression. FDA-approved
agents were selected via DrugBank (https://go.drugbank.com/) annotations. Network graphs
were generated using graph (version 1.4.1; Posit Software,
PBC) and graph (version 2.1.0; Posit Software, PBC)
packages.
Functional enrichment of co-expressed
genes
Co-expressed genes were identified using LinkedOmics
(http://www.linkedomics.org). Functional
enrichment was performed using Gene Ontology (GO) and Kyoto
Encyclopedia of Genes and Genomes (KEGG) terms via the
clusterProfiler (version 4.6.2; Posit Software, PBC)
software. Protein-protein interaction (PPI) networks were generated
using the STRING database (https://cn.string-db.org/) and visualized using
default Benjamini-Hochberg correction for P-values.
Cell lines and culture conditions
The human ACC cell lines SW-13 (hormonally inactive)
and NCI-H295R (hormonally active) were obtained from Procell Life
Science & Technology Co., Ltd. Cell line authentication was
confirmed via short tandem repeat profiling. Cells were maintained
in DMEM/F12 medium (Shanghai Zhongqiao Xinzhou Biotechnology Co.,
Ltd.) supplemented with 10% fetal bovine serum (FBS; cat. no.
G24-70500; Genial Biologicals, Inc.) and 1% penicillin-streptomycin
(Shanghai Zhongqiao Xinzhou Biotechnology Co., Ltd.). Cultures were
incubated at 37°C in a humidified atmosphere containing 5%
CO2.
EFNA3 overexpression and knockdown via
lentiviral transfection
The EFNA3 overexpression plasmid was synthesized by
Shanghai Sangong Pharmaceutical Co., Ltd. The short hairpin RNA
(shRNA) targeting EFNA3 and the non-targeting negative control (NC)
were synthesized by Shanghai Gema Gene Biotechnology Co., Ltd.
Sequences used were as follows: shNC sense (S),
5′-TTCTCCGAACGTGTCACGT-3′ and anti-sense (AS),
5′-ACGTGACACGTTCGGAGAA-3′; shEFNA3 S, 5′-GGCATGCGGTGTACTGGAACA-3′
and AS, 5′-TGTTCCAGTACACCGCATGCC-3′. The EFNA3 overexpression
plasmid was designed and synthesized by Shanghai Sangong
Pharmaceutical Co., Ltd., and constructed by cloning the EFNA3
coding sequence into the pcDNA3.1 plasmid backbone (Thermo Fisher
Scientific, Inc.). For transfection, 2.5 µg of plasmid DNA was
complexed using Lipofectamine® 2000 (Thermo Fisher
Scientific, Inc.) according to the manufacturer's instructions and
then added to the cell culture. Transfection was performed at 37°C
for 48 h. Upon reaching 30–40% confluency in 6-well plates, cells
were infected with lentivirus in medium containing Polybrene
(Thermo Fisher Scientific, Inc.). Puromycin (4 µg/ml; Thermo Fisher
Scientific, Inc.) was added 48 h post-infection for initial
screening. Stable-transfected clones were maintained in a 2
µg/ml-puromycin environment.
Real-time quantitative PCR
(RT-qPCR)
According to the manufacturer's protocol, total RNA
was isolated from NCI-H295R and SW-13 cells using TRIzol reagent
(cat. no. R0016; Biocytogen). cDNA was synthesized from mRNA using
a cDNA reverse transcription kit (cat. no. 4368814; Thermo Fisher
Scientific, Inc.) according to the manufacturer's protocol. qPCR
amplification was performed using the SYBR Green fluorescent
quantitative PCR kit (cat. no. A46012, Thermo Fisher Scientific,
Inc.). The primer sequences are as follows: EFNA3 forward (F),
5′-ATGAAGGTGTTCGTCTGCT-3′ and reverse (R),
5′-CTCAAAGTCTTCCAGCACG-3′; GAPDH F, 5′-TCAAGATCATCAGCAATGCC-3′ and
R, 5′-CGATACCAAAGTTGTCATGGA-3′; GAPDH was used as the internal
reference gene. The relative expression level of EFNA3 mRNA was
calculated using the 2−ΔΔCq method (28). The thermocycling conditions were as
follows: Initial denaturation at 95°C for 10 min; followed by 40
cycles of denaturation at 95°C for 15 sec and combined
annealing/extension at 60°C for 60 sec.
Transwell migration assay
Cell migration was assessed using 24-well Transwell
chambers with 8-µm pore inserts (Corning, Inc.). After serum
starvation for 24 h, cells were harvested and resuspended in
serum-free DMEM at 1×10⁵ cells/ml. Then, 200 µl of cell
suspension was seeded into the upper chamber. The lower chamber
contained 600 µl of DMEM supplemented with 10% FBS as
chemoattractant. After 48 h of incubation at 37°C with 5%
CO2, non-migrated cells were removed. Migrated cells
were fixed with 4% paraformaldehyde for 10 min and stained with
0.1% crystal violet for 20 min, both at room temperature. Cell
images were captured using an inverted fluorescence microscope
(Olympus IX73; Olympus Corporation; magnification, ×400).
Representative scale bars (200 µm) are shown. Each experiment was
performed in triplicate and repeated three times independently.
Cell proliferation assay
Cell proliferation was assessed using the Cell
Counting Kit-8 (CCK-8; Beyotime Institute of Biotechnology). Cells
were seeded in 96-well plates (2,000 cells/well) in 100 µl of
complete medium. At 12, 24, 48 and 72 h post-seeding, the medium
was replaced with 90 µl of serum-free medium with 10 µl of CCK-8
solution, followed by 1 h incubation at 37°C. Absorbance was
measured at 450 nm using a microplate reader. Each cell experiment
was independently repeated three times.
Apoptosis assay
Apoptosis was quantified using Annexin
V-FITC/propidium iodide (PI) Apoptosis Detection Kit (BD
Biosciences). Transfected cells were seeded into 6-well plates and
cultured to ~80% confluence. Cells were harvested, washed twice
with PBS and stained in binding buffer with Annexin V-FITC and PI
for 10 min at room temperature in the dark. Samples were analyzed
within 1 h using flow cytometry (BD FACSCalibur™; BD Biosciences)
and apoptotic populations were quantified. The total apoptosis rate
was defined as the sum of early and late apoptotic populations.
Data were analyzed using FlowJo software (version 10.8.1; BD
Biosciences). Each cell experiment was independently repeated three
times.
Cell cycle analysis
Cell cycle analysis was performed using PI staining
to quantify DNA content and analyzed via flow cytometry. Cells from
different groups were collected and washed with ice-cold PBS. After
centrifugation at 500 × g for 5 min and aspiration of the
supernatant, the cell pellets were fixed in 1 ml of ice-cold 70%
ethanol overnight at 4°C. Following PBS washes three times for 5
min each at room temperature with centrifugation at 500 × g for 5
min per wash, cells were incubated in PI/RNase Staining Buffer (BD
Biosciences) for 30 min at 37°C in the dark. Finally, the stained
cells were analyzed using a flow cytometer (BD
FACSCaliburTM; BD Biosciences). Data were interpreted
using the CellQuest Pro software (version 6.0; BD Biosciences).
Each cell experiment was independently repeated three times.
Wound healing assay
Cell migration was assessed using a wound healing
assay in two human ACC cell lines, SW-13 and NCI-H295R. Cells were
harvested during the logarithmic growth phase, trypsinized and
seeded uniformly into 6-well plates. The cells were cultured until
>90% confluence was reached. Prior to wounding, cells were
serum-starved in serum-free DMEM for 24 h. A straight wound was
introduced in the center area using a sterile pipette tip. The
detached cells were removed by washing three times with PBS.
Subsequently, serum-free cell culture medium was added. Wound
images were captured at 0 and 48 h under an inverted fluorescence
microscope (Olympus IX73; Olympus Corporation; magnification, ×40).
The same magnification and fields of view were used for each time
point. Representative scale bars (500 µm) are shown on respective
images. The measurement of wound width was performed by annotating
the wound edges on the images. Migration rates were quantified
using ImageJ (version 1.8.0; National Institutes of Health) and
calculated as follows: Cell migration rate=(scratch width at 0
h-scratch width at 48 h)/scratch width at 0 h ×100). Each cell
experiment was independently repeated three times.
Statistical analysis
All statistical analyses were performed using R
(version 4.2.1; Posit Software, PBC). Quantitative data are
expressed as mean ± standard deviation. For the comparisons in
Fig. 1, the Wilcoxon rank-sum test
(Mann-Whitney U test) was used for unpaired samples, while the
Wilcoxon signed-rank test was applied for paired samples. For in
vitro comparisons, unpaired Student's t-test was used for
two-group analyses. For comparisons involving ≥3 groups, data were
assessed for normality and homogeneity of variances. The normality
of data distribution was verified using the Shapiro-Wilk test, and
the homogeneity of variances was assessed using Levene's test. If
these assumptions were met, one-way ANOVA was performed, followed
by Tukey's post hoc test for pairwise comparisons. If the
assumptions were violated, the Kruskal-Wallis test was used,
followed by Dunn's post hoc test. The categorical variables were
compared using the χ2 test. When the applicable
conditions of the χ2 test were violated (>20% of the
expected frequency is <5) the Fisher exact test was used
instead. P<0.05 was considered to indicate a statistically
significant difference.
Results
EFNA3 expression patterns and
prognostic relevance across various types of human cancer
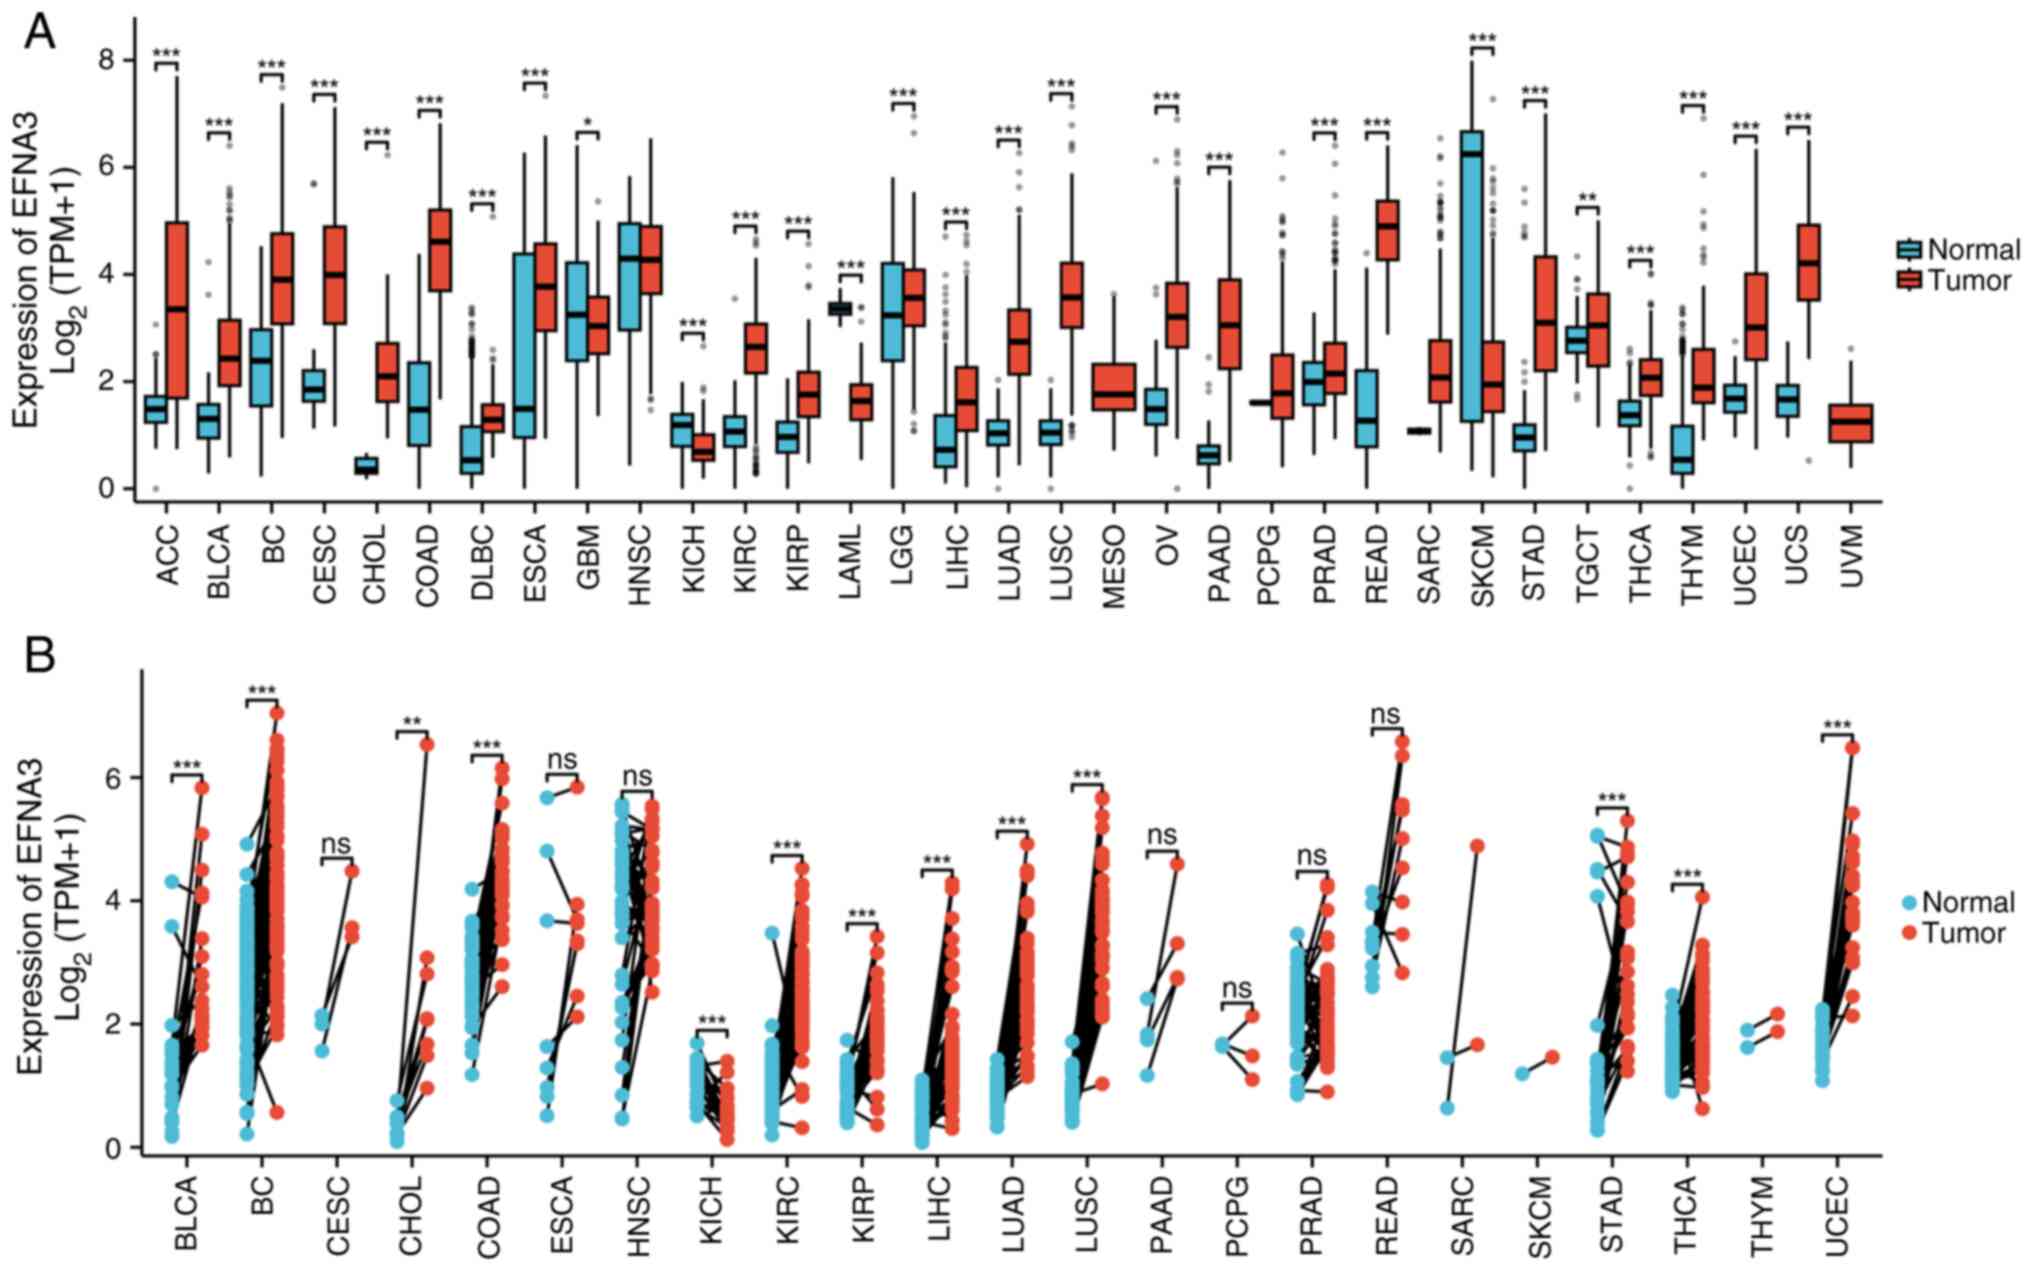
The differential expression of EFNA3 was assessed in
a pan-cancer analysis by comparing normal tissues from the GTEx
database against tumor tissues from the TCGA dataset. EFNA3
expression levels were significantly downregulated in glioblastoma
multiforme (GBM), kidney chromophobe (KICH), acute myeloid
leukemia-like (LAML) and skin cutaneous melanoma (SKCM) compared
with that of normal tissues (Fig.
1A). Pan-cancer analysis using the TCGA data of paired tumor
and paracancerous tissues from the same patients demonstrated that
EFNA3 expression levels were significantly upregulated in the
majority of tumor types compared with that of paired paracancerous
tissues; however, significant downregulation was observed in GBM,
KICH, LAML and SKCM (Fig. 1B). The
expression levels of EFNA3 in cancer and normal tissues in various
types of cancer are shown in Table
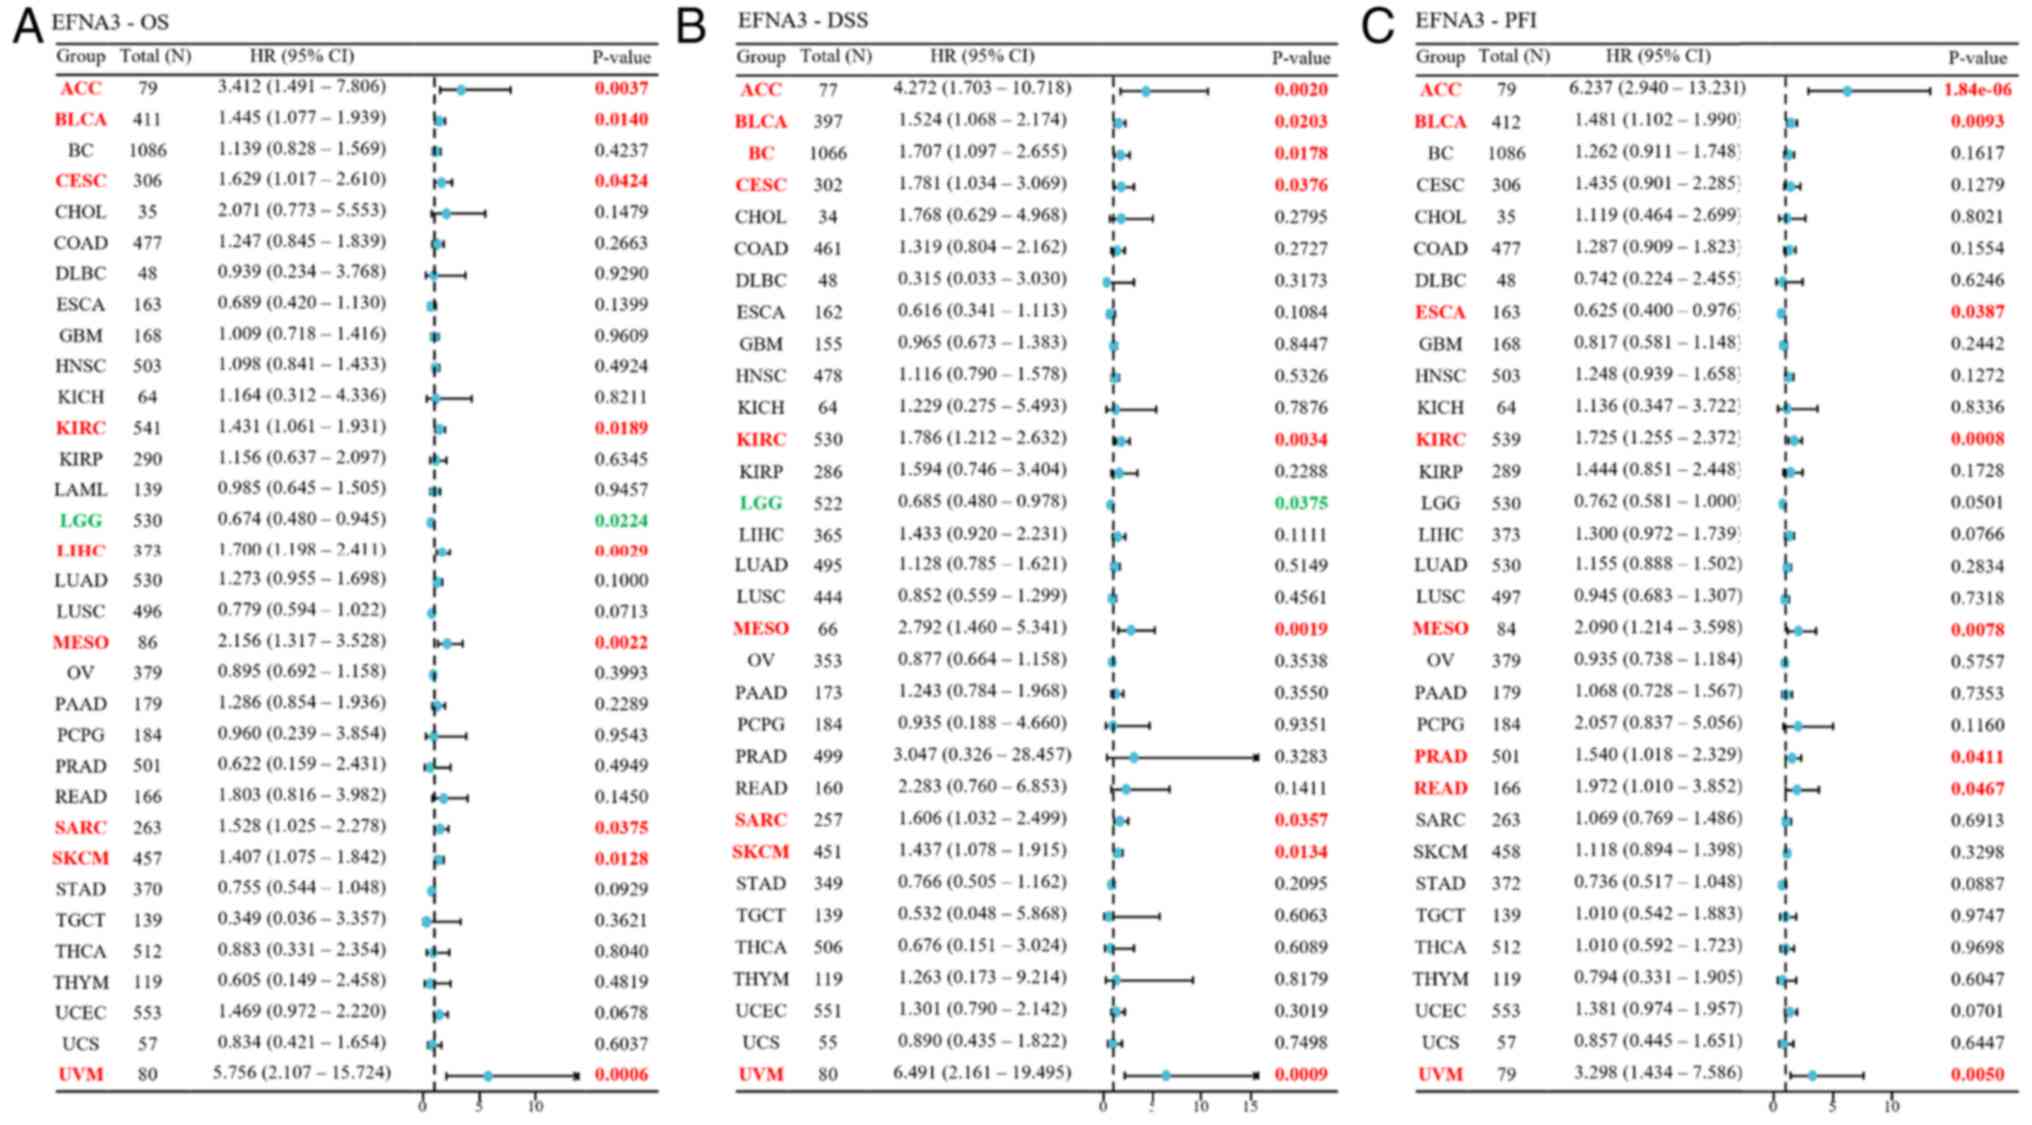
SI, Table SII, Table SIII. Forest plots generated from
Cox proportional hazard models demonstrated that EFNA3 expression
was significantly associated with OS (Fig. 2A), disease-specific survival (DSS;
Fig. 2B) and PFI (Fig. 2C) across various cancer types.
Prognostic and pathological
correlations of EFNA3 in pan-cancer analysis
Survival data from TCGA were used to assess the
prognostic role of EFNA3. The association of EFNA3 expression
levels with survival events and time in various cancer types are
shown in Table SIV, Table SV, Table SVI. Due to incomplete survival
annotations, certain end points, specifically DSS and PFI, were
unavailable for LAML. Univariate Cox regression showed that
increased EFNA3 expression was associated with poor OS, DSS and PFI
in bladder cancer (BLCA), kidney clear cell carcinoma (KIRP), ACC
and mesothelioma (HR>1; P<0.05). By contrast, increased EFNA3
expression conferred a protective role in lower-grade glioma (LGG;
HR<1; P<0.05; Fig. 2). EFNA3
was an adverse marker for PFI in breast cancer (BC), esophageal
carcinoma (ESCA), prostate adenocarcinoma (PRAD), rectum
adenocarcinoma (READ) and cervical endocervical squamous carcinoma
(CESC), and for DSS in liver hepatocellular carcinoma (LIHC), SKCM
and CESC (Figs. 3 and S2). Specifically, the Kaplan-Meier
survival analysis and log-rank testing demonstrated that, compared
to those in the EFNA3-low expression group, high EFNA3 expression
was significantly associated with poorer PFI in PRAD, READ, BC,
ESCA and CESC, and poorer DSS in LIHC, SKCM and CESC (Fig. 3). Significant correlations between
EFNA3 and pathological stage were present in certain tumors,
including ACC, cholangiocarcinoma (CHOL), ESCA, KIRP, LIHC,
testicular germ cell tumors, thyroid carcinoma and SKCM (Fig. S3).
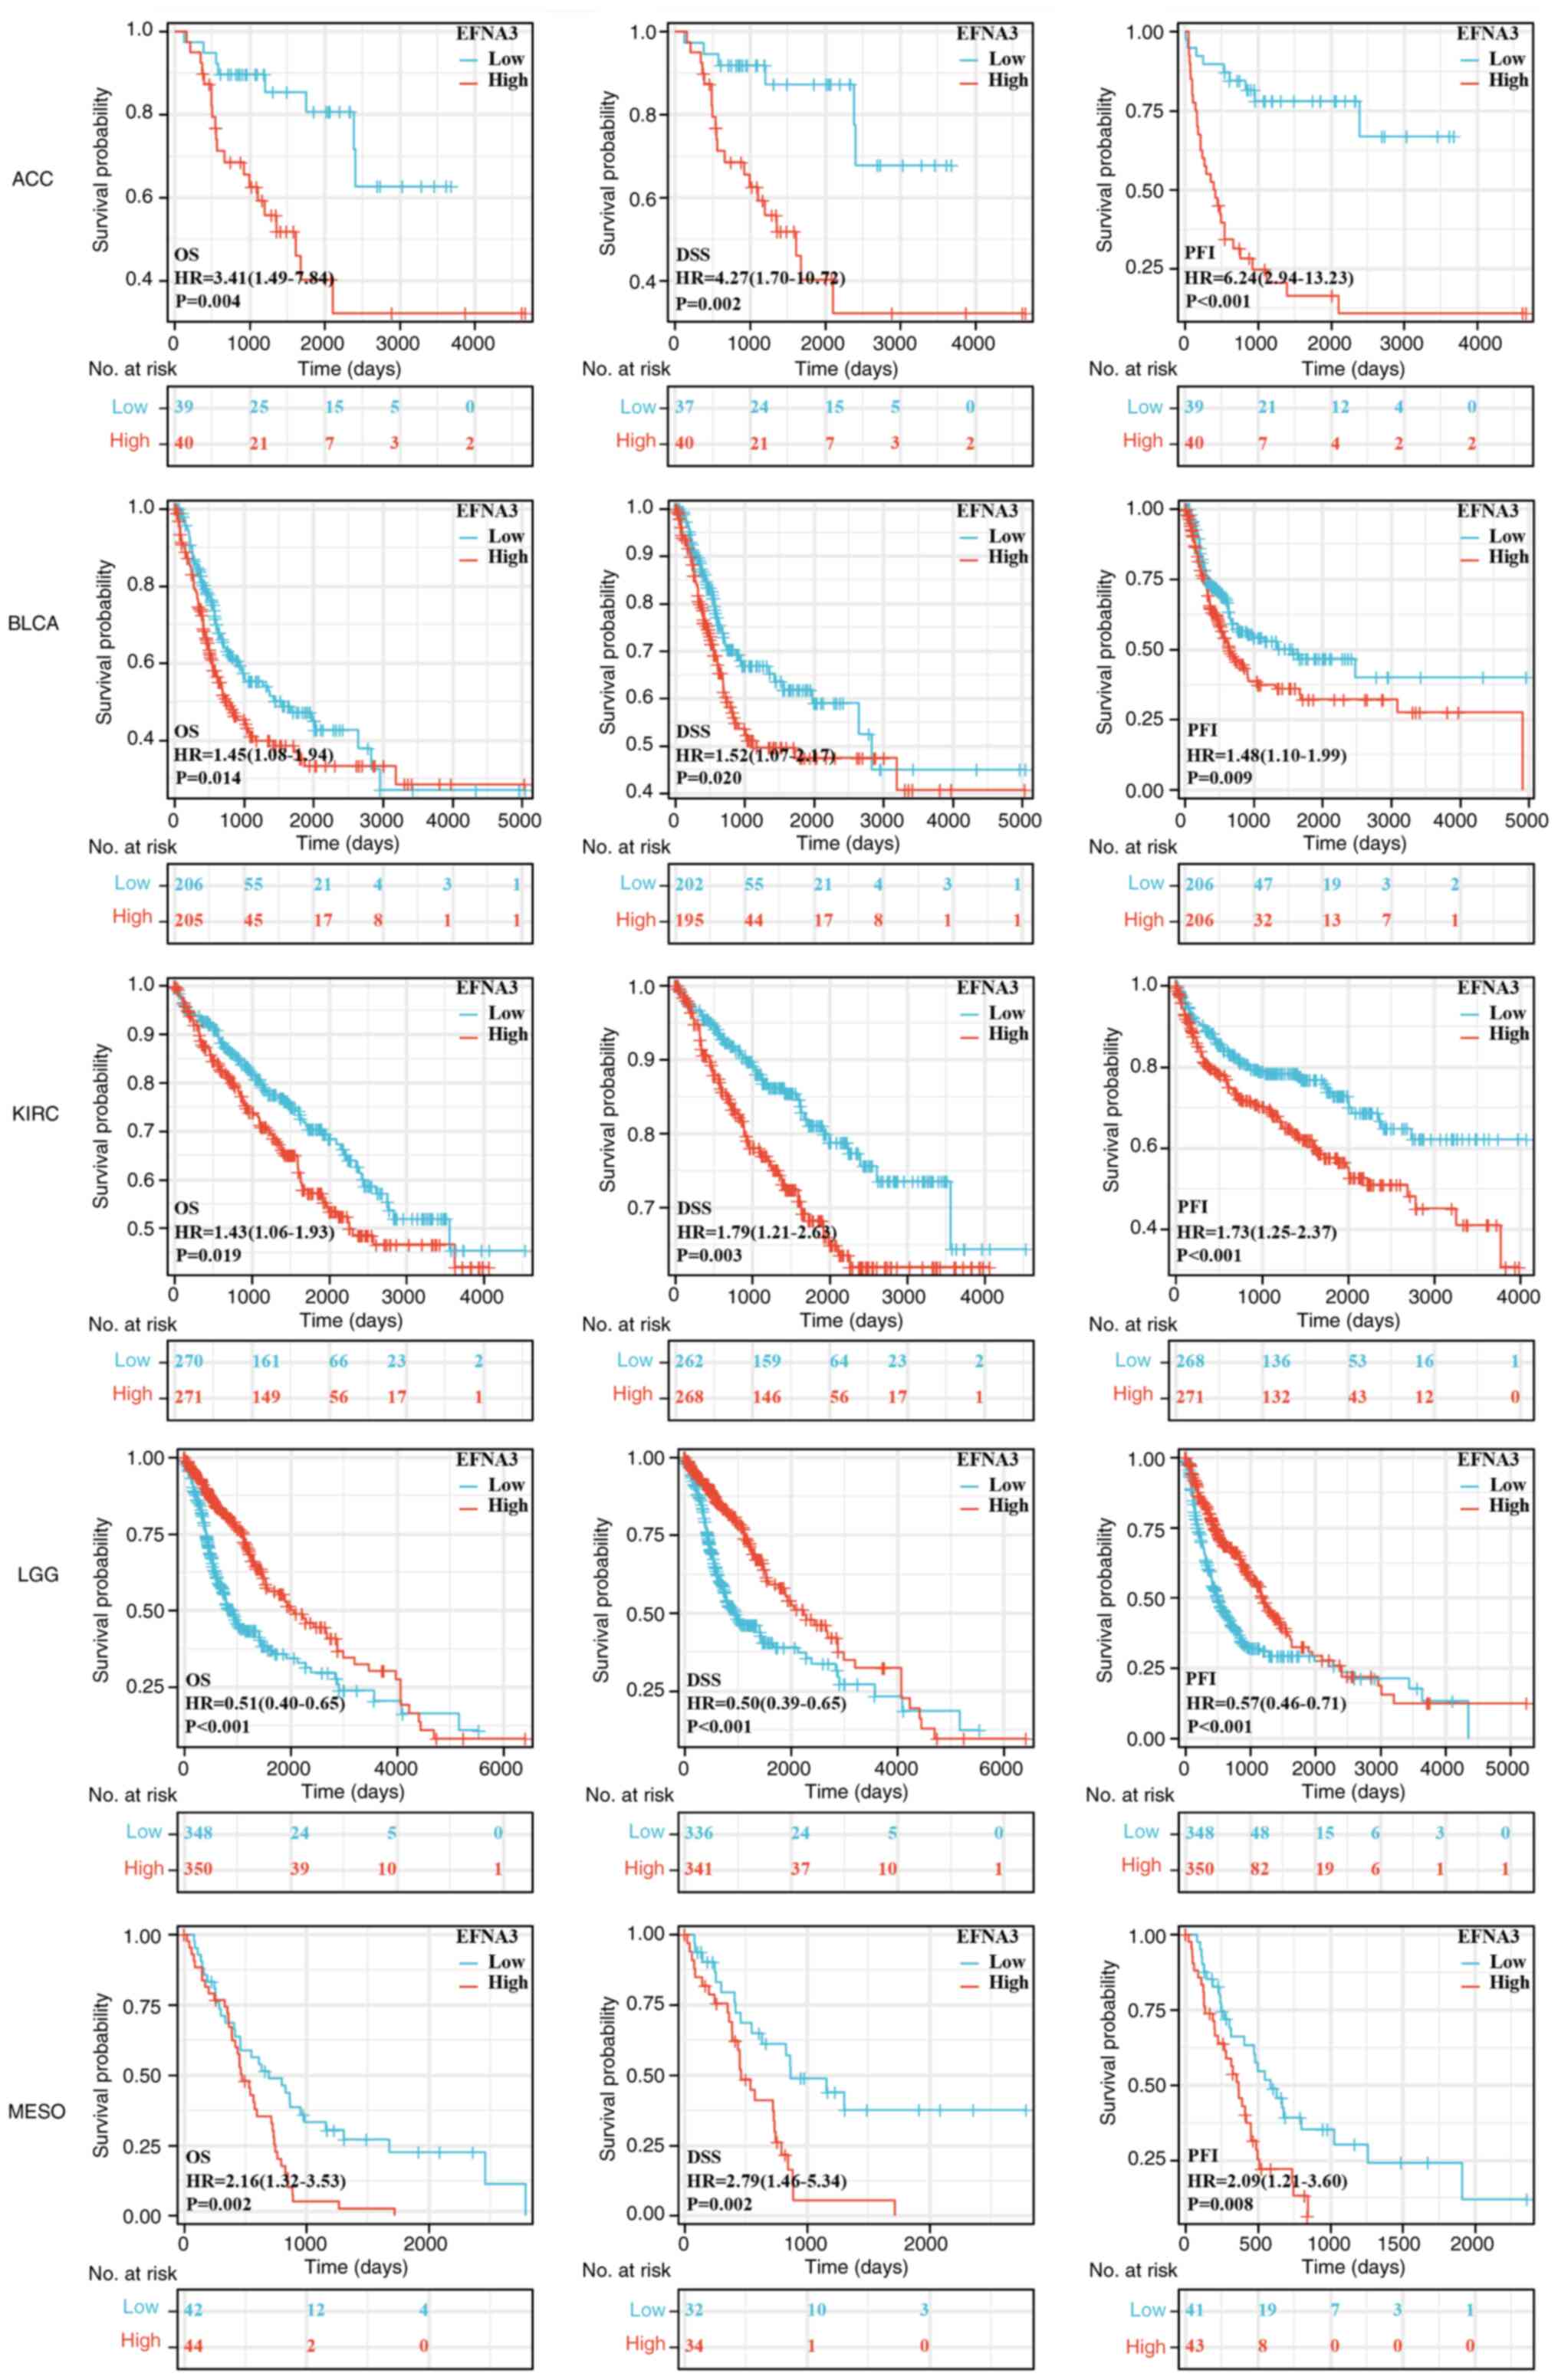 | Figure 3.Prognostic value analysis. Survival
curves for ACC, BLCA, KIRC, LGG and MESO in EFNA3-high and -low
expression groups. The log-rank test was employed to compare the
survival curves and determine the P-value. EFNA3, ephrin-A3; ACC,
adrenocortical carcinoma; BLCA, bladder cancer; KIRC, kidney clear
cell carcinoma; LGG, lower-grade glioma; MESO, mesothelioma; OS,
overall survival; DSS, disease-specific survival; PFI,
progression-free interval; HR, hazard ratio. |
Genetic alterations of EFNA3 and their
prognostic significance
Analysis 2,683 samples from a pan-cancer database of
2,565 patients demonstrated that 15% of the cohort harbored EFNA3
alterations (Fig. 4A), with the
highest frequency observed in BC (>40%; Fig. 4B). In ACC, the mutation frequency
was 8%. CNAs of the ‘mRNA high’ and ‘amplification’ subtypes
occurred most frequently in ACC. EFNA3 CNAs positively correlated
with mRNA expression (Fig. 4C).
Differential expression of genes between EFNA3 altered and
unaltered groups in ACC are shown in Table SVII. Survival analyses demonstrated
that EFNA3-mutated cases had significantly lower OS in the
pan-cancer analysis (HR=2.52, 95% CI, 1.45–4.37; P<0.001) and in
ACC specifically (OS, HR=2.97, 95% CI, 1.12–7.90, P=0.029; DFS
HR=8.65, 95% CI, 2.14–34.93, P=0.002; Fig. 4D-F). In ACC, β-catenin (CTNNB1) was
among the most frequently co-mutated genes with EFNA3
(P=4.6×10⁻⁴; Fig.
4G).
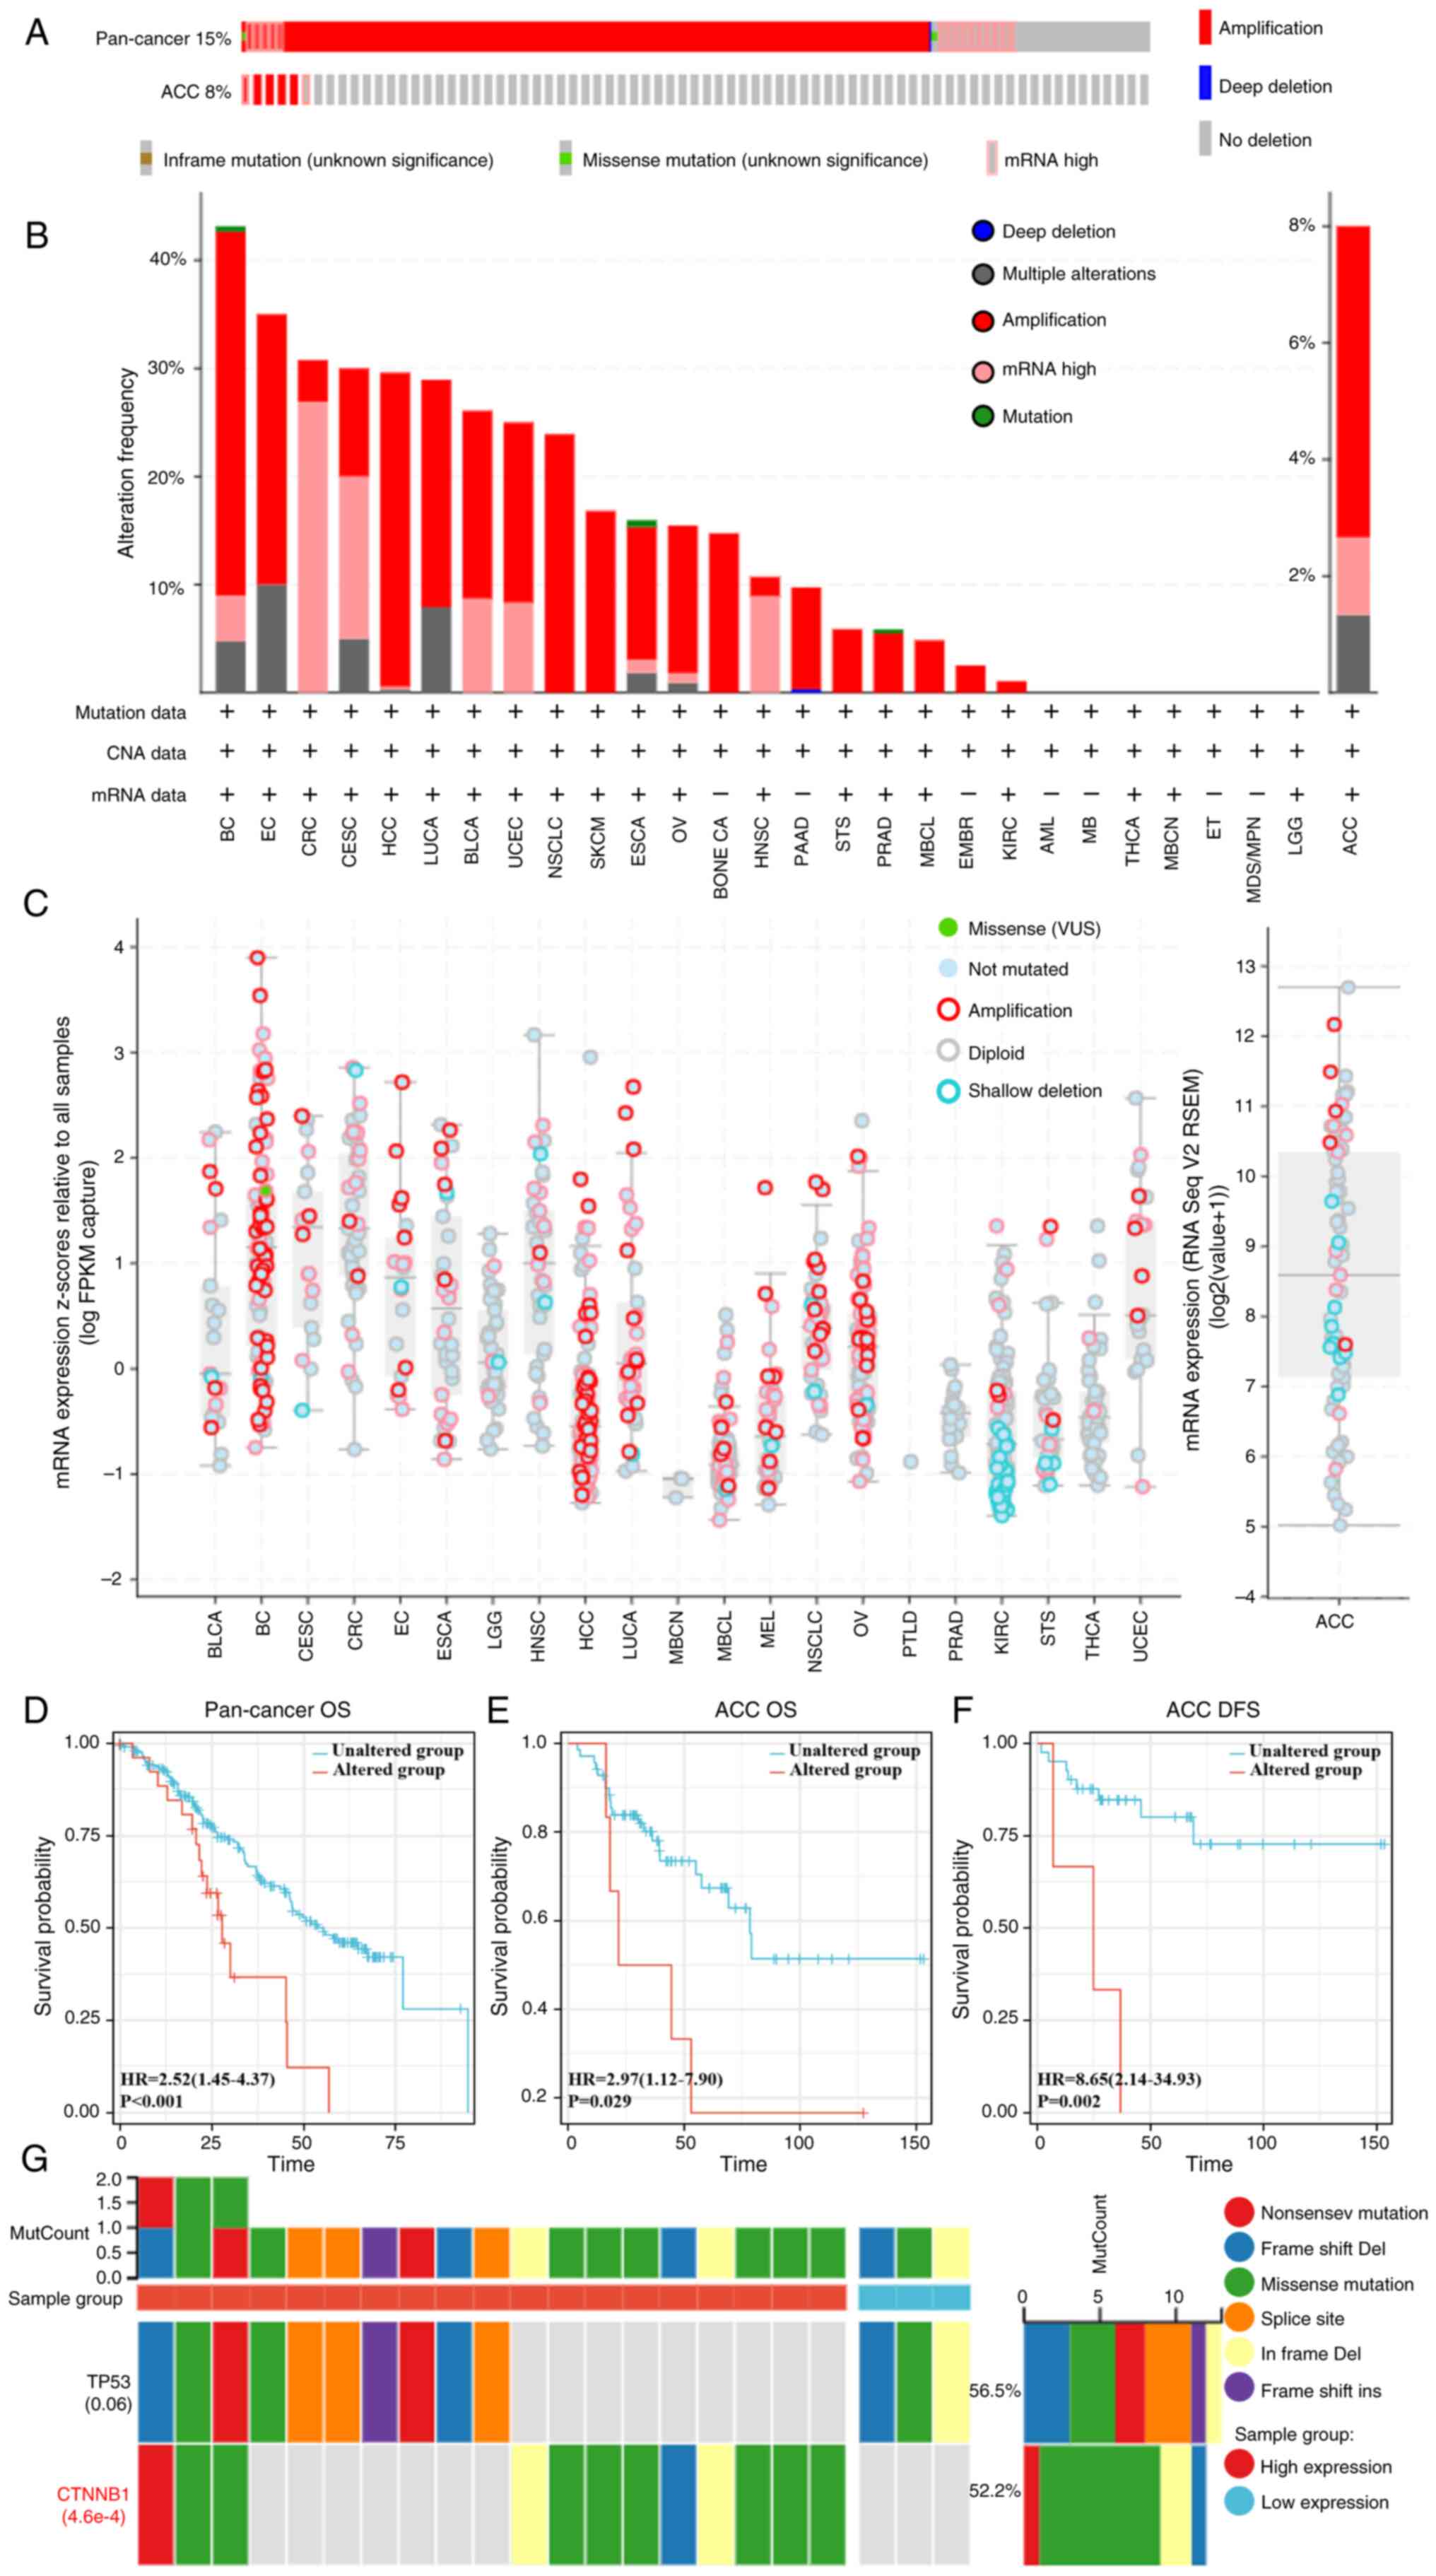 | Figure 4.Analysis of genetic alterations. (A)
Genetic alterations of EFNA3 in a pan-cancer database and ACC,
accounting for 15% (alteration/analysis= 384/2,565) and 8% (6/67)
of the alterations, respectively. (B) Frequency of altered EFNA3
mutation types in different types of cancer. (C) mRNA expression of
EFNA3 putative CNAs in pan-cancer tissues and ACC. Proportional
risk hypothesis testing was performed using the survival package
and fitted survival regressions, and the results were visualized
using the survminer package as well as the ggplot2 package. (D)
Kaplan-Meier curves of EFNA3 mutation status versus OS in
pan-cancer analysis. (E) Kaplan-Meier curves of EFNA3 mutation
status and OS in ACC. (F) Kaplan-Meier curves of EFNA3 mutations in
ACC versus DFS. (G) The top 2 genes with the highest mutation
frequency in the EFNA3-high and -low expression group in ACC.
EFNA3, ephrin-A3; ACC, adrenocortical carcinoma; OS, overall
survival; DFS, disease-free survival; HR, hazard ratio; CNA, copy
number alterations; Del, deletion; MutCount, mutation count;
CTNNB1, β-catenin; VUS, variants of uncertain significance. |
DNA methylation and RNA modifications
in the epigenetic regulation of EFNA3
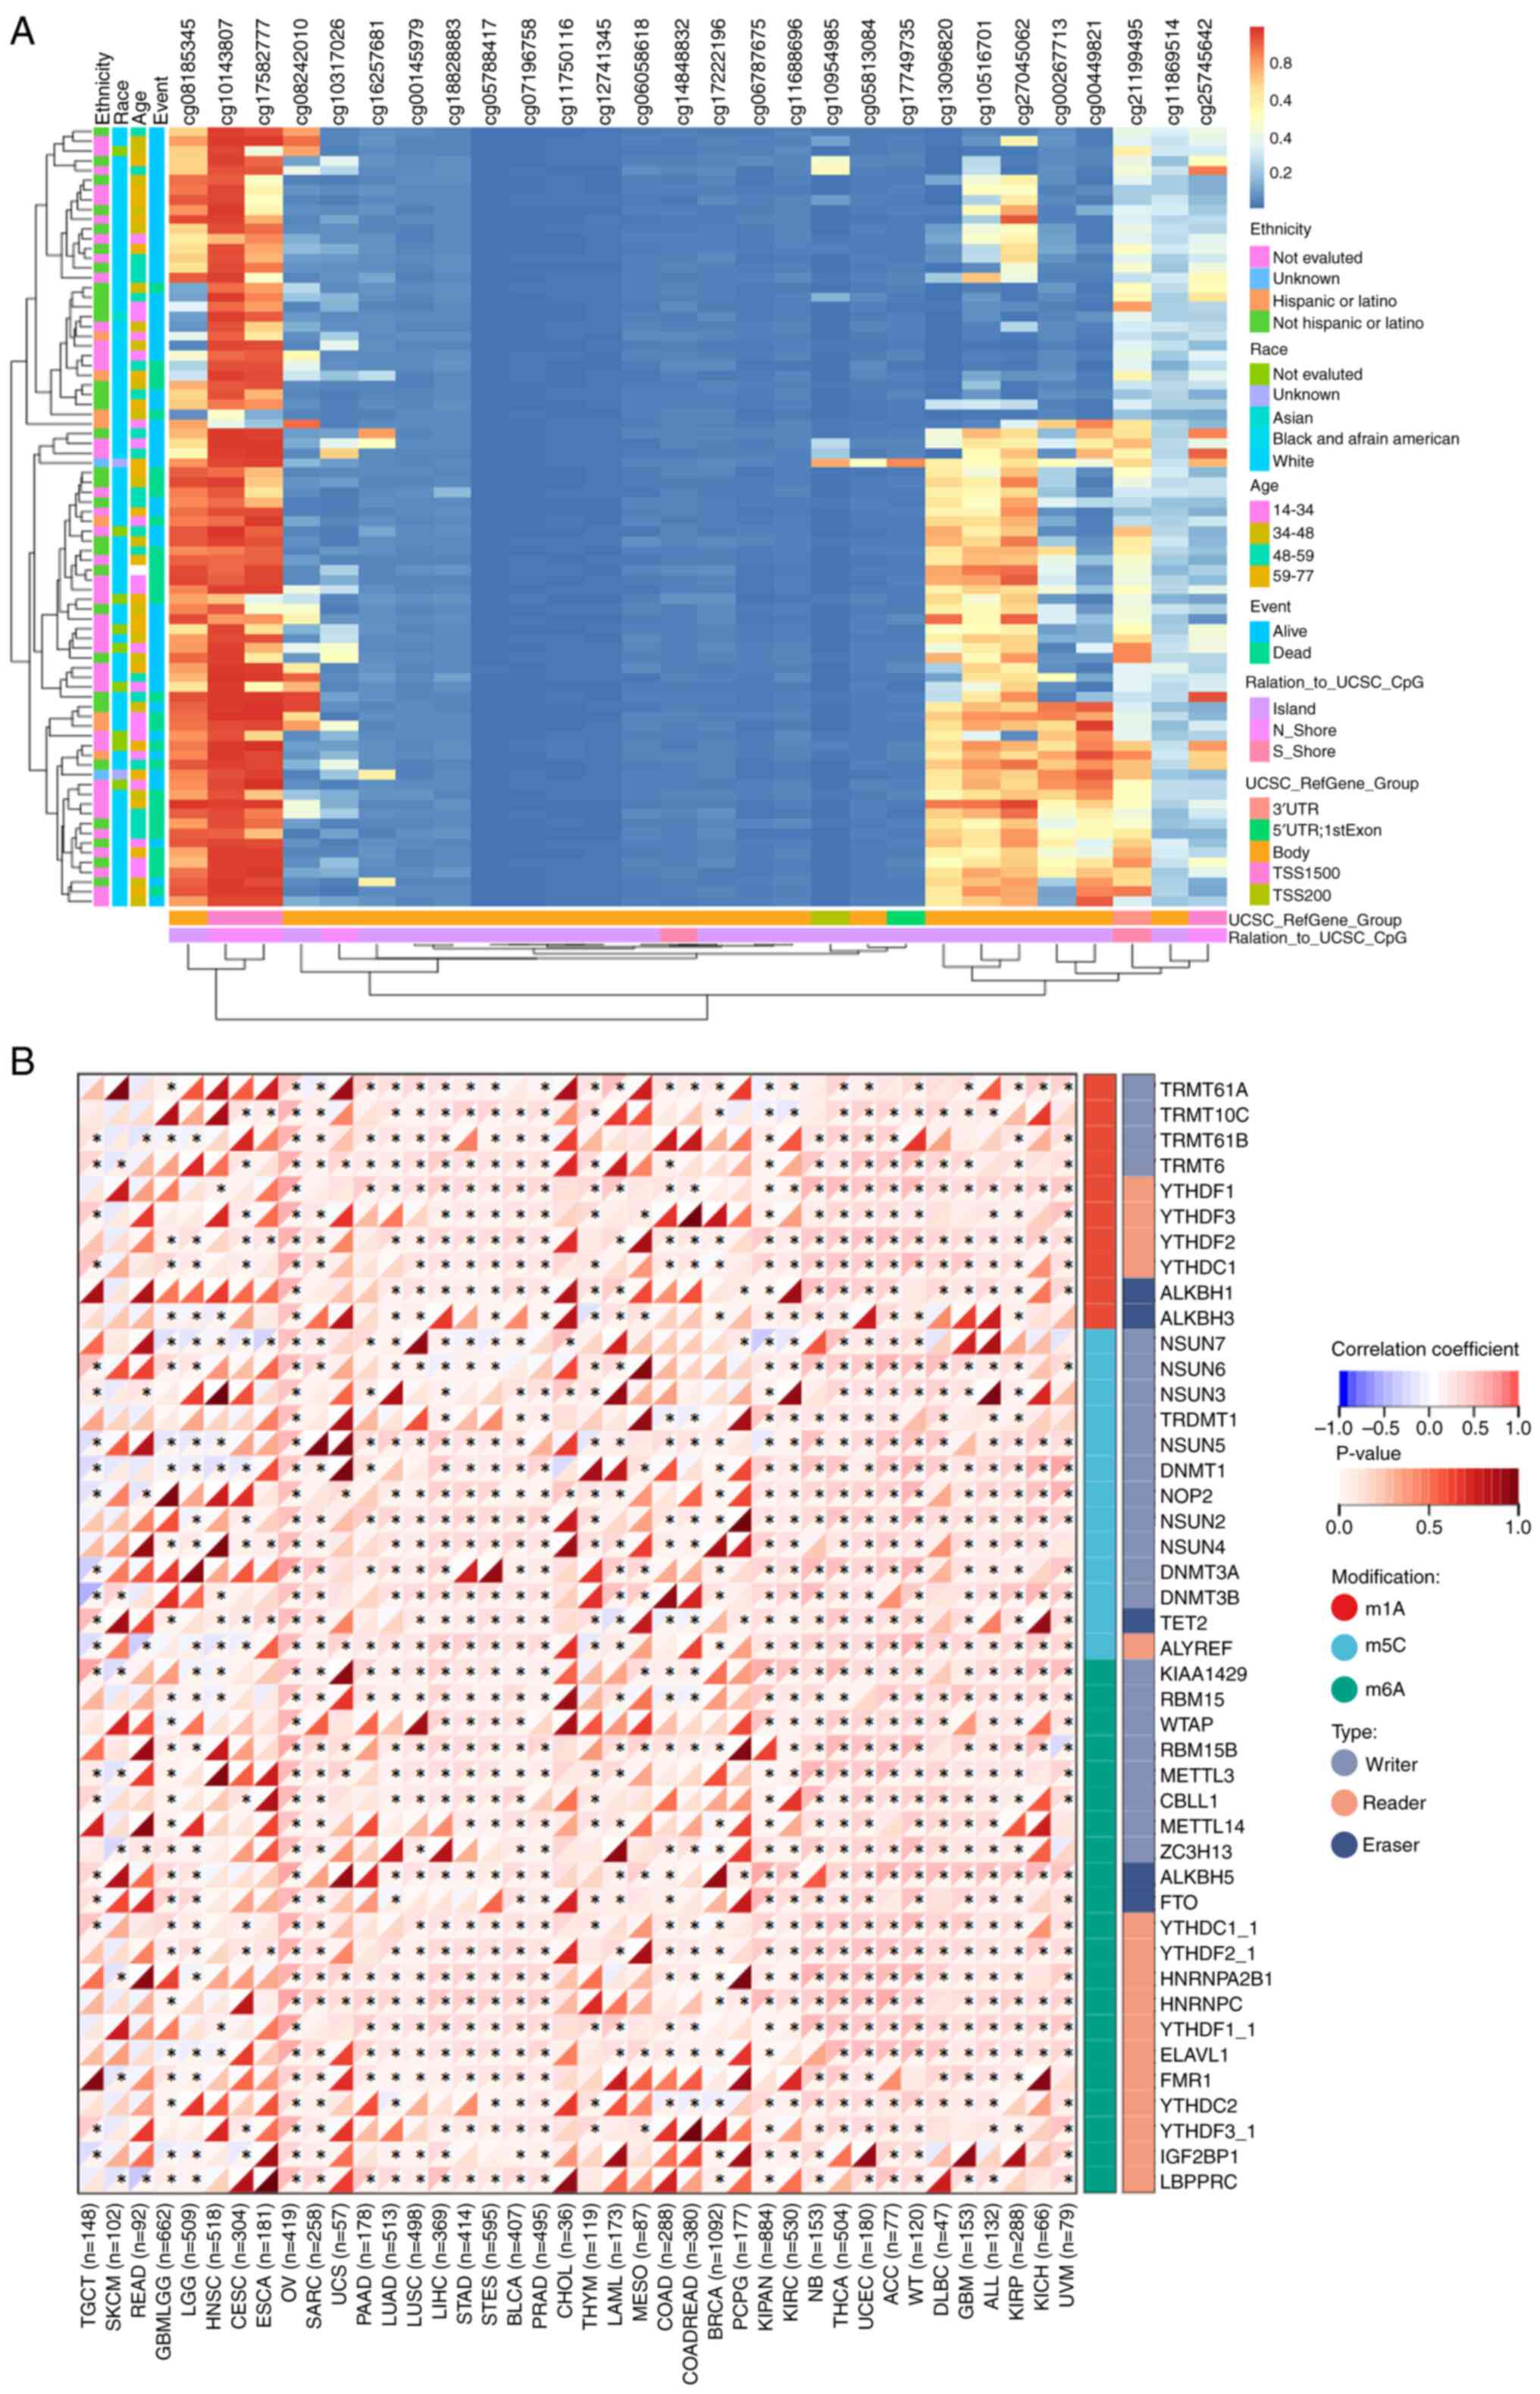
The MethSurv software was used to identify 29 CpG
methylation sites for EFNA3 in ACC (Fig. 5A and Table SVIII). The expression levels of
EFNA3 positively correlated with multiple mRNA methylation
regulators including m1A-, m5C- and m6A-related enzymes (Fig. 5B). The correlation and P-values
between the expression level of EFNA3 and mRNA methylation
regulatory factors are shown in Table
SIX and SX. Top regulators
included HNRNPC, ALKBH5, NSUN6, HNRNPA2B1, ELAVL1, METTL3, YTHDF2,
LRPPRC and ALYREF.
Correlation between EFNA3 expression
levels and the immune microenvironment
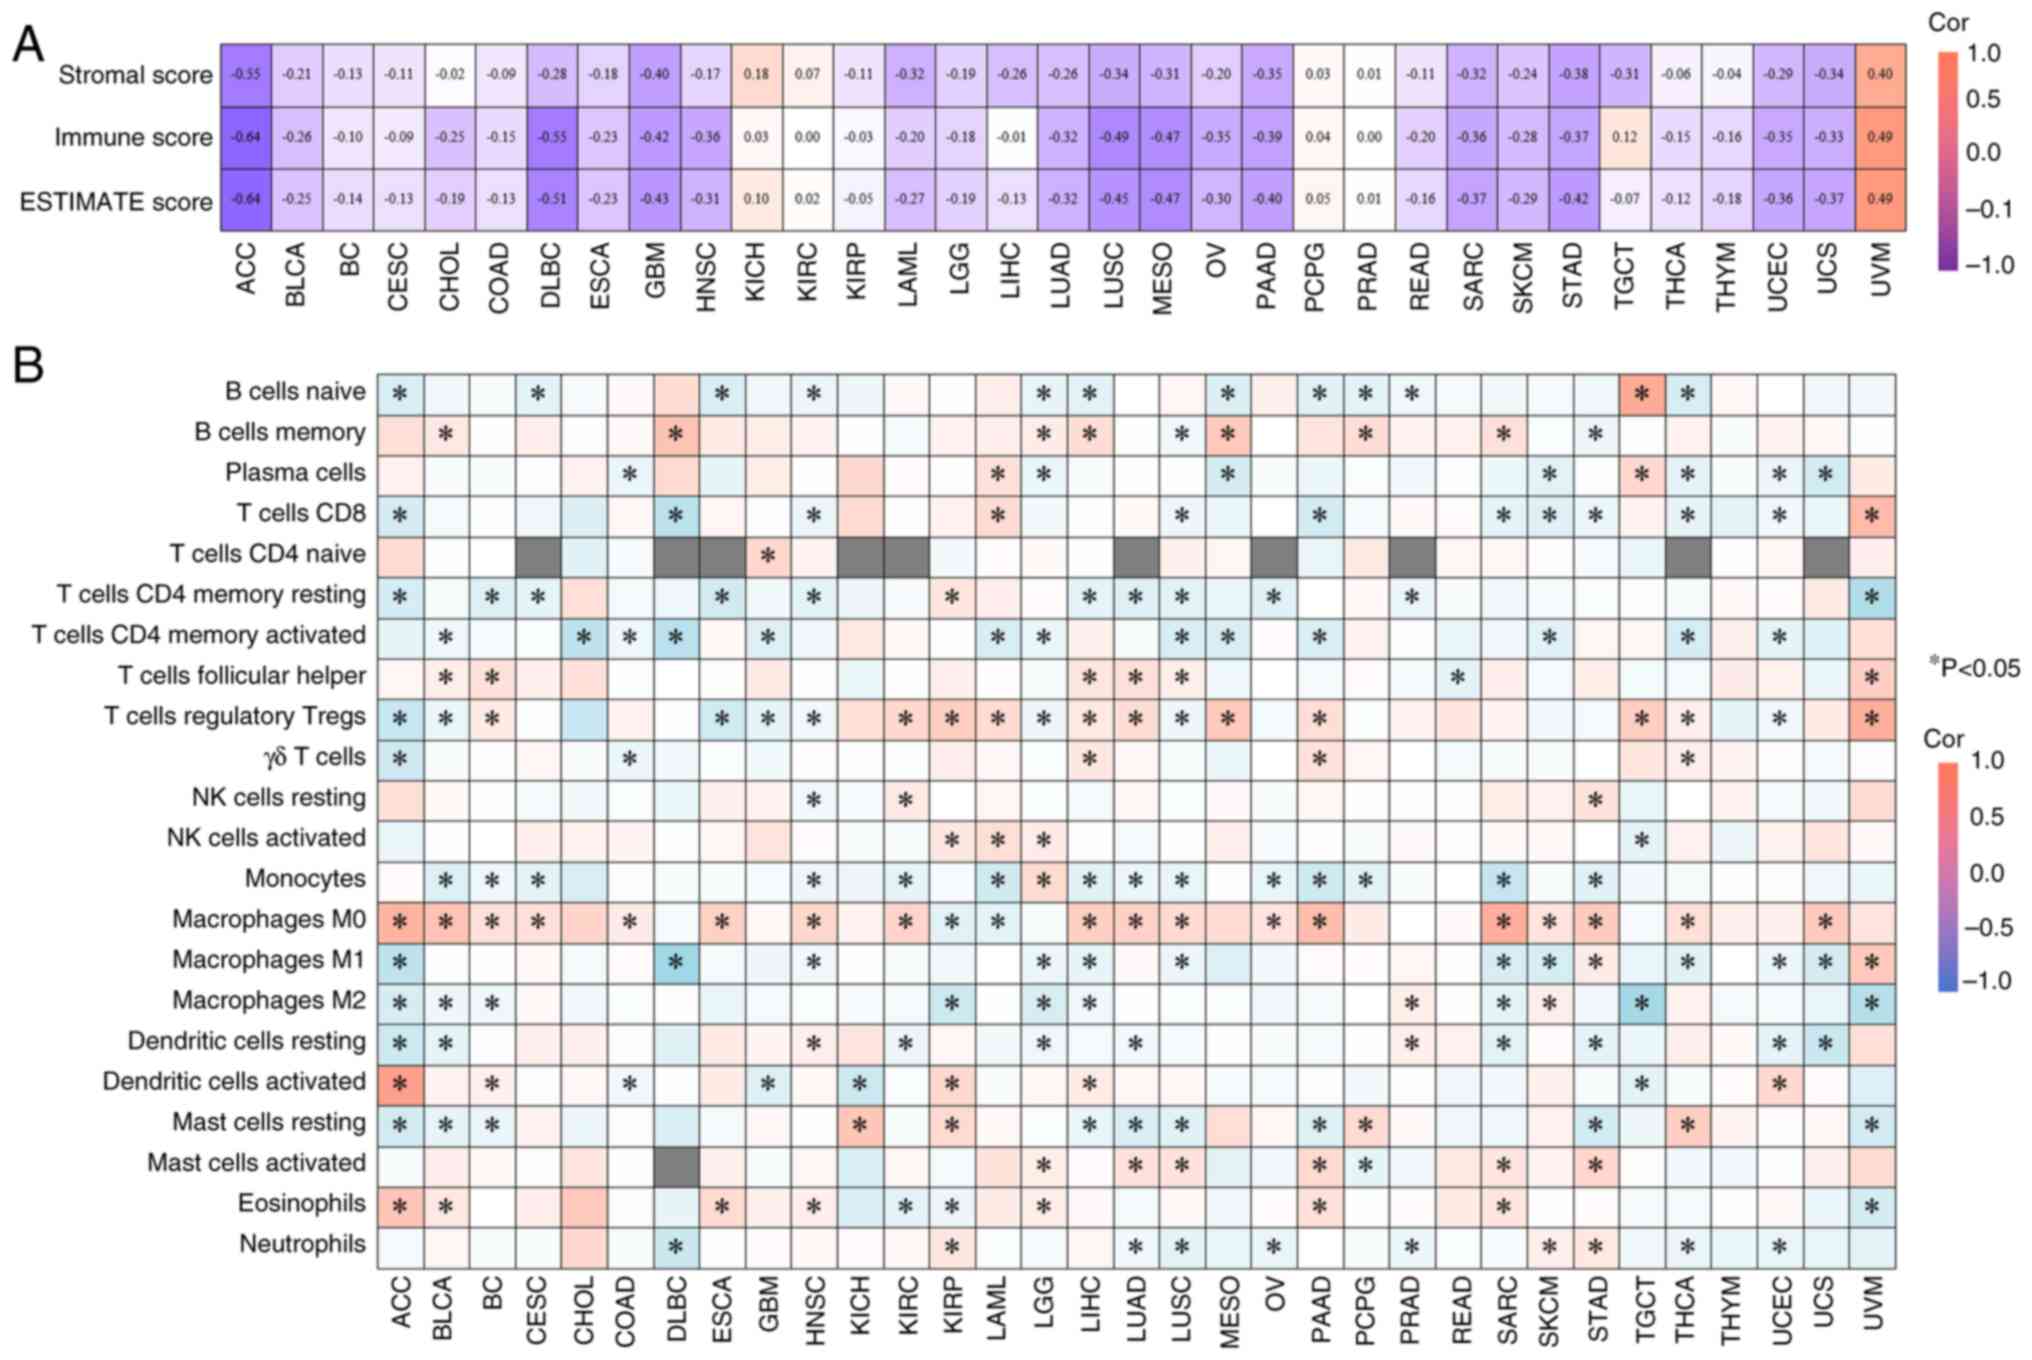
In ACC, EFNA3 expression was inversely correlated
with stromal, immune and ESTIMATE scores (Fig. 6A). Using the CIBERSORT algorithm,
EFNA3 expression was significantly associated with the infiltration
levels of multiple immune cell subtypes (Fig. 6B), which indicated potential
immunomodulatory roles. For instance, in ACC, EFNA3 expression
showed the strongest positive correlation with the infiltration
levels of activated dendritic cells and the strongest negative
correlation with M1 macrophages, both of which were statistically
significant (P<0.05).
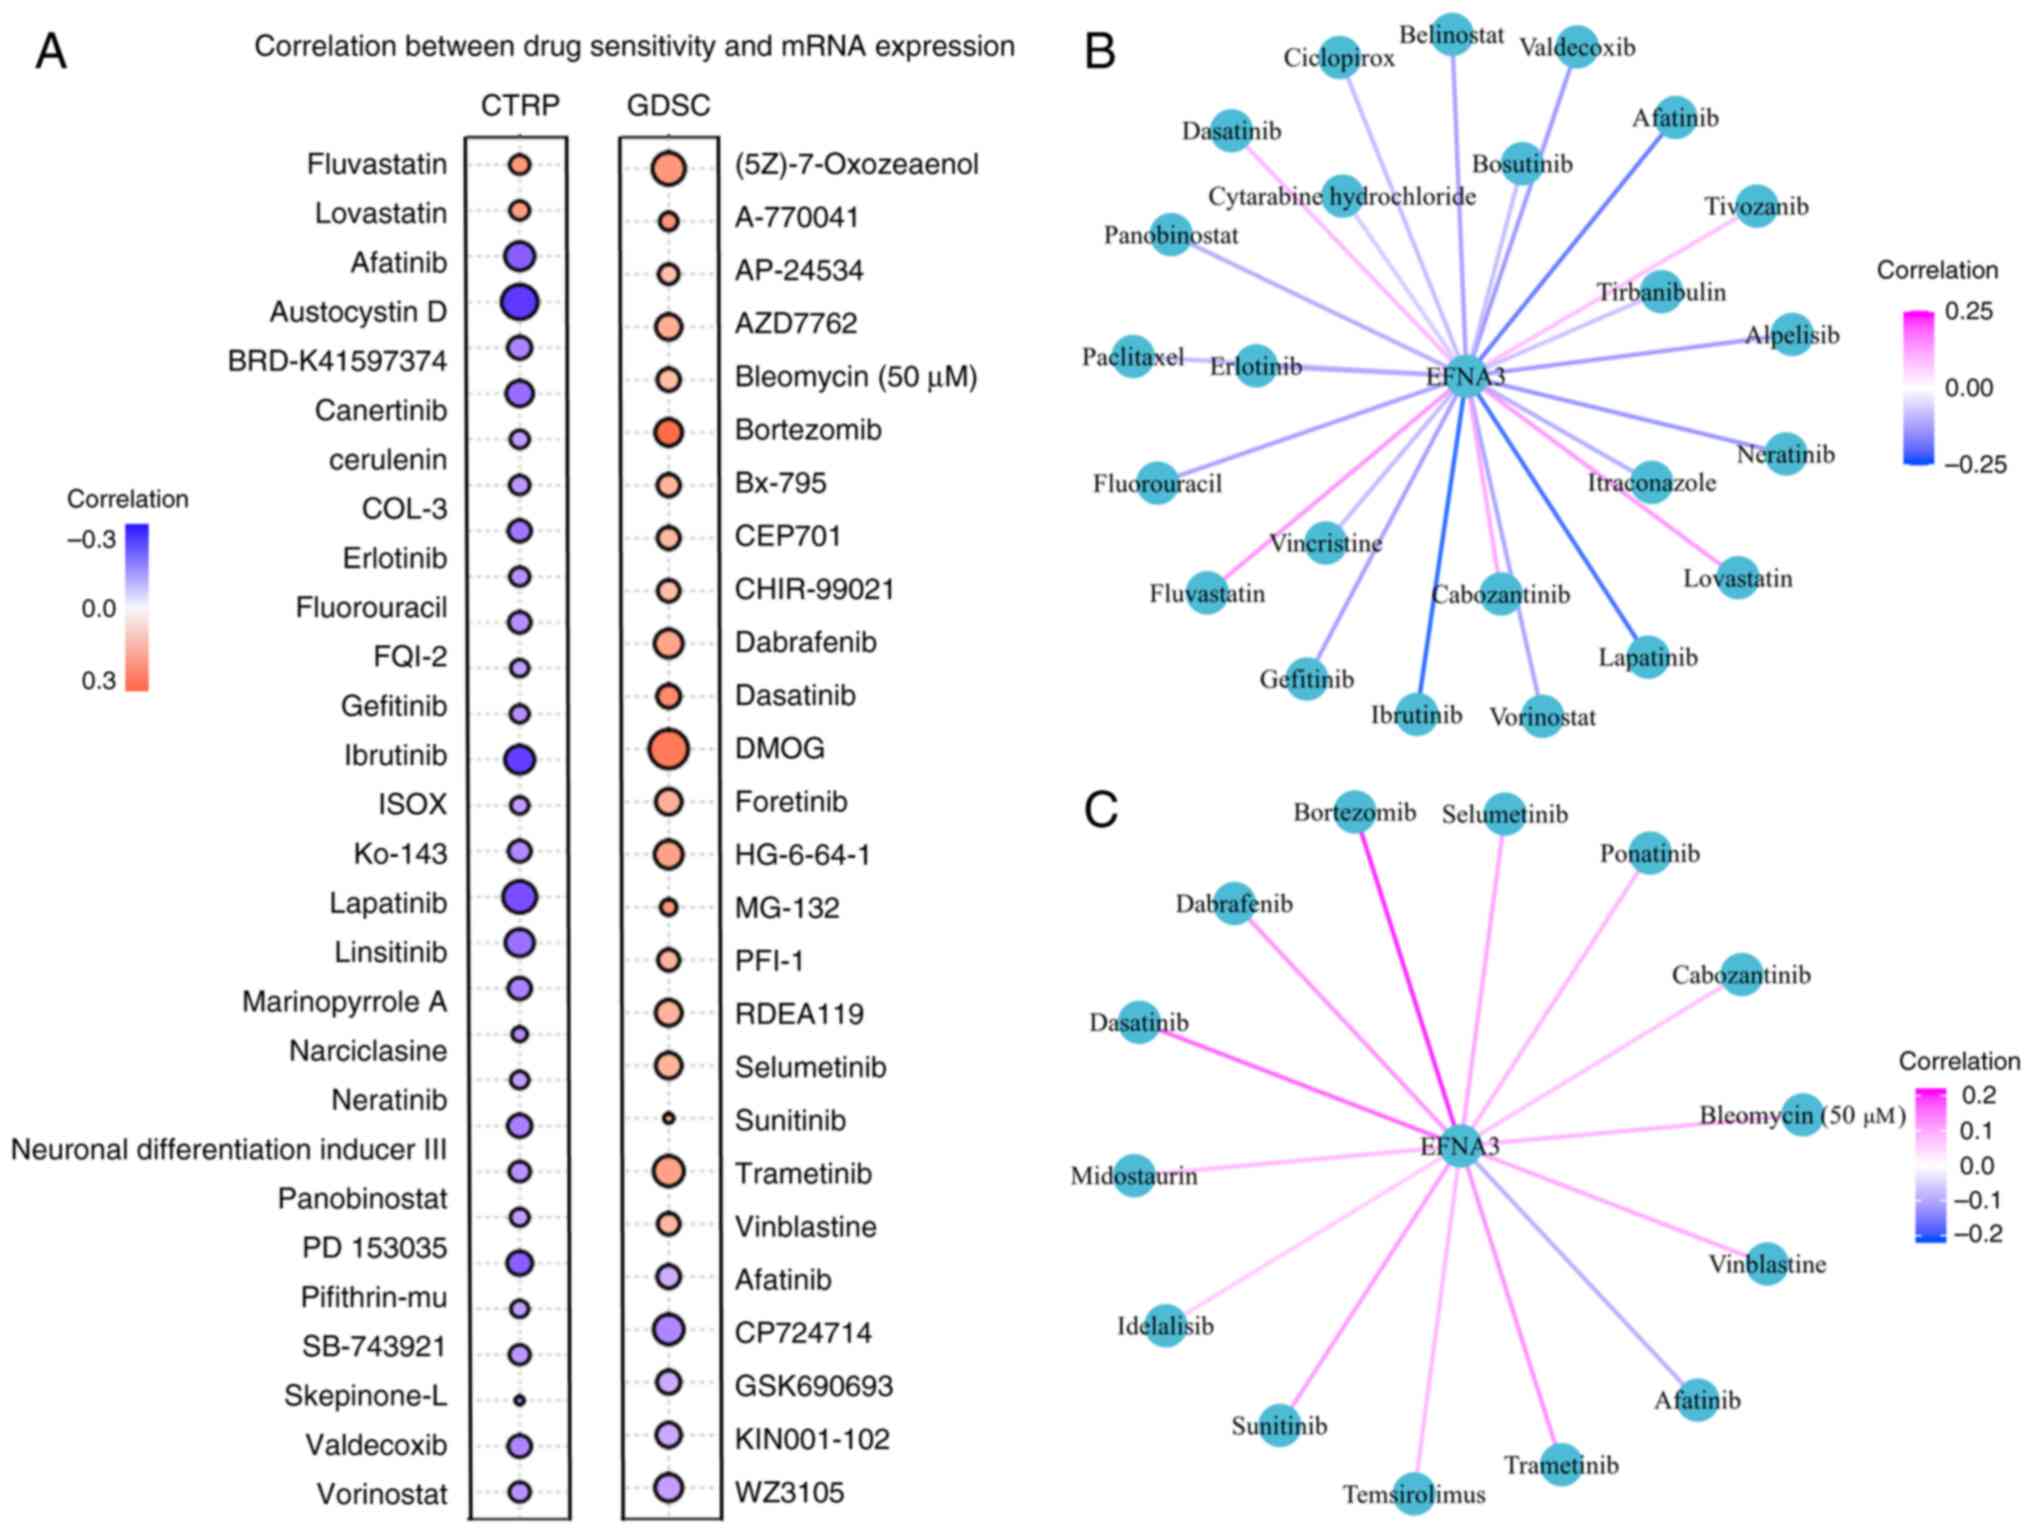
EFNA3 expression and drug sensitivity
prediction
were screened CTRP analysis demonstrated a positive
correlation between EFNA3 expression and sensitivity to lovastatin
and fluvastatin, and a negative correlation with austocystin D,
ibrutinib and lapatinib (Fig. 7A).
In the GDSC dataset, EFNA3 expression levels correlated positively
with bortezomib, dimethyloxalylglycine and dasatinib sensitivity
but negatively with CP-724714, WZ3105 and KIN001-102. Additionally,
using a cut-off of FDR<0.05, 24 (CTRP) and 14 (GDSC)
FDA-approved antitumor drugs were significantly associated with
EFNA3 expression levels (Fig. 7B and
C; Tables SXI and SXII).
Association of EFNA3 with
clinicopathological features in ACC
EFNA3 expression levels were significantly
associated with primary treatment outcome (P=0.015), Weiss necrosis
(P=0.039), tumor status (P<0.001), diffuse architecture
(P=0.026), pathological stage (P=0.034), N-stage (P=0.037) and sex
(P=0.030; Table I and Fig. 8A-F). Diagnostic ROC analysis
demonstrated a high discriminatory power of EFNA3 [area under the
curve (AUC)=0.829; Fig. 8G]. The
ROC curve analysis demonstrated that EFNA3 exhibited diagnostic
accuracy for ACC across multiple time points. The AUC was 0.764 for
1-year survival, 0.756 for 3-year survival and 0.812 for 5-year
survival. Furthermore, on the 1-year ROC curve, a cut-off value of
5.526 was identified for EFNA3 expression (Fig. 8H). The time-dependent ROC analysis
assessed the trend of EFNA3 diagnostic accuracy over time. The AUC
remained at a high level (≥0.7) across all time points (Fig. 8I).
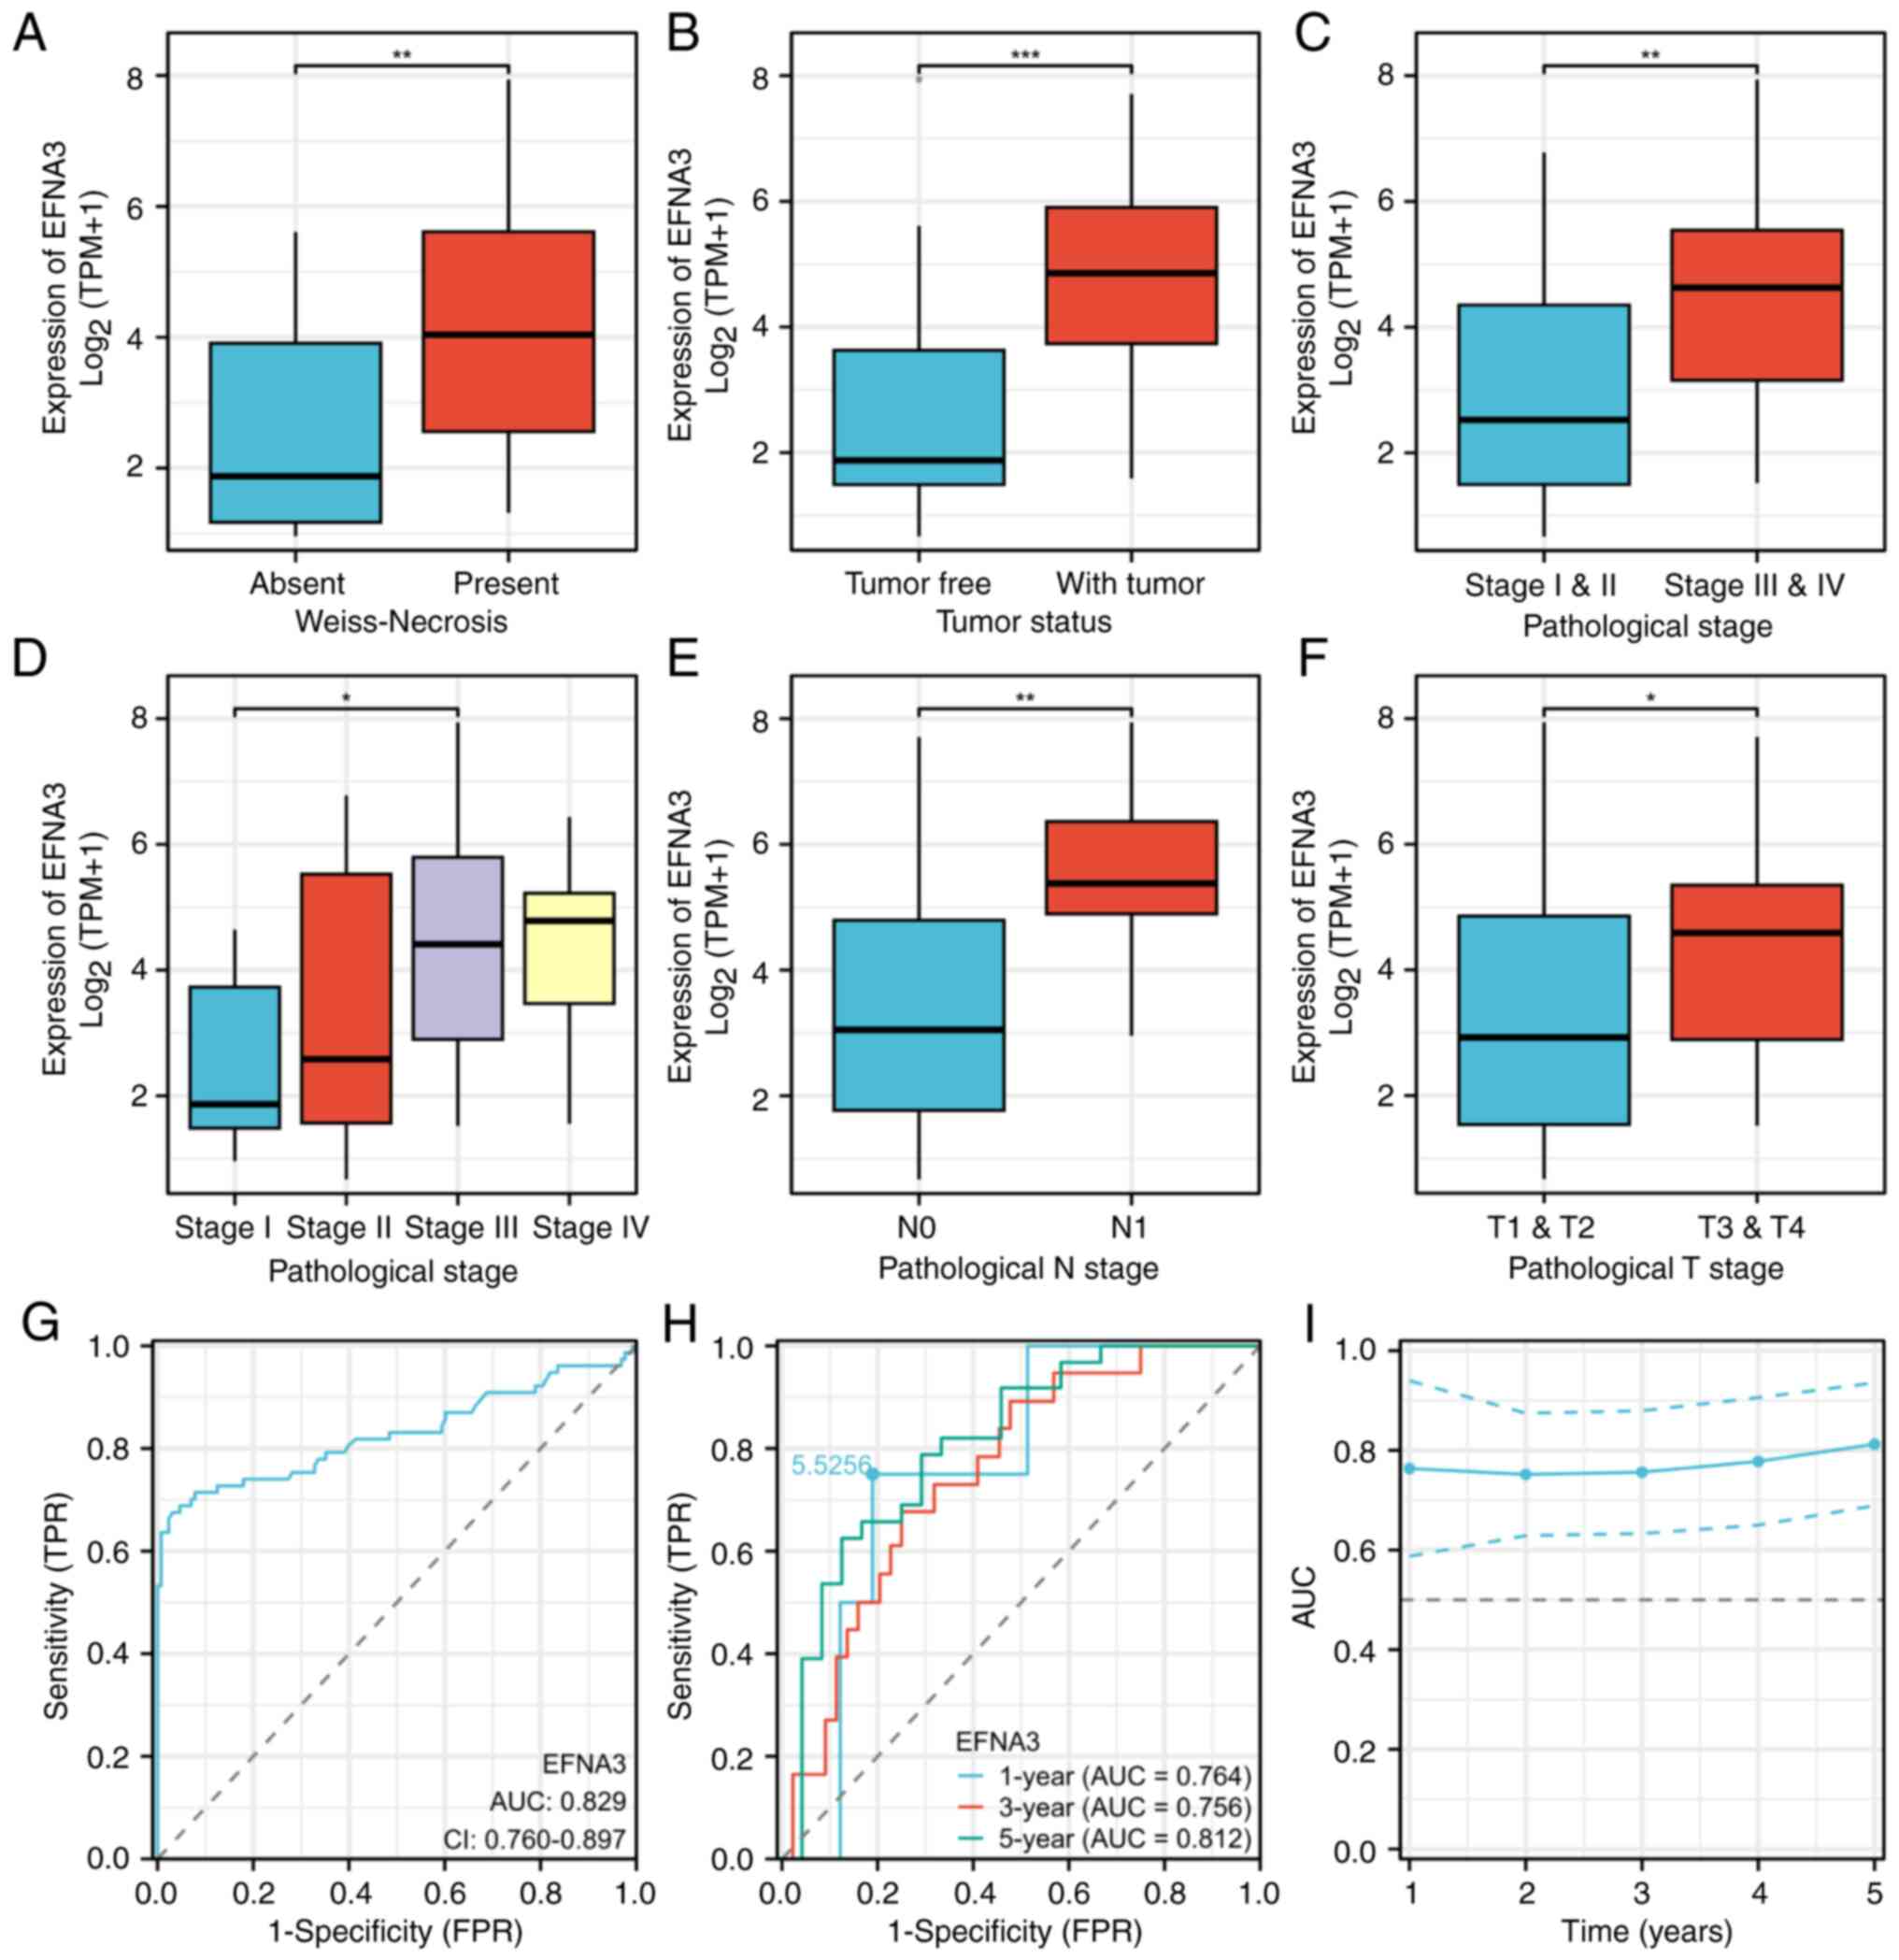 | Figure 8.Association between EFNA3 expression
and clinicopathological features in ACC. Association of EFNA3
expression levels with (A) Weiss-Necrosis, (B) tumor status, (C)
pathological stage: I & II vs. III & IV), (D) pathological
stage: I vs. II vs. III vs. IV (Kruskal-Wallis and Dunn's
analysis), (E) pathological N stage and (F) pathological T stage:
T1& T2 vs. T3 & T4 (Mann-Whitney U test). (G) Diagnostic
value of EFNA3 in ACC. (H) Time-dependent prognostic value of EFNA3
at 1-, 3- and 5-years. (I) CI of time-dependent diagnostic value;
normal group, n=128; tumor group, n=77. The error bars indicate the
standard deviation. ROC analysis was performed using the pROC
package; the AUC and cumulative survival rate corresponding to each
time point were calculated using the time ROC package. *P<0.05,
**P<0.01 and ***P<0.001. EFNA3, ephrin-A3; ACC,
adrenocortical carcinoma; AUC, area under the curve; N, node; T,
tumor; TPR, true positive rate; FPR, false positive rate. |
 | Table I.Correlation between EFNA3 expression
levels and clinicopathological characteristics. |
Table I.
Correlation between EFNA3 expression
levels and clinicopathological characteristics.
| Characteristic | Low expression of
EFNA3, n (%) | High expression of
EFNA3, n (%) | P-value |
|---|
| Total patients | 39 (49.4) | 40 (50.6) |
|
| Pathological N
stage |
|
| 0.037 |
| 0 | 37 (46.8) | 31 (39.2) |
|
| 1 | 1 (1.3) | 8 (10.1) |
|
|
Unknown | 1 (1.3) | 1 (1.3) |
|
| Pathological
stage |
|
| 0.034 |
| I | 6 (7.6) | 3 (3.8) |
|
| II | 23 (29.1) | 14 (17.7) |
|
|
III | 5 (6.3) | 11 (13.9) |
|
| IV | 4 (5.1) | 11 (13.9) |
|
|
Unknown | 1 (1.3) | 1 (1.3) |
|
| Tumor status |
|
| <0.001 |
| Tumor
free | 29 (36.7) | 10 (12.7) |
|
| With
tumor | 8 (10.1) | 30 (38.0) |
|
|
Unknown | 2 (2.5) | 0 (0.0) |
|
| Primary therapy
outcome |
|
| 0.015 |
|
Progressive disease | 4 (5.1) | 14 (17.7) |
|
| Stable
disease | 1 (1.3) | 1 (1.3) |
|
| Partial
response | 1 (1.3) | 0 (0.0) |
|
|
Complete response | 30 (38) | 16 (20.3) |
|
|
Unknown | 3 (3.8) | 9 (11.4) |
|
| Sex |
|
| 0.030 |
|
Female | 19 (24.1) | 29 (36.7) |
|
|
Male | 20 (25.3) | 11 (13.9) |
|
| Weiss-Necrosis |
|
| 0.039 |
|
Absent | 12 (15.2) | 5 (6.3) |
|
|
Present | 24 (30.4) | 33 (41.8) |
|
|
Unknown | 3 (3.8) | 2 (2.5) |
|
| Weiss-Diffuse
architecture |
|
| 0.026 |
|
Absent | 5 (6.3) | 14 (17.7) |
|
|
Present | 24 (30.4) | 18 (22.8) |
|
|
Unknown | 10 (12.7) | 8 (10.1) |
|
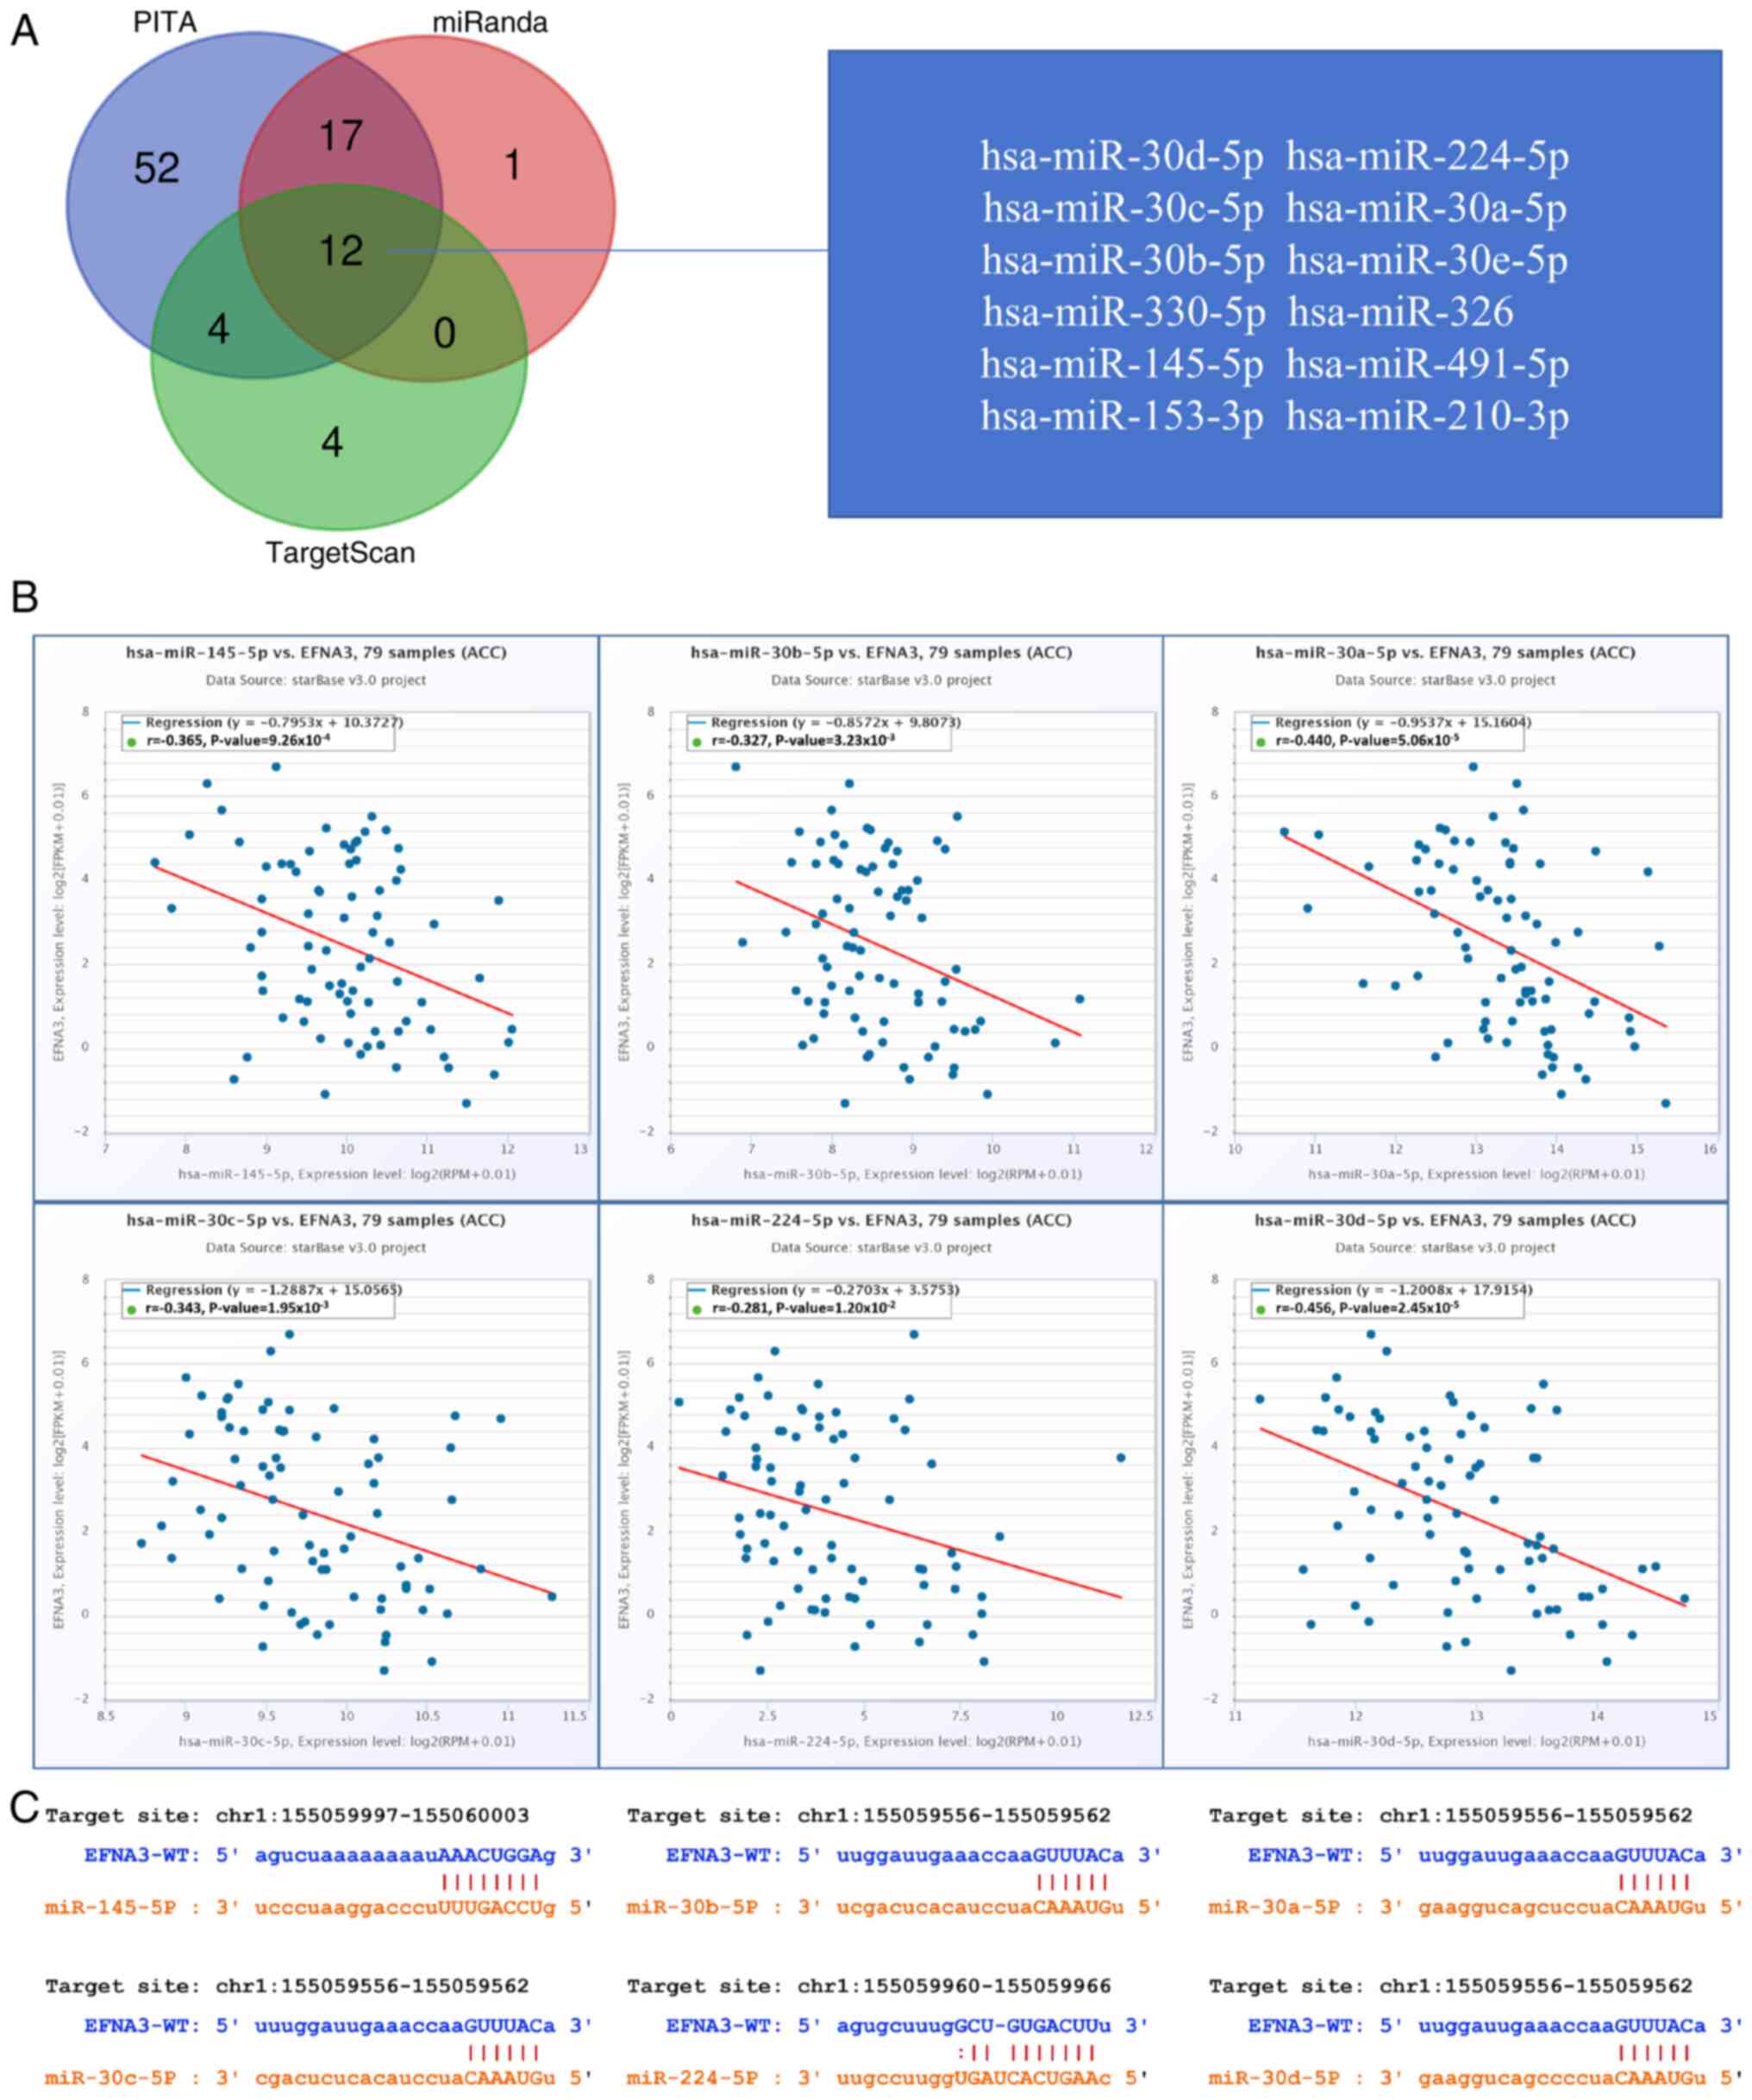
EFNA3 related ceRNA network
construction in ACC
The PITA, miRanda and TargetScan databases were used
to analyze and predict 85, 30 and 20 EFNA3 target miRNAs,
respectively. A total of 12 target miRNAs were found to be in
common from the three database predictions, including
hsa-miR-30d-5p, hsa-miR-224-5p, hsa-miR-30c-5p, hsa-miR-30a-5p,
hsa-miR-30b-5p, hsa-miR-30e-5p, hsa-miR-330-5p, hsa-miR-326,
hsa-miR-145-5p, hsa-miR-491-5p, hsa-miR-153-3p and hsa-miR-210-3p
(Fig. 9A). In addition, correlation
analysis between target miRNAs and EFNA3 expression was performed
to identify candidates for further investigation of ceRNA
interactions. Correlation analysis demonstrated the expression
levels of 6 target miRNAs negatively correlated with EFNA3
expression levels, namely hsa-miR-145-5p (r=−0.365,
P=9.26×10×10−4), hsa-miR-30b-5p (r=−0.327,
P=3.23×10⁻³), hsa-miR-30a-3p (r=−0.44,
P=5.06×10⁻⁵), hsa-miR-30c-5p (r=−0.343,
P=1.95×10⁻³), hsa-miR-224-5p (r=−0.281,
P=1.20×10⁻²) and hsa-miR-30d-5p (r=−0.456,
P=2.45×10⁻⁵; Fig. 9B).
TargetScan was used to predict the potential binding sites of EFNA3
to the target miRNAs identified (Fig.
9C).
The miRNet and starBase online databases were used
to further predict lncRNAs that may bind to the six target miRNAs
(hsa-miR-145-5p, hsa-miR-30b-5p, hsa-miR-30a-5p, hsa-miR-30c-5p,
hsa-miR-224-5p and hsa-miR-30d-5p; Fig. 10A). A negative correlation between
specific lncRNAs and miRNA was observed; the ceRNA network
hypothesis suggests that the lncRNA may act as a molecular sponge,
sequestering the miRNA and reducing its regulatory activity,
consistent with miRNA-mediated ceRNA crosstalk (29). Therefore, the starBase database was
used to analyze the correlation between target lncRNA expression
and miRNA in ACC. Correlation analysis proved that there are 5
target lncRNAs expression levels that are negatively correlated
with hsa-miR-30d-5p, namely AC239868.1, EPB41L4A-AS1, AL049840.4,
OIP5-AS1 and SNHG16 (Fig. 10B).
However, only the expression level of SNHG16 was negatively
correlated with hsa-miR-30c-5p (Fig.
10C). Furthermore, the expression of OIP5-AS1 and SNHG16 were
negatively correlated with hsa-miR-30b-5p (Fig. 10D). The expression of MAGI2-AS3 and
LINC00205 were negatively correlated with hsa-miR-224-5p (Fig. 10E). There were 4 target lncRNAs
expression levels that are negatively correlated with
hsa-miR-30a-5p, respectively EPB41L4A-AS1, PVT1, HELLPAR and DLEU2
(Fig. 10F). Based on the ceRNA
hypothesis, regarding the inverse relationship between miRNA and
lncRNA or mRNA (29), 14 pairs of
ceRNA networks (EPB41L4A-AS1-hsa- miR-30a-5p- EFNA3,
PVT1-hsa-miR-30a-5p-EFNA3, HELLPAR- hsa-miR-30a-5p-EFNA3,
DLEU2-hsa-miR-30a-5p- EFNA3, OIP5-AS1-hsa-miR-30b-5p-EFNA3, SNHG16-
hsa-miR-30b-5p-EFNA3, SNHG16-hsa-miR-30c-5p- EFNA3,
AC239868.1-hsa-miR-30d-5p-EFNA3, EPB41L4A-
AS1-hsa-miR-30d-5p-EFNA3, AL049840.4- hsa-miR-30d-5p- EFNA3,
OIP5-AS1-hsa- miR-30d-5p- EFNA3, SNHG16-hsa-miR-30d-5p-EFNA3,
MAGI2- AS3- hsa-miR-224-5p-EFNA3 and LINC00205-hsa-
miR-224-5p-EFNA3) were constructed based on the correlation
analysis results (Fig. 10G).
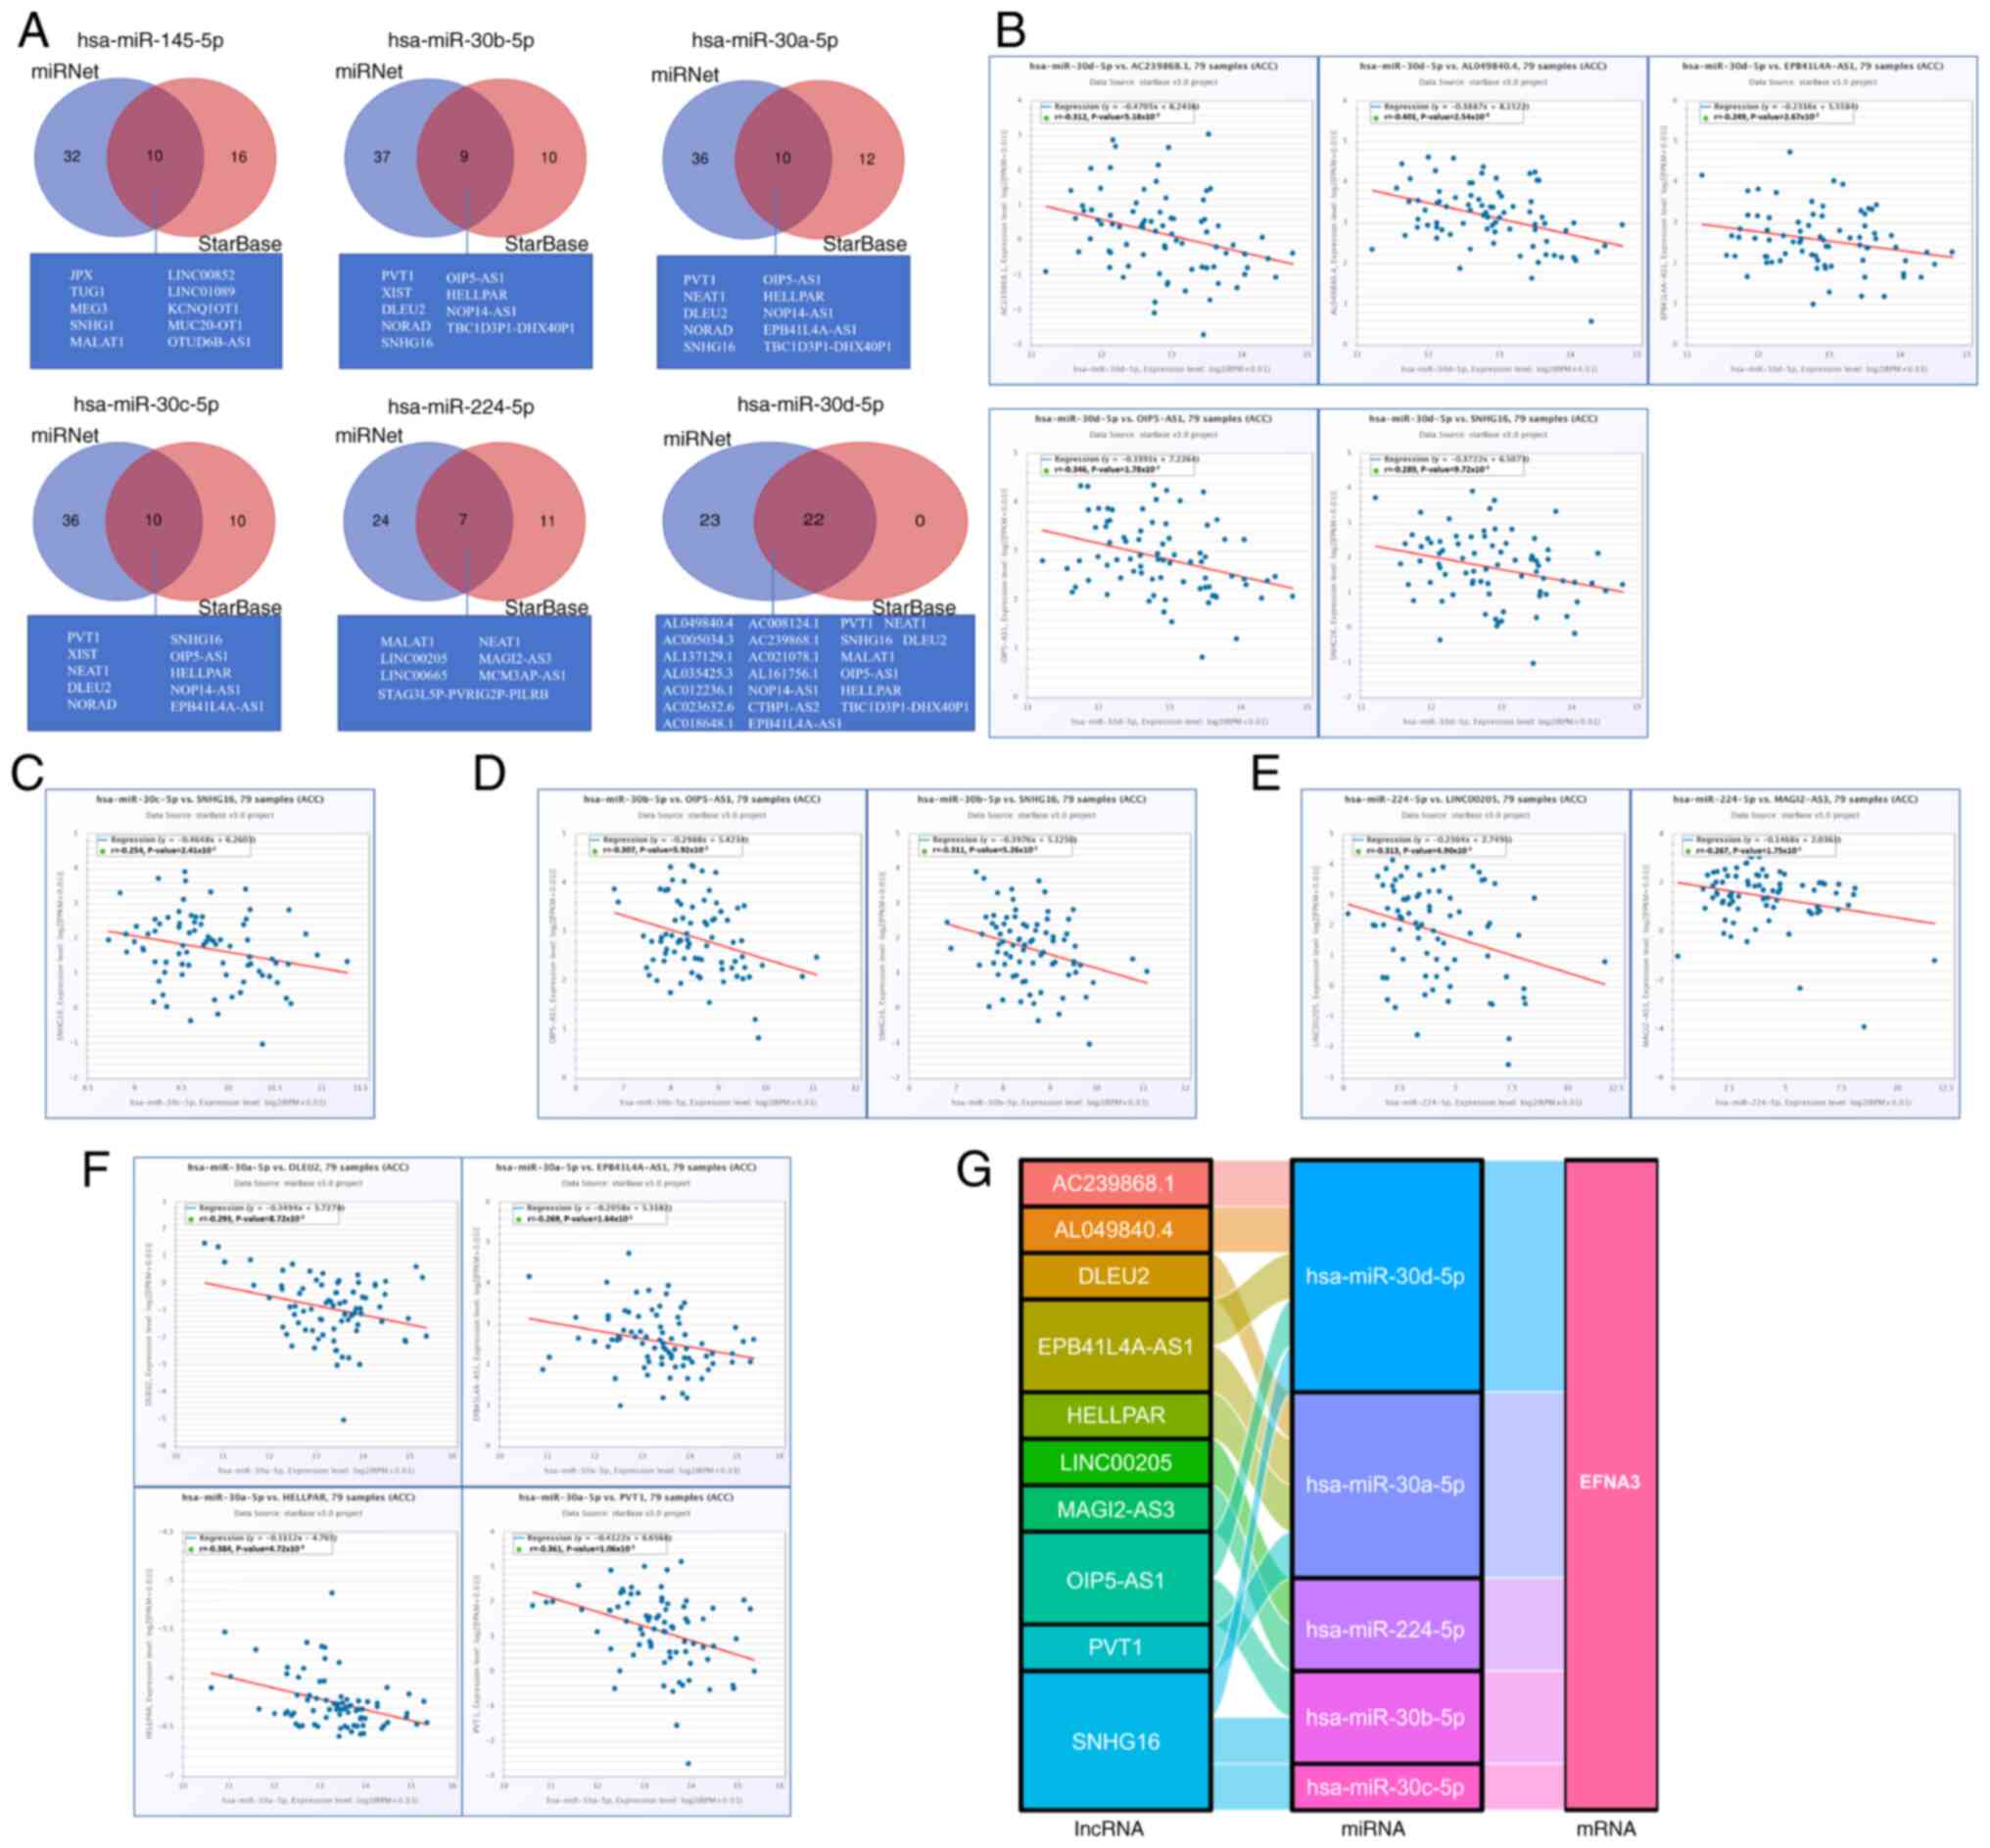 | Figure 10.Prediction of lncRNA and ceRNA
network construction in ACC. (A) Venn diagrams display the target
lncRNAs of hsa-miR-145-5p, hsa-miR-30b-5p, hsa-miR-30a-5p,
hsa-miR-30c-5p, hsa-miR-224-5p and hsa-miR-30d-5p respectively. The
starBase software was used to analyze the correlations between
miRNAs and the target lncRNA. Scatter plots demonstrate the
miRNA-mRNA associations with significant correlation as follow,
lncRNA related to (B) hsa-miR-30d-5p, (C) hsa-miR-30c-5p, (D)
hsa-miR-30b-5p, (E) hsa-miR-224-5p and (F) hsa-miR-30a-5p. (G) The
Sankey diagram displays the lncRNA-miRNA-mRNA EFNA3 regulatory
network in line with the competitive endogenous RNA hypothesis.
EFNA3, ephrin-A3; ACC, adrenocortical carcinoma; miRNA, microRNA;
lncRNA, long non-coding RNA. |
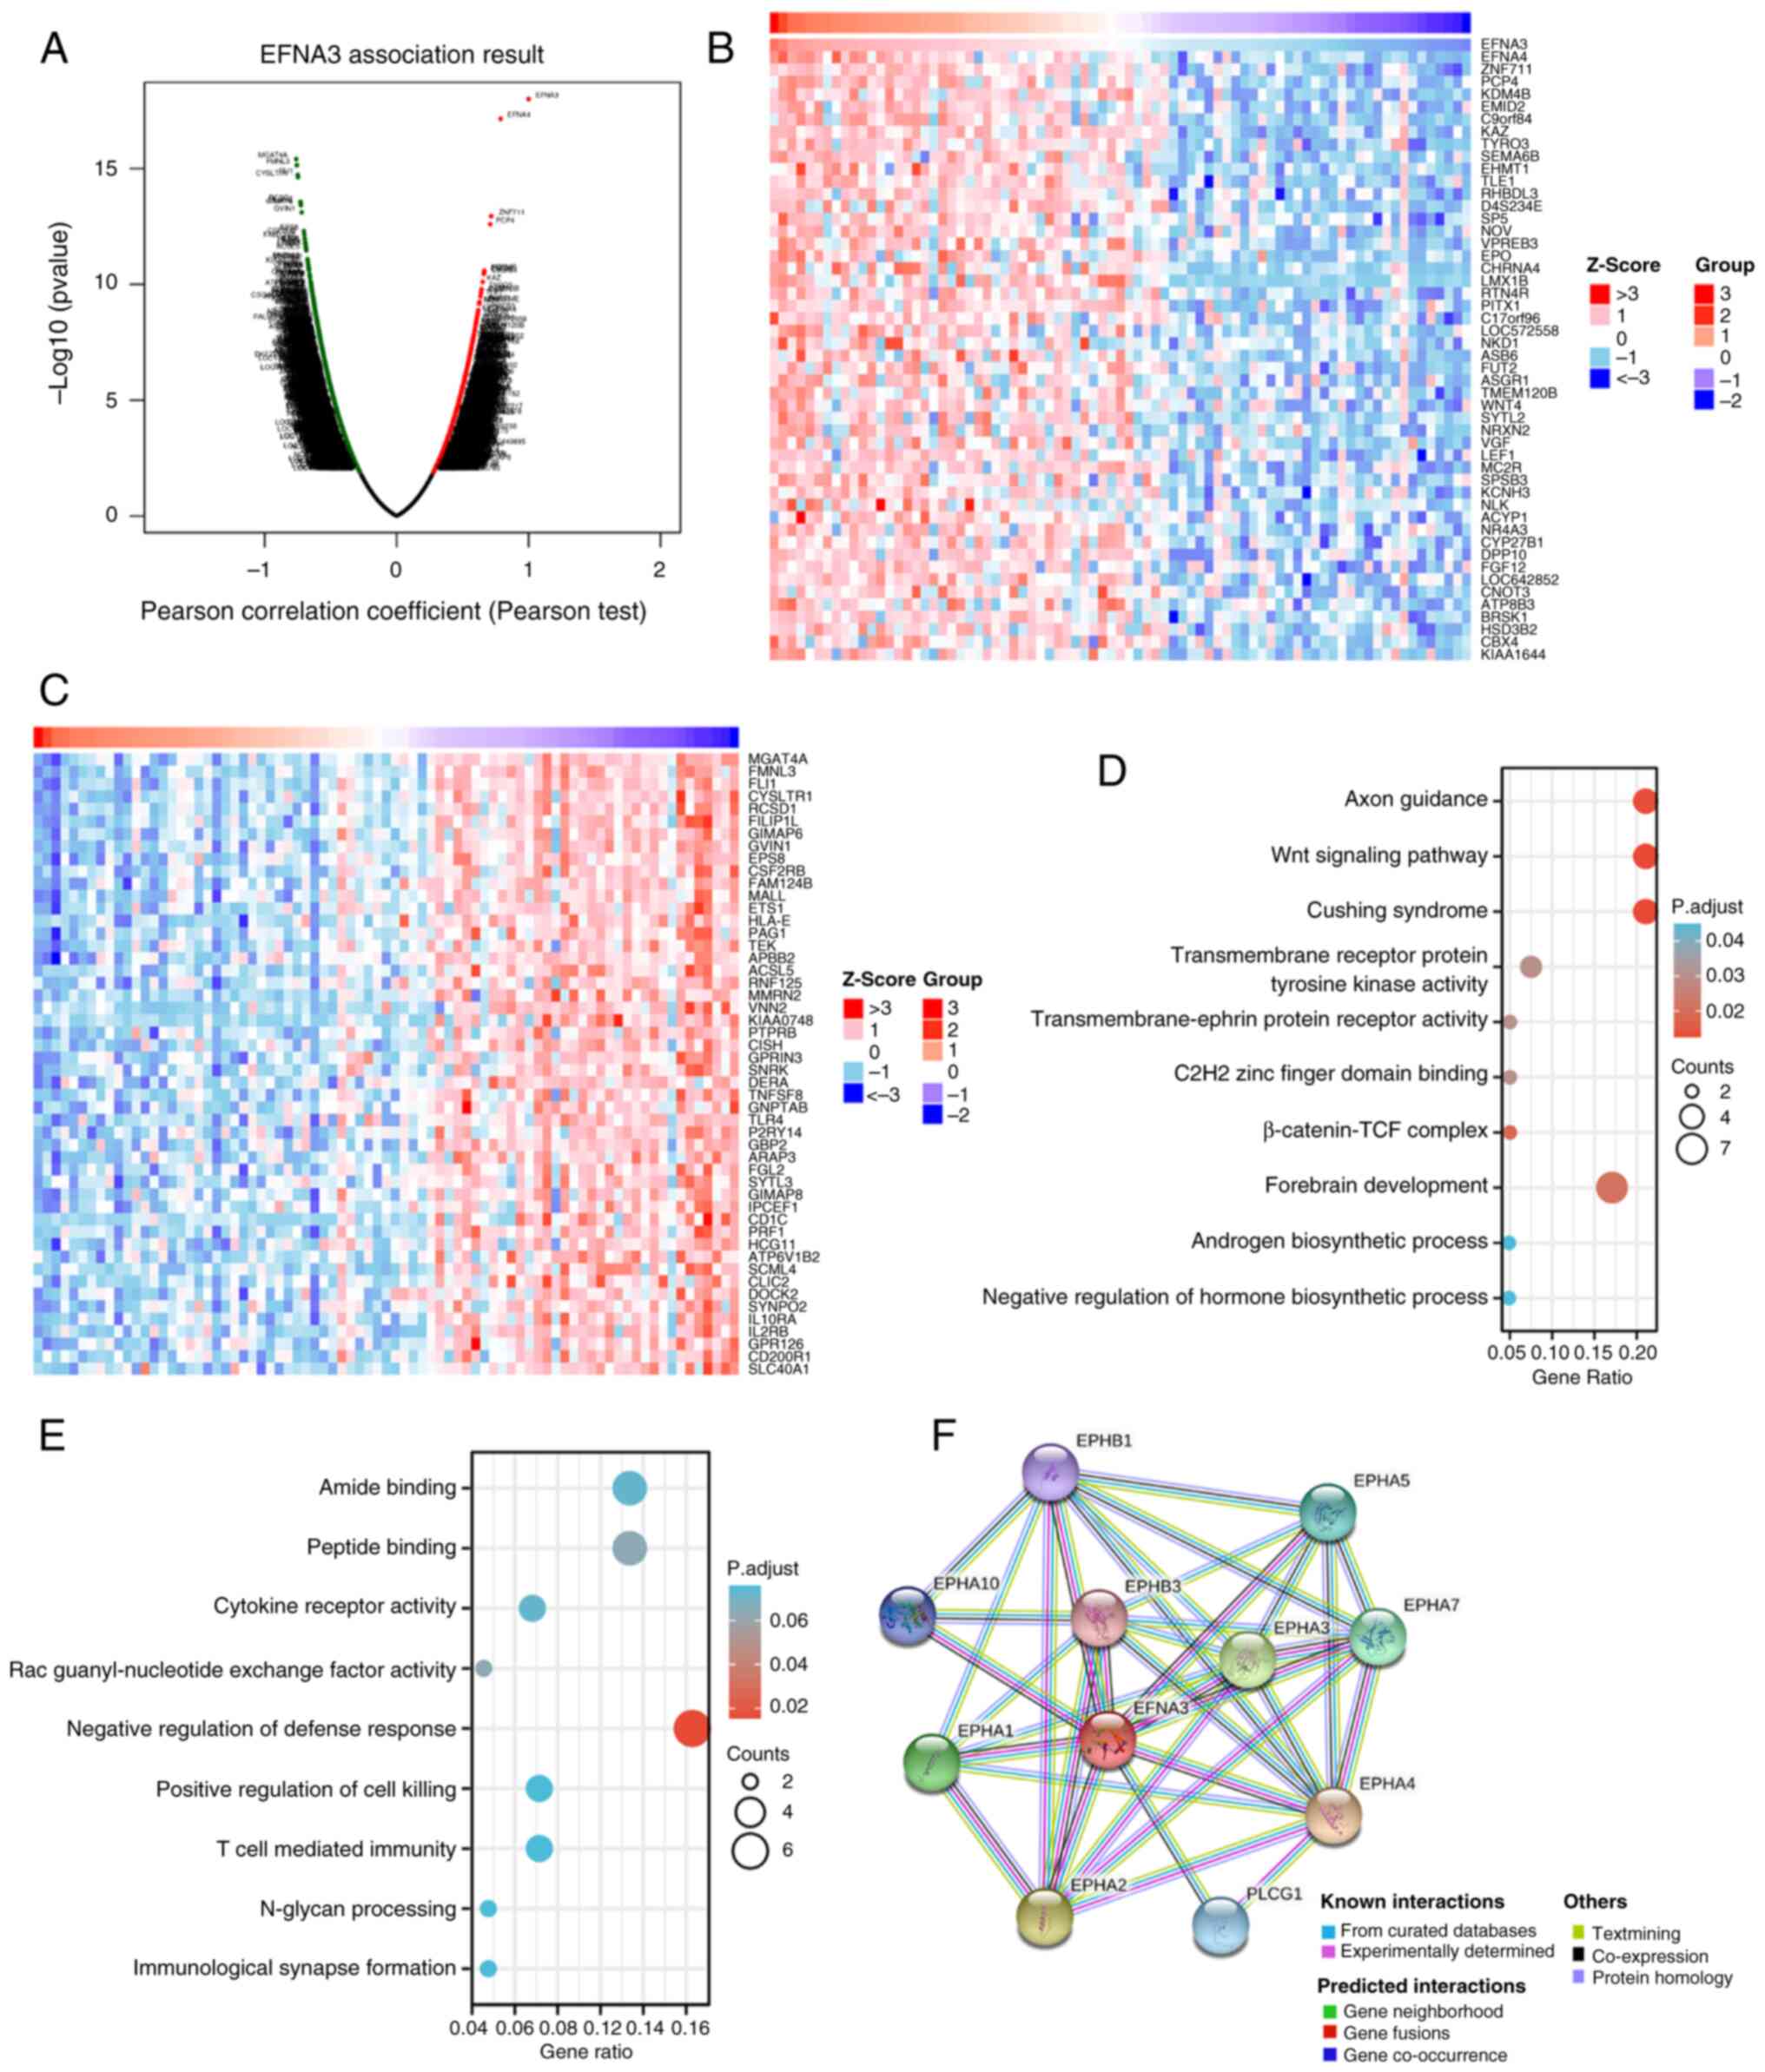
Analysis of genes and functions
co-expressed with EFNA3 in ACC
The LinkedOmics database was used to analyze EFNA3
co-expression in ACC; under the condition of FDR<0.05, 2,000
genes were significantly positively correlated with EFNA3
expression levels (Fig. 11A),
while 2,967 genes were significantly negatively correlated with
EFNA3 expression levels. The genes that were positively and
negatively correlated with EFNA3 expression levels in ACC are
provided in Tables SXIII. The top
50 genes most significantly positively (Fig. 11B) and negatively (Fig. 11C) correlated with EFNA3 expression
levels are displayed in the heat map. Table SXIV, Table SXV summarizes the GO and KEGG
enrichment analyses of genes positively and negatively correlated
with EFNA3 expression. As shown in the functional enrichment
analysis, genes positively correlated with EFNA3 expression were
significantly enriched in pathways and biological terms including
‘Cushing syndrome’, ‘Wnt signaling pathway’, ‘C2H2 zinc finger
domain binding’, ‘forebrain development’, and the ‘β-catenin-TCF
complex’ (Fig. 11D). Genes
negatively correlated with EFNA3 expression were significantly
associated with immune-related processes and molecular functions,
such as ‘T-cell-mediated immunity’, ‘N-glycan processing’,
‘immunological synapse formation’ and ‘cytokine receptor activity’
(Fig. 11E).
The STRING database was used to investigate the PPI
network of EFNA3; EFNA3 was associated with ephrin type-A receptor
4 (EPHA4), ephrin type-A receptor 2 (EPHA2), ephrin type-A receptor
3 (EPHA3), ephrin type-A receptor 7 (EPHA7), ephrin type-A receptor
5 (EPHA5), 1-phosphatidylinositol 4,5-bisphosphate
phosphodiesterase γ-1, ephrin type-A receptor, ephrin type-B
receptor 1 and ephrin type-B receptor 3 (0.999, 0.948, 0.936,
0.929, 0.924, 0.914, 0.904, 0.895, 0.88 and 0.869 respectively;
Fig. 11F). The confidence scores
represent the calculated probability that these associated proteins
have a functional interaction with EFNA3. EPHA4, EPHA2 and EPHA3
had the highest correlation with EFNA3, suggesting that these genes
may serve a promoting role in certain types of tumors. These
results suggested that EFNA3 may be closely related to the
occurrence and development of ACC.
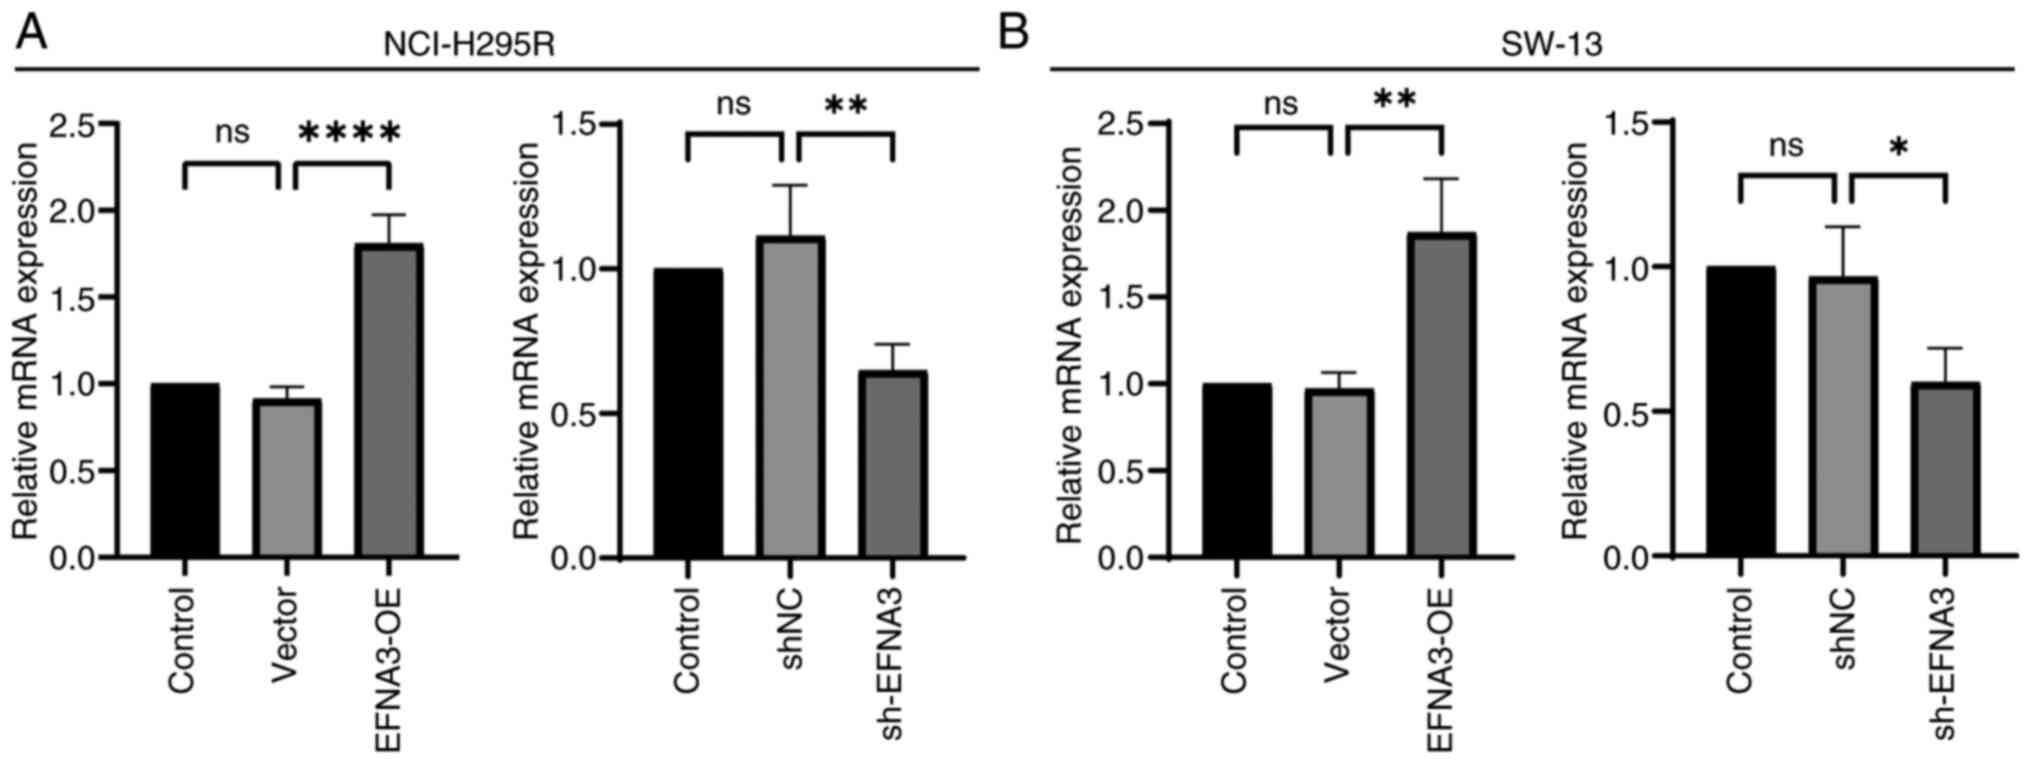
Validation of ACC cell transfection
efficiency
ACC cell transfection efficiency was demonstrated
using RT-qPCR. In NCI-H295R and SW-13 cell lines, the mRNA
expression level in EFNA3-OE group was significantly increased
compared with that of the vector group, and the EFNA3 mRNA
expression in sh-EFNA3 group was significantly decreased compared
with that of the shNC group (P<0.05; Fig. 12).
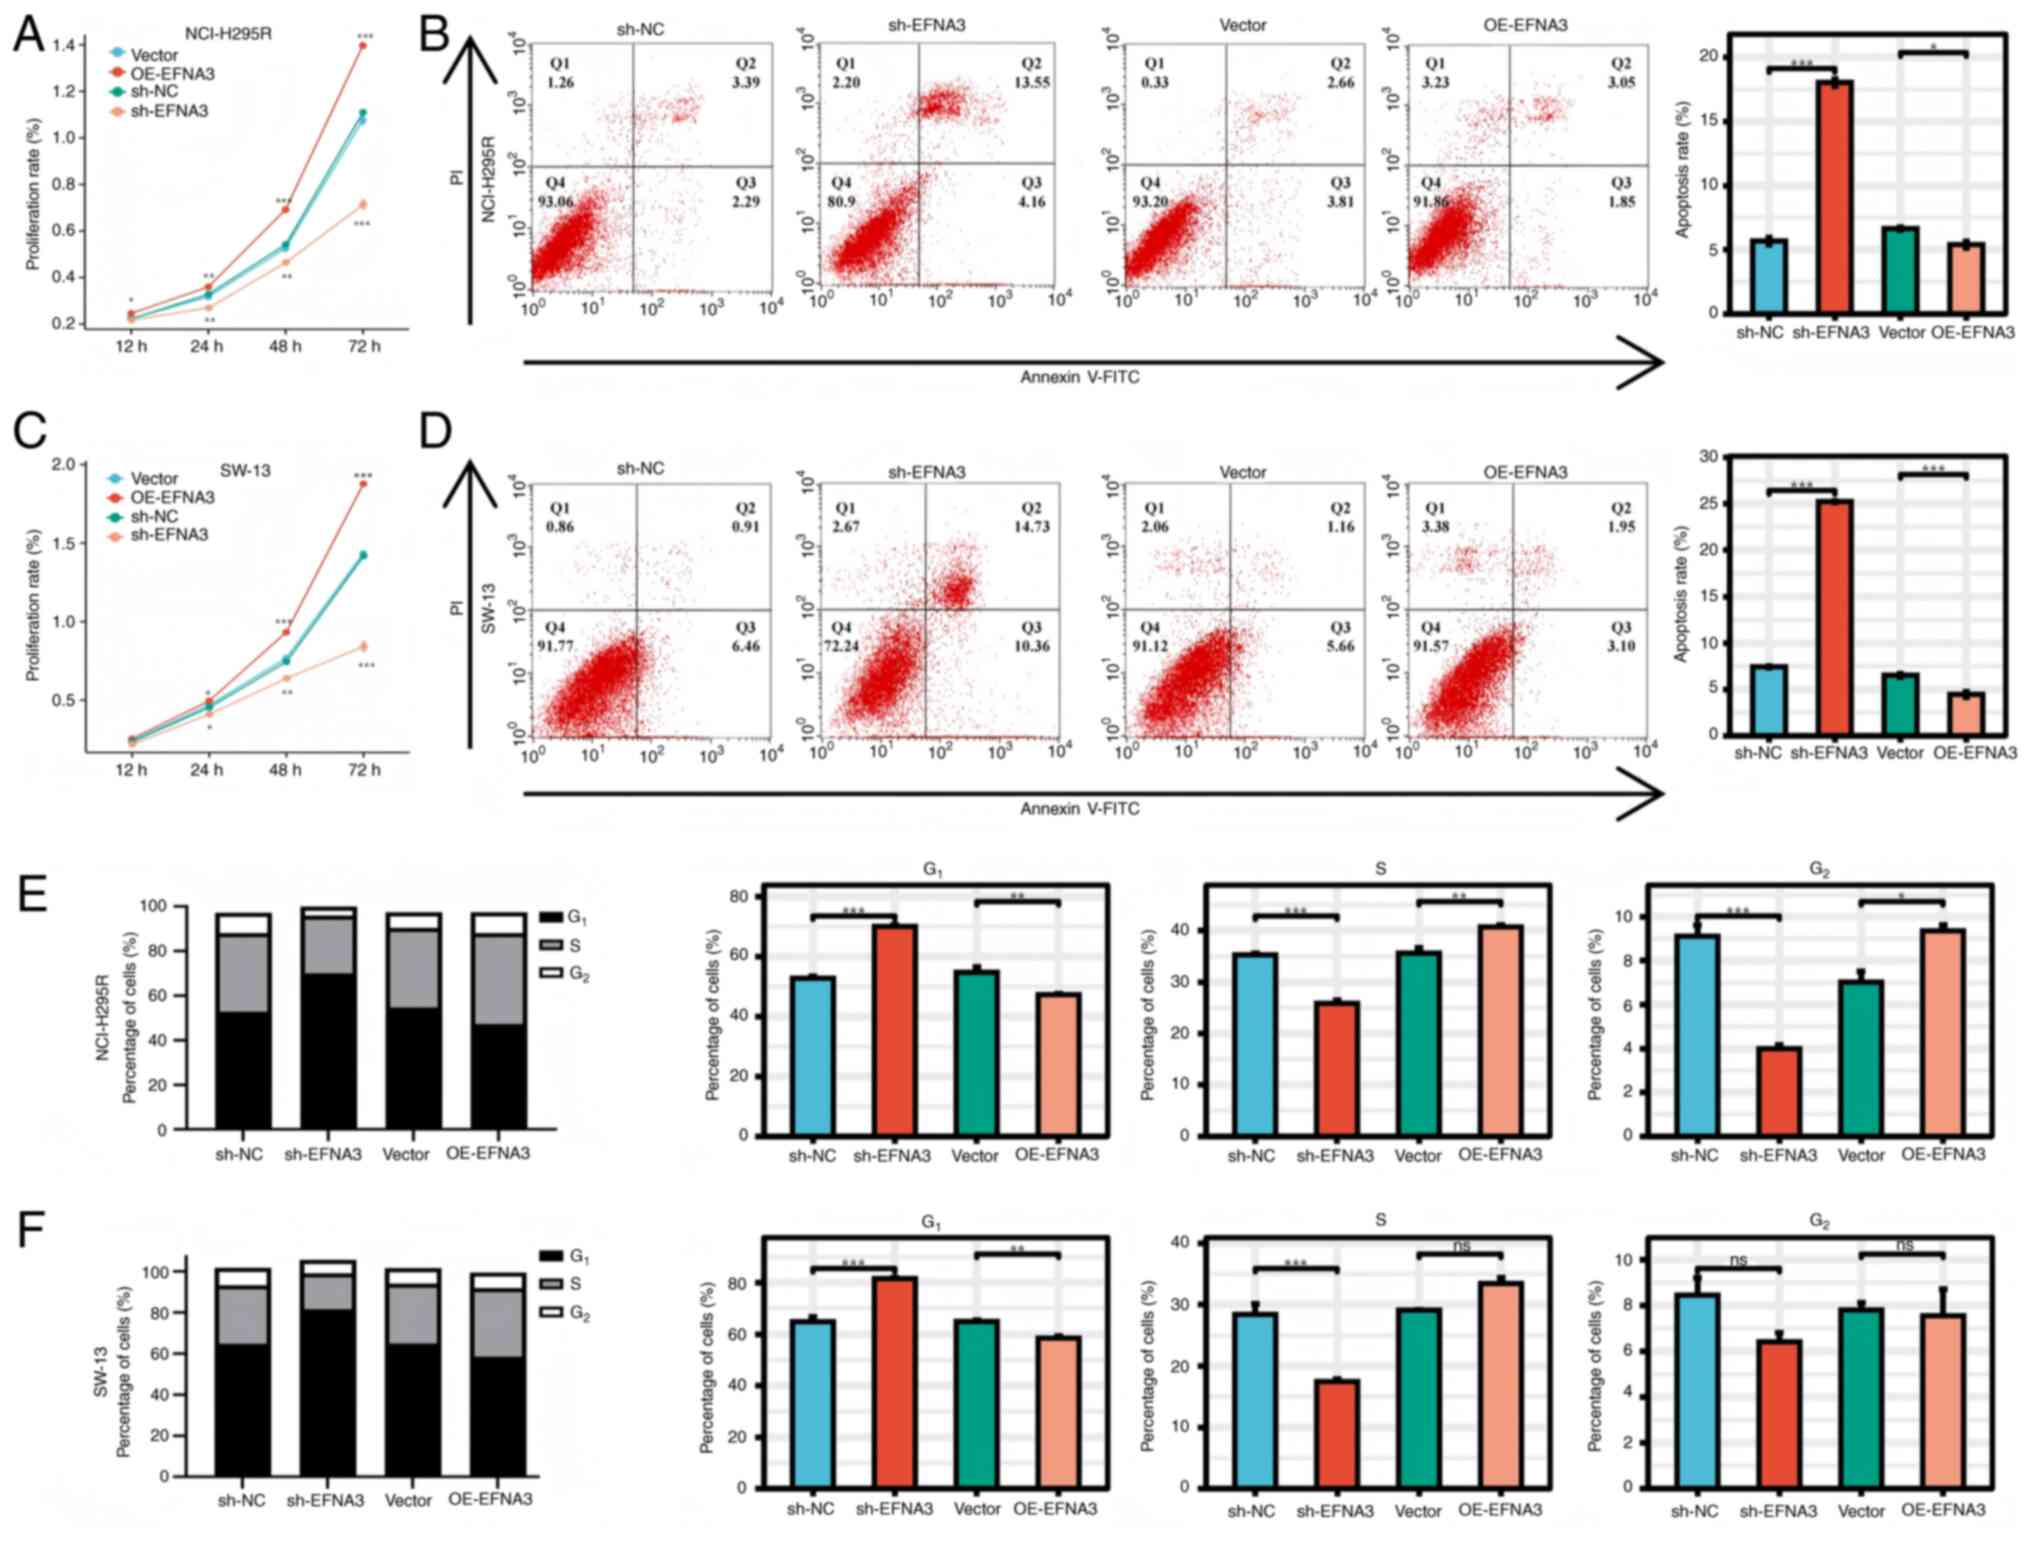
EFNA3 enhances the viability and
invasiveness of ACC cells in vitro
CCK-8 assays demonstrated that EFNA3 overexpression
significantly promoted cell viability compared with that of the
control group, whereas EFNA3 knockdown had the opposite effect.
Flow cytometric analysis demonstrated that EFNA3 knockdown induced
apoptosis and G1/S phase cell cycle arrest. Conversely,
EFNA3 overexpression significantly reduced apoptosis and
facilitated S-phase progression (Fig.
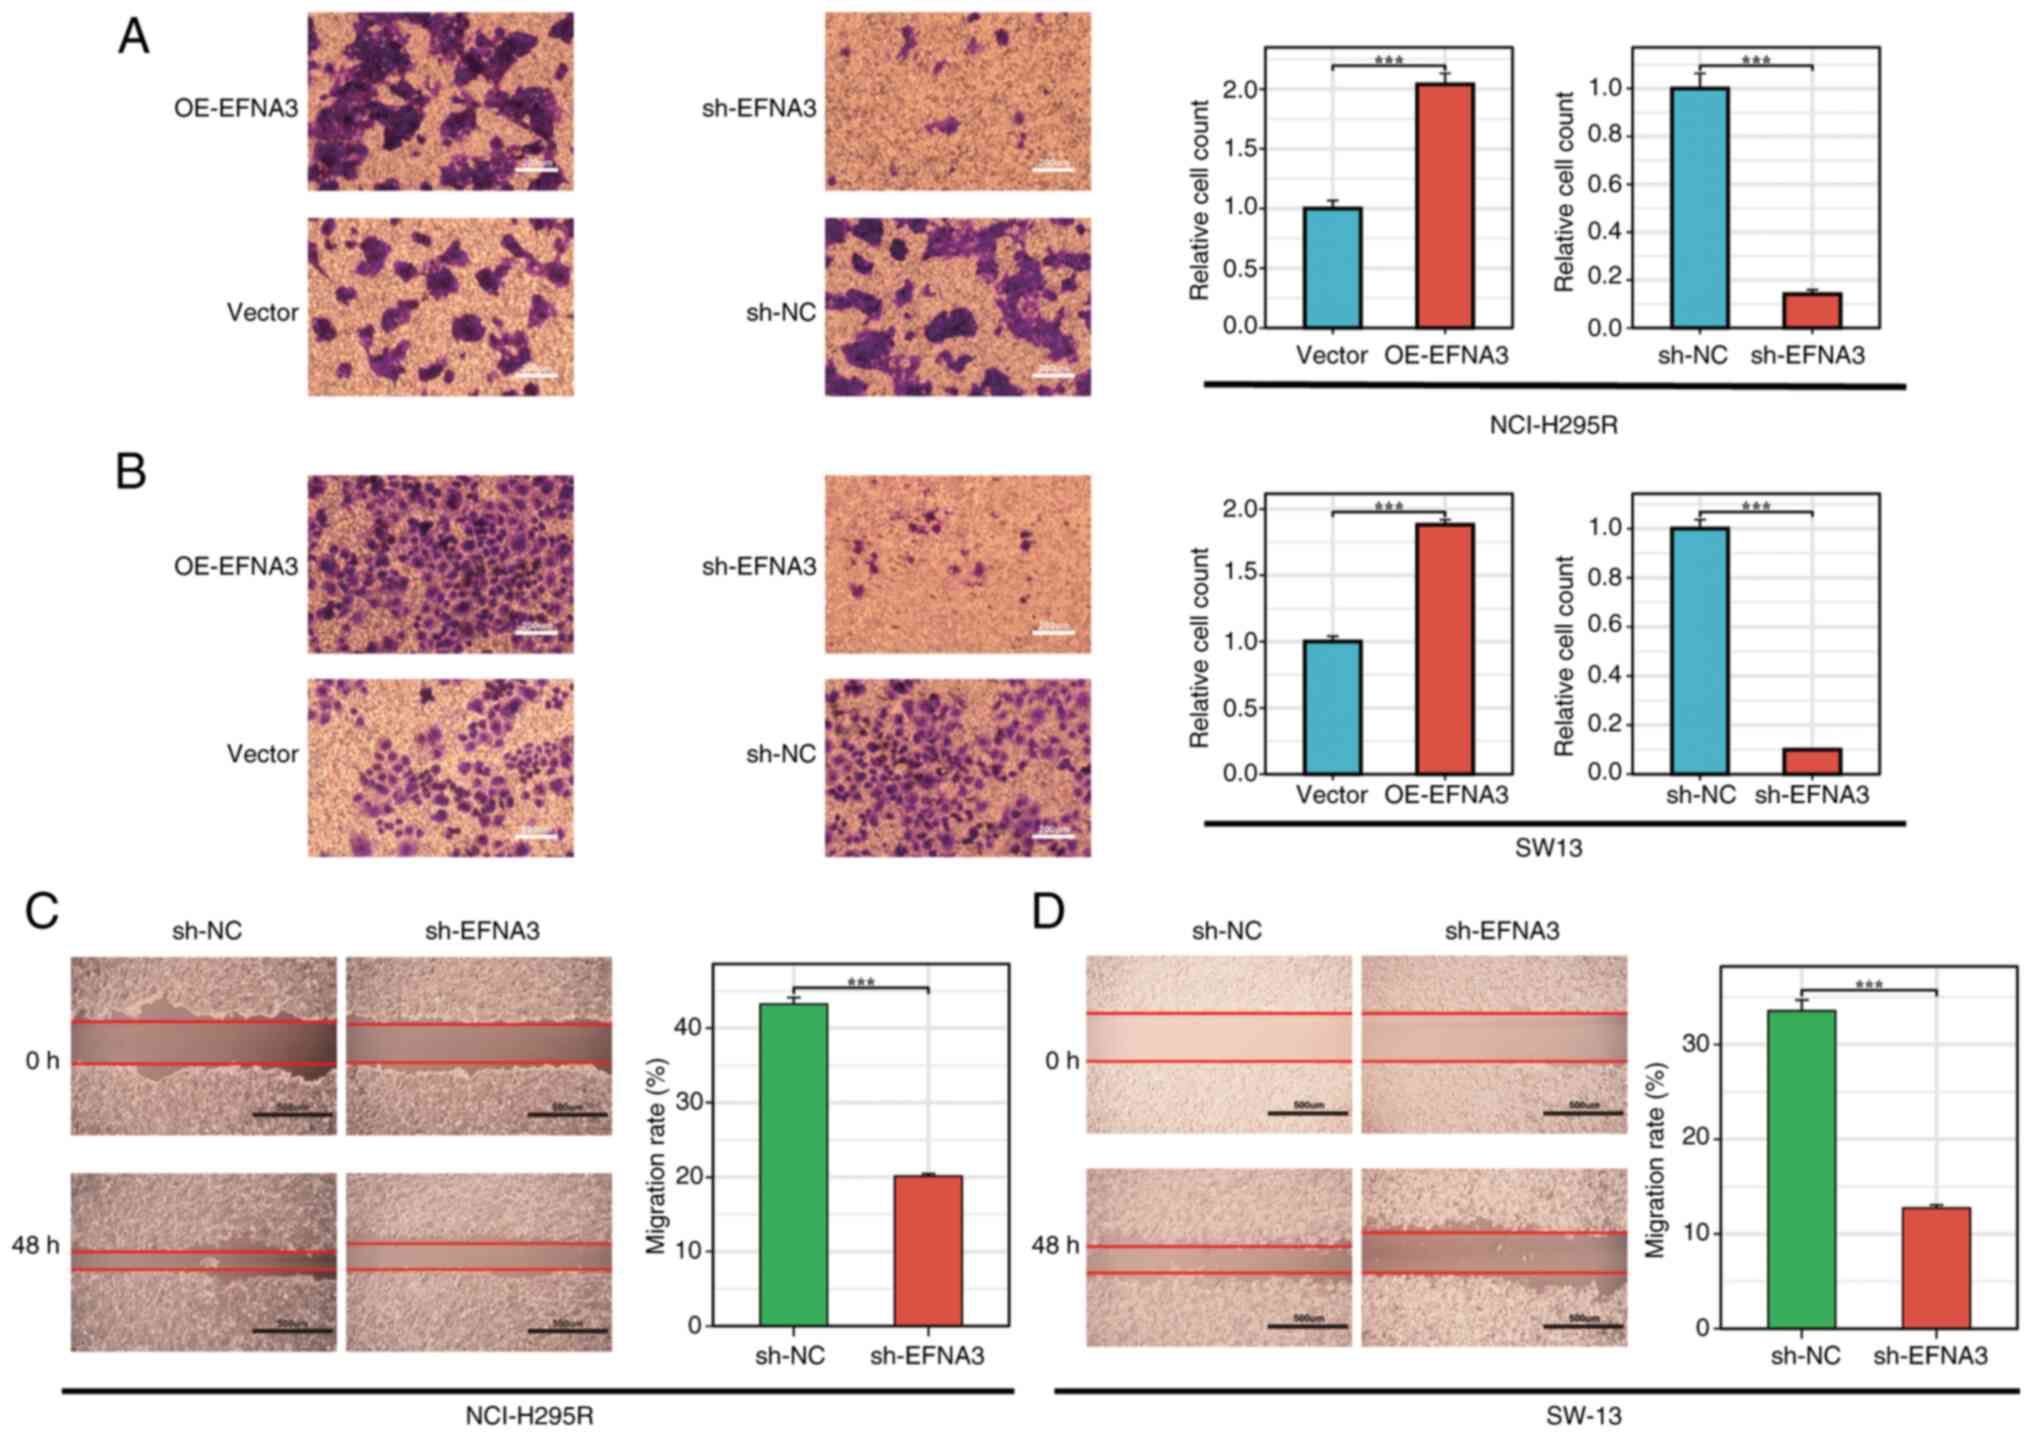
13A-F). In the Transwell and wound healing assays, EFNA3
overexpression significantly enhanced cell migration capabilities,
respectively. By contrast, EFNA3 knockdown significantly impaired
these abilities (Fig. 14A-D).
Discussion
EFNA3, a glycolysis-associated gene, has been
implicated in the progression of several malignancies, including
BC, hepatocellular carcinoma (HCC), oral squamous cell carcinoma,
pancreatic adenocarcinoma, lung adenocarcinoma (LUAD),
pheochromocytoma and stomach adenocarcinoma, and has been proposed
as a diagnostic and prognostic biomarker in these contexts
(14,30–33). A
recent multi-omics study demonstrated epigenetic regulation of
EFNA3 in metastatic pheochromocytomas and paragangliomas,
identifying a differentially methylated probe (cg12741345) located
within the gene body of EFNA3 (34). The present study also found the
cg12741345 probe among the 28 CpG sites identified in ACC, which
suggested potential epigenetic dysregulation of EFNA3 in ACC
pathogenesis.
To the best of our knowledge, no comprehensive
pan-cancer analysis of EFNA3 incorporating multi-dimensional data
has been reported. The present results demonstrated that EFNA3 is
significantly upregulated in tumor tissues when compared with that
of adjacent normal tissues across multiple cancer types, including
BLCA, CHOL and colon adenocarcinoma. However, in GBM, KICH, LAML
and SKCM, EFNA3 expression levels were significantly reduced. These
cancer types have not been well explored regarding the biological
role of EFNA3, and the clinical significance of this downregulation
remains currently unclear.
EFNA3 is involved in multiple cellular functions,
including tumor malignancy, angiogenesis, energy metabolism and
intratumoral hypoxia. In HCC, EFNA3 upregulation correlates with
more aggressive tumor behavior, promotion of self-renewal,
proliferation, migration and tumor stemness (35). Mechanistically, under hypoxic
conditions, hypoxia-inducible factor 1α (HIF-1α) increases EFNA3
expression in HCC by increasing copy number (12). Deng et al (14) demonstrated that knocking down EFNA3
significantly inhibits the proliferation and glycolytic capacity of
LUAD cells. Yiminniyaze et al (36) further demonstrated that EFNA3
induces epithelial-mesenchymal transition by enhancing ERK and AKT
phosphorylation levels, while upregulating MMP2 and MMP9
expression. In choroidal melanoma, EFNA3 promotes cell
proliferation and migration by activating the STAT3/AKT signaling
pathway (37). In prostate cancer,
EFNA3 knockout suppresses disease progression by reducing
Ras/Braf/MEK/Erk1/2 phosphorylation levels (38). In pancreatic ductal adenocarcinoma
cells, EFNA3 enhances tumor angiogenesis and cell permeability
through the Wnt/β-catenin pathway (39). This divergent expression pattern may
reflect cancer-type-specific regulatory mechanisms or TME
influences. Further experimental studies are warranted to elucidate
the role of EFNA3 in these malignancies. In the future, in
vivo models can be used to elucidate whether reduced EFNA3
expression confers tumor-suppressive effects or reflects
compensatory biological processes, in order to expand the current
understanding of EFNA3 as a context-dependent modulator in tumor
biology.
Genetic alterations such as single nucleotide and
CNAs are key drivers of oncogenesis and tumor progression (40). In the present pan-cancer analysis,
EFNA3 exhibited a notably high mutation frequency, >40% in BC,
suggesting a potential tumor-promoting role in this context. Within
the ACC cohort, the most prevalent genomic events associated with
EFNA3 were elevated mRNA expression and gene amplification, both
indicative of CNA-driven dysregulation. Survival analyses across
pan-cancer datasets demonstrated that EFNA3 mutations were
associated with poorer overall survival, supporting its relevance
as a clinically significant genomic alteration. Specifically,
patients harboring EFNA3 mutations in ACC showed significantly
reduced OS and DFS compared with those with wild-type EFNA3,
underscoring its potential role as a negative prognostic
marker.
To further elucidate the genetic landscape
associated with EFNA3 expression, mutation profiles between high-
and low-EFNA3 expression groups were compared. CTNNB1 emerged as a
differentially mutated gene, suggesting possible co-regulatory or
downstream interactions. By contrast, EFNA3 expression did not
significantly differ between groups stratified by TP53 or PRKAR1A
mutation status, two well-established drivers in ACC, which
suggested that EFNA3 regulation may operate through mechanisms
independent of TP53/PRKAR1A signaling.
Previous studies have shown that CTNNB1 mutations in
ACC are primarily missense mutations localized to exon 3, which
impair β-catenin degradation and promote Wnt pathway activation
(41,42). Future research should elucidate
whether specific CTNNB1 mutation types, such as exon 3 hotspots
versus null alleles, modulate EFNA3 expression or function. A
mechanistic dissection of EFNA3-CTNNB1 cross-talk may yield novel
insights into the oncogenic circuitry of ACC.
Unlike genomic mutations, epigenetic modifications,
such as DNA methylation and RNA methylation, alter gene expression
without changing the DNA sequence itself (43). These modifications are increasingly
recognized as pivotal regulators of oncogenesis and tumor behavior
(44). The present study identified
28 CpG methylation sites associated with EFNA3 in ACC; a CpG island
methylator phenotype (CIMP) has been previously reported in ACC,
with the CIMP-high subgroup associated with poorer clinical
outcomes, compared with that of the CIMP-low subgroup (45,46).
Aberrant DNA methylation in promoter or gene body regions can
silence tumor suppressor genes or activate oncogenes, thereby
influencing tumor aggressiveness and therapeutic response (47). Although no methylation-targeted
therapy has been clinically approved for ACC, DNA methylation
inhibitors such as 5-azacytidine and decitabine have demonstrated
efficacy in other types of cancer, such as BC and ACC, and are
under investigation in preclinical ACC models (48–53).
Decitabine demonstrates anti-tumor effects in ACC cells at
clinically relevant concentrations by reactivating silenced genes
in the 11q13 region, suggesting a role for epigenetic mechanisms in
adrenocortical carcinogenesis and indicating its potential as an
adjuvant treatment for advanced cases (49). The present data supported the
hypothesis that EFNA3 methylation patterns may contribute to ACC
pathogenesis and could be leveraged as a predictive biomarker or
therapeutic target.
Furthermore, significant positive correlations
between EFNA3 expression and mRNA modification regulators across
pan-cancer datasets were demonstrated. In ACC specifically, several
m6A modulators demonstrated expression alterations with prognostic
implications. For instance, HNRNPC, a known splicing regulator, was
downregulated in ACC and associated with a worse prognosis
(54). Conversely, ALKBH5 and
YTHDF2 were upregulated and linked to tumor progression (54–58).
METTL3, a methyltransferase, was downregulated and associated with
a favorable prognosis. These findings suggested that EFNA3 may be
integrated into broader epigenetic regulatory networks, including
m6A RNA methylation pathways, that modulate tumor biology in ACC.
Collectively, the present results suggested a complex regulatory
landscape in which EFNA3 is subject to both DNA- and RNA-level
epigenetic control, offering novel insights into its diagnostic and
therapeutic relevance in ACC. Future studies may explore
combinations with DNA methyltransferase inhibitors (such as
decitabine) or m6A modulators to reverse EFNA3-driven oncogenicity,
leveraging epigenetic vulnerabilities common in types of endocrine
cancer.
Immunotherapy has revolutionized the treatment
paradigm for various types of cancer, offering durable responses in
a subset of patients, such as patients with relapsed ovarian cancer
and relapsed gastric cancer (59).
However, a significant proportion of individuals fail to achieve
sustained benefits, which is often attributed to the complexity and
heterogeneity of the TME (60,61).
Immunotherapy is primarily used in patients with advanced ACC after
the failure of traditional chemotherapy (62). Among these treatments, pembrolizumab
is the most studied and recommended in guidelines, although its
monotherapy objective response rate remains limited (63–65).
The present study identified a significant correlation between
EFNA3 expression levels and immune cell infiltration across
multiple cancer types, including ACC. This suggested that EFNA3 may
serve a role in modulating the immune landscape, potentially
impacting tumor immune evasion and responsiveness to
immunotherapeutic agents. In ACC specifically, where immune-based
treatment options currently remain limited, EFNA3 may serve as a
potential immunological biomarker or therapeutic target. Given its
association with immune infiltration, EFNA3 might be involved in
shaping the immunosuppressive or immunoactive features of the TME.
Further studies are warranted to delineate its mechanistic role in
regulating immune cell recruitment, antigen presentation or
checkpoint molecule expression. The correlation between EFNA3 and
TME features demonstrated in the present study provide a rationale
for evaluating EFNA3 not only as a diagnostic or prognostic marker
but also as a modulator of tumor-immune interactions, opening
avenues for combination strategies involving EFNA3-targeted agents
and immune checkpoint inhibitors (such as anti-programmed cell
death protein 1 and programmed cell death ligand 1) in ACC.
The ceRNA hypothesis proposes that lncRNAs can
regulate gene expression by sequestering miRNAs, thereby preventing
them from binding to target mRNAs (66). Increasing evidence has implicated
the EFNA3-centered ceRNA network in various tumor types. For
example, miR-210-3p has been shown to target EFNA3, thereby
modulating the PI3K/AKT pathway and influencing tumor progression
in oral squamous cell carcinoma (67). Similarly, miR-210-mediated
suppression of EFNA3 has been reported to affect cell proliferation
and invasiveness in peripheral nerve sheath tumors (68). Under hypoxic conditions, EFNA3 can
also be regulated through HIF-induced lncRNA activation, promoting
metastatic spread in BC (69).
The present study constructed a lncRNA-miRNA-EFNA3
regulatory axis in ACC, highlighting novel non-coding RNA molecules
such as OIP5-AS1 and hsa-miR-30d-5p. Previous studies have shown
that OIP5-AS1 can act as a ceRNA to modulate oncogenic signaling in
endocrine tumors, while miR-486-3p is downregulated in
adrenocortical neoplasms and may serve as a tumor suppressor
(70,71). The ceRNA network involving EFNA3
identified in the present analysis demonstrated a potential
mechanism of post-transcriptional regulation that could contribute
to tumor progression, immune modulation and drug resistance in ACC.
Furthermore, targeting the lncRNA-miRNA-EFNA3 regulatory axis may
have therapeutic potential. For example, salazosulfapyridine has
been proposed to exert anticancer effects in ACC by interacting
with the OIP5-AS1-miR-92a-3p-SLC7A11 pathway (72). The present findings underscored the
potential of EFNA3-centered ceRNA regulatory networks as diagnostic
tools and therapeutic targets in ACC, warranting further functional
validation.
Drug repurposing offers a cost-effective and
time-efficient strategy to identify new therapeutic options for
rare and refractory malignancies such as ACC. In the present study,
drug sensitivity correlation analysis was performed based on EFNA3
expression was performed, identifying 24 EFNA3-associated compounds
in the CTRP database and 14 in the GDSC database. Notably, EFNA3
expression was significantly correlated with sensitivity to HMG-CoA
reductase inhibitors (statins), which have gained interest for
their potential antitumor effects (73,74).
Statins, primarily used to treat hypercholesterolemia, have
demonstrated tumor-suppressive effects in multiple cancer types,
including HCC, breast, lung and colorectal cancer (75–80).
Mechanistically, statins exert antitumor effects through inhibition
of the mevalonate pathway, leading to suppression of AKT/NF-κB
signaling, induction of apoptosis via caspase cascade activation
and impairment of metastatic potential through modulation of MAPK
and mTOR pathways (81–88). Simvastatin, for example, has been
shown to activate AMPK, upregulate p21 and induce apoptosis in HCC
cells (86). HMG-CoA reductase
inhibitors reduce isoprenoid synthesis by inhibiting the mevalonate
pathway, thereby affecting the tumor procession (89).
Despite this promising pharmacological profile,
limited studies have examined the application of statins in
endocrine malignancies, particularly in ACC. Given the dependence
of ACC cells on cholesterol biosynthesis and isoprenoid metabolism
(90), the mevalonate pathway
represents a potential target. Furthermore, given the key role of
EFNA3 in glycolysis, combining EFNA3 inhibition with glycolytic
inhibitors or statins represents a metabolic ‘double-hit’ strategy
against the Warburg-dependency of ACC. The present results
highlight EFNA3 as a potential biomarker for predicting statin
sensitivity in ACC. The therapeutic implications of this finding
warrant further validation through in vitro mechanistic
assays and in vivo efficacy studies. Furthermore,
integrating statins with EFNA3-targeted strategies may provide a
synergistic approach to disrupt tumor metabolism and reduce ACC
aggressiveness.
The Wnt/β-catenin signaling cascade serves a pivotal
role in ACC by regulating tumor cell proliferation, migration and
metabolic reprogramming. Dysregulation of Wnt/β-catenin pathway,
commonly through activating mutations in the CTNNB1 gene, is a
hallmark of ACC pathogenesis (91,92).
In the present transcriptome-based co-expression analysis, EFNA3
was closely associated with genes involved in Wnt signaling,
suggesting a potential regulatory interaction. Specifically, EFNA3
expression was significantly increased in CTNNB1-mutated samples,
demonstrating an association between EFNA3 activity and
Wnt/β-catenin pathway dysregulation. Previous research has
demonstrated that β-catenin and Transcription Factor 4 modulate the
expression of EphB receptors and their ligands, including
ephrin-B1, thereby orchestrating spatial organization along
epithelial axes such as the crypt-villus axis in colorectal cancer
(93). The present findings
suggested a similar interaction may exist between EFNA3 and
β-catenin in ACC, which potentially contributes to malignant
transformation. Furthermore, EFNA3 is a glycolysis-related gene,
and the Wnt/β-catenin pathway is a known driver of metabolic
reprogramming in cancer cells (94). This pathway enhances aerobic
glycolysis by upregulating glycolytic enzymes, promoting a
tumor-favorable microenvironment characterized by increased lactate
production and glucose uptake (95–101).
In colon and breast cancer, activation of Wnt signaling induces
pyruvate dehydrogenase kinase 1 expression and modulates adipogenic
enzymes, respectively, reinforcing glycolytic flux and tumor
proliferation (96–98).
The present in vitro experiments
demonstrated that EFNA3 promotes invasive behavior in ACC cells.
These data suggested that EFNA3 may act as a downstream effector or
modulator of Wnt/β-catenin signaling to coordinate both metabolic
and invasive phenotypes in ACC. Future mechanistic studies are
warranted to dissect the precise molecular interactions between
EFNA3, β-catenin and glycolysis-related signaling pathways in ACC
progression. These findings present EFNA3 not only as a key
mediator of Wnt-driven ACC pathogenesis but also as a potential
node for combinatorial therapeutic intervention. Given the
established challenges in targeting Wnt/β-catenin signaling
directly in endocrine tumors, primarily the disruption of normal
somatic stem cell function critical for cellular repair and tissue
homeostasis (102), EFNA3
inhibition offers a tractable approach to disrupt downstream
oncogenic outputs (such as metabolic reprogramming and invasion)
while potentially synergizing with Wnt pathway modulators or
endocrine-disrupting agents.
Despite the comprehensive nature of the present
study, several limitations should be acknowledged. First, the
bioinformatics analyses were primarily based on the relatively
small TCGA-ACC cohort. Future studies incorporating larger,
multi-center datasets are needed to strengthen the robustness and
generalizability of these findings. Although the integrative
bioinformatics and in vitro findings suggested that EFNA3 is
associated with enhanced sensitivity to HMG-CoA reductase
inhibitors, clinical evidence remains lacking. Large-scale,
randomized controlled trials are needed to validate the therapeutic
efficacy of these agents and safety in patients with ACC. Second,
the ceRNA regulatory network involving EFNA3 was constructed
through computational predictions and partially supported by
molecular data. however, extensive experimental validation,
particularly through gain and loss-of-function; assays in
vivo, is required to confirm biological relevance and establish
causal relationships between EFNA3 and these pathways. Third,
although significant epigenetic alterations associated with EFNA3
expression in ACC were observed, the potential of DNA methylation
inhibitors as a therapeutic strategy remains unexplored in clinical
settings. Additional preclinical studies are necessary to determine
whether demethylating agents can reverse EFNA3-mediated oncogenic
effects. While the present in vitro experiments demonstrated
EFNA3 enhances ACC cell invasiveness, the absence of in vivo
validation remains a key constraint. The precise molecular
mechanism governing the interplay between EFNA3, Wnt/β-catenin
signaling and metabolic reprogramming requires further elucidation
through mechanistic studies in animal models complemented by
patient-derived organoids.
Future research should also explore the feasibility
of targeting EFNA3 as a multi-modal biomarker for ACC prognosis,
immunomodulation and drug responsiveness. Future research should
focus on verifying the synergistic potential of EFNA3-targeted
therapy with four major categories of drugs: Immune checkpoint
inhibitors (to reverse immunosuppression), epigenetic modulators
(to regulate the methylation/m6A network), metabolic disruptors (to
block glycolysis and mevalonate pathways) and endocrine-specific
drugs (adrenal diuretics and steroid synthesis inhibitors). This is
essential to overcome ACC drug resistance, achieve synergistic
effects, and are key to translating the present findings into
clinically actionable strategies.
The present study identified EFNA3 as a potential
oncogenic driver and prognostic biomarker in adrenocortical
carcinoma. Through integrative bioinformatics analyses and in
vitro validation, it was demonstrated that EFNA3 may modulate
tumor invasiveness, potentially through its interaction with the
Wnt/β-catenin signaling pathway and glycolytic reprogramming. EFNA3
expression was also associated with immune cell infiltration,
epigenetic alterations and drug sensitivity, particularly to
HMG-CoA reductase inhibitors, highlighting its potential as a
multifaceted therapeutic target. Furthermore, construction of a
ceRNA regulatory network provided novel insights into the
post-transcriptional control of EFNA3 in ACC. These findings
collectively support the translational relevance of EFNA3 and
warrant further mechanistic and clinical investigation.
Supplementary Material
Supporting Data
Supporting Data
Supporting Data
Supporting Data
Supporting Data
Supporting Data
Supporting Data
Supporting Data
Acknowledgements
Not applicable.
Funding
The present study was supported by the Natural Science Research
in Shanxi Province (grant no. 202203021211072), Postgraduate
Practice and Innovation Project (grant no. 2024SJ173) and the Task
Book of High-Level Research Results Continuation Funding Project
from Shanxi Bethune Hospital (Shanxi Medical Science Academy; grant
no. 2024GSPYJ04).
Availability of data and materials
The data generated in the present study may be
requested from the corresponding author.
Authors' contributions
YT, XL and JS designed and implemented the study.
YT and YZ performed acquisition, analysis or interpretation of data
for the work. YT, XL, YZ and JS contributed to drafting the work or
revising it critically for important intellectual content. JS
supervised the project, acquired funding and provided final
approval of the published version. YT and XL confirm the
authenticity of all the raw data. All authors agreed to be
accountable for all aspects of the work in ensuring that questions
related to the accuracy or integrity of any part of the work are
appropriately investigated and resolved All authors have read and
approved the final manuscript.
Ethics approval and consent to
participate
Not applicable
Patient consent for publication
Not applicable
Competing interests
The authors declare that they have no competing
interests.
References
|
1
|
Else T, Kim AC, Sabolch A, Raymond VM,
Kandathil A, Caoili EM, Jolly S, Miller BS, Giordano TJ and Hammer
GD: Adrenocortical carcinoma. Endocr Rev. 35:282–326. 2014.
View Article : Google Scholar : PubMed/NCBI
|
|
2
|
Sinclair TJ, Gillis A, Alobuia WM, Wild H
and Kebebew E: Surgery for adrenocortical carcinoma: When and how?
Best Pract Res Clin En. 34:1014082020. View Article : Google Scholar
|
|
3
|
Del Rivero J, Else T, Hallanger-Johnson J,
Kiseljak-Vassiliades K, Raj N, Reidy-Lagunes D, Srinivas S, Gilbert
J, Vaidya A, Aboujaoude E, et al: A review of mitotane in the
management of adrenocortical cancer. Oncologist. 29:747–760. 2024.
View Article : Google Scholar
|
|
4
|
Fassnacht M, Dekkers O, Else T, Baudin E,
Berruti A, de Krijger R, Haak H, Mihai R, Assie G and Terzolo M:
European society of endocrinology clinical practice guidelines on
the management of adrenocortical carcinoma in adults, in
collaboration with the European network for the study of adrenal
tumors. Eur J Endocrinol. 179:G1–G46. 2018. View Article : Google Scholar
|
|
5
|
Chen L, Huang L, Gu Y, Cang W, Sun P and
Xiang Y: Lactate-Lactylation hands between metabolic reprogramming
and immunosuppression. Int J Mol Sci. 23:119432022. View Article : Google Scholar
|
|
6
|
Ganapathy-Kanniappan S and Geschwind JH:
Tumor glycolysis as a target for cancer therapy: Progress and
prospects. Mol Cancer. 12:1522013. View Article : Google Scholar : PubMed/NCBI
|
|
7
|
Boedtkjer E and Pedersen SF: The acidic
tumor microenvironment as a driver of cancer. Annu Rev Physiol.
82:103–126. 2020. View Article : Google Scholar
|
|
8
|
Liu S, Shen G, Zhou X, Sun L, Yu L, Cao Y,
Shu X and Ran Y: Hsp90 promotes gastric cancer cell metastasis and
stemness by regulating the regional distribution of
glycolysis-related metabolic enzymes in the cytoplasm. Adv Sci.
11:e23101092024. View Article : Google Scholar
|
|
9
|
Nievergall E, Lackmann M and Janes PW:
Eph-dependent cell-cell adhesion and segregation in development and
cancer. Cell Mol Life Sci. 69:1813–1842. 2012. View Article : Google Scholar
|
|
10
|
Himanen J, Saha N and Nikolov DB:
Cell-cell signaling via Eph receptors and ephrins. Curr Opin Cell
Biol. 19:534–542. 2007. View Article : Google Scholar
|
|
11
|
Kou CJ and Kandpal RP: Differential
expression patterns of Eph receptors and ephrin ligands in human
cancers. Biomed Res Int. 2018:73901042018.
|
|
12
|
Stewen J, Kruse K, Godoi-Filip AT, Zenia
Jeong H, Adams S, Berkenfeld F, Stehling M, Red-Horse K, Adams RH
and Pitulescu ME: Eph-ephrin signaling couples endothelial cell
sorting and arterial specification. Nat Commun. 15:25392024.
View Article : Google Scholar : PubMed/NCBI
|
|
13
|
Pasquale EB: Eph receptors and ephrins in
cancer progression. Nat Rev Cancer. 24:5–27. 2024. View Article : Google Scholar : PubMed/NCBI
|
|
14
|
Deng M, Tong R, Zhang Z, Wang T, Liang C,
Zhou X and Hou G: EFNA3 as a predictor of clinical prognosis and
immune checkpoint therapy efficacy in patients with lung
adenocarcinoma. Cancer Cell Int. 21:5352021. View Article : Google Scholar
|
|
15
|
Hao Y and Li G: Role of EFNA1 in
tumorigenesis and prospects for cancer therapy. Biomed
Pharmacother. 130:1105672020. View Article : Google Scholar : PubMed/NCBI
|
|
16
|
Yamashita T, Ohneda K, Nagano M, Miyoshi
C, Kaneko N, Miwa Y, Yamamoto M, Ohneda O and Fujii-Kuriyama Y:
Hypoxia-inducible transcription factor-2alpha in endothelial cells
regulates tumor neovascularization through activation of ephrin A1.
J Biol Chem. 283:18926–18936. 2008. View Article : Google Scholar : PubMed/NCBI
|
|
17
|
Nakamura R, Kataoka H, Sato N, Kanamori M,
Ihara M, Igarashi H, Ravshanov S, Wang Y, Li Z, Shimamura T, et al:
EPHA2/EFNA1 expression in human gastric cancer. Cancer Sci.
96:42–47. 2005. View Article : Google Scholar
|
|
18
|
Cui Y, Chang Y, Ma X, Sun M, Huang Y, Yang
F, Li S, Zhuo W, Liu W, Yang B, et al: Ephrin A1 stimulates CCL2
secretion to facilitate pre-metastatic niche formation and promote
gastric cancer liver metastasis. Cancer Res. 85:263–276. 2024.
View Article : Google Scholar
|
|
19
|
Wilson K, Shiuan E and Brantley-Sieders
DM: Oncogenic functions and therapeutic targeting of EphA2 in
cancer. Oncogene. 40:2483–2495. 2021. View Article : Google Scholar : PubMed/NCBI
|
|
20
|
Mao L, Yuan W, Cai K, Lai C, Huang C, Xu
Y, Zhong S, Yang C, Wang R, Zeng P, et al: EphA2-YES1-ANXA2 pathway
promotes gastric cancer progression and metastasis. Oncogene.
40:3610–3623. 2021. View Article : Google Scholar : PubMed/NCBI
|
|
21
|
Li Y, Peng Q and Wang L: EphA2 as a phase
separation protein associated with ferroptosis and immune cell
infiltration in colorectal cancer. Aging (Albany NY).
15:12952–12965. 2023. View Article : Google Scholar : PubMed/NCBI
|
|
22
|
Pei J, Zhang C, Yusupu M, Zhang C and Dai
DQ: Screening and validation of the hypoxia-related signature of
evaluating tumor immune microenvironment and predicting prognosis
in gastric cancer. Front Immunol. 12:7055112021. View Article : Google Scholar
|
|
23
|
Xie R, Yuan M and Jiang Y: The pan-cancer
crosstalk between the EFNA family and tumor microenvironment for
prognosis and immunotherapy of gastric cancer. Front Cell Dev Biol.
10:7909472022. View Article : Google Scholar
|
|
24
|
Bhatia S, Oweida A, Lennon S, Darragh LB,
Milner D, Phan AV, Mueller AC, Van Court B, Raben D, Serkova NJ, et
al: Inhibition of EphB4-Ephrin-B2 signaling reprograms the tumor
immune microenvironment in head and neck cancers. Cancer Res.
79:2722–2735. 2019. View Article : Google Scholar : PubMed/NCBI
|
|
25
|
Janes PW, Vail ME, Ernst M and Scott AM:
Eph receptors in the immunosuppressive tumor microenvironment.
Cancer Res. 81:801–805. 2021. View Article : Google Scholar : PubMed/NCBI
|
|
26
|
Ma W, Zhu M, Wang B, Gong Z, Du X, Yang T,
Shi X, Dai B, Zhan Y, Zhang D, et al: Vandetanib drives growth
arrest and promotes sensitivity to imatinib in chronic myeloid
leukemia by targeting ephrin type-B receptor 4. Mol Oncol.
16:2747–2765. 2022. View Article : Google Scholar
|
|
27
|
Chen B, Khodadoust MS, Liu CL, Newman AM
and Alizadeh AA: Profiling tumor infiltrating immune cells with
CIBERSORT. Methods Mol Biol. 1711:243–259. 2018. View Article : Google Scholar
|
|
28
|
Livak KJ and Schmittgen TD: Analysis of
relative gene expression data using real-time quantitative PCR and
the 2(−Delta Delta C(T)) method. Methods. 25:402–408. 2001.
View Article : Google Scholar : PubMed/NCBI
|
|
29
|
Salmena L, Poliseno L, Tay Y, Kats L and
Pandolfi PP: A ceRNA hypothesis: The Rosetta Stone of a hidden RNA
language? Cell. 146:353–358. 2011. View Article : Google Scholar
|
|
30
|
Kuang L, Pang Y and Fang Q: TMEM101
expression and its impact on immune cell infiltration and prognosis
in hepatocellular carcinoma. Sci Rep. 14:318472024. View Article : Google Scholar : PubMed/NCBI
|
|
31
|
Wu Q, Li P, Tao X, Lin N, Mao B and Xie X:
A novel super-enhancer-related risk model for predicting prognosis
and guiding personalized treatment in hepatocellular carcinoma. BMC
Cancer. 24:10872024. View Article : Google Scholar : PubMed/NCBI
|
|
32
|
Lin P and Yang H: EFNA3 is a prognostic
biomarker for the overall survival of patients with hepatocellular
carcinoma. J Hepatol. 77:879–880. 2022. View Article : Google Scholar
|
|
33
|
Wang L, Song Y, Wang H, Liu K, Shao Z and
Shang Z: MiR-210-3p-EphrinA3-PI3K/AKT axis regulates the
progression of oral cancer. J Cell Mol Med. 24:4011–4022. 2020.
View Article : Google Scholar : PubMed/NCBI
|
|
34
|
Chatzikyriakou P, Brempou D, Quinn M,
Fishbein L, Noberini R, Anastopoulos IN, Tufton N, Lim ES, Obholzer
R, Hubbard JG, et al: A comprehensive characterisation of
phaeochromocytoma and paraganglioma tumours through histone protein
profiling, DNA methylation and transcriptomic analysis genome wide.
Clin Epigenetics. 15:1962023. View Article : Google Scholar : PubMed/NCBI
|
|
35
|
Husain A, Chiu Y, Sze KM, Ho DW, Tsui Y,
Suarez EMS, Zhang VX, Chan L, Lee E, Lee JM, et al: Ephrin-A3/EphA2
axis regulates cellular metabolic plasticity to enhance cancer
stemness in hypoxic hepatocellular carcinoma. J Hepatol.
77:383–396. 2022. View Article : Google Scholar
|
|
36
|
Yiminniyaze R, Zhang X, Zhu N, Wang J, Li
C, Wumaier G, Zhou D, Li J, Xia J, Zhang Y, et al: EphrinA3 is a
key regulator of malignant behaviors and a potential prognostic
factor in lung adenocarcinoma. Cancer Med. 12:1630–1642. 2023.
View Article : Google Scholar : PubMed/NCBI
|
|
37
|
Li Y, Peng Q and Wang L: EphA2 as a phase
separation protein associated with ferroptosis and immune cell
infiltration in colorectal cancer. Aging (Albany NY).
15:12952–12965. 2023. View Article : Google Scholar : PubMed/NCBI
|
|
38
|
Pei J, Zhang C, Yusupu M, Zhang C and Dai
D: Screening and validation of the hypoxia-related signature of
evaluating tumor immune microenvironment and predicting prognosis
in gastric cancer. Front Immunol. 12:7055112021. View Article : Google Scholar
|
|
39
|
Deng M, Tong R, Zhang Z, Wang T, Liang C,
Zhou X and Hou G: EFNA3 as a predictor of clinical prognosis and
immune checkpoint therapy efficacy in patients with lung
adenocarcinoma. Cancer cell Int. 21:5352021. View Article : Google Scholar
|
|
40
|
Kiri S and Ryba T: Cancer, metastasis, and
the epigenome. Mol Cancer. 23:1542024. View Article : Google Scholar : PubMed/NCBI
|
|
41
|
Zheng S, Cherniack AD, Dewal N, Moffitt
RA, Danilova L, Murray BA, Lerario AM, Else T, Knijnenburg TA,
Ciriello G, et al: Comprehensive pan-genomic characterization of
adrenocortical carcinoma. Cancer Cell. 29:723–736. 2016.
|
|
42
|
Sun-Zhang A, Juhlin CC, Carling T, Scholl
U, Schott M, Larsson C and Bajalica-Lagercrantz S: Comprehensive
genomic analysis of adrenocortical carcinoma reveals genetic
profiles associated with patient survival. ESMO Open. 9:1036172024.
View Article : Google Scholar : PubMed/NCBI
|
|
43
|
Sun L, Zhang H and Gao P: Metabolic
reprogramming and epigenetic modifications on the path to cancer.
Protein Cell. 13:877–919. 2022. View Article : Google Scholar
|
|
44
|
Orsolic I, Carrier A and Esteller M:
Genetic and epigenetic defects of the RNA modification machinery in
cancer. Trends Genet. 39:74–88. 2023. View Article : Google Scholar
|
|
45
|
Clay MR, Pinto EM, Cline C, Tran QT, Lin
T, Dyer MA, Shi L, Wu H, Pounds SB, Zambetti GP, et al: DNA
methylation profiling reveals prognostically significant groups in
pediatric adrenocortical tumors: A report from the international
pediatric adrenocortical tumor registry. JCO Precis Oncol.
3:PO.19.00163. 2019.
|
|
46
|
Mohan DR, Lerario AM, Else T, Mukherjee B,
Almeida MQ, Vinco M, Rege J, Mariani BMP, Zerbini MCN, Mendonca BB,
et al: Targeted assessment of G0S2 methylation identifies a rapidly
recurrent, routinely fatal molecular subtype of adrenocortical
carcinoma. Clin Cancer Res. 25:3276–3288. 2019. View Article : Google Scholar : PubMed/NCBI
|
|
47
|
Li C, Tang Y, Li Q, Liu H, Ma X, He L and
Shi H: The prognostic and immune significance of C15orf48 in
pan-cancer and its relationship with proliferation and apoptosis of
thyroid carcinoma. Front Immunol. 14:11318702023. View Article : Google Scholar
|
|
48
|
Oliver J, Garcia-Aranda M, Chaves P, Alba
E, Cobo-Dols M, Onieva JL and Barragan I: Emerging noninvasive
methylation biomarkers of cancer prognosis and drug response
prediction. Semin Cancer Biol. 83:584–595. 2022. View Article : Google Scholar
|
|
49
|
Suh I, Weng J, Fernandez-Ranvier G, Shen
WT, Duh Q, Clark OH and Kebebew E: Antineoplastic effects of
decitabine, an inhibitor of DNA promoter methylation, in
adrenocortical carcinoma cells. Arch Surg. 145:226–232. 2010.
View Article : Google Scholar : PubMed/NCBI
|
|
50
|
Endo A, Ly T, Pippa R, Bensaddek D,
Nicolas A and Lamond AI: The chromatin assembly factor complex 1
(CAF1) and 5-Azacytidine (5-AzaC) affect cell motility in
src-transformed human epithelial cells. J Biol Chem. 292:172–184.
2017. View Article : Google Scholar : PubMed/NCBI
|
|
51
|
Li X, Li Y, Dong L, Chang Y, Zhang X, Wang
C, Chen M, Bo X, Chen H, Han W and Nie J: Decitabine priming
increases anti-PD-1 antitumor efficacy by promoting CD8+ progenitor
exhausted T cell expansion in tumor models. J Clin Invest.
133:e1656732023. View Article : Google Scholar
|
|
52
|
Wang Y, Tong C, Dai H, Wu Z, Han X, Guo Y,
Chen D, Wei J, Ti D, Liu Z, et al: Low-dose decitabine priming
endows CAR T cells with enhanced and persistent antitumour
potential via epigenetic reprogramming. Nat Commun. 12:4092021.
View Article : Google Scholar : PubMed/NCBI
|
|
53
|
Sarhadi VK and Armengol G: Molecular
biomarkers in cancer. Biomolecules. 12:10212022. View Article : Google Scholar : PubMed/NCBI
|
|
54
|
Xu F, Guan Y, Ma Y, Xue L, Zhang P, Yang X
and Chong T: Bioinformatic analyses and experimental validation of
the role of m6A RNA methylation regulators in progression and
prognosis of adrenocortical carcinoma. Aging (Albany NY).
13:11919–11941. 2021. View Article : Google Scholar : PubMed/NCBI
|
|
55
|
Fu Y, Sun S, Bi J, Kong C and Yin L:
Expression patterns and prognostic value of m6A RNA methylation
regulators in adrenocortical carcinoma. Medicine (Baltimore).
100:e250312021. View Article : Google Scholar : PubMed/NCBI
|
|
56
|
Zhang S, Zhao BS, Zhou A, Lin K, Zheng S,
Lu Z, Chen Y, Sulman EP, Xie K, Bogler O, et al: m(6)A Demethylase
ALKBH5 maintains tumorigenicity of glioblastoma stem-like cells by
sustaining FOXM1 expression and cell proliferation program. Cancer
Cell. 31:591–606. 2017. View Article : Google Scholar
|
|
57
|
Xiong J, He J, Zhu J, Pan J, Liao W, Ye H,
Wang H, Song Y, Du Y, Cui B, et al: Lactylation-driven
METTL3-mediated RNA m6A modification promotes
immunosuppression of tumor-infiltrating myeloid cells. Mol Cell.
82:1660–1677. 2022. View Article : Google Scholar
|
|
58
|
Wang L, Dou X, Chen S, Yu X, Huang X,
Zhang L, Chen Y, Wang J, Yang K, Bugno J, et al: YTHDF2 inhibition
potentiates radiotherapy antitumor efficacy. Cancer Cell.
41:1294–1308. 2023. View Article : Google Scholar
|
|
59
|
Barbari C, Fontaine T, Parajuli P,
Lamichhane N, Jakubski S, Lamichhane P and Deshmukh RR:
Immunotherapies and combination strategies for immuno-oncology. Int
J Mol Sci. 21:50092020. View Article : Google Scholar
|
|
60
|
Rui R, Zhou L and He S: Cancer
immunotherapies: Advances and bottlenecks. Front Immunol.
14:12124762023. View Article : Google Scholar
|
|
61
|
Wu T and Dai Y: Tumor microenvironment and
therapeutic response. Cancer Lett. 387:61–68. 2017. View Article : Google Scholar
|
|
62
|
Raj N, Zheng Y, Kelly V, Katz SS, Chou J,
Do RKG, Capanu M, Zamarin D, Saltz LB, Ariyan CE, et al: PD-1
blockade in advanced adrenocortical carcinoma. J Clin Oncol.
38:71–80. 2020. View Article : Google Scholar
|
|
63
|
Habra MA, Stephen B, Campbell M, Hess K,
Tapia C, Xu M, Ahnert JR, Jimenez C, Lee JE, Perrier ND, et al:
Phase II clinical trial of pembrolizumab efficacy and safety in
advanced adrenocortical carcinoma. J Immunother Cancer. 7:2532019.
View Article : Google Scholar : PubMed/NCBI
|
|
64
|
Fassnacht M, Puglisi S, Kimpel O and
Terzolo M: Adrenocortical carcinoma: A practical guide for
clinicians. Lancet Diabetes Endo. 13:438–452. 2025. View Article : Google Scholar
|
|
65
|
Remde H, Schmidt-Pennington L, Reuter M,
Landwehr L, Jensen M, Lahner H, Kimpel O, Altieri B, Laubner K,
Schreiner J, et al: Outcome of immunotherapy in adrenocortical
carcinoma: A retrospective cohort study. Eur J Endocrinol.
188:485–493. 2024. View Article : Google Scholar
|
|
66
|
Khalafizadeh A, Hashemizadegan SD, Shokri
F, Bakhshinejad B, Jabbari K, Motavaf M and Babashah S: Competitive
endogenous RNA networks: Decoding the role of long non-coding RNAs
and circular RNAs in colorectal cancer chemoresistance. J Cell Mol
Med. 28:e181972024. View Article : Google Scholar : PubMed/NCBI
|
|
67
|
Wang L, Song Y, Wang H, Liu K, Shao Z and
Shang Z: MiR-210-3p-EphrinA3-PI3K/AKT axis regulates the
progression of oral cancer. J Cell Mol Med. 24:4011–4022. 2020.
View Article : Google Scholar : PubMed/NCBI
|
|
68
|
Wang Z, Yin B, Wang B, Ma Z, Liu W and Lv
G: MicroRNA-210 promotes proliferation and invasion of peripheral
nerve sheath tumor cells targeting EFNA3. Oncol Res. 21:145–154.
2013. View Article : Google Scholar : PubMed/NCBI
|
|
69
|
Gomez-Maldonado L, Tiana M, Roche O,
Prado-Cabrero A, Jensen L, Fernandez-Barral A, Guijarro-Munoz I,
Favaro E, Moreno-Bueno G, Sanz L, et al: EFNA3 long noncoding RNAs
induced by hypoxia promote metastatic dissemination. Oncogene.
34:2609–2620. 2015. View Article : Google Scholar : PubMed/NCBI
|
|
70
|
Long B, Yang X, Xu X, Li X, Xu X, Zhang X
and Zhang S: Long noncoding RNA ASB16-AS1 inhibits adrenocortical
carcinoma cell growth by promoting ubiquitination of RNA-binding
protein HuR. Cell Death Dis. 11:9952020. View Article : Google Scholar : PubMed/NCBI
|
|
71
|
Li S, Monazzam A, Razmara M, Chu X,
Stalberg P and Skogseid B: MiR-486-3p was downregulated at microRNA
profiling of adrenals of multiple endocrine neoplasia type 1 mice,
and inhibited human adrenocortical carcinoma cell lines. Sci Rep.
11:147722021. View Article : Google Scholar : PubMed/NCBI
|
|
72
|
Subramanian C, McNamara K, Croslow SW, Tan
Y, Hess D, Kiseljak-Vassiliades K, Wierman ME, Sweedler JV and
Cohen MS: Novel repurposing of sulfasalazine for the treatment of
adrenocortical carcinomas, probably through the
SLC7A11/xCT-hsa-miR-92a-3p-OIP5-AS1 network pathway. Surgery.
177:1088322025. View Article : Google Scholar : PubMed/NCBI
|
|
73
|
Gouirand V, Gicquel T, Lien EC, Jaune-Pons
E, Da Costa Q, Finetti P, Metay E, Duluc C, Mayers JR, Audebert S,
et al: Ketogenic HMG-CoA lyase and its product beta-hydroxybutyrate
promote pancreatic cancer progression. EMBO J. 41:e1104662022.
View Article : Google Scholar : PubMed/NCBI
|
|
74
|
Yarmolinsky J, Bull CJ, Vincent EE,
Robinson J, Walther A, Smith GD, Lewis SJ, Relton CL and Martin RM:
Association between genetically proxied inhibition of HMG-CoA
reductase and epithelial ovarian cancer. JAMA. 323:646–655. 2020.
View Article : Google Scholar : PubMed/NCBI
|
|
75
|
Jiang W, Hu J and He X, Jin W and He X:
Statins: A repurposed drug to fight cancer. J Exp Clin Canc Res.
40:2412021. View Article : Google Scholar
|
|
76
|
Dorsch M, Kowalczyk M, Planque M, Heilmann
G, Urban S, Dujardin P, Forster J, Ueffing K, Nothdurft S, Oeck S,
et al: Statins affect cancer cell plasticity with distinct
consequences for tumor progression and metastasis. Cell Rep.
37:1100562021. View Article : Google Scholar : PubMed/NCBI
|
|
77
|
Feng J, Dai W, Mao Y, Wu L, Li J, Chen K,
Yu Q, Kong R, Li S, Zhang J, et al: Simvastatin re-sensitizes
hepatocellular carcinoma cells to sorafenib by inhibiting
HIF-1alpha/PPAR-gamma/PKM2-mediated glycolysis. J Exp Clin Canc
Res. 39:242020. View Article : Google Scholar
|
|
78
|
Yao X, Xie R, Cao Y, Tang J, Men Y, Peng H
and Yang W: Simvastatin induced ferroptosis for triple-negative
breast cancer therapy. J Nanobiotechnol. 19:3112021. View Article : Google Scholar
|
|
79
|
Ma W, Wei S, Li Q, Zeng J, Xiao W, Zhou C,
Yoneda KY, Zeki AA and Li T: Simvastatin overcomes resistance to
tyrosine kinase inhibitors in patient-derived, oncogene-driven lung
adenocarcinoma models. Mol Cancer Ther. 23:700–710. 2024.
View Article : Google Scholar : PubMed/NCBI
|
|
80
|
Xie W, Peng M, Liu Y, Zhang B, Yi L and
Long Y: Simvastatin induces pyroptosis via ROS/caspase-1/GSDMD
pathway in colon cancer. Cell Commun Signal. 21:3292023. View Article : Google Scholar
|
|
81
|
Budillon A, Leone A, Passaro E, Silvestro
L, Foschini F, Iannelli F, Roca MS, Macchini M, Bruzzese F, Bermejo
ML, et al: Randomized phase 2 study of valproic acid combined with
simvastatin and gemcitabine/nab-paclitaxel-based regimens in
untreated metastatic pancreatic adenocarcinoma patients: The VESPA
trial study protocol. BMC Cancer. 24:11672024. View Article : Google Scholar : PubMed/NCBI
|
|
82
|
Jing Z, Yuan W, Wang J, Ni R, Qin Y, Mao
Z, Wei F, Song C, Zheng Y, Cai H and Liu Z:
Simvastatin/hydrogel-loaded 3D-printed titanium alloy scaffolds
suppress osteosarcoma via TF/NOX2-associated ferroptosis while
repairing bone defects. Bioact Mater. 33:223–241. 2024. View Article : Google Scholar : PubMed/NCBI
|
|
83
|
Lee YG, Chou F, Tung S, Chou H, Ko T, Fann
YC and Juan S: Tumoricidal activity of simvastatin in synergy with
rhoa inactivation in antimigration of clear cell renal cell
carcinoma cells. Int J Mol Sci. 24:97382023. View Article : Google Scholar
|
|
84
|
Okubo K, Miyai K, Kato K, Asano T and Sato
A: Simvastatin-romidepsin combination kills bladder cancer cells
synergistically. Transl Oncol. 14:1011542021. View Article : Google Scholar
|
|
85
|
Fuentes-Fayos AC, G-Garcia ME, Perez-Gomez
JM, Montero-Hidalgo AJ, Martin-Colom J, Doval-Rosa C,
Blanco-Acevedo C, Torres E, Toledano-Delgado A, Sanchez-Sanchez R,
et al: Metformin and simvastatin exert additive antitumour effects
in glioblastoma via senescence-state: Clinical and translational
evidence. Ebiomedicine. 90:1044842023. View Article : Google Scholar : PubMed/NCBI
|
|
86
|
Dong G, Huang X, Jiang S, Ni L and Chen S:
Simvastatin mitigates apoptosis and transforming growth factor-beta
upregulation in stretch-induced endothelial cells. Oxid Med Cell
Longev. 2019:60260512019.PubMed/NCBI
|
|
87
|
Wang S, Ho HJ, Lin J, Shieh J and Wu C:
Simvastatin-induced cell cycle arrest through inhibition of
STAT3/SKP2 axis and activation of AMPK to promote p27 and p21
accumulation in hepatocellular carcinoma cells. Cell Death Dis.
8:e26262017. View Article : Google Scholar : PubMed/NCBI
|
|
88
|
Stine JE, Guo H, Sheng X, Han X,
Schointuch MN, Gilliam TP, Gehrig PA, Zhou C and Bae-Jump VL: The
HMG-CoA reductase inhibitor, simvastatin, exhibits anti-metastatic
and anti-tumorigenic effects in ovarian cancer. Oncotarget.
7:946–960. 2016. View Article : Google Scholar
|
|
89
|
Afshordel S, Kern B, Clasohm J, Konig H,
Priester M, Weissenberger J, Kogel D and Eckert GP: Lovastatin and
perillyl alcohol inhibit glioma cell invasion, migration, and
proliferation-impact of Ras-/Rho-prenylation. Pharmacol Res.
91:69–77. 2015. View Article : Google Scholar : PubMed/NCBI
|
|
90
|
Conde J, Fernandez-Pisonero I,
Lorenzo-Martin LF, Garcia-Gomez R, Casar B, Crespo P and Bustelo
XR: The mevalonate pathway contributes to breast primary
tumorigenesis and lung metastasis. Mol Oncol. 19:56–80. 2025.
View Article : Google Scholar
|
|
91
|
Tai Y and Shang J: Wnt/β-catenin signaling
pathway in the tumor progression of adrenocortical carcinoma. Front
Endocrinol (Lausanne). 14:12607012023. View Article : Google Scholar : PubMed/NCBI
|
|
92
|
Rubin B, Pilon C, Pezzani R, Rebellato A
and Fallo F: The effects of mitotane and 1α,25-dihydroxyvitamin
D3 on Wnt/beta-catenin signaling in human adrenocortical
carcinoma cells. J Endocrinol Invest. 43:357–367. 2020. View Article : Google Scholar
|
|
93
|
Batlle E, Henderson JT, Beghtel H, van den
Born MMW, Sancho E, Huls G, Meeldijk J, Robertson J, van de
Wetering M, Pawson T, et al: Beta-catenin and TCF mediate cell
positioning in the intestinal epithelium by controlling the
expression of EphB/ephrinB. Cell. 111:251–263. 2002. View Article : Google Scholar
|
|
94
|
Zhang C, Liu L, Li W, Li M, Zhang X, Zhang
C, Yang H, Xie J, Pan W, Guo X, et al: Upregulation of FAM83F by
c-Myc promotes cervical cancer growth and aerobic glycolysis via
Wnt/beta-catenin signaling activation. Cell Death Dis. 14:8372023.
View Article : Google Scholar : PubMed/NCBI
|
|
95
|
Yang H, Shen J, Wang Y, Liu Y, Shen D and
Quan S: Tankyrase promotes aerobic glycolysis and proliferation of
ovarian cancer through activation of Wnt/β-Catenin Signaling.
Biomed Res Int. 2019:26863402019.
|
|
96
|
Sprowl-Tanio S, Habowski AN, Pate KT,
McQuade MM, Wang K, Edwards RA, Grun F, Lyou Y and Waterman ML:
Lactate/pyruvate transporter MCT-1 is a direct Wnt target that
confers sensitivity to 3-bromopyruvate in colon cancer. Cancer
Metab. 4:202016. View Article : Google Scholar : PubMed/NCBI
|
|
97
|
Du Y, Jiang Y, Hou Y and Shi Y: Complement
factor I knockdown inhibits colon cancer development by affecting
Wnt/beta-catenin/c-Myc signaling pathway and glycolysis. World J
Gastrointest Oncol. 16:2646–2662. 2024. View Article : Google Scholar
|
|
98
|
Vergara D, Stanca E, Guerra F, Priore P,
Gaballo A, Franck J, Simeone P, Trerotola M, De Domenico S,
Fournier I, et al: beta-catenin knockdown affects mitochondrial
biogenesis and lipid metabolism in breast cancer cells. Front
Physiol. 8:5442017. View Article : Google Scholar
|
|
99
|
Halma MTJ, Tuszynski JA and Marik PE:
Cancer metabolism as a therapeutic target and review of
interventions. Nutrients. 15:5442023. View Article : Google Scholar : PubMed/NCBI
|
|
100
|
Sun W, Jia M, Feng Y and Cheng X: Lactate
is a bridge linking glycolysis and autophagy through lactylation.
Autophagy. 19:3240–3241. 2023. View Article : Google Scholar : PubMed/NCBI
|
|
101
|
Williams JL, Smith C, Hall C, Khaled Z,
Maharaj A, Kwong R, Pittaway J, Casas J, Parvanta L, Abdel-Aziz TE,
et al: Elevated sphingosine-1-phosphate lyase leads to increased
metabolism and reduced survival in adrenocortical carcinoma. Eur J
Endocrinol. 188:lvac0072023. View Article : Google Scholar
|
|
102
|
Krishnamurthy N and Kurzrock R: Targeting
the Wnt/beta-catenin pathway in cancer: Update on effectors and
inhibitors. Cancer Treat Rev. 62:50–60. 2018. View Article : Google Scholar : PubMed/NCBI
|