Introduction
Biliary tract cancer (BTC) arises from the ductal
epithelium of the biliary tree, and is the second most common
primary hepatobiliary malignancy (1), with a rising incidence and a dismal
prognosis (1–3). This fatal disease has traditionally
been divided into cholangiocarcinoma (CCA) and gallbladder cancer
(GBC), which have similar pathogenesis and clinical characteristics
(1). Furthermore, CCA can be
classified into intrahepatic cholangiocarcinoma (ICC) and
extrahepatic cholangiocarcinoma (ECC) according to the site of the
tumor (1,4). ECC is divided into perihilar
cholangiocarcinoma (PCC) and distal extrahepatic cholangiocarcinoma
(DECC) (1). The most effective
treatment for BTC is surgical resection (5); however, the disease is still fatal
because patients are always diagnosed at advanced stages (6). Except surgery, both chemotherapy and
radiation are used as adjuvant therapy, but the effect is still far
from satisfactory (1,5). Finding effective biomarkers for
earlier diagnosis, and clarifying the molecular mechanisms
associated with pathogenesis and chemotherapy resistance are
required to improve prognosis (5,7).
Cyclin-dependent kinase 10 (CDK10) is a member of
the Cdc2 family of kinases and plays a role in the cell cycle
(8). Similar to other CDKs, CDK10
contains tyrosine and threonine sites in the ATP binding domain and
the phosphorylation status of these sites is crucial for
determining its activity (9).
Although the cyclin partner of CDK10 has not been identified, CDK10
associations have been described that play an important role in its
function in the cell (9,10). CDK10 has been reported as the
regulator of the Ets2 transcription factor and modulates its
transactivation activity (9). In
addition, the CDK10/Ets2/c-RAF signaling has been demonstrated as
an important determinant of resistance to endocrine therapy for
breast cancer (10). Recent studies
have shown that CDK10 is a potential tumor suppressor not only in
breast cancer, but also in other tumors, such as seminoma (11).
The Raf/MEK/MAPK cascade is a crucial signaling
pathway for the development of CCA (12). This signaling pathway is regulated
by CDK10 in breast cancer (10). In
CCA and GBC, deletion or loss of heterozygosity (LOH) has been
frequently detected for several regions of the long arm of
chromosome 16 (13,14), where CDK10 is located (15).
In this study, we proposed that CDK10 may be a
candidate tumor suppressor gene for BTC, including CCA and GBC. To
support our proposals, we systematically examined the expression of
CDK10 in human tumor tissue and cell lines. The impact of CDK10
expression on BTC cell biology and survivability was also evaluated
by either overexpression or RNAi methods to confirm our
hypothesis.
Materials and methods
Cell culture
HCCC-9180, SSP25 and RBE cholangiocarcinoma cell
lines and the GBC-SD gallbladder cancer line were obtained from the
Chinese Academy of Sciences Shanghai Branch Cell Bank (Shanghai,
China). HCCC-9180, SSP25 and RBE cell lines were cultured in
RPMI-1640 medium with 10% fetal bovine serum (FBS), 100 IU/ml
penicillin and 100 μg/ml streptomycin. GBC-SD cells were maintained
in RPMI-1640 medium with 20% FBS and antibiotics. Human
intrahepatic biliary epithelial cells (BECs) and epithelial cell
medium were purchased from ScienCell Research Laboratories (San
Diego, CA, USA). BECs were cultured in complete medium containing
10% FBS and antibiotics. In this study, BECs were employed as the
control cells for normal biliary epithelial cells.
Plasmids, siRNA and transfection
To increase the expression of CDK10 in cell lines,
pCMV6-Entry-CDK10 vector was purchased from OriGene (Rockville, MD,
USA), and the ORF (open reading frame) of CDK10 was inserted into
the vector. At 80–90% confluence, cells were transfected with
pCMV6-Entry-CDK10 or empty vectors using Lipofectamine 2000
(Invitrogen, Carlsbad, CA, USA). To obtain stable transfectants,
the cells were transfected in accordance with the aforementioned
criteria. Forty-eight hours post-transfection, the cells were
switched to the medium containing G418 (600 μg/ml), and the medium
containing G418 was replaced every 3–4 days. After 2 weeks,
isolated colonies began to appear. In 3 weeks, we selected stable
transfectants expressing CDK10 for further study. The control
clones expressing empty vector (Mock) were isolated at the same
time.
Three siRNAs targeting CDK10 were obtained from
RiboBio (Guangzhou, China) and sequences were 5′-CUGC
ACAGGAACUUCAUUA-3′ (si-1), 5′-GCUCCUAUUUCA AGGAGAA-3′ (si-2),
5′-CCAGCCUCCUGGAGAAUAU-3′ (si-3), respectively. The control siRNA
was also obtained from RiboBio. Twenty-four hours prior to
transfection, cells were plated onto a 35-mm dish at 50–60%
confluence. Transfection was performed with Lipofectamine 2000
according to the manufacturer’s protocol. The transfected cells
were resuspended and cultured in regular culture medium for 48–72 h
before analysis.
Clinical tissue samples
Tissue samples were obtained from 65 patients at the
Second Affiliated Hospital of Harbin Medical University from
January 2007 to March 2011. Informed consent was obtained from
patients and the tissue acquisition protocol was approved by the
Harbin Medical University Institutional Review Board. There were 47
samples of tumor tissues (including ICC, PCC, DECC, GBC and
metastasis), and 18 samples from normal bile ducts or gallbladder.
Normal specimens were obtained from patients undergoing
pancreatoduodenectomy because of pancreatic or duodenal diseases
and whose bile ducts were disease-free. Tumor samples were obtained
from CCA or GBC patients undergoing cancer-related surgery. The
clinical characteristics of the patients were collected, including
tumor location, histological type, differentiation grade, lymph
node invasion, TNM staging and 1-year survival. Fresh tissue was
frozen in liquid nitrogen and used for RNA and protein
extraction.
RNA extraction and quantitative real-time
PCR
Total RNA was isolated from tissue samples or cells
using TRIzol (Invitrogen Life Technologies) and total RNA was
reverse transcribed to cDNA, using the PrimeScript Reagent kit
(Takara, Tokyo, Japan) according to the manufacturer’s
instructions. Quantitative real-time PCR was performed with a
SYBR-Green kit (Takara) using the ABI 7500 Real-time PCR system
(Applied Biosystems, Foster City, CA, USA). Specific primers were
designed for CDK10, c-RAF, TP53 (p53), BID, ABCC2, ABCB1 and ABCB11
(Table I). Human β-actin was used
as an endogenous control. The PCR procedures were performed
according to the manufacturer’s instructions. All assays were
performed at least three times. The relative expression levels were
then determined by using the 2−ΔΔCt method (16).
 | Table IPrimer sequences. |
Table I
Primer sequences.
| Symbol | Forward
(5′-3′) | Reverse
(5′-3′) |
|---|
| CDK10 |
TGGACAAGGAGAAGGATG |
CTGCTCACAGTAACCCATC |
| ACTB |
CAGCACAATGAAGATCAAGATC |
GTGTAACGCAACTAAGTCATAG |
| RAF1 |
TCAGGAATGAGGTGGCTGTTCTG |
CTCGCACCACTGGGTCACAATT |
| TP53 |
CCTCAGCATCTTATCCGAGTGG |
TGGATGGTGGTACAGTCAGAGC |
| BID |
TGGGACACTGTGAACCAGGAGT |
GAGGAAGCCAAACACCAGTAGG |
| ABCC2 |
GCCAACTTGTGGCTGTGATAGG |
ATCCAGGACTGCTGTGGGACAT |
| ABCB1 |
GCTGTCAAGGAAGCCAATGCCT |
TGCAATGGCGATCCTCTGCTTC |
| ABCB11 |
TTACAAGAACTCCAGATTCC |
TGATAAGTACTGCGACAGC |
Western blot analysis
Total proteins were extracted from tissue samples or
cells using lysis buffer containing phenylmethyl sulfonylfluoride.
Samples mixed with loading buffer were denatured, separated by
electrophoresis on 12% SDS-PAGE, and then transferred to
polyvinylidene fluoride membranes. The membranes were blocked with
5% non-fat milk for 2 h, and were exposed to the appropriate
primary antibodies (anti-CDK10, Abgent, San Diego, CA, USA;
anti-c-RAF-pS338 Phospho, Abgent; anti-PCNA, Santa Cruz
Biotechnology, Santa Cruz, CA, USA; anti-β-actin, Santa Cruz
Biotechnology) at an appropriate dilution for 12 h at 4°C. After
three extensive times washes using TBST for 10 min each, the
membranes were incubated with appropriate horseradish
peroxidase-conjugated secondary antibodies (Santa Cruz
Biotechnology) at a dilution of 1:8,000 for 2 h at 25°C.
Immunoreactive bands were visualized with chemiluminescence. Human
β-actin was employed as an endogenous control.
Colony formation assay and wound healing
assays
Twenty-four hours post-transfection with RNA
oligonucleotide or plasmid DNA, HCCC-9180 and GBC-SD cells were
seeded for colony formation in 35-mm dishes at a density of 200
viable cells per well. After 21 days, the cells grown in plates
were fixed in 4% paraformaldehyde for 15 min. After washing, the
cells were stained with 0.005% crystal violet solution for 1 h
(17). The plates were aspirated,
washed and allowed to air dry. Colonies were counted only if a
single clone contained >50 cells. Each assay was performed in
triplicate.
For wound healing assays, cells were seeded and
grown to confluence on 35-mm cell culture dishes. A wound was
introduced by scratching the confluent monolayer with a pipette tip
(200 μl). After washing twice with PBS, serum-free medium
(inhibiting cell proliferation) was added. Imaging was conducted
using light microscopy at ×40 magnification, and wound healing was
quantified as the average linear speed of the wound edges after
24-h incubation.
Cell proliferation assays, chemotherapy
sensitivity assays, serum-dependent growth assays and assays of
tolerance to low oxygen conditions
BTC cells were transfected with RNA oligonucleotide
or plasmid DNA. Five hours after transfection, equal numbers of
viable cells were seeded in 96-well plates for cell proliferation
assays. Cell growth was determined using the
3-[4,5-dimethylthiazol-2-yl]-2, 5-diphenyltetrazolium bromide assay
(MTT) (Sigma, St. Louis, MO, USA). One-tenth volume of MTT with
serum-free medium was added to each well at different time points,
and the plates were further incubated at 37°C for 4 h. Formazan
crystals were dissolved in DMSO. The A590 was measured
with an enzyme-labeling instrument (BioTek, Winooski, VT, USA).
For the chemotherapy sensitivity assays,
5-fluorouracil (5-FU), epidoxorubicin (EADM), cisplatin (CDDP) and
hydroxycamptothecin (HCPT) were supplied by Pharmacia Qilu (Jinan,
China) and were used as the chemotherapy drugs to evaluate the
effect of CDK10 on chemotherapy sensitivity. Cells that were
transfected with RNA oligonucleotide (48 h post-transfection) and
stable transfectants were seeded into a 96-well plate
(4×10³ cells/well), and allowed to attach overnight.
Cells were treated with various concentrations of anticancer drugs
in at least six replicate wells and incubated for 48 h. The MTT
assay was performed in accordance with the aforementioned criteria
and dose-response curves were used to describe the results.
For studies of serum-dependence growth assays, cells
were seeded onto a 96-well plate (4×10³ cells/well), and
allowed to attach overnight. Cells were washed twice with
serum-free medium, new medium with 20, 15, 10, 5 or 1% serum was
added, and cells were cultured for 3 days. The MTT assay was
performed in accordance with the aforementioned criteria.
In this study, we imitated low oxygen conditions
using cobalt chloride to evaluate the cell survival (18). After cells were seeded and allowed
to attach to a 96-well plate, the medium with cobalt chloride
(final concentration of 100 μmol/l) was added. When each time point
arrived, an MTT assay was performed in accordance with the
afore-mentioned criteria.
Flow cytometry for cell cycle
analysis
Stable transfectants were seeded into 60-mm dishes.
After 24 h of culture, to allow cells to attach, cells were treated
with 5-FU, at 200 mg/l for 48 h. Cells were harvested. After
washing with PBS, the cells were fixed with 80% ice-cold ethanol at
4°C overnight. After fixation, the cells were stained with 4%
propidium iodide (PI) and 10% RNase A in PBS for 30 min at 37°C. A
total of 2×10⁴ events were analyzed per assay by FACScan
analysis using the CellQuest software (Becton-Dickinson, Franklin,
NJ, USA).
Statistical analysis
Data are presented as means ± SD from at least three
separate experiments. Statistical analysis was performed by the
Student’s t-test at a significance level of P<0.05. The
χ2 test was used to show differences in categorical
variables. All statistical analyses were conducted using SPSS
version 11.0.
Results
Expression of CDK10 is downregulated in
biliary tract cancer
To determine the clinical relevance of CDK10 in
human BTC, quantitative real-time PCR was performed to determine
the expression of CDK10 mRNA in human cancer and normal tissue
samples. The average expression of 18 normal samples was defined as
the basic expression of normal tissues. Forty-seven tumor samples
(including ICC, PCC, DECC, GBC and metastasis) were examined and
showed that decreased CDK10 mRNA occurred in 36 of the 47 samples
(76.6%), compared with normal tissue (Fig. 1A). The mRNA levels of CDK10 were
significantly different between tumors and normal tissues
(P=0.00075). We also determined the protein levels of CDK10 by
western blotting in 27 clinical samples (including normal tissues,
ICC, PCC, DECC, GBC and metastasis). As shown in Fig. 1B, decreased CDK10 protein occurred
in 15 of 18 (83.3%) tumors, compared with normal tissues (Fig. 1B). Statistical analysis indicated
that CDK10 protein was significantly different between tumors and
normal tissues (P=0.004). In subtypes of BTC, ICC and GBC had a
significantly downregulated CDK10 expression, compared with normal
tissues (P=0.01 and 0.048, respectively; Fig. 1C). In PCC and DECC specimens, the
expression of CDK10 had a tendency to decrease, but was not marked
(P=0.123 and 0.119, respectively). However, the difference between
ECC (including PCC and DECC) and normal specimens was marked
(P=0.04, Fig. 1C).
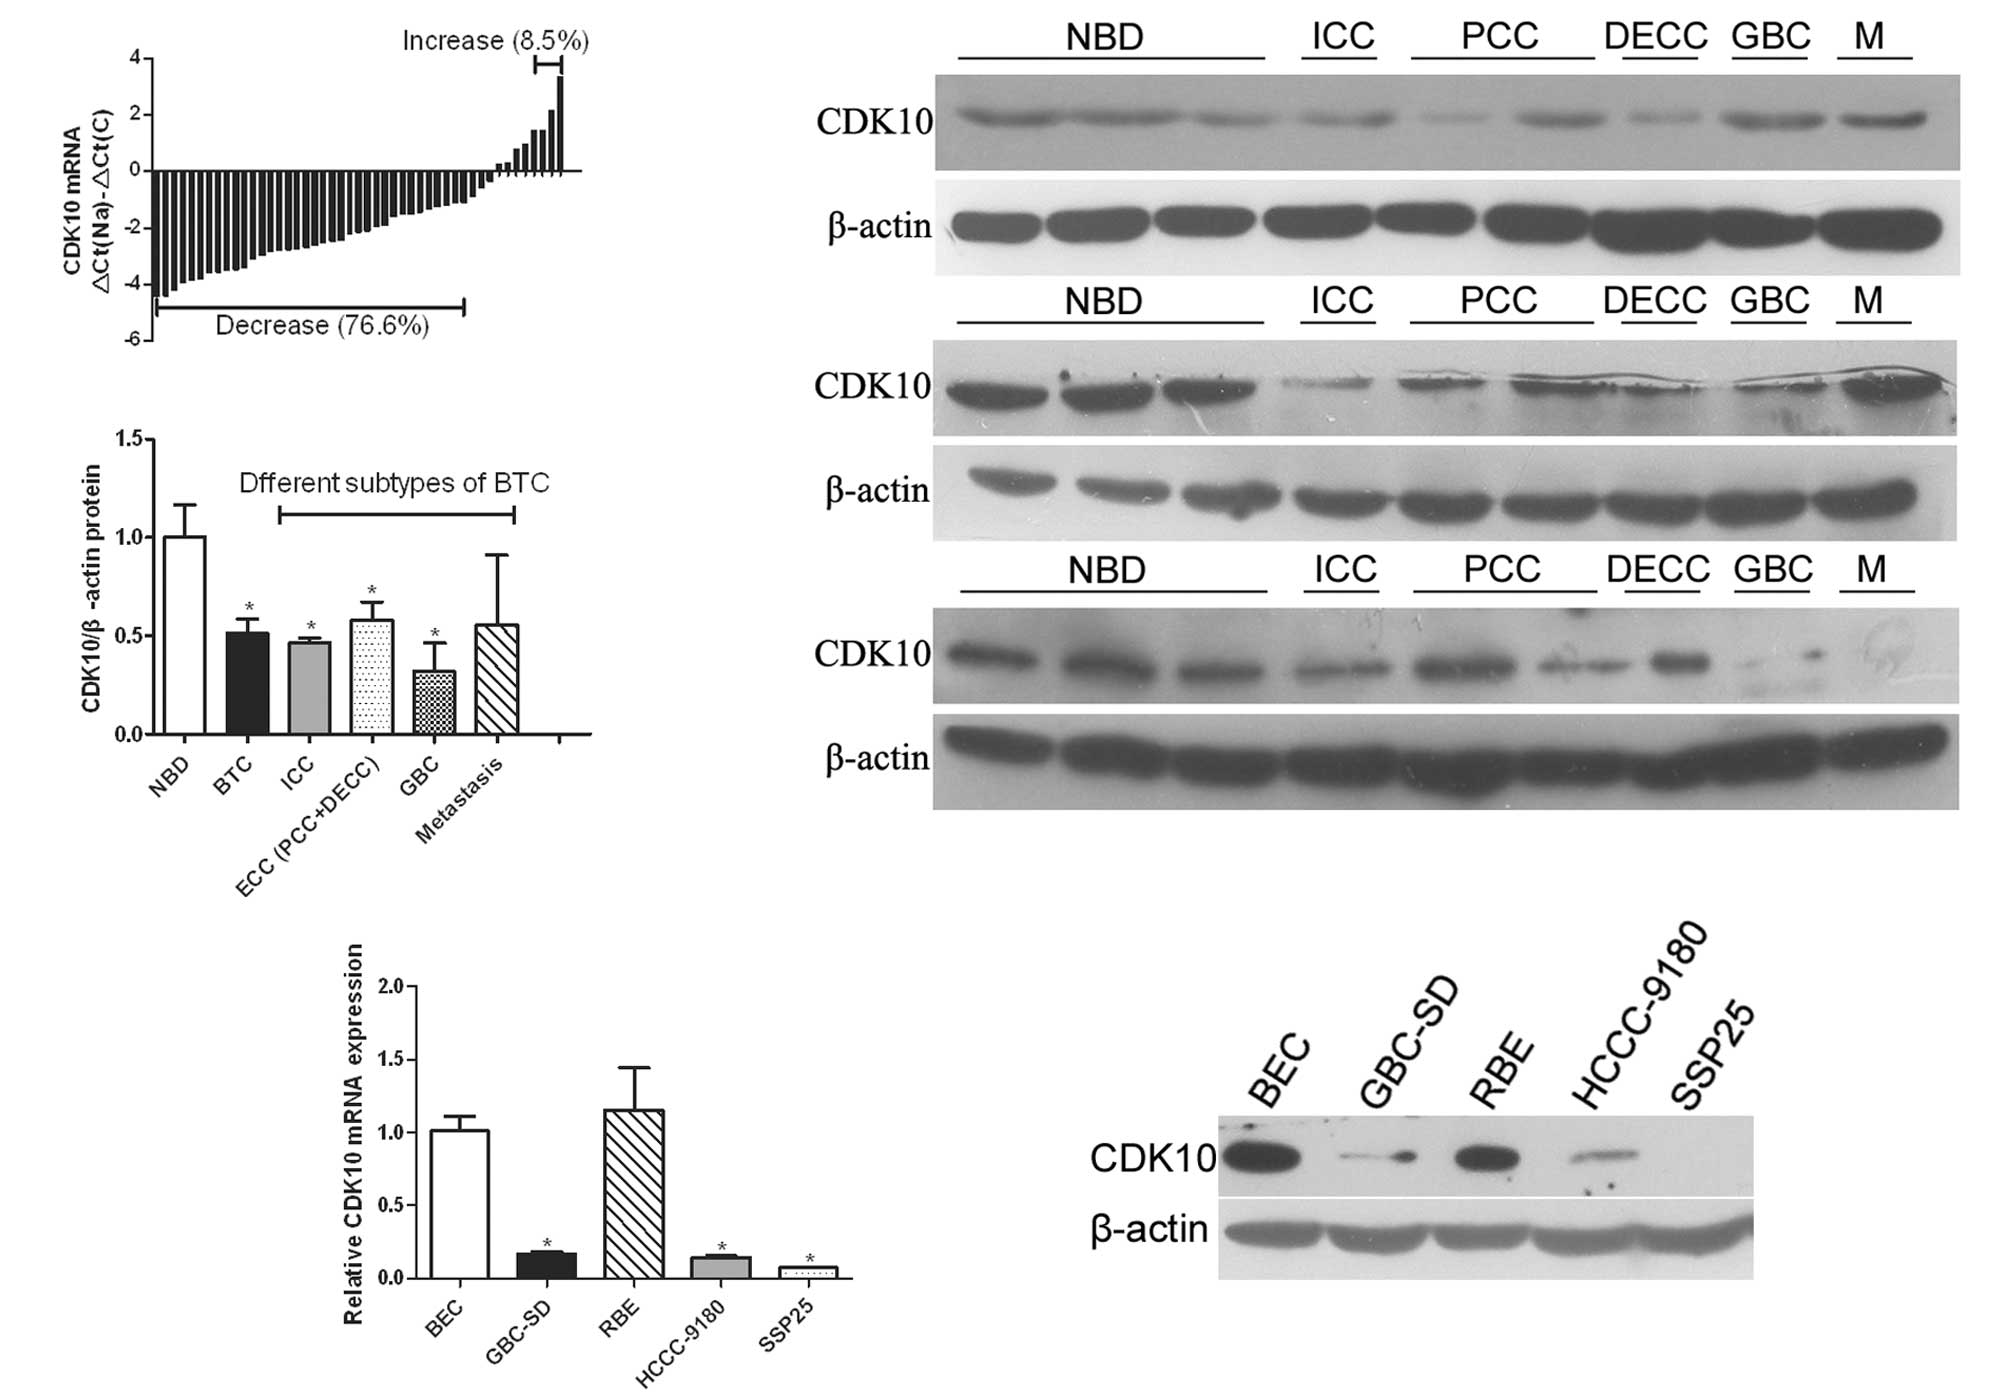 | Figure 1Expression of CDK10 is downregulated
in BTC. (A) Real-time PCR of the expression levels of CDK10 in BTC
and normal samples. ΔCt(Na), Ct value of β-actin was subtracted
from that of CDK10 of every normal tissue, and the average value of
the differences of all normal samples was defined as ΔCt(Na).
ΔCt(C), Ct value of β-actin was subtracted from that of CDK10 of
tumor. Bar value represents CDK10 mRNA level of tumor samples. Bar
values <-1 indicate that the expression of CDK10 is decreased in
tumors. Bar values >1 indicate that the expression of CDK10 is
increased in tumors. (B) Determination of relative CDK10 protein
level in 27 different samples (including 9 normal bile duct, 3 ICC,
6 PCC, 3 DECC, 3 GBC and 3 metastasis). Representative data are
shown. (C) Expression level of CDK10 protein in different subtypes
of BTC and normal bile duct. Student’s t-test was used to analyze
the difference between the two groups. *P<0.05. (D)
Real-time PCR of the expression level of CDK10 in tumor cell lines.
*P<0.05 compared with BEC. (E) Western blot analysis
of CDK10 expression in BEC and tumor cell lines. BTC, biliary tract
cancer; ICC, intrahepatic cholangiocarcinoma; NBD, normal bile
duct; GBC, gallbladder cancer; PCC, perihilar cholangiocarcinoma;
DECC, distal extrahepatic cholangiocarcinoma; M, metastases; BEC,
biliary epithelial cells. β-actin was employed as an internal
control for western blot analysis or real-time PCR. |
Patients were divided into three groups according to
the expression of CDK10 at the mRNA level. The clinical
characteristics were compared in these groups. Lower expression of
CDK10 was significantly associated with worse TNM staging,
increased lymph node invasion, and higher serum carbohydrate
antigen (CA)19-9 level in BTC (Table
II; P<0.05), but not with age, gender, histology type, tumor
location, differentiation grade, serum carcinoembryonic antigen
(CEA) level, hepatitis B virus (HBV) infection, metastasis, and
1-year survival (Table II).
| Table IIRelationship between CDK10 or c-RAF
expression and clinicopathological features of biliary tract
cancer. |
Table II
Relationship between CDK10 or c-RAF
expression and clinicopathological features of biliary tract
cancer.
| | CDK10 | c-RAF |
|---|
| |
|
|
|---|
| Variables | N | Low | Moderate | High | P-value | Low | Moderate | High | P-value |
|---|
| Gender |
| Male | 34 | 28 | 4 | 2 | 0.311 | 1 | 1 | 32 | 0.213 |
| Female | 13 | 8 | 3 | 2 | | 1 | 2 | 10 | |
| Age (years) |
| ≥60 | 17 | 14 | 2 | 1 | 0.776 | 2 | 1 | 14 | 0.158 |
| <60 | 30 | 22 | 5 | 3 | | 0 | 2 | 28 | |
| Tumor location |
| ICC | 6 | 6 | 0 | 0 | 0.711 | 0 | 0 | 6 | 0.695 |
| PCC | 20 | 15 | 4 | 1 | | 1 | 3 | 16 | |
| DECC | 12 | 9 | 1 | 2 | | 1 | 0 | 11 | |
| GBC | 5 | 3 | 1 | 1 | | 0 | 0 | 5 | |
| Metastases | 4 | 3 | 1 | 0 | | 0 | 0 | 4 | |
| Histology type |
| Adenoma | 42 | 34 | 5 | 3 | 0.122 | 1 | 3 | 38 | 0.159 |
| Non-adenoma | 5 | 2 | 2 | 1 | | 1 | 0 | 4 | |
| Lymph node
invasion |
| Present | 26 | 25 | 1 | 0 | 0.002 | 0 | 0 | 26 | 0.031 |
| Absent | 21 | 11 | 6 | 4 | | 2 | 3 | 16 | |
| TNM staging |
| I–II | 15 | 6 | 6 | 3 |
<0.001 | 0 | 3 | 12 | 0.023 |
| II–IV | 32 | 30 | 1 | 1 | | 2 | 0 | 30 | |
| Serum CEA level
(ng/ml) |
| >5 | 10 | 10 | 0 | 0 | 0.144 | 1 | 0 | 9 | 0.407 |
| ≤5 | 37 | 26 | 7 | 4 | | 1 | 3 | 33 | |
| Serum CA19-9 level
(U/ml) |
| >37 | 31 | 28 | 3 | 0 | 0.003 | 2 | 1 | 28 | 0.292 |
| ≤37 | 16 | 8 | 4 | 4 | | 0 | 2 | 14 | |
|
Differentiation |
| G1 | 9 | 6 | 2 | 1 | 0.182 | 1 | 3 | 5 | 0.003 |
| G2 | 19 | 12 | 4 | 3 | | 0 | 0 | 19 | |
| G3 | 19 | 18 | 1 | 0 | | 1 | 0 | 18 | |
| HBV infection |
| + | 23 | 17 | 4 | 2 | 0.890 | 0 | 0 | 23 | 0.068 |
| − | 24 | 19 | 3 | 2 | | 2 | 3 | 19 | |
| Metastasis after
surgery |
| + | 13 | 11 | 1 | 1 | 0.712 | 2 | 0 | 11 | 0.135 |
| − | 14 | 10 | 2 | 2 | | 0 | 2 | 12 | |
| Survival
(year) |
| >1 | 16 | 11 | 2 | 3 | 0.281 | 0 | 2 | 14 | 0.116 |
| ≤1 | 11 | 10 | 1 | 0 | | 2 | 0 | 9 | |
We also compared the expression of CDK10 between
four different tumor cell lines (GBC-SD, HCCC-9180, SSP25 and RBE)
and normal BECs. Real-time PCR analysis revealed that three cell
lines (GBC-SD, HCCC-9180 and SSP25) expressed lower levels of CDK10
compared to BECs; the difference was significant (Fig. 1D). Western blot analysis was also
performed and revealed a similar result to that of real-time PCR
analysis (Fig. 1E).
Overexpression of CDK10 inhibits
proliferation of biliary tract cancer cells
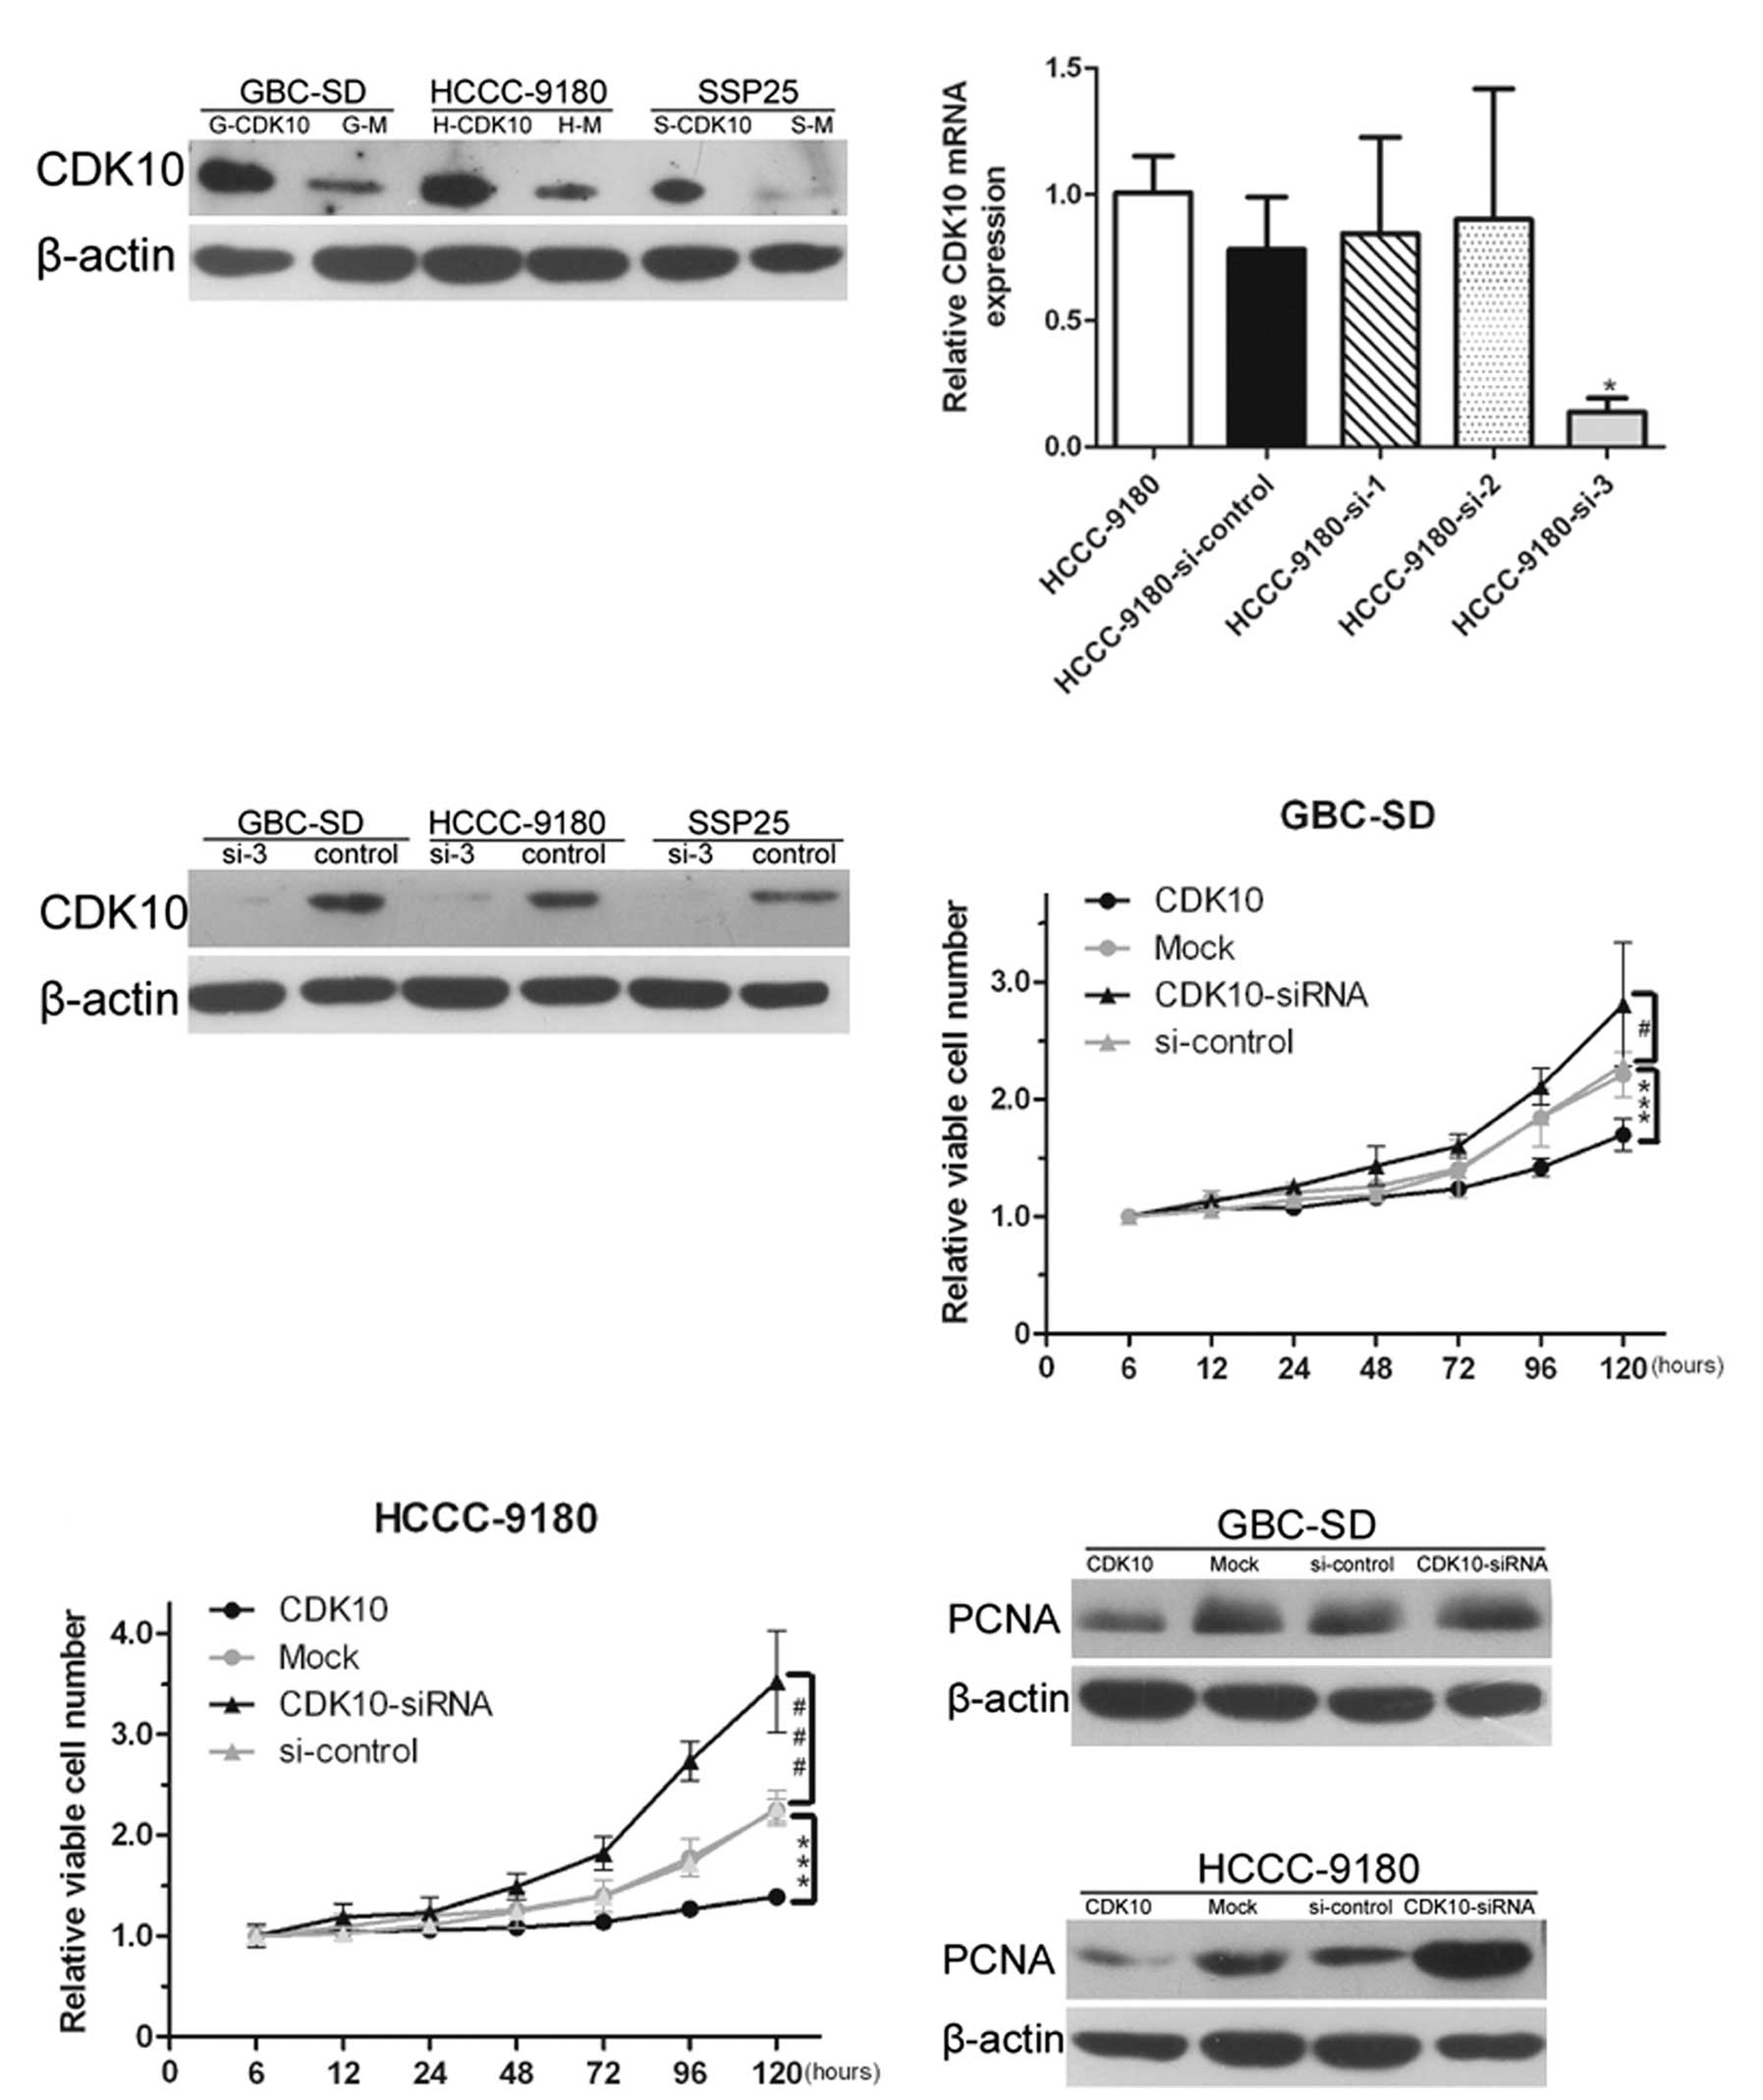
Three cell lines (GBC-SD, HCCC-9180 and SSP25) that
expressed lower levels of CDK10 were transfected with
pCMV6-Entry-CDK10 or empty vectors. After 3 weeks, stable
transfectants were obtained and named as H-CDK10 (HCCC-9180),
G-CDK10 (GBC-SD) and S-CDK10 (SSP25). The control clones expressing
empty vector (Mock) were named as H-M (HCCC-9180), G-M (GBC-SD) and
S-M (SSP25), respectively. Western blotting was performed to
confirm positive clones (Fig.
2A).
Three siRNAs targeting CDK10 were designed and
transfected into cells. Real-time PCR was performed to confirm
which one was the most effective. As shown in Fig. 2B, si-3 was used for further
experiments because this siRNA was most effective in suppressing
CDK10 expression. Seventy-two hours after transfection with si-3,
total protein was extracted from cells, and western blotting was
performed to confirm the effect of RNAi (Fig. 2C).
Given that CDK10 is downregulated in clinical
specimens and that it may act as a tumor suppressor, we decided to
examine whether CDK10 had anti-oncogenic functions in BTC cells
in vitro. To determine whether CDK10 regulated tumor growth,
we performed cell proliferation assays with GBC-SD and HCCC-9180
cells. MTT assays were performed at the indicated time points after
transfection. Overexpression of CDK10 significantly inhibited the
proliferation of GBC-SD and HCCC-9180 cells (P<0.001; Fig. 2D and E). Conversely, silencing of
CDK10 clearly promoted the proliferation of HCCC-9180 and GBC-SD
cells (P<0.001 and 0.05, respectively; Fig. 2D and E). Total proteins were
extracted from stable cell lines and the cells that were
transfected with siRNA after 72 h. Western blot analysis was
performed and proliferating cell nuclear antigen (PCNA) was
employed as a reporter of proliferation. The results demonstrate
that the lack of CDK10 increased proliferation. Conversely, the
proliferation was inhibited in CDK10-overexpressing cells (Fig. 2F and G).
Silencing of CDK10 promotes colony
formation and migration of cells
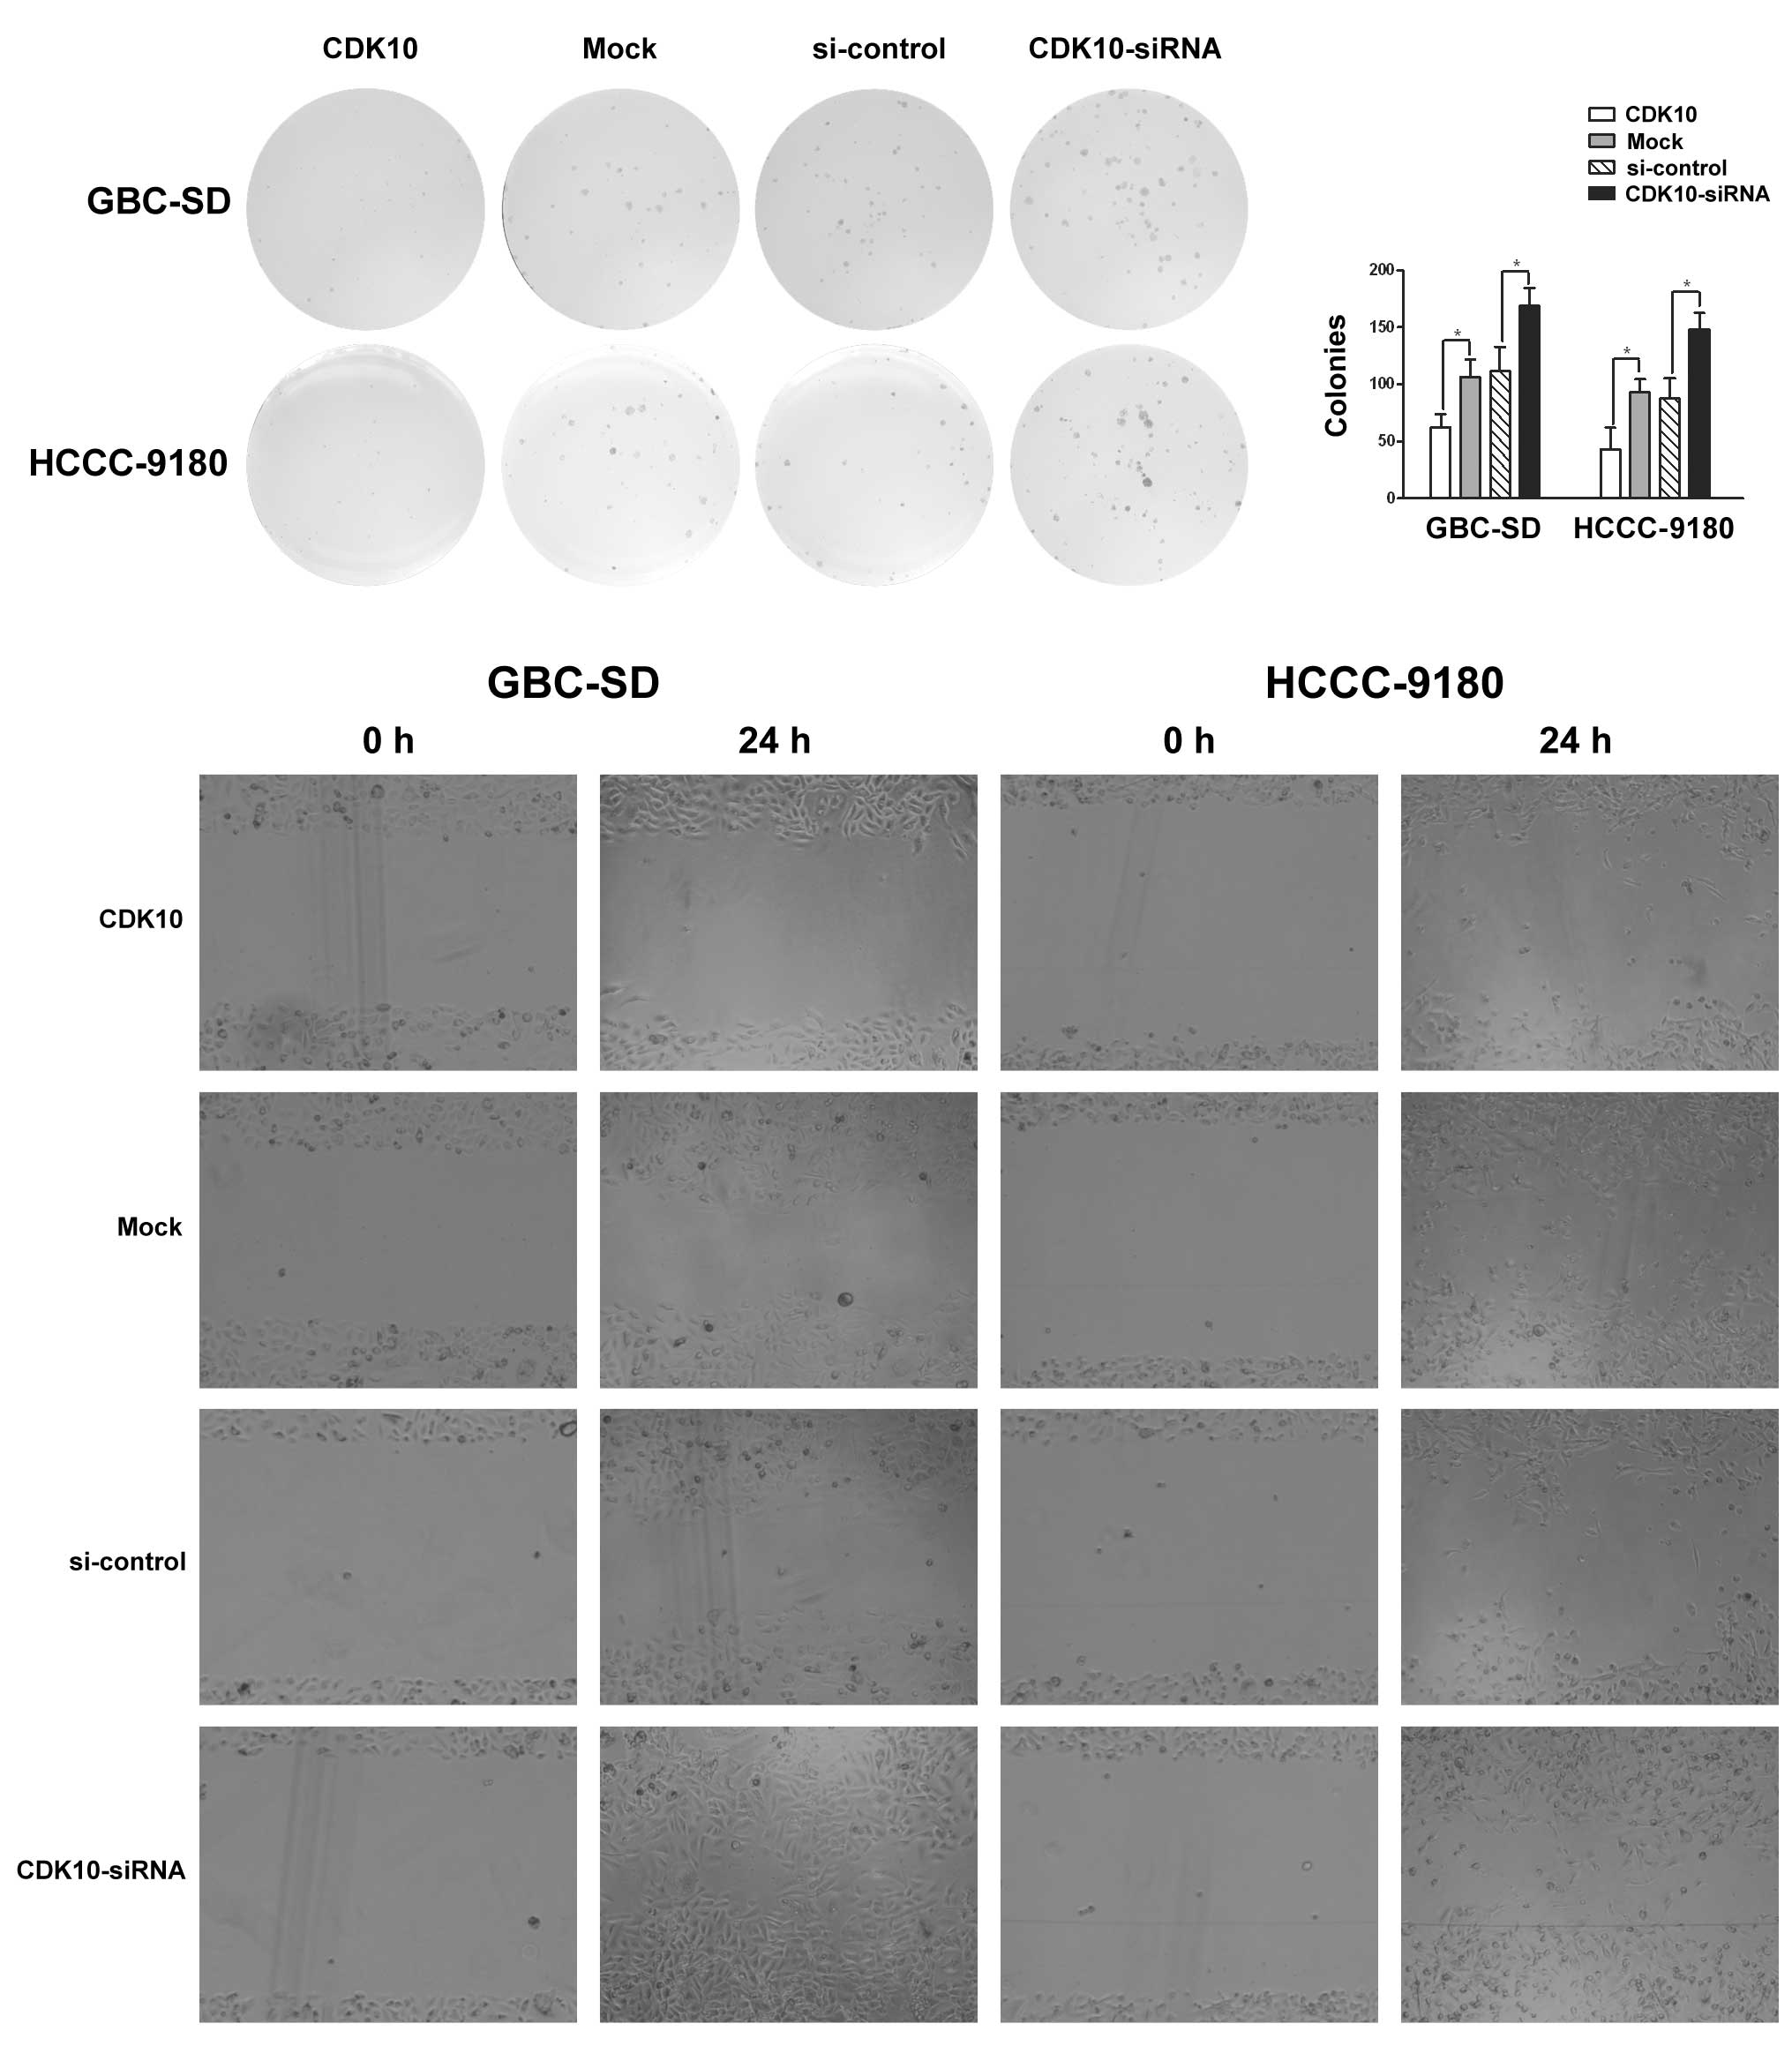
As shown in Fig. 3A,
overexpression or knockdown of CDK10, respectively, attenuated or
promoted colony formation of GBC-SD and HCCC-9180 cells (Fig. 3A and B; P<0.05). Greater numbers
of colonies of larger size were formed by knockdown of CDK10 as
compared with control RNA, whereas CDK10-overexpressing cells
formed only a few small colonies (Fig.
3A and B).
We next investigated the function of CDK10 in the
migration of GBC-SD and HCCC-9180 cells. CDK10 knockdown resulted
in a significant increase in cell migration, compared to cells
transfected with control RNA (Fig.
3C). As expected, CDK10 overexpression induced a significant
decrease in cell migration (Fig.
3C). These observations suggest that CDK10 inhibited the
migration of tumor cells.
Overexpression of CDK10 reverses the
resistance to chemotherapy for biliary tract cancer and decreases
survivability of biliary tract cancer cells
Given that CDK10 has been identified as an important
determinant of resistance to endocrine therapy for breast cancer
(10), we decided to examine
whether CDK10 influenced resistance of BTC cells to chemotherapy.
5-FU was used as the major drug and the GBC-SD, HCCC-9180 and SSP25
cell lines were examined. As shown in the dose-response curves
(Fig. 4A), CDK10 silencing
significantly decreased sensitivity to 5-FU for all three cell
lines, and overexpression of CDK10 increased sensitivity to 5-FU,
conversely. To confirm whether the influence of CDK10 was specific
to 5-FU or common to other chemotherapeutic drugs, EADM, CDDP and
HCPT were used as additional drugs, and GBC-SD and HCCC-9180 cell
lines were tested. For both GBC-SD and HCCC-9180 cells, after
overexpression or silencing of CDK10, EADM, CDDP and HCPT showed
similar alteration as 5-FU (Fig.
4B). The result indicated that expression of CDK10 influenced
resistance to chemotherapy rather than specifically to 5-FU.
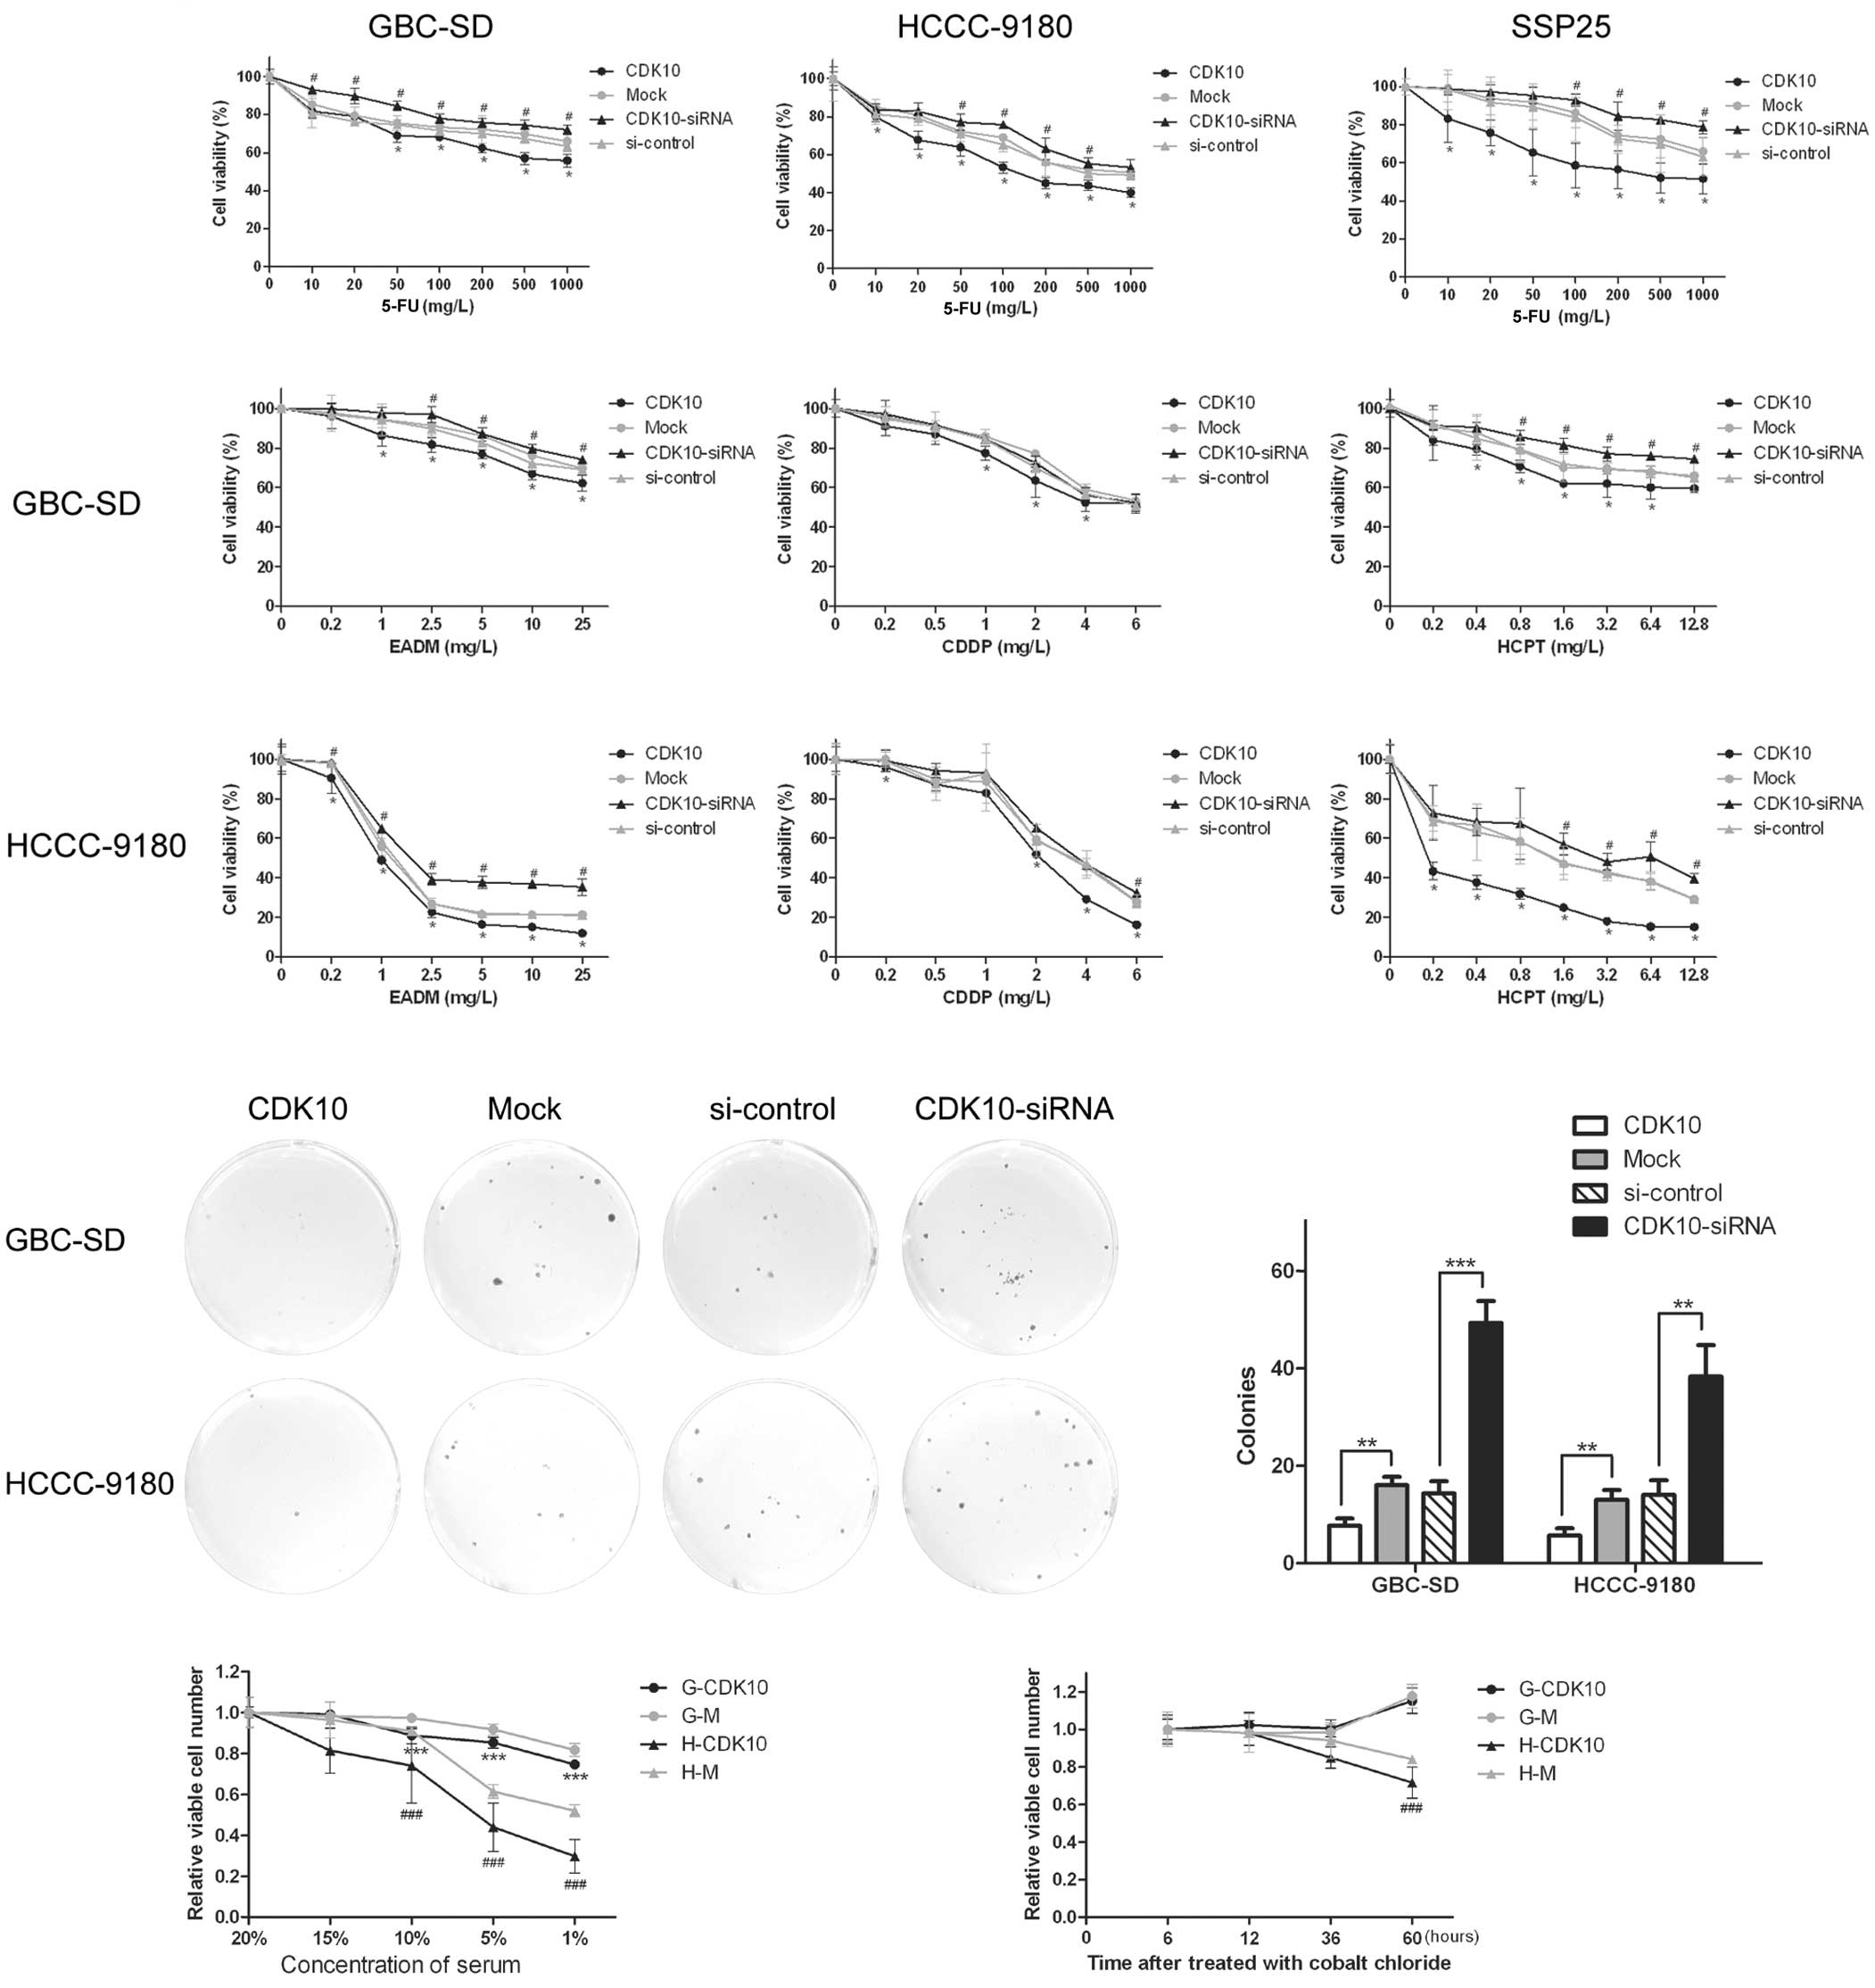 | Figure 4Overexpression of CDK10 decreases the
survivability of BTC cells to chemotherapy, serum starving and
hypoxia. (A and B) The cell viability assay was performed in both
CDK10-overexpressing and CDK10-silenced cells in the 48 h after
treated with chemotherapeutic drugs. GBC-SD, HCCC-9180 and SSP25
were treated with 5-FU. GBC-SD, HCCC-9180 were treated with EADM,
CDDP and HCPT. All the data are presented as mean ± SD of four
determinations/experiment from three separate experiments.
*P<0.05 compared with mock cells;
#P<0.05 vs. the cells transfected with control RNA.
(C and D) Forty-eight hours after exposed to 5-FU (200 mg/l), the
colony forming assay was performed to confirm the result of cell
viability assay. Colonies were counted in accordance with
aforementioned criteria. **P<0.01;
***P<0.001. (E and F) Serum-dependence growth assays
and hypoxia-tolerant assays were performed in CDK10-overexpressed
cells (G-CDK10 and H-CDK10) and mock cells. (G-M and H-M). MTT
assays were used to examine viable cells. Data shown are the mean ±
SD of three independent experiments. ***P<0.001 vs.
G-M cells; ###P<0.001 vs. H-M cells. BTC, biliary
tract cancer; 5-FU, 5-fluorouracil; EADM, epidoxorubicin; CDDP,
cisplatin; HCPT, hydroxycamptothecin. |
To obtain more evidence, we performed colony-forming
assays with chemotherapy in 24-well plates (100 cells/well). After
24-h culture, to allow cells to attach, cells were treated with
5-FU, at 200 mg/l for 48 h. Cells were fed with fresh medium
without 5-FU after washing with PBS and the other procedures were
the same as for the ordinary colony-forming assay. Overexpression
of CDK10 induced potentiation of the inhibitory effect of 5-FU on
the colony-forming ability. Furthermore, the inhibitory effect of
5-FU was relieved because of silencing of CDK10 (Fig. 4C and D).
We investigated the survivability of
CDK10-overexpressed cells by serum-dependence growth assays and
hypoxia-tolerant assays. The serum-dependence growth assays showed
that CDK10-overexpressed cells were much more independent of serum
(Fig. 4E). In hypoxia-tolerant
assays, CDK10-overexpressed HCCC-9180 cells showed a significantly
smaller decrease in survival, compared with Mock group. However,
GBC-SD was not sensitive to cobalt chloride (Fig. 4F). Taken together, these results
suggest that CDK10 regulates the survivability of BTC cells.
An increase in CDK10 expression induces
G0/G1 cell cycle arrest and potentiates the
cell cycle arrest induced by 5-FU
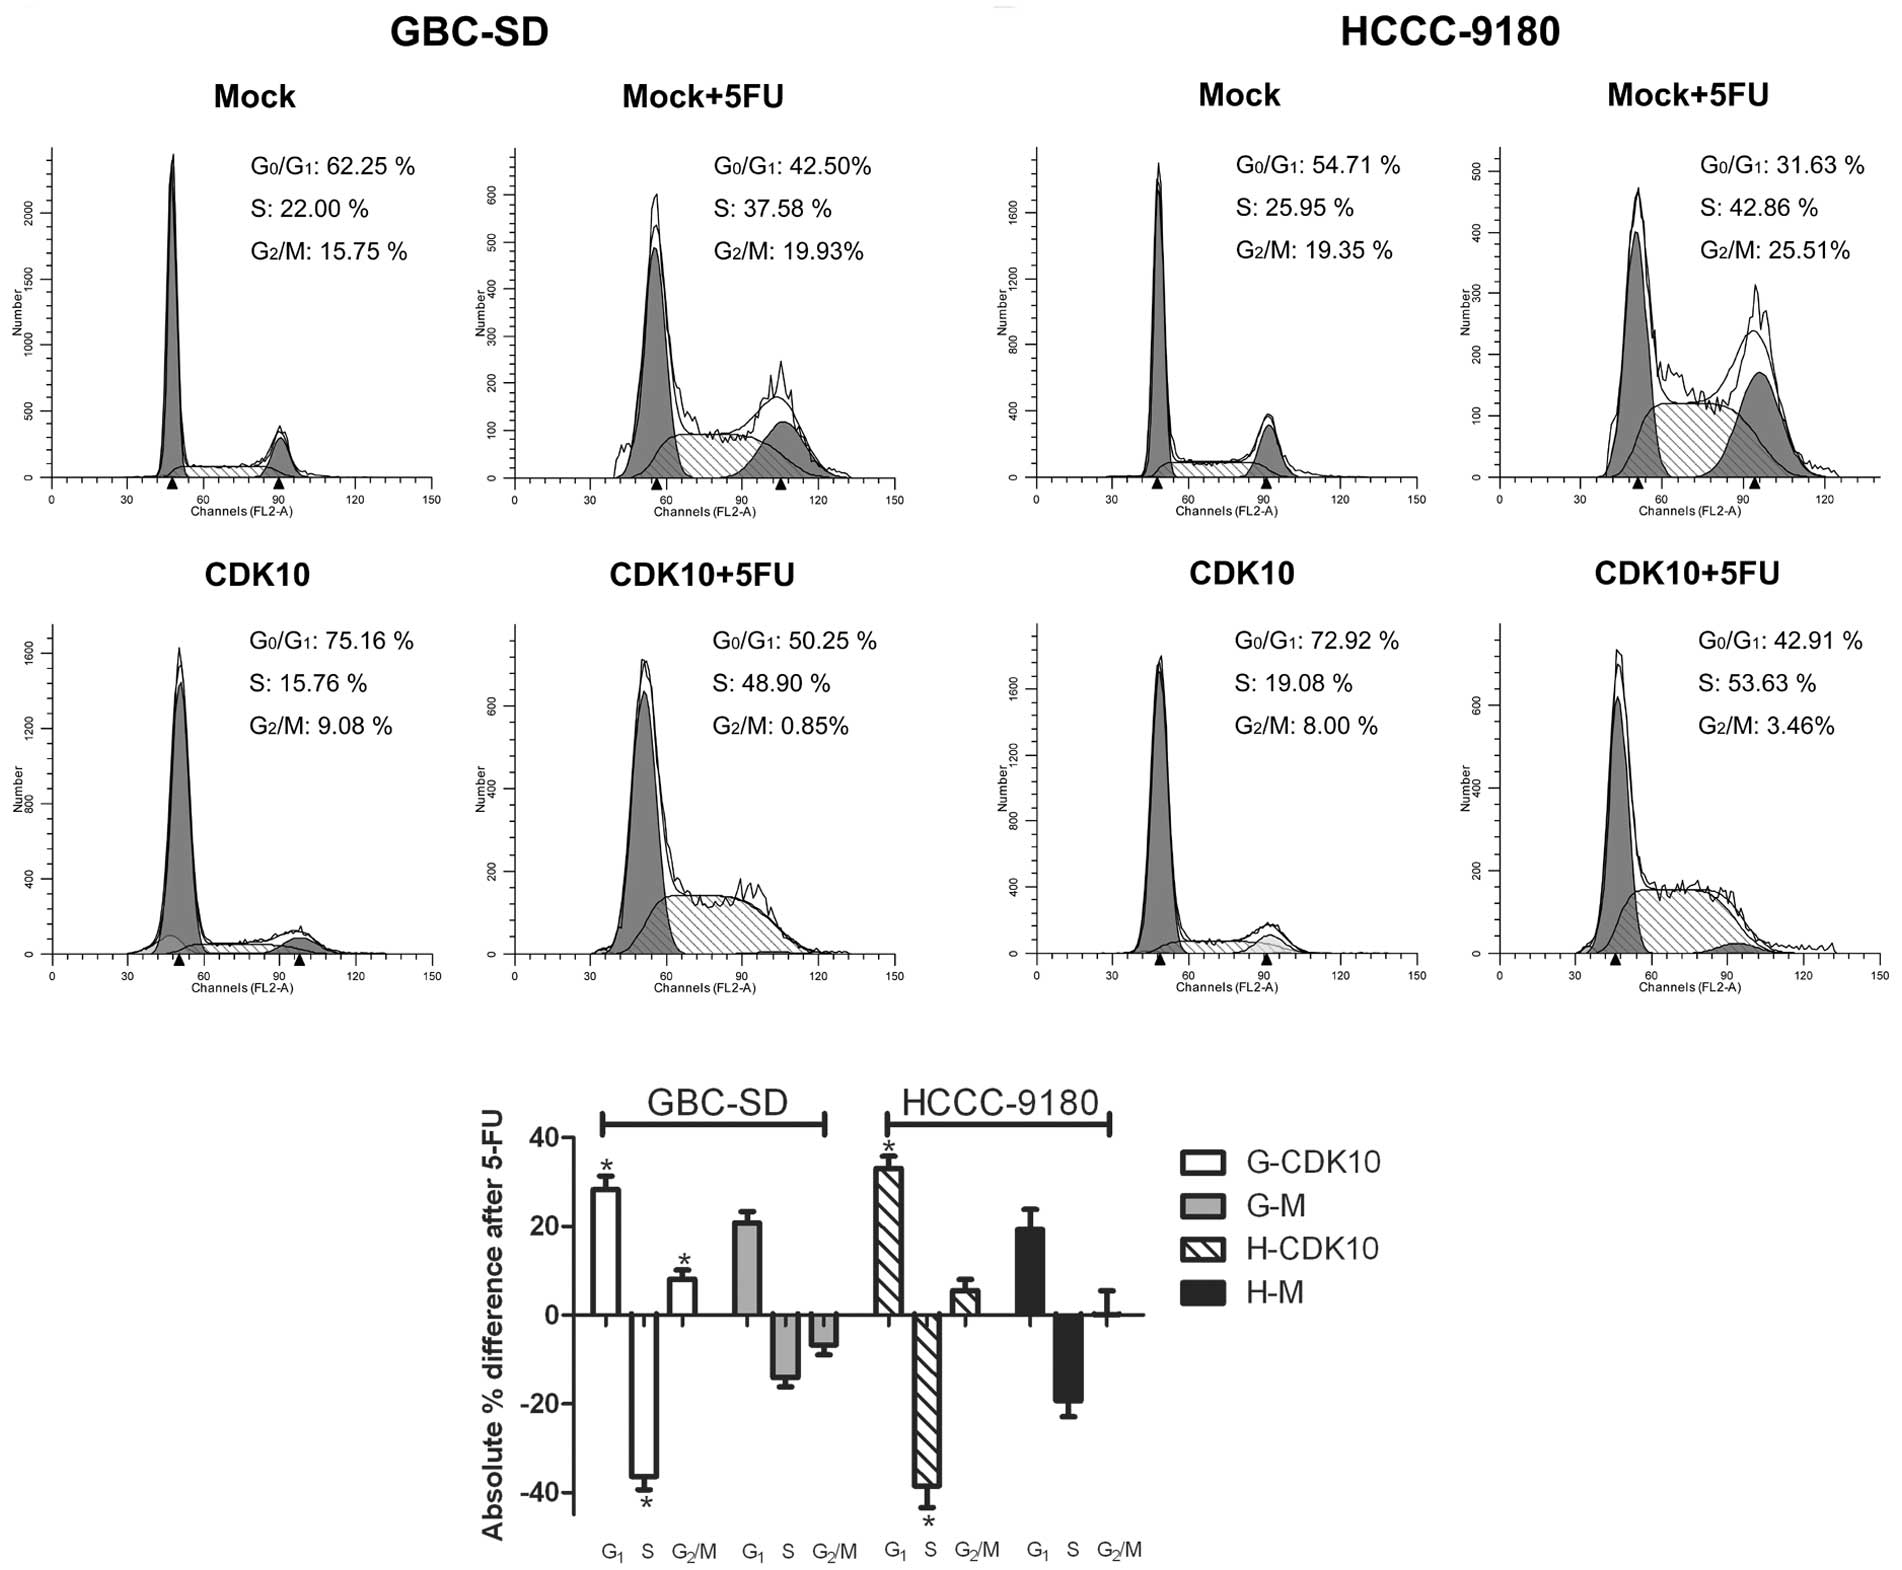
In colon cancer cells, the antiproliferative effect
of 5-FU results in induction of cell cycle arrest at the
G1 phase, and is characterized by an increase in the
number of cells in the S phase (19). To investigate the possibility that
an increase in CDK10 expression enhances the 5-FU-induced cell
cycle arrest, cell cycle profiles were assessed. Compared with Mock
cells, CDK10-overexpressed cells showed a significant increase in
the number of G1 phase cells and a simultaneous
significant decrease in G2/M phase cells (Fig. 5A and B). Mock cells (G-M and H-M)
treated with 5-FU displayed the expected increase in S phase
populations (Fig. 5A and B). In
contrast, 5-FU-treated, CDK10-overexpressing cells (G-CDK10 and
H-CDK10) showed a significant increase in the number of
G1 phase cells and a significant decrease in S phase
cells compared with Mock cells (Fig.
5). More interesting, G-M cells showed an increase in the
number of G2/M phase cells after treatment with 5-FU,
while the number of G-CDK10 cells in G2/M phase showed a
significant decrease (Fig. 5C).
CDK10 is a negative regulator of
expression of c-RAF in biliary tract cancer
To investigate the mechanism for the alteration of
resistance to chemotherapy, we examined five genes involved in
mechanisms of resistance (20)
including TP53 (p53), BID, ABCC2, ABCB1 and ABCB11. Given that
c-RAF has been identified as a target protein regulated by CDK10
and influences resistance to endocrine therapy for breast cancer,
c-RAF was also examined (10). The
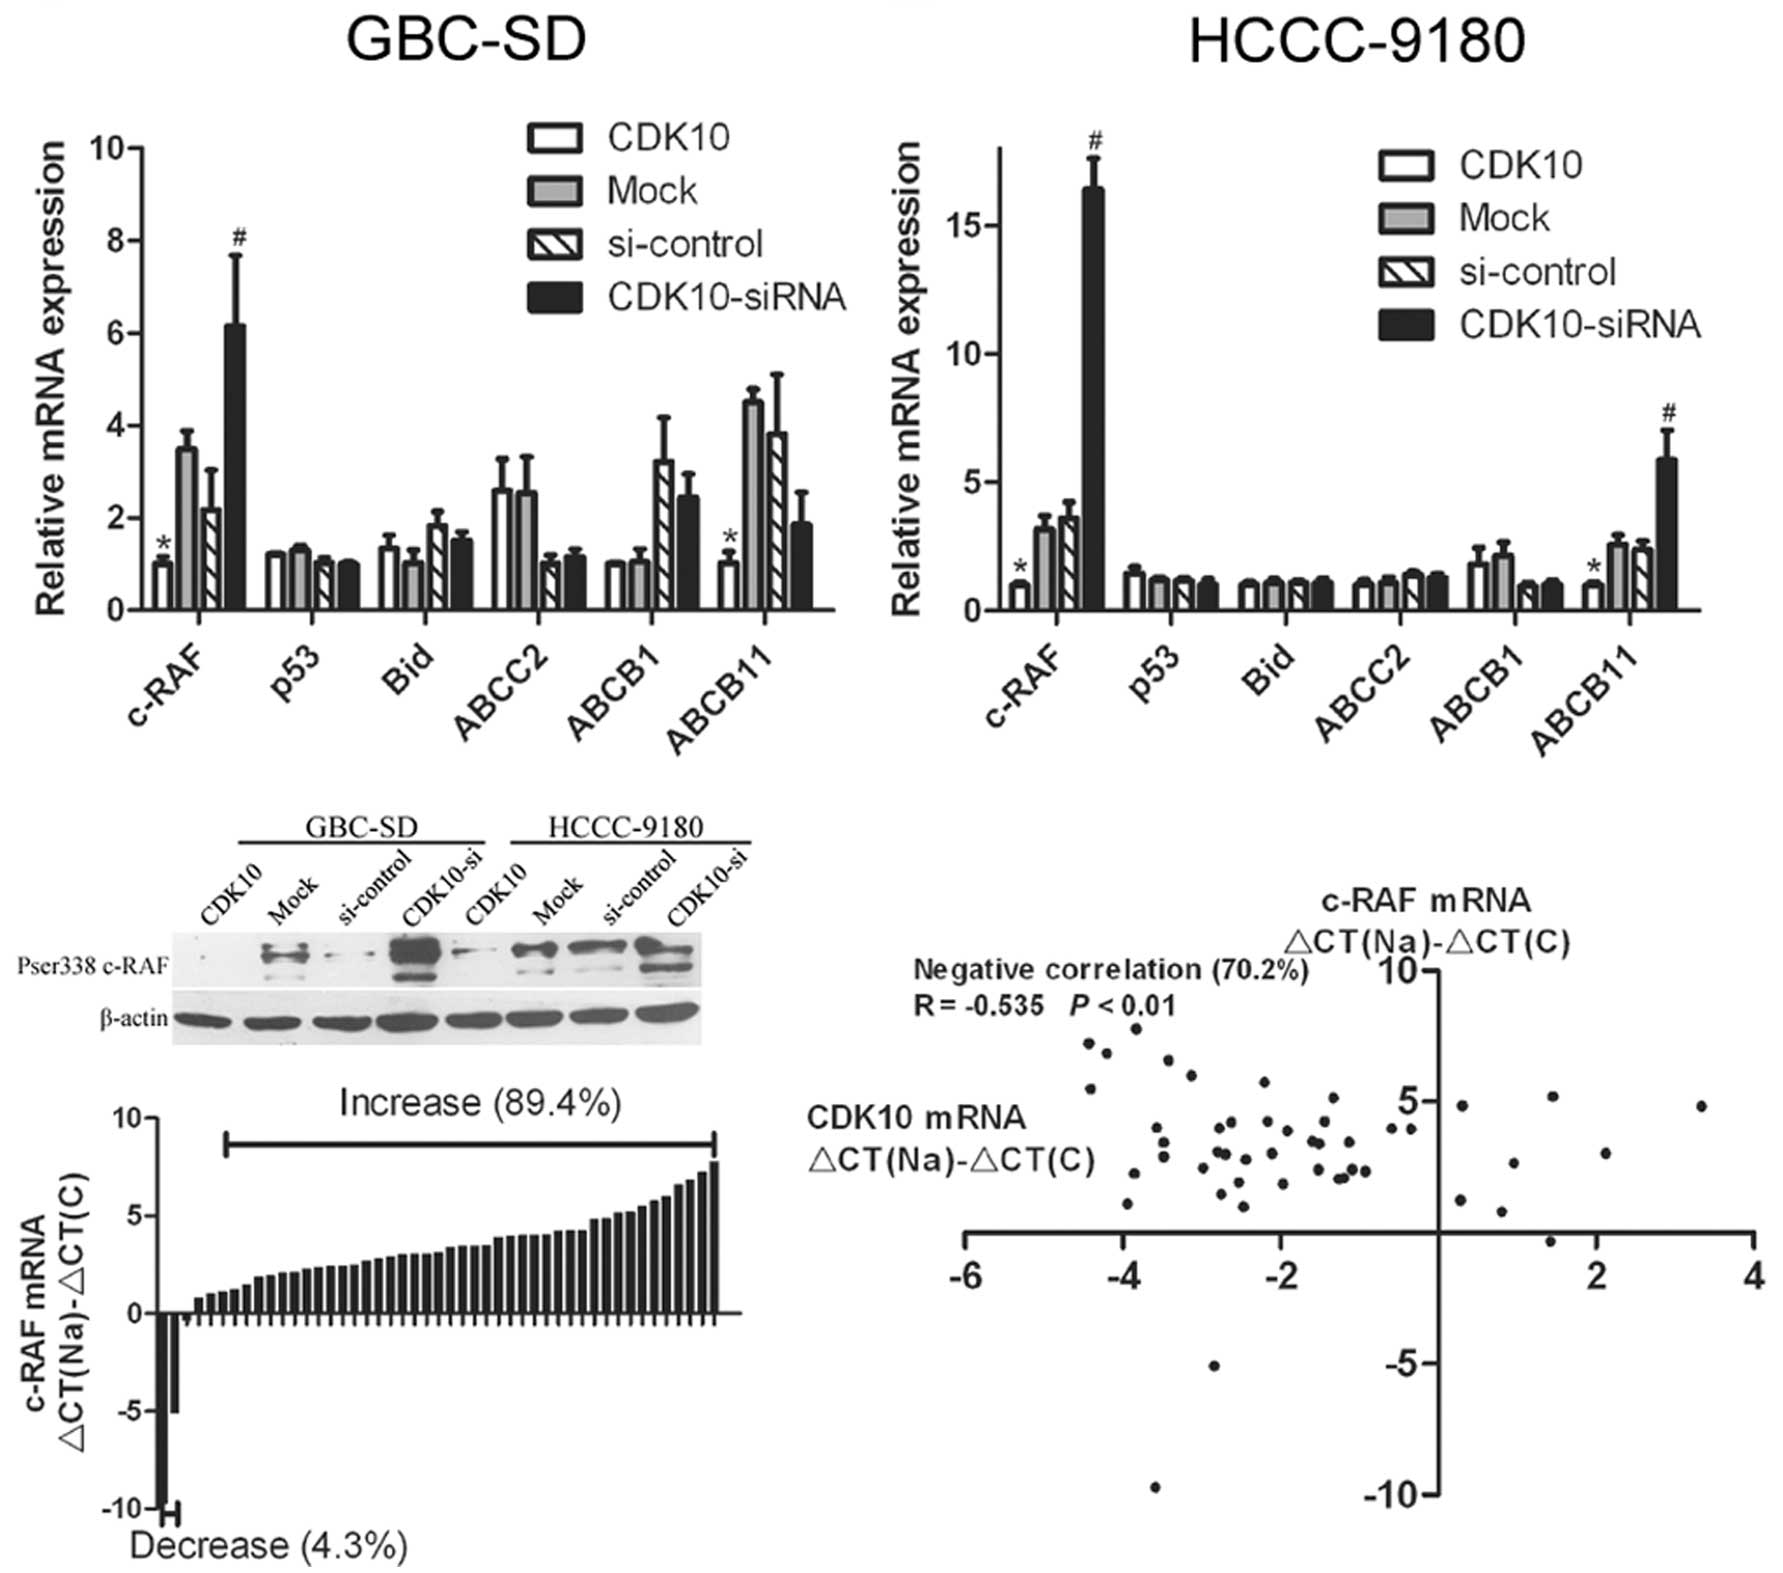
result of quantitative real-time PCR showed that
CDK10-overexpressing cells (G-CDK10 and H-CDK10) had decreased
c-RAF mRNA levels, compared with Mock cells (P<0.01; Fig. 6A and B). In contrast, CDK10-silenced
cells showed increased c-RAF mRNA, compared with cells transfected
with control RNA (P<0.01; Fig. 6A
and B). Among the other five candidate genes, only ABCB11
showed an expected alteration of expression in HCCC-9180 cells, but
not in GBC-SD cells (Fig. 6A and
B). The protein levels of c-RAF were examined in transfected
cells by western blotting. The results of western blotting
corresponded to those of real-time PCR (Fig. 6C), and demonstrated that c-RAF was
regulated by CDK10 in both GBC-SD and HCCC-9180 cells.
We supposed that c-RAF was regulated by CDK10 in BTC
in the same manner as described for breast cancer (10). Thus, we investigated the expression
of c-RAF mRNA in human cancer samples and normal samples by
real-time PCR. Increased c-RAF mRNA occurred in 42 of 47 (89.4%)
cancer samples, compared with normal tissues (Fig. 6D). The mRNA levels of c-RAF were
significantly different between tumors and normal tissues
(P=0.0363). Furthermore, we also investigated the correlation
between the expression level of c-RAF and clinical characteristics.
As shown in Table II, higher
expression of c-RAF was significantly associated with worse TNM
staging, increased lymph node invasion and poorer differentiation
grade, but not with age, gender, serum CA19-9 level, and 1-year
survival (Table II). More
interesting, an increase in c-RAF mRNA with a simultaneous decrease
in CDK10 mRNA occurred in 33 of 47 (70.2%) cancer samples.
Statistical analysis indicated that decreased CDK10 was correlated
with increased c-RAF (Fig. 6E).
These data indicate that CDK10 is a negative regulator of
expression of c-RAF in BTC.
Discussion
A previous study has reported that CDK10 expression
is reduced in breast cancer and CDK10 silencing induces resistance
to endocrine therapy (10). The
reason why CDK10 is downregulated in breast cancer with aberrant
DNA methylation is still controversial (10,21),
CDK10 is being investigated as a tumor suppressor (10,11).
However, little is known about the expression and function of CDK10
in BTC.
We showed that CDK10 was aberrantly expressed in BTC
samples and cell lines, which demonstrates that expression of CDK10
is downregulated in BTC, and that it functions as a tumor
suppressor to influence the cellular processes of BTC cells.
Although biliary cancers include ICC, ECC and GBC, CDK10 was
downregulated in all of them (Fig.
1C). Inhibition of CDK10 expression induced aberrant activation
of growth, migration and survivability (including resistance to
chemotherapy, serum starvation and hypoxia tolerance) of BTC cells.
More interesting, lower expression of CDK10 and higher expression
of c-RAF were significantly associated with clinical
characteristics, such as worse TNM staging and more lymph node
invasion. The results suggested that expression of CDK10 could be
used as a candidate index to evaluate BTC.
Resistance to chemotherapy is one of the major
limiting factors for the application of chemotherapeutic drugs in
BTC (1,5). Based on CDK10-silencing-induced
resistance to endocrine therapy (10), we investigated the correlation
between CDK10 and chemotherapy. We found that increased CDK10 was
correlated with decreased resistance to chemotherapy. These
findings may contribute to improving the effect of chemotherapy in
the future.
To explain the alteration in resistance to
chemotherapy induced by CDK10, we investigated the expression of
several candidate genes. The results confirmed that the expression
of c-RAF is regulated by CDK10 in BTC cells similarly to breast
cancer cells (10). Overexpression
of c-RAF has been reported to induce MAPK pathway activation
(22,23). Aberrant activation of the MAPK
pathway induces aberrant growth and increases the threshold for
cell death (24,25), resulting in increased survivability
of tumor cells. We examined the correlation between CDK10 and c-RAF
in clinical samples, which was not confirmed in previous research.
The results indicated that CDK10 was a negative regulator of c-RAF
in cells and clinical samples. Our results indicate that CDK10 may
function in cellular processes, at least partially, through
c-RAF.
Inactive CDK10 has been shown to lead to a
G2/M arrest in mammalian cells, but wild-type CDK10 only
shows a modest effect (8). However,
in our study, we investigated two malignant cell lines, and showed
CDK10-overexpressing cells had an increase in the G1
phase of the cycle, compared with the control group.
Coincidentally, in MCF-7 breast cancer cells, it has been reported
that there is a significant decrease in the number of G1
phase cells, in the absence of tamoxifen treatment, because of
CDK10 silencing (10). CDK10 is not
only a kinase but also a negative regulator of Ets2 transcription
factor (9,10). Ets2 has been found to play a role in
controlling the cell cycle though regulating Cdc2 expression
(26). The expression of c-RAF is
the more noteworthy factor, because it is regulated by CDK10 and
plays an important role in the cell cycle (10,27).
Taken together, the CDK10/Ets2/c-RAF signaling may help explain why
such an unusual event occur ed in the G1 phase. More
interestingly, after treatment with 5-FU, CDK10-overexpressing
cells showed a significantly increase in the G1 phase
cells in both the GBC-SD and HCCC-9180 cell lines, and a
significant decrease in the G2/M phase cells in GBC-SD.
We suggest that the overexpression of CDK10 induces more cells to
remain at a resting stage and makes cells sensitive to chemotherapy
in BTC.
In conclusion, we report that expression of CDK10 is
downregulated in biliary tract cancer and that it functions as a
tumor suppressor. CDK10 restoration inhibits tumor growth, cell
migration and survivability, and induces malignant cells to become
sensitive to chemotherapy in the biliary tract cancer. These
functions are at least partially mediated via a negative regulation
of c-RAF, thus offering a potential therapeutic approach for
treatment of biliary tract cancer with low expression of CDK10.
Acknowledgements
This study was supported by the National Natural
Science Foundation of China (no. 81170426) and the Heilongjiang
Provincial Natural Science Foundation of China (no. ZJY0704-01 and
no. QC2010103).
Abbreviations:
|
CDK10
|
cyclin-dependent kinase 10
|
|
BTC
|
biliary tract cancer
|
|
CCA
|
cholangiocarcinoma
|
|
GBC
|
gallbladder cancer
|
|
ICC
|
intrahepatic cholangiocarcinoma
|
|
ECC
|
extrahepatic cholangiocarcinoma
|
|
PCC
|
perihilar cholangiocarcinoma
|
|
DECC
|
distal extrahepatic
cholangiocarcinoma
|
|
MAPK
|
mitogen-activated protein kinase
|
|
PCNA
|
proliferating cell nuclear antigen
|
References
|
1
|
de Groen PC, Gores GJ, LaRusso NF,
Gunderson LL and Nagorney DM: Biliary tract cancers. N Engl J Med.
341:1368–1378. 1999.
|
|
2
|
Shaib Y and El-Serag HB: The epidemiology
of cholangiocarcinoma. Semin Liver Dis. 24:115–125. 2004.
View Article : Google Scholar : PubMed/NCBI
|
|
3
|
Khan SA, Thomas HC, Davidson BR and
Taylor-Robinson SD: Cholangiocarcinoma. Lancet. 366:1303–1314.
2005. View Article : Google Scholar : PubMed/NCBI
|
|
4
|
Nakeeb A, Pitt HA, Sohn TA, et al:
Cholangiocarcinoma. A spectrum of intrahepatic, perihilar, and
distal tumors. Ann Surg. 224:463–475. 1996. View Article : Google Scholar : PubMed/NCBI
|
|
5
|
Blechacz B and Gores GJ:
Cholangiocarcinoma: advances in pathogenesis, diagnosis, and
treatment. Hepatology. 48:308–321. 2008. View Article : Google Scholar : PubMed/NCBI
|
|
6
|
Malhi H and Gores GJ: Cholangiocarcinoma:
modern advances in understanding a deadly old disease. J Hepatol.
45:856–867. 2006. View Article : Google Scholar : PubMed/NCBI
|
|
7
|
Jarnagin WR and Shoup M: Surgical
management of cholangiocarcinoma. Semin Liver Dis. 24:189–199.
2004. View Article : Google Scholar
|
|
8
|
Li S, MacLachlan TK, De Luca A, Claudio
PP, Condorelli G and Giordano A: The cdc-2-related kinase, PISSLRE,
is essential for cell growth and acts in G2 phase of the cell
cycle. Cancer Res. 55:3992–3995. 1995.PubMed/NCBI
|
|
9
|
Kasten M and Giordano A: Cdk10, a
Cdc2-related kinase, associates with the Ets2 transcription factor
and modulates its transactivation activity. Oncogene. 20:1832–1838.
2001. View Article : Google Scholar : PubMed/NCBI
|
|
10
|
Iorns E, Turner NC, Elliott R, et al:
Identification of CDK10 as an important determinant of resistance
to endocrine therapy for breast cancer. Cancer Cell. 13:91–104.
2008. View Article : Google Scholar : PubMed/NCBI
|
|
11
|
Leman ES, Magheli A, Yong KM, Netto G,
Hinz S and Getzenberg RH: Identification of nuclear structural
protein alterations associated with seminomas. J Cell Biochem.
108:1274–1279. 2009. View Article : Google Scholar : PubMed/NCBI
|
|
12
|
Kanno N, Lesage G, Phinizy JL, Glaser S,
Francis H and Alpini G: Stimulation of alpha2-adrenergic receptor
inhibits cholangiocarcinoma growth through modulation of Raf-1 and
B-Raf activities. Hepatology. 35:1329–1340. 2002. View Article : Google Scholar : PubMed/NCBI
|
|
13
|
Gorunova L, Parada LA, Limon J, et al: Non
random chromosomal aberrations and cytogenetic heterogeneity in
gallbladder carcinomas. Genes Chromosomes Cancer. 26:312–321. 1999.
View Article : Google Scholar : PubMed/NCBI
|
|
14
|
Rijken AM, Hu J, Perlman EJ, et al:
Genomic alterations in distal bile duct carcinoma by comparative
genomic hybridization and karyotype analysis. Genes Chromosomes
Cancer. 26:185–191. 1999. View Article : Google Scholar : PubMed/NCBI
|
|
15
|
Bullrich F, MacLachlan TK, Sang N, et al:
Chromosomal mapping of members of the cdc2 family of protein
kinases, cdk3, cdk6, PISSLRE, and PITALRE, and a cdk inhibitor,
p27Kip1, to regions involved in human cancer. Cancer Res.
55:1199–1205. 1995.PubMed/NCBI
|
|
16
|
Livak KJ and Schmittgen TD: Analysis of
relative gene expression data using real-time quantitative PCR and
the 2(−Delta Delta C(T)) method. Methods. 25:402–408. 2001.
|
|
17
|
Dong Z and Cmarik JL: Harvesting cells
under anchorage-independent cell transformation conditions for
biochemical analyses. Sci STKE. 2002:pl72002.PubMed/NCBI
|
|
18
|
Scherbakov AM, Lobanova YS, Shatskaya VA
and Krasil’nikov MA: The breast cancer cells response to chronic
hypoxia involves the opposite regulation of NF-kB and estrogen
receptor signaling. Steroids. 74:535–542. 2009. View Article : Google Scholar : PubMed/NCBI
|
|
19
|
Sasaki K, Tsuno NH, Sunami E, et al:
Chloroquine potentiates the anti-cancer effect of 5-fluorouracil on
colon cancer cells. BMC Cancer. 10:3702010. View Article : Google Scholar : PubMed/NCBI
|
|
20
|
Marin JJ, Romero MR and Briz O: Molecular
bases of liver cancer refractoriness to pharmacological treatment.
Curr Med Chem. 17:709–740. 2010. View Article : Google Scholar : PubMed/NCBI
|
|
21
|
Heller G, Ziegler B, Brandstetter A, et
al: CDK10 is not a target for aberrant DNA methylation in breast
cancer. Anticancer Res. 29:3939–3944. 2009.PubMed/NCBI
|
|
22
|
Kolch W: Coordinating ERK/MAPK signalling
through scaffolds and inhibitors. Nat Rev Mol Cell Biol. 6:827–837.
2005. View
Article : Google Scholar : PubMed/NCBI
|
|
23
|
Beeram M, Patnaik A and Rowinsky EK: Raf:
a strategic target for therapeutic development against cancer. J
Clin Oncol. 23:6771–6790. 2005. View Article : Google Scholar : PubMed/NCBI
|
|
24
|
Small GW, Somasundaram S, Moore DT, Shi YY
and Orlowski RZ: Repression of mitogen-activated protein kinase
(MAPK) phosphatase-1 by anthracyclines contributes to their
antiapoptotic activation of p44/42-MAPK. J Pharmacol Exp Ther.
307:861–869. 2003. View Article : Google Scholar : PubMed/NCBI
|
|
25
|
Dent P and Grant S: Pharmacologic
interruption of the mitogen-activated extracellular-regulated
kinase/mitogen-activated protein kinase signal transduction
pathway: potential role in promoting cytotoxic drug action. Clin
Cancer Res. 7:775–783. 2001.
|
|
26
|
Wen SC, Ku DH, De Luca A, Claudio PP,
Giordano A and Calabretta B: ets-2 regulates cdc2 kinase activity
in mammalian cells: coordinated expression of cdc2 and cyclin A.
Exp Cell Res. 217:8–14. 1995. View Article : Google Scholar : PubMed/NCBI
|
|
27
|
Chang F, Steelman LS, Shelton JG, et al:
Regulation of cell cycle progression and apoptosis by the
Ras/Raf/MEK/ERK pathway (Review). Int J Oncol. 22:469–480.
2003.PubMed/NCBI
|