Introduction
Melanoma is a malignant tumor of the melanocytes.
Statistical data show that melanoma is the cause of approximately
75% of all skin cancer-related deaths. In European countries, there
were approximately 60,000 melanoma cases leading to 13,000 deaths
in 2006 (1). Elucidating the
detailed mechanisms of melanoma has been a challenging task for
researchers.
The melanoma cell adhesion molecule (MCAM), also
known as CD146 or MUC18, is a membrane calcium-independent
glycoprotein adhesion molecule first identified in melanoma
(2). MCAM is abnormally expressed
in other tumor tissues, including prostate cancer (3), breast cancer (4), and non-small cell lung cancer
(5). MCAM is also a characteristic
antigen that distinguishes malignant melanoma from benign or
borderline melanoma. To date, the upstream regulation of MCAM
remains largely unknown. Thus, we investigated the factors that
directly regulate MCAM.
microRNAs (miRNAs) are short non-coding RNAs (18–22
nt) that can inhibit gene expression at the post-transcription
level. Following processing by Drosha and Dicer, mature miRNAs are
incorporated into the RNA-induced silencing complex (RISC), bind to
the 3′ untranslated region (3′UTR) of the target mRNAs and inhibit
their expression (6,7). Due to their widespread regulation on
protein-coding genes, miRNAs have various physiological and
pathological functions. Accumulating evidence demonstrates the
relationship between miRNAs and carcinogenesis (8,9).
Several miRNA-regulated molecular pathways are involved in the
pathogenesis of malignant melanoma, including the RAS-RAF-MEK-ERK,
p16(INK4A)-CDK4-RB, PIK3-AKT, and MITF pathways (10).
In the present study, we found that miR-573 was
downregulated in melanoma tissues and cell lines compared to the
normal skin tissues. The overexpression of miR-573 in vitro
suppressed the proliferation of melanoma cells by excessively
inhibiting MCAM expression. Furthermore, miR-573 could suppress the
growth of melanoma cells in vivo. These results highlight
the role of miR-573 in melanoma and may provide insight to better
understand the anticancer mechanism of miRNAs.
Materials and methods
Cell lines and human tissues
Two melanoma cell lines, A375 and SK-MEL-2, were
purchased from the American Type Culture Collection (Rockville, MD,
USA). The cell lines were grown in RPMI-1640 medium containing 10%
fetal bovine serum (FBS). Human melanoma specimens (n=11) and
paired non-cancerous normal skin specimens (n=11) were obtained
from patients at the Affiliated Hospital of Medical College of
Chinese People’s Armed Police Forces, with documented informed
consent for each case. Patients undergoing surgery for melanoma
provided written consent to donate their tissues for analysis.
Quantitative PCR
The real-time PCR analyses for quantitation of
miRNAs were carried out using SYBR® Premix Ex Taq™ II
(Takara). After total RNA was extracted, miRNA-specific reverse
transcription and PCR amplification were performed. The comparative
cycle threshold (Ct) method was applied to quantify the
expression levels through calculation using the 2−ΔΔCt
method. U6 small nuclear RNA was used as an internal standard. The
reverse transcription primers were: miR-573-RT,
5′-GTCGTATCCAGTGCAGGGTCCGAGGTGCACTGGATACGACCTGATC-3′; U6-RT,
5′-GTCGTATCCAGTGCAGGGTCCGAGGTGCACTGGATACGACAAAATATGG-3′. The PCR
primers were: miR-573 forward, 5′-TGCGGCTGAAGTGATGTGTAAC-3′; U6
forward, 5′-TGCGGGTGCTCGCTTCGGCAGC-3′ and a universal reverse
primer, 5′-CCAGTGCAGGGTCCGAGGT-3′.
Cellular viability assay
A375 and SK-MEL-2 cells were transfected,
trypsinized and seeded at 3×10³ cells/well in 96-well
plates. At 48 h after transfection, the
3-(4,5-dimethylthiazol-2-yl)-2,5-diphenyltetrazolium bromide, (MTT)
assay was performed to determine the cellular viability. The
optical density was read at 560 nm and the background was
subtracted at 670 nm.
In vitro invasion assay
Transwell invasion assays were performed to evaluate
the invasion ability of the cells. Briefly, the transwell chambers
were coated with 5 μg of Matrigel (8 μm pore; BD Biosciences,
Franklin Lakes, NJ, USA). The bottom chamber was filled with DMEM
containing 10% FBS. Tumor cells (1×10⁵ cells in a total
volume of 100 μl FBS-free medium) were placed on the chamber and
incubated at 37°C in 5% CO2. Non-invading cells on the
upper surface of the membrane were removed after 16 h. The cells
that invaded to the underside of the polycarbonate membrane were
fixed with ethanol and stained by crystal violet for 5 min. The
number of invasive cells was then counted in five independent
fields under a microscope. The mean of the triplicate assays for
each experimental condition was used for analysis.
Apoptosis analysis
Flow cytometric analysis was performed using an
Annexin V-PE/7-AAD apoptosis detection kit (BD Biosciences) to
identify and quantify the apoptotic cells. Both adherent and
floating cells were harvested and stained according to the
manufacturer’s instructions. The cell samples were analyzed using a
Becton-Dickinson FACSVantage SE instrument.
Colony formation assay
Twenty-four hours after transfection, the cells
(1,000 cells in a total volume of 2 ml) were placed on 6-well
plates and incubated at 37°C in 5% CO2 humidified air.
After 15 days of incubation, the cells were stained by crystal
violet and the number of clones was counted.
Vector construction
The miRNA expression plasmid was constructed using
the expression plasmid pcDNA3.1. The DNA fragments containing miRNA
precursor sequences were amplified from HEK293 cell genome using
the following primers: pri-miR-573-F,
5′-CGCGGATCCACTTAAGGAGGGCTGAATGG-3′ and pri-miR-573-R,
5′-CCGGAATTCAACAGTGACTGTCCAAGAGC-3′; the PCR primers for MCAM 3′UTR
fragment were: MCAM-3′UTR-F,
5′-AGCTTTGTTTAAACAATCACTTCAGCTCCCTTC-3′ and MCAM-3′UTR-R,
5′-CTAGTCTAGATGCAAATTTACACACCTGAC-3′. The fragment of mutated MCAM
3′UTR with mutated 3′UTR was amplified by PCR side-directed
mutagenesis assay with these two primers (mutated MCAM-UTR-F and
mutated MCAM-UTR-R). Mutated MCAM-UTR-F,
5′-AGCTTTGTTTAAACAAACTCATGACCTCCCTTC-3′ and mutated MCAM-UTR-R,
5′-CTAGTCTAGATGCAAATTTACACACCTGAC-3′. These two amplified fragments
were both inserted into pmirGLO vector with PmeI and
XbaI sites. The MCAM ectopic expression plasmid containing
coding domains (CDS) was constructed using pCMV-HA vector. The PCR
primers were: MCAM-F, 5′-CCGGAATTCATGGGGCTTCCCAGGCTGG-3′ and
MCAM-R, 5′-ATAAGAATGCGGCCGCCTAATGCCTCAGATCGATG-3′. The amplified
fragment was inserted into pCMV-HA vector with EcoRI and
NotI sites.
Luciferase assays
The luciferase reporter plasmids were transfected
separately or cotransfected with miRNA expression vector into A375
cells using Lipofectamine 2000 (Invitrogen, Carlsbad, CA, USA) in
24-well plates. After 48 h, the Firefly and Renilla luciferase
activities were measured using the Dual-Glo® Luciferase
Assay System (Promega, Madison, WI, USA) on Varioskan Flash
microplate reader (Thermo Scientific) according to the
manufacturer’s protocols. The Firefly luciferase intensity was
normalized to that of the Renilla luciferase. All the transfections
were performed three times.
Western blot analysis
The cells were lysed in 0.4 ml of lysis buffer (50
mM Tris pH 8.0, 150 mM NaCl, 10 mM EDTA, 1% NP-40, 20 mM NaF, 1 mM
orthovanadate, and protease inhibitor cocktail). The lysates were
separated by electrophoresis and transferred to the membrane, which
was then blocked with bovine serum albumin. The membrane was then
incubated with rabbit polyclonal antibody to MCAM (Abcam,
Cambridge, UK) and then with goat anti-rabbit IgG-HRP secondary
antibody (Santa Cruz Biotechnology, Inc., Santa Cruz, CA, USA).
GAPDH (Santa Cruz) was used as loading control. Protein expression
was assessed by enhanced chemiluminescence and exposure to the
chemiluminescent film.
In vivo proliferation assay
The 5-week old BABL/c nude mice were obtained from
the Animal Center of the Military Academy of Medical Sciences
(Beijing, China). All animal studies were performed according to
the animal use guidelines of the National Institute of Health and
the current Chinese regulations and standards on the use of
laboratory animals. A total of 1×10⁷ cells were injected
subcutaneously into nude mice. The mice were sacrificed at 30 days
after injection. Tumor volume was evaluated using the following
formula: Tumor volume = 4π/3 × (width/2)2 ×
(length/2).
Statistical analysis
Data were expressed as mean ± standard deviation
(SD). Statistical comparisons were conducted between the two groups
using the t-test. Differences were considered statistically
significant when P<0.05. The significant results are marked with
(#) in the figures.
Results
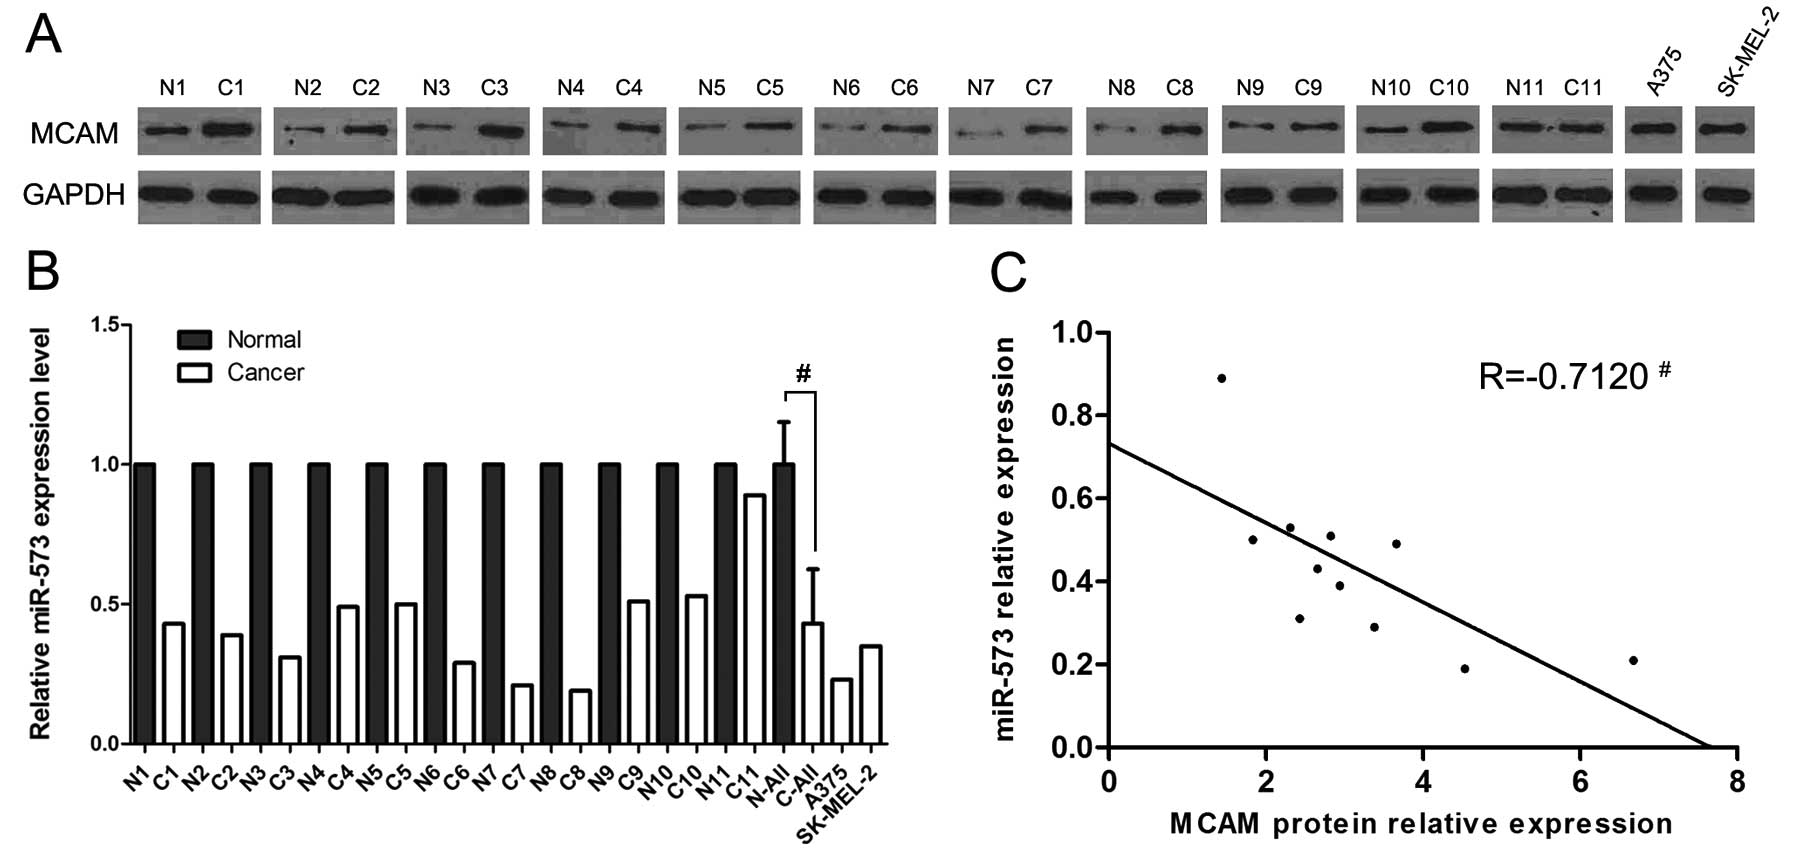
Expression levels of miR-573 are lower
and are inversely correlated with MCAM expression in MCAM
tissues
Real-time PCR methods were employed to compare the
levels of miR-573 which were predicted to be potential direct
regulators of MCAM by the TargetScan human database (release 6.2;
http://www.targetscan.org) between 11 pairs of
normal and matched human melanoma tissues. The levels of miR-573 in
melanoma tissues and cell lines were lower than those in normal
tissues (Fig. 1B). We also found
that the MCAM protein expression levels were higher in melanoma
tissues and cell lines compared to normal tissues (Fig. 1A).
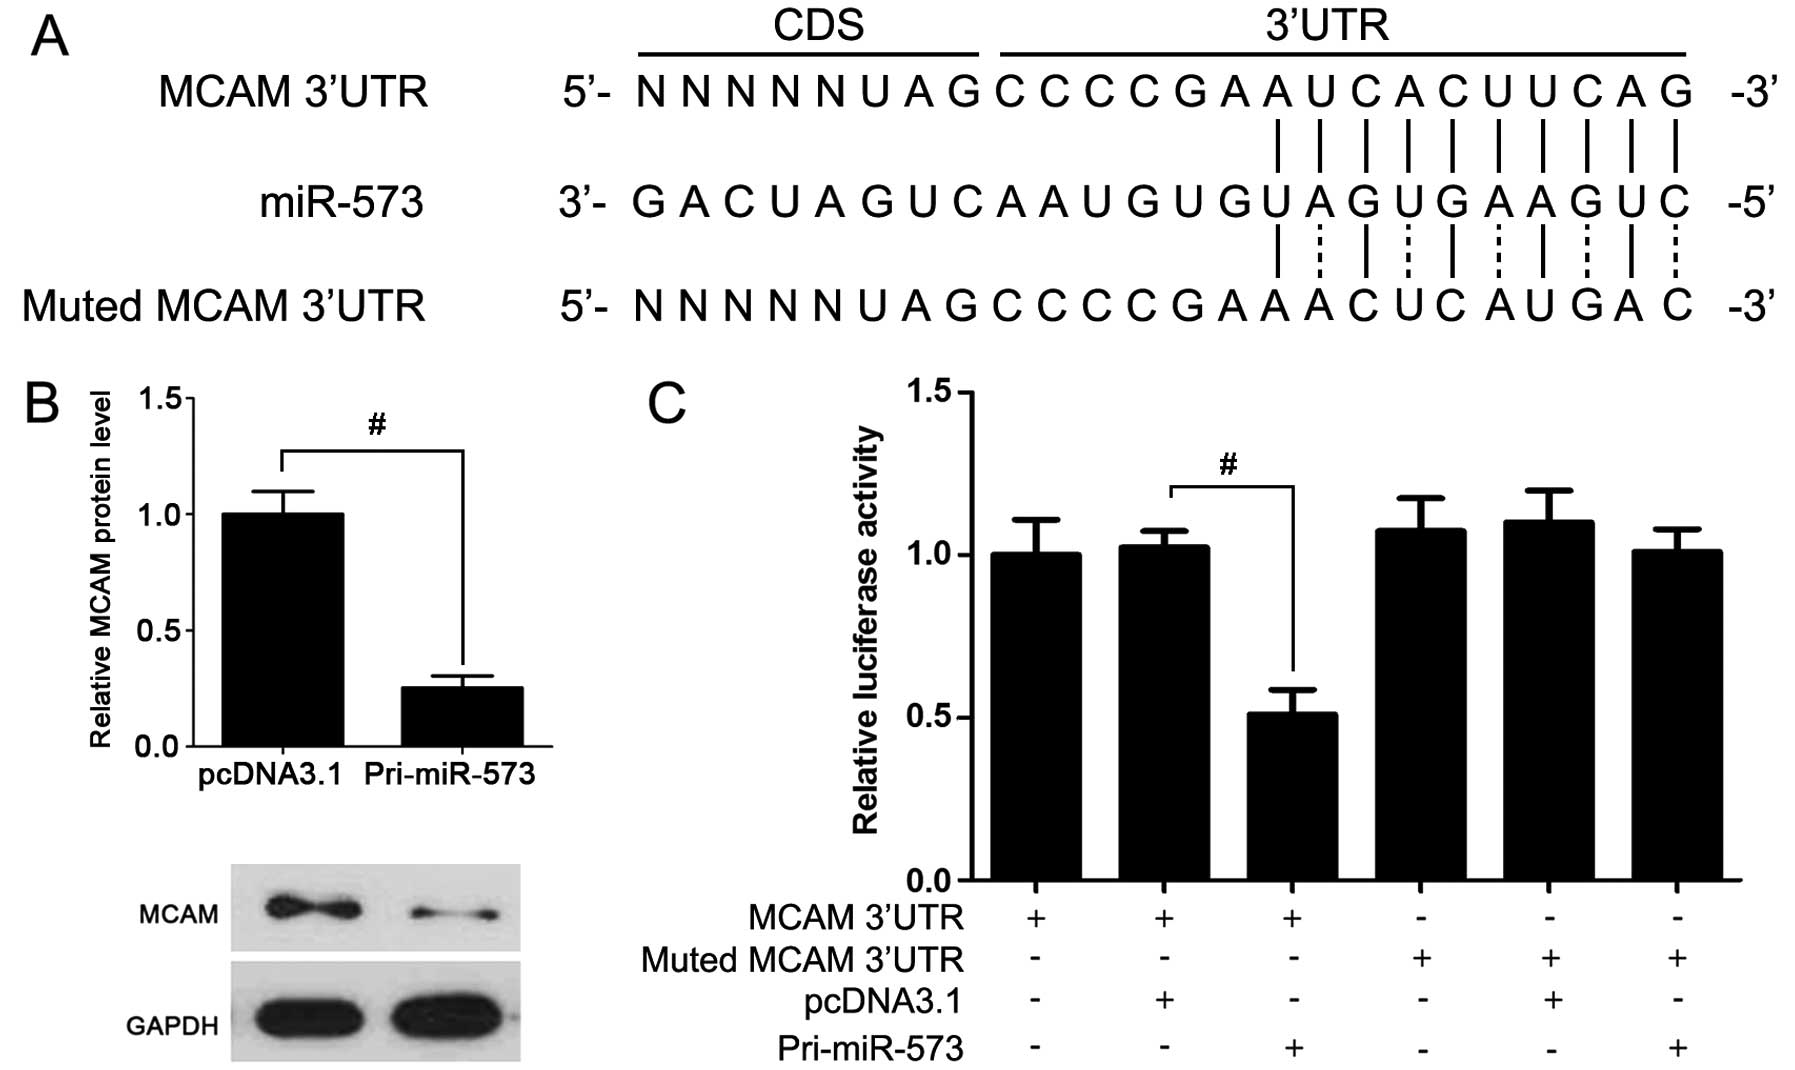
miR-573 directly regulates the expression
of MCAM
To further investigate which miRNA influenced MCAM
expression, miR-573 was overexpressed in A375 cells. Compared to
the control group, MCAM expression in miR-573 overexpressed cells
was lower (Fig. 2B). Furthermore,
luciferase reporter assay showed that the transfection of miR-573
expression vector significantly suppressed the luciferase intensity
with miR-573 binding sites (Fig.
2C). These data support the hypothesis that miR-573 is a direct
regulator of MCAM.
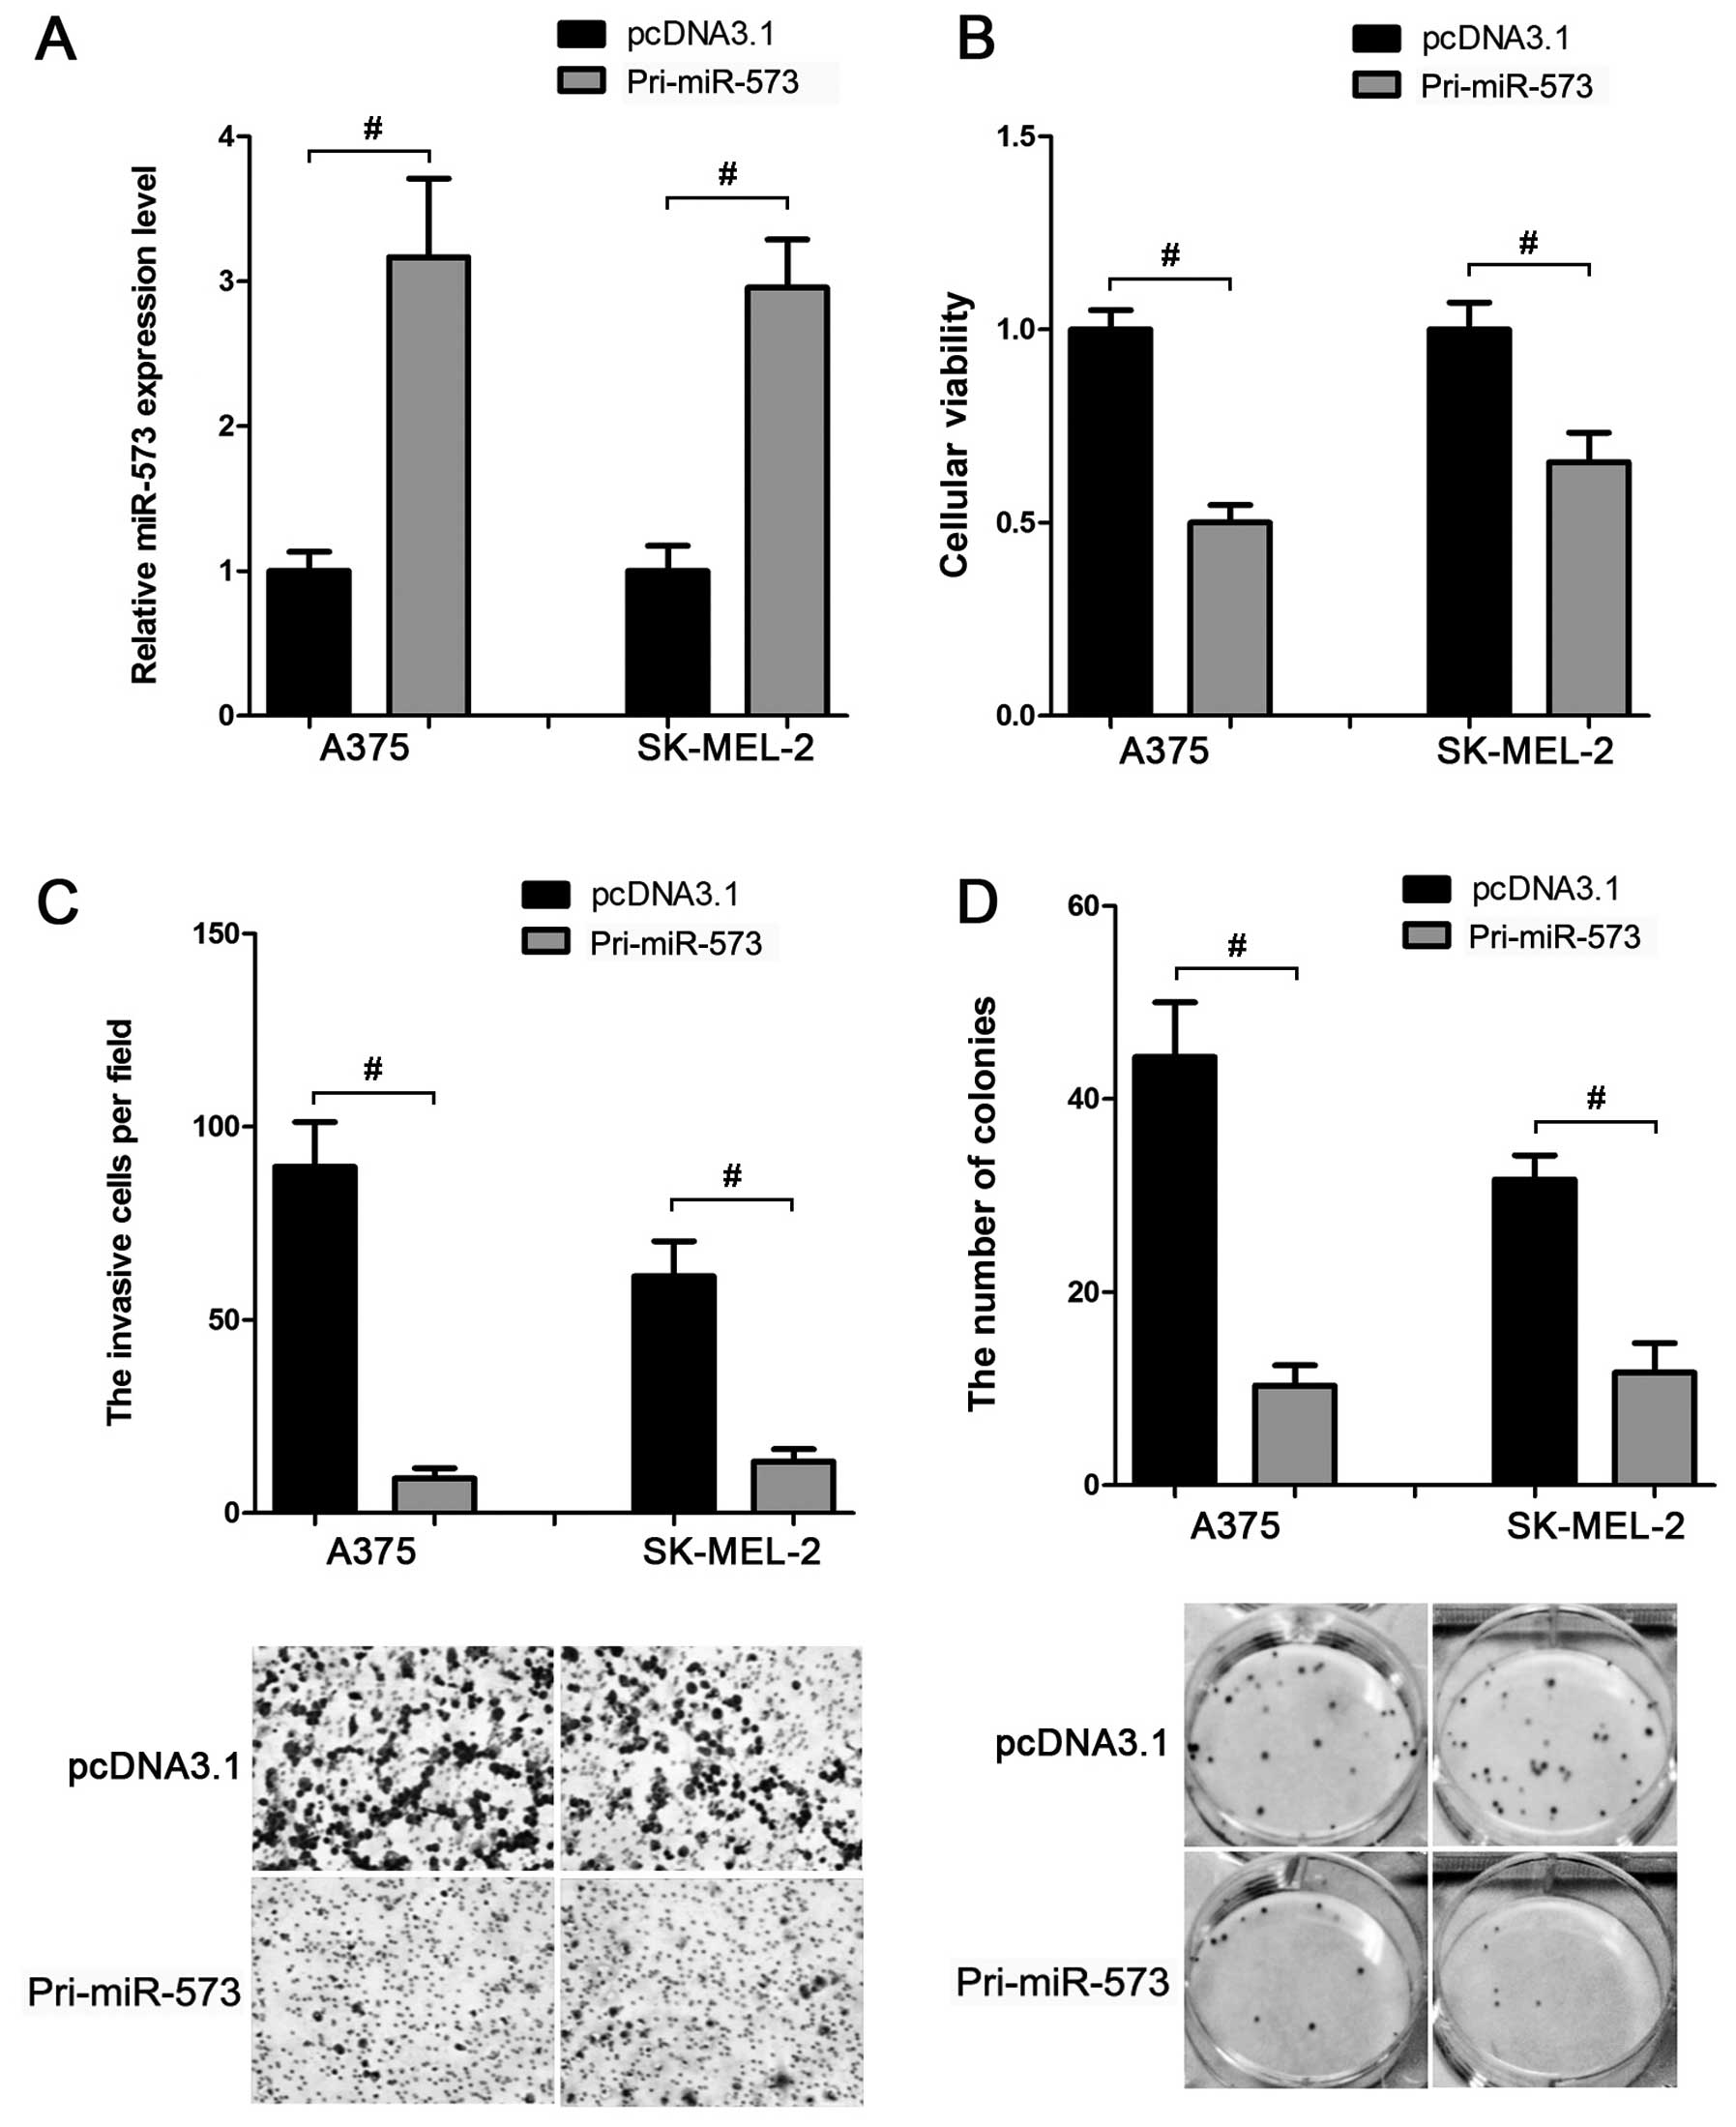
miR-573 inhibits the proliferation and
invasion of melanoma cells
Based on the above data, we inferred that miR-573
was downregulated in melanoma cells. This led us to evaluate
whether miR-573 exhibited a tumor-suppressive function in melanoma
development. MTT assay showed that compared to the control group,
transfection of miR-573 expression vector (Fig. 3A) suppressed the cellular viability
by ~40–50% in A375 and SK-MEL-2 cells (Fig. 3B). In addition, the invasion
(Fig. 3C) and colony formation
(Fig. 3D) activities of these two
cell lines were also inhibited when miR-573 was overexpressed.
Thus, miR-573 may play a tumor-suppressive role in melanoma
cells.
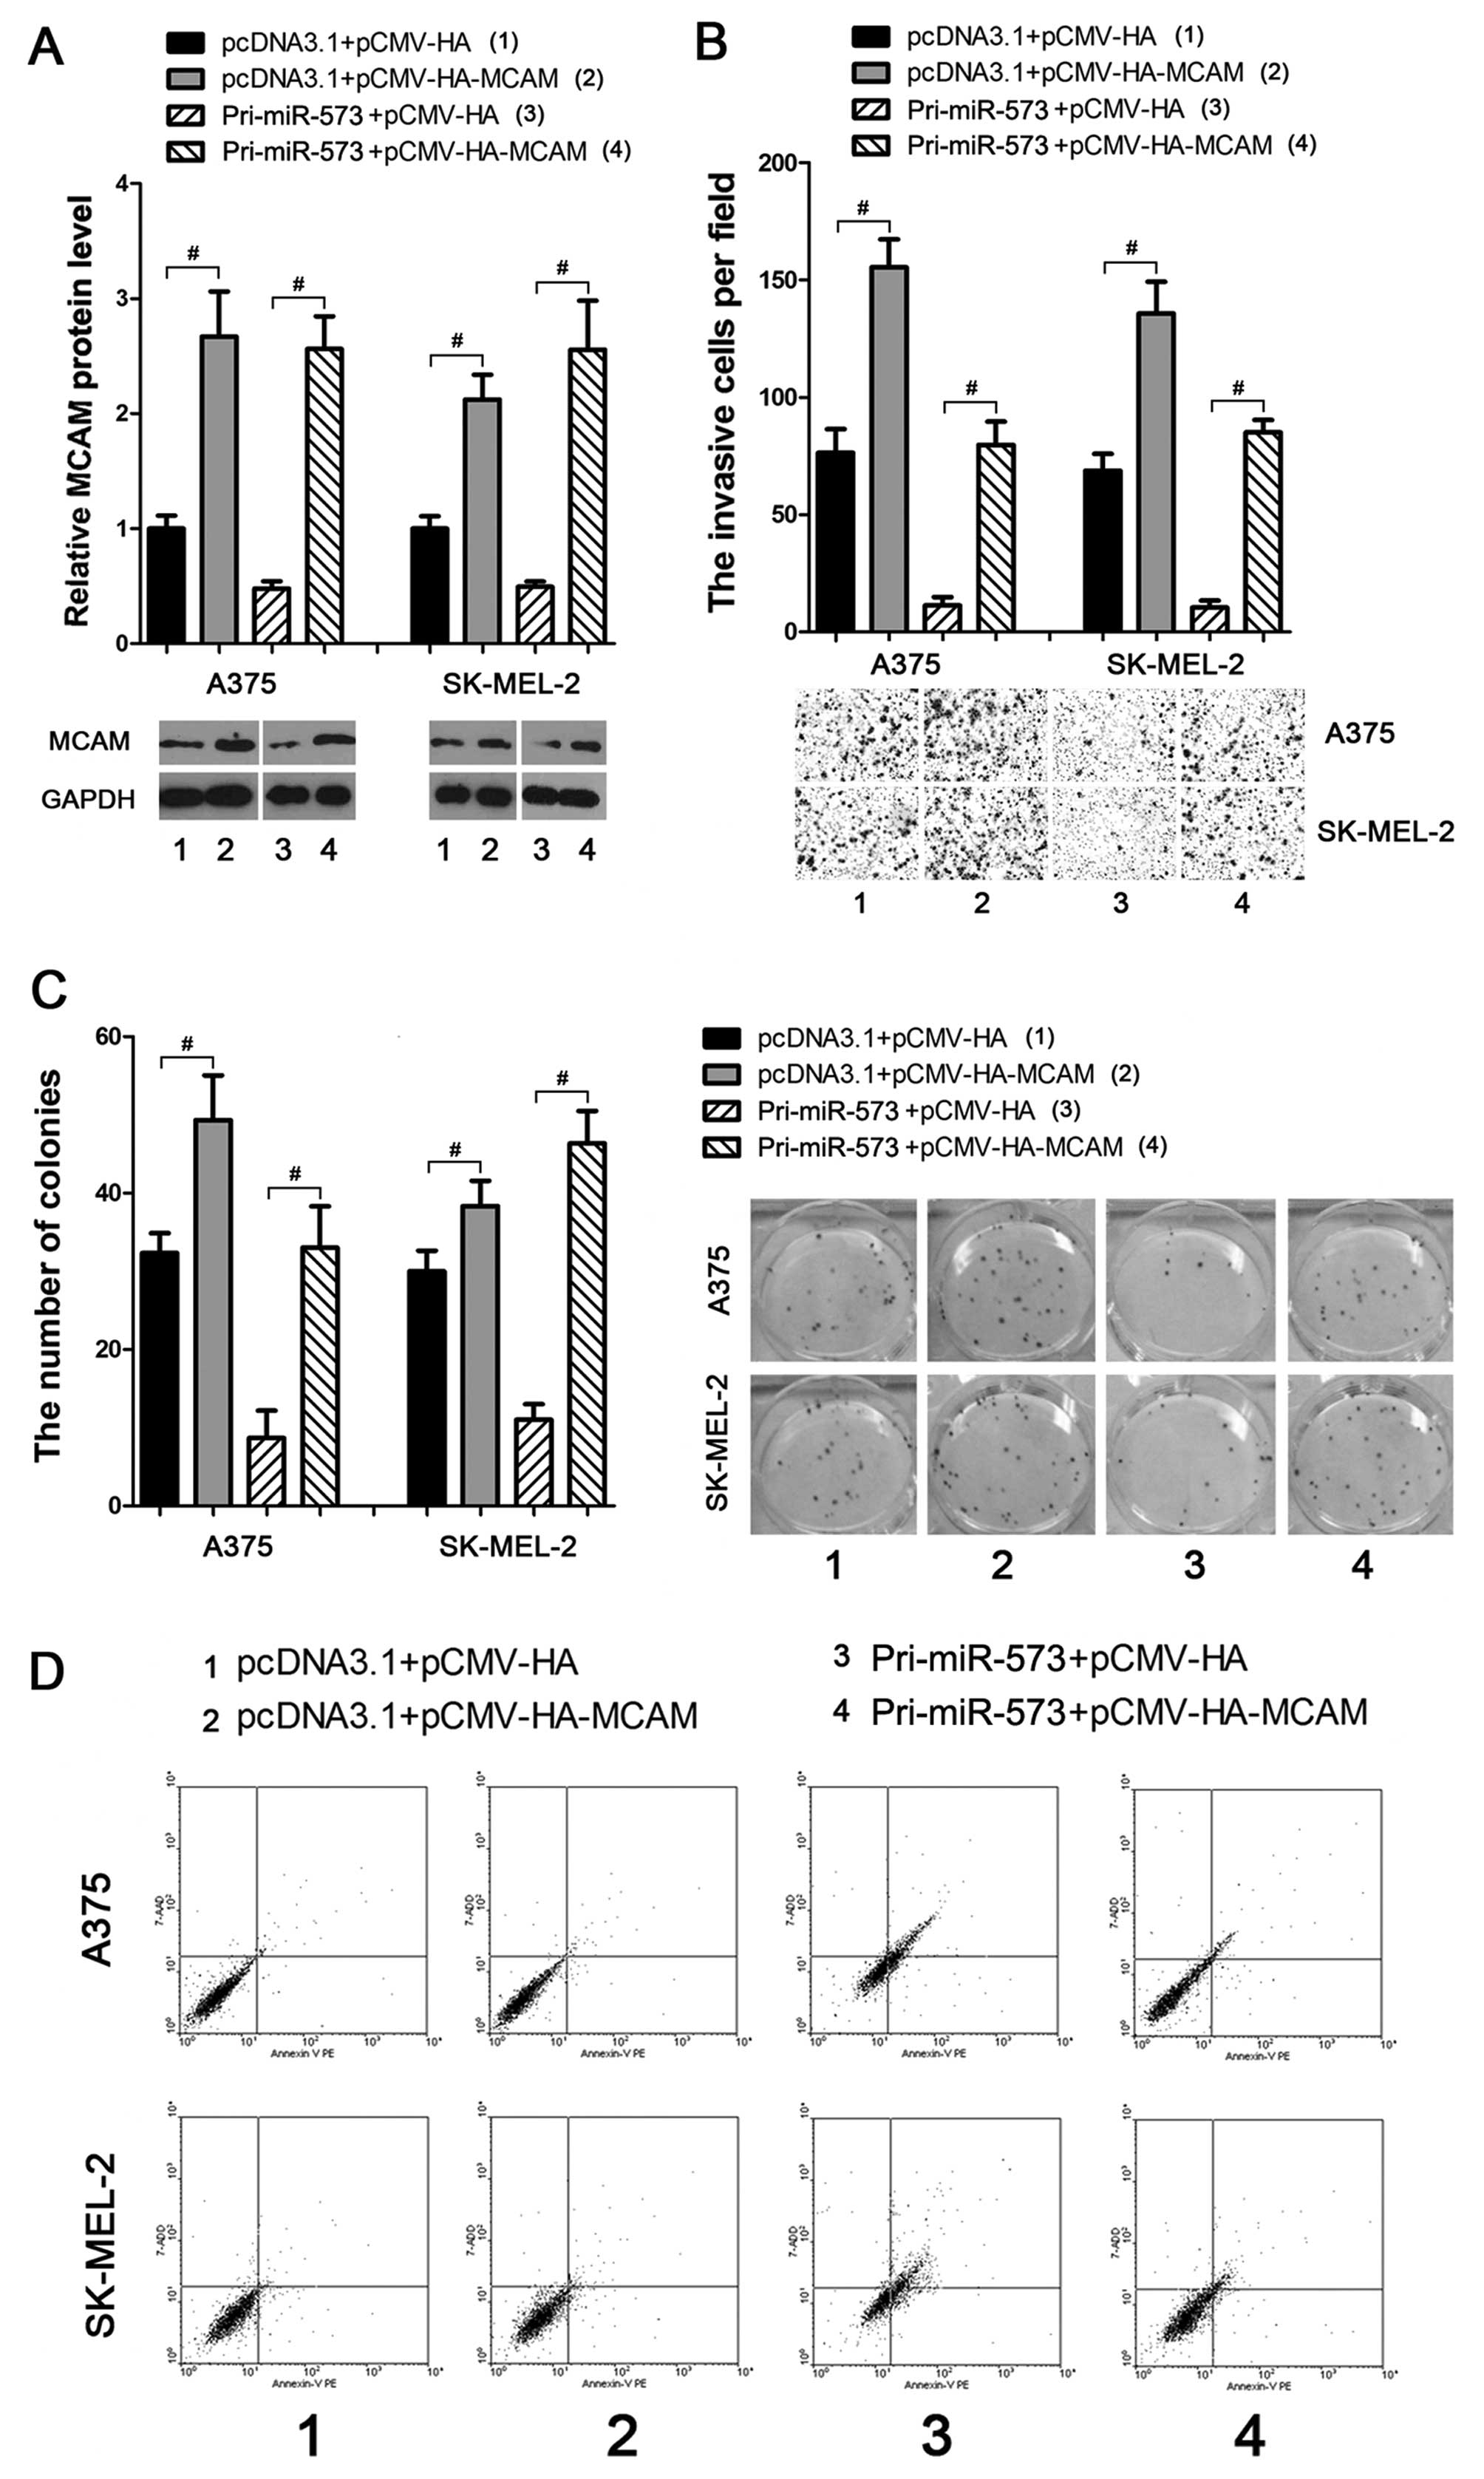
Overexpression of MCAM prevents the
negative effects of miR-573 on melanoma cells
To investigate whether miR-573 suppressed melanoma
progression through directly and negatively regulating MCAM, an
MCAM ectopic expression vector was introduced (Fig. 4A) to weaken or eliminate the
negative effects of miR-573 on melanoma cells. As a result,
subsequent transfection of MCAM ectopic expression vector into the
miR-573 treated A375 and SK-MEL-2 cells led to enhancement of the
cellular invasion (Fig. 4B) and
colony formation (Fig. 4C)
activities. Moreover, using the Annexin V-PE based apoptosis
analysis, miR-573 enhanced apoptosis of melanoma cells, which could
also be eliminated by subsequent overexpression of MCAM (Fig. 4D). These data provide strong
evidence that miR-573 exhibits tumor-suppressive activities through
negatively regulating MCAM expression in melanoma cells.
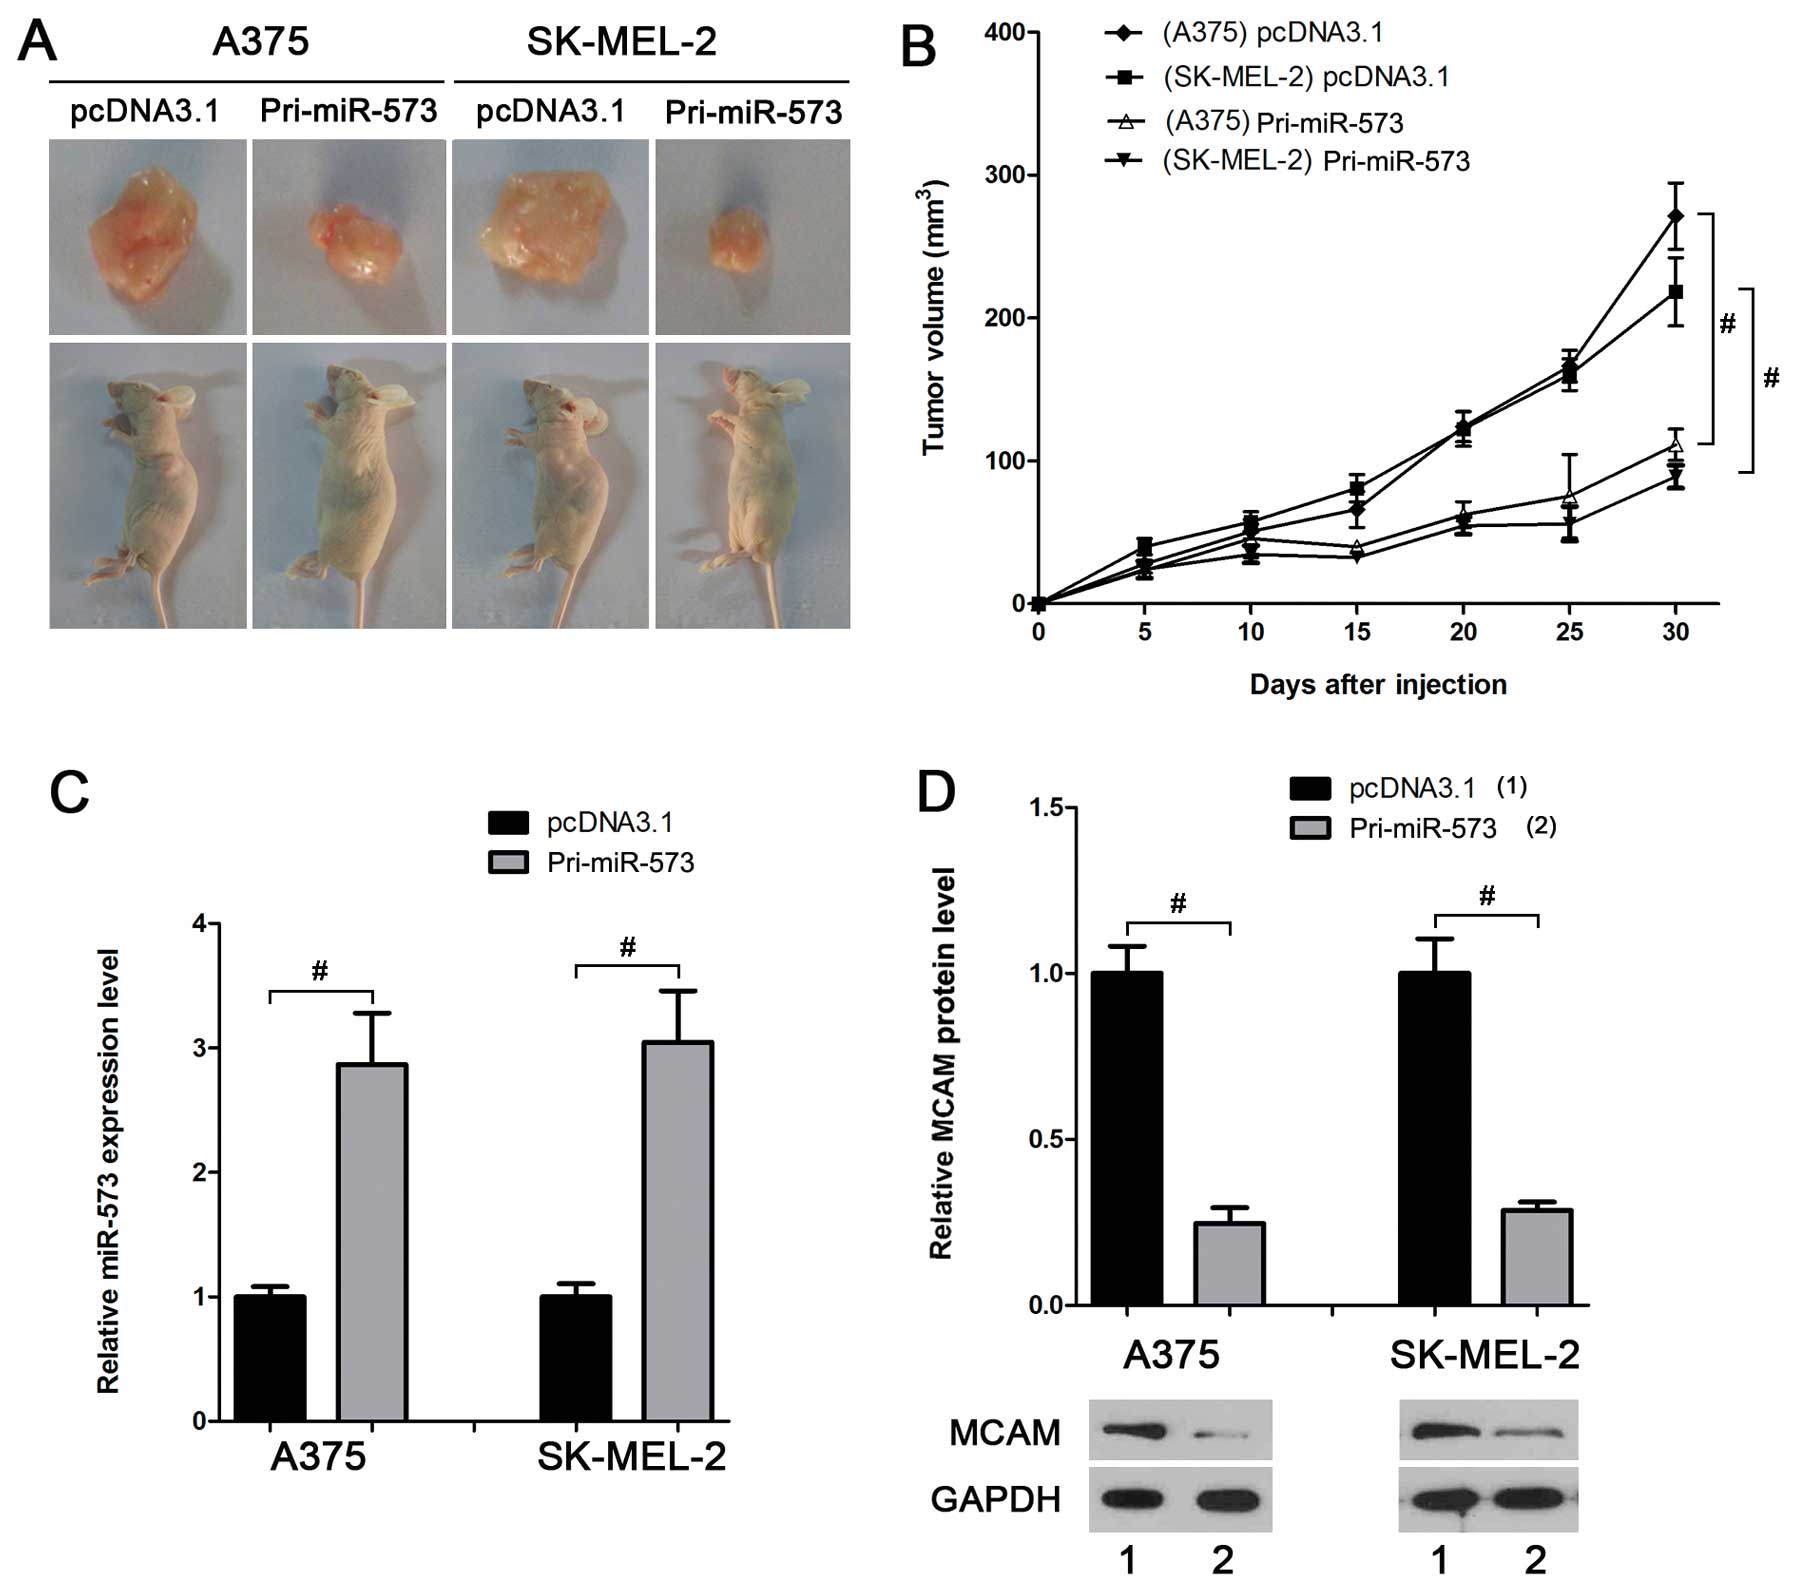
miR-573 inhibits melanoma growth in
vivo
The melanoma cell lines that stably express miR-573,
A375-miR-573 and SK-MEL-2-miR-573, were established to further
investigate the effect of miR-573 on melanoma cells in vivo.
The volume of allogeneic tumor in mice injected with cells
overexpressing miR-573 was smaller than that in the control groups
(Fig. 5A and B). Real-time PCR and
western blot analyses suggested a higher miR-573 level (Fig. 5C) and a lower MCAM protein level
(Fig. 5D) in the tumors derived
from A375-miR-573 or SK-MEL-2-miR-573, further suggesting that
miR-573 suppresses melanoma development in vivo by
inhibiting MCAM.
Discussion
Malignant melanoma remains the most aggressive form
of skin cancer. The data obtained from the World Health
Organization (WHO) showed that the number of melanoma cases
worldwide is increasing faster than any other type of cancer
(11). Extensive efforts focusing
on miRNAs have been made to elucidate the molecular mechanisms
underlying the malignant behavior of transformed melanocytes
(12–15). To date, miRNAs have been developed
as potential therapeutic targets. For example, miR-221/-222 cluster
is a promising target in more advanced melanomas. miRNAs of the
let-7 family, particularly let-7a, may also be of interest in early
melanoma stages. Moreover, miR-21, miR-205 and miR-34a are also
reported to regulate melanoma cell progression (16–18).
In the present study, we first compared the
expression of miR-573 that was algorithmically predicted to be a
potential upstream regulator of MCAM. The results showed that
miR-573 in melanoma tissues was lower than that in normal tissues.
miR-573 also exhibited low expression level in the two typical
melanoma cell lines, A375 and SK-MEL-2.
MCAM, a cell-surface glycoprotein that mediates
heterotypic and homeotypic cell-cell adhesion, exhibits abnormal
expression in a variety of tumors (5,19,20).
For example, overexpressed MCAM in melanoma cells significantly
promotes the growth and metastasis of tumors in nude mice (21). Therefore, we further examined the
miRNAs that may directly regulate MCAM expression. The results
showed that the MCAM mRNA and protein levels were higher in
melanoma tissues and cell lines, which were clearly regulated by
the miRNA miR-573. The growth and invasion abilities of melanoma
cells were significantly reduced by miR-573. In addition,
overexpression of MCAM can inhibit the effect of miR-573 on
cellular malignant phenotypes. The in vivo results also
demonstrated that the volume of allogeneic tumors was significantly
reduced when miR-573 was overexpressed in the melanoma cells.
To date, the diagnosis for melanoma is poor and
efficient therapeutic methods are lacking. The results obtained
from the present study may extend our knowledge of melanoma
progression and facilitate the establishment of miRNA-based
therapies.
References
|
1
|
Ferlay J, Autier P, Boniol M, Heanue M,
Colombet M and Boyle P: Estimates of the cancer incidence and
mortality in Europe in 2006. Ann Oncol. 18:581–592. 2007.
View Article : Google Scholar : PubMed/NCBI
|
|
2
|
Lehmann JM, Riethmuller G and Johnson JP:
MUC18, a marker of tumor progression in human melanoma, shows
sequence similarity to the neural cell adhesion molecules of the
immunoglobulin superfamily. Proc Natl Acad Sci USA. 86:9891–9895.
1989. View Article : Google Scholar
|
|
3
|
Wu GJ, Peng Q, Fu P, et al: Ectopical
expression of human MUC18 increases metastasis of human prostate
cancer cells. Gene. 327:201–213. 2004. View Article : Google Scholar : PubMed/NCBI
|
|
4
|
Zabouo G, Imbert AM, Jacquemier J, et al:
CD146 expression is associated with a poor prognosis in human
breast tumors and with enhanced motility in breast cancer cell
lines. Breast Cancer Res. 11:R12009. View
Article : Google Scholar : PubMed/NCBI
|
|
5
|
Kristiansen G, Yu Y, Schlüns K, Sers C,
Dietel M and Petersen I: Expression of the cell adhesion molecule
CD146/MCAM in non-small cell lung cancer. Anal Cell Pathol.
25:77–81. 2003. View Article : Google Scholar : PubMed/NCBI
|
|
6
|
Bartel DP: MicroRNAs: target recognition
and regulatory functions. Cell. 136:215–233. 2009. View Article : Google Scholar : PubMed/NCBI
|
|
7
|
Filipowicz W, Bhattacharyya SN and
Sonenberg N: Mechanisms of post-transcriptional regulation by
microRNAs: are the answers in sight? Nat Rev Genet. 9:102–114.
2008. View
Article : Google Scholar : PubMed/NCBI
|
|
8
|
Kim VN, Han J and Siomi MC: Biogenesis of
small RNAs in animals. Nat Rev Mol Cell Biol. 10:126–139. 2009.
View Article : Google Scholar : PubMed/NCBI
|
|
9
|
Carthew RW and Sontheimer EJ: Origins and
mechanisms of miRNAs and siRNAs. Cell. 136:642–655. 2009.
View Article : Google Scholar : PubMed/NCBI
|
|
10
|
Glud M and Gniadecki R: MicroRNAs in the
pathogenesis of malignant melanoma. J Eur Acad Dermatol Venereol.
27:142–150. 2013. View Article : Google Scholar : PubMed/NCBI
|
|
11
|
Parkin DM, Bray F, Ferlay J and Pisani P:
Global cancer statistics, 2002. CA Cancer J Clin. 55:74–108. 2005.
View Article : Google Scholar
|
|
12
|
Mueller DW and Bosserhoff AK: Role of
miRNAs in the progression of malignant melanoma. Br J Cancer.
101:551–556. 2009. View Article : Google Scholar : PubMed/NCBI
|
|
13
|
Mueller DW, Rehli M and Bosserhoff AK:
miRNA expression profiling in melanocytes and melanoma cell lines
reveals miRNAs associated with formation and progression of
malignant melanoma. J Invest Dermatol. 129:1740–1751. 2009.
View Article : Google Scholar : PubMed/NCBI
|
|
14
|
Noguchi S, Mori T, Otsuka Y, et al:
Anti-oncogenic microRNA-203 induces senescence by targeting E2F3
protein in human melanoma cells. J Biol Chem. 287:11769–11777.
2012. View Article : Google Scholar : PubMed/NCBI
|
|
15
|
Essa S, Reichrath S, Mahlknecht U,
Montenarh M, Vogt T and Reichrath J: Signature of VDR miRNAs and
epigenetic modulation of vitamin D signaling in melanoma cell
lines. Anticancer Res. 32:383–389. 2012.PubMed/NCBI
|
|
16
|
Yang CH, Yue J, Pfeffer SR, Handorf CR and
Pfeffer LM: MicroRNA miR-21 regulates the metastatic behavior of
B16 melanoma cells. J Biol Chem. 286:39172–39178. 2011. View Article : Google Scholar : PubMed/NCBI
|
|
17
|
Hanna JA, Hahn L, Agarwal S and Rimm DL:
In situ measurement of miR-205 in malignant melanoma tissue
supports its role as a tumor suppressor microRNA. Lab Invest.
92:1390–1397. 2012. View Article : Google Scholar : PubMed/NCBI
|
|
18
|
Cozzolino AM, Pedace L, Castori M, et al:
Analysis of the miR-34a locus in 62 patients with familial
cutaneous melanoma negative for CDKN2A/CDK4 screening. Fam Cancer.
11:201–208. 2012. View Article : Google Scholar : PubMed/NCBI
|
|
19
|
Wu Z, Wu Z, Li J, Yang X, et al: MCAM is a
novel metastasis marker and regulates spreading, apoptosis and
invasion of ovarian cancer cells. Tumour Biol. 33:1619–1628. 2012.
View Article : Google Scholar : PubMed/NCBI
|
|
20
|
Liu JW, Nagpal JK, Jeronimo C, et al:
Hypermethylation of MCAM gene is associated with advanced tumor
stage in prostate cancer. Prostate. 68:418–426. 2008. View Article : Google Scholar : PubMed/NCBI
|
|
21
|
Wu GJ, Fu P, Wang SW and Wu MW: Enforced
expression of MCAM/MUC18 increases in vitro motility and
invasiveness and in vivo metastasis of two mouse melanoma K1735
sublines in a syngeneic mouse model. Mol Cancer Res. 6:1666–1677.
2008. View Article : Google Scholar : PubMed/NCBI
|