Introduction
Prostate cancer (PC) is the most commonly diagnosed
cancer, and a second leading cause of cancer-related deaths in men
in the Western world. Although PC typically undergoes slow growth,
the tumor rapidly develops into aggressively growing and
metastasizing cancer in a subset of men. Curative therapy for
metastasized PC is not yet available (1). Although serum prostate specific
antigen (PSA) test has improved the detection of PC considerably,
it does not predict whether the tumor will remain indolent or will
progress rapidly to a metastasizing cancer (2).
The calcitonin (CT) family of neuroendocrine
peptides has gained attention as potential targets for therapeutic
intervention in several cancer types (3–9). The
members of this family include CT, adrenomedullin and CT
gene-related peptide. CT receptor (CTR), a class B G
protein-coupled receptor (GPCR) (10), maintains calcium homeostasis in the
bone and the kidneys (11). It has
also been implicated in early development, tissue repair and
cancers (12,13). The gene expression of CT and CTR is
upregulated in advanced PC (9),
suggesting a role for CT-CTR autocrine axis in tumor progression,
invasion, angiogenesis and metastasis (8,14,15).
Consistent with this possibility, overexpression of CT and/or CTR
in prostate cancer cells accelerates tumor growth and formation of
distant metastases in athymic nude mice (8). In contrast, the knock-down of the
expression of either CT or CTR reduces growth of aggressive
prostate cancer cells and abolishes their ability to form distant
metastases (14). However, no
attempt has been made to link CT-CTR axis with clinicopathological
parameters such as disease progression, metastasis or poor patient
prognosis.
Materials and methods
Patient cohort description
Tissue samples from 61 PC patients in the Department
of Urology of the VU University Medical Center were obtained with
the approval of the VU University Institutional Review Board.
Median age of the patients was 64 years (range, 53–84) and median
follow-up time was 67 months (range, 11–178). None of the patients
received hormonal or radiation therapy prior to surgery. Tissue
sections of each specimen were stained with hematoxylin and eosin
and examined by a pathologist for histopathological diagnosis and
tumor grading. Subject population was increased with the addition
of 40 specimens of benign prostatic hyperplasia and 95 cores from
40 cases of advanced prostate cancer (TMA PR955; US Biomax Inc.,
Rockville, MD, USA). The clinicopathological data of each specimen
including TNM stages, Gleason scores, preoperative serum PSA and
survival data were also obtained. In all, 141 cases were examined.
The cohorts were classified as follows: i) non-cancer, DRE
negative, prostate biopsy negative; ii) cancer, organ-confined:
Gleason Score: 3+3, pT2a (absence of extracapsular extension or
seminal vesicle invasion); iii) cancer, non-organ confined: Gleason
Score 4+4 or higher, pT3 (presence of extracapsular extension
and/or seminal vesicle invasion); and iv) cancer, metastatic:
confirmed distant metastases including hormone refractoriness.
Immunohistochemistry (IHC)
Paraffin-embedded specimens were deparaffinized,
hydrated, subjected to antigen retrieval by heating the slides for
5 min in 5 mM sodium citrate. The sections were then stained for
CT/CTR as previously described (14). Incubations with primary antibodies
were followed by horseradish peroxidase phosphatase-conjugated
secondary antibodies. The slides were then counterstained with
hematoxylin.
Immunofluorescence
Antibodies against CT and the peptide (50–65 aa) of
human CTR have been previously validated for the IHC of prostate
cancer specimens (7). Tissue
sections (5 μm) were deparaffinized, hydrated and CT/CTR
immunofluorescence was performed as previously described (14).
Controls
Tissue sections were incubated either in the
presence of no primary antibody, no secondary antibody, or primary
antibody blocked with the peptide.
Image analysis and interpretation
Six images per section were acquired. Immunostaining
was scored by two individuals independently using established
methods (16) and the mean reading
was taken. The staining intensity was assigned an arbitrary value,
on a scale of 0–3 as follows: (−), 0; (+/−), 0.5; (+), 1; (++) 2;
and (+++), 3.
An IHC index for each sample was calculated by
multiplying staining intensity with the percentage of positive
cells. The results were graded from 0 (negative) to 300 (all cells
display strong staining intensity). Reproducibility of the analysis
was verified by rescoring of randomly chosen slides. Duplicate
readings gave similar results.
The samples were broadly classified as: i) negative
(IHC index = 0); ii) low (IHC index <5); iii) moderate (IHC
index = 5–50); iv) high (IHC index = 50–150); and v) very high (IHC
index >150).
Statistical analysis
Statistical calculations were performed using Prism
5 computer program (GraphPad Software, San Diego, CA, USA). Results
are generally expressed as mean IHC index ± standard error of the
mean (SEM) unless otherwise stated. P<0.05 was considered to
indicate a statistically significant result. One-way ANOVA and
t-tests were used to compare CT/CTR IHC index across the clinical
groups (cancer vs. non-cancer; organ-confined vs. metastatic;
Gleason score 6 vs. >8). Receiver operating characteristics
(ROC) curves were used to determine diagnostic utility of CT/CTR
expression. Area under the curve (AUC) was calculated by numerical
integration of each ROC curve. Cut-off points are defined as the
values at which sensitivity and specificity are optimized. A
two-sided P-value of <0.05 is considered to indicate a
statistically significant result. Kaplan-Meier analysis was
performed to compare the prognostic ability of CT/CTR expression
with that of other clinicopathological parameters.
Results
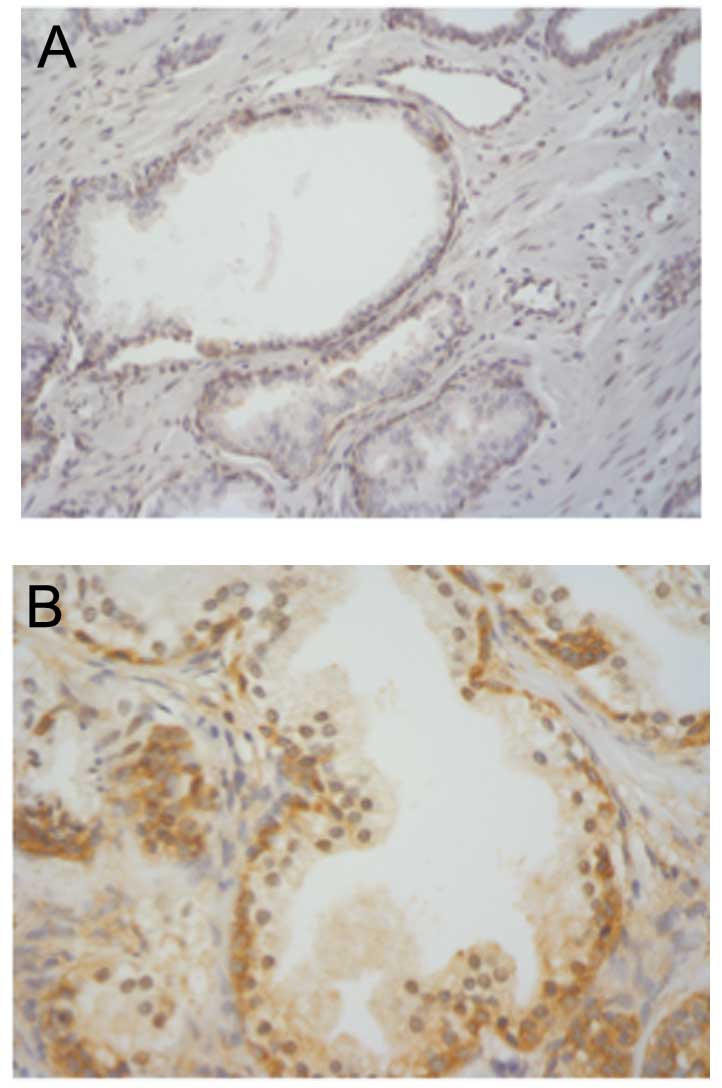
CT/CTR in the prostate
CT staining in benign acinii was predominantly
localized to basal epithelium and was absent in secretory
epithelium (Fig. 1). CTR expression
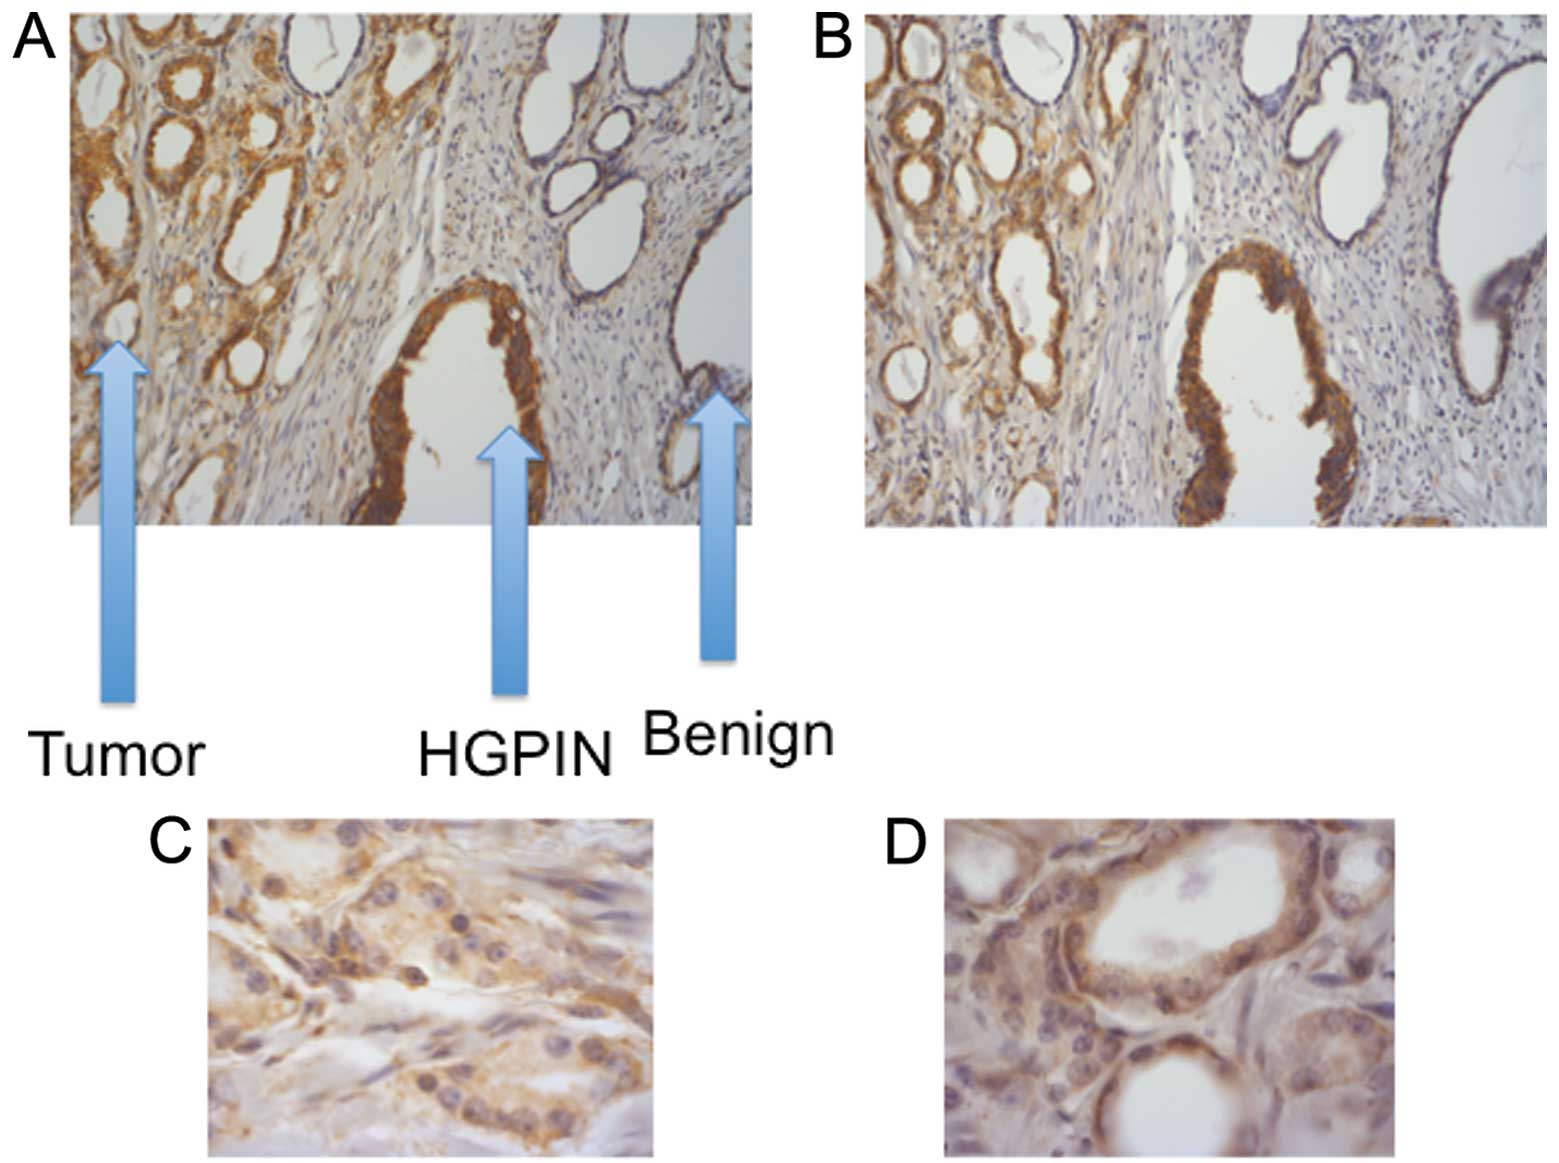
displayed a similar profile (data not shown). Comparatively, CT/CTR
immunostaining was absent/or weak in benign regions of the
prostate, but was stronger in HGPIN and malignant acinii (Fig. 2A and B). Higher magnification images
of a PC specimen suggest that basal epithelial cells displaying
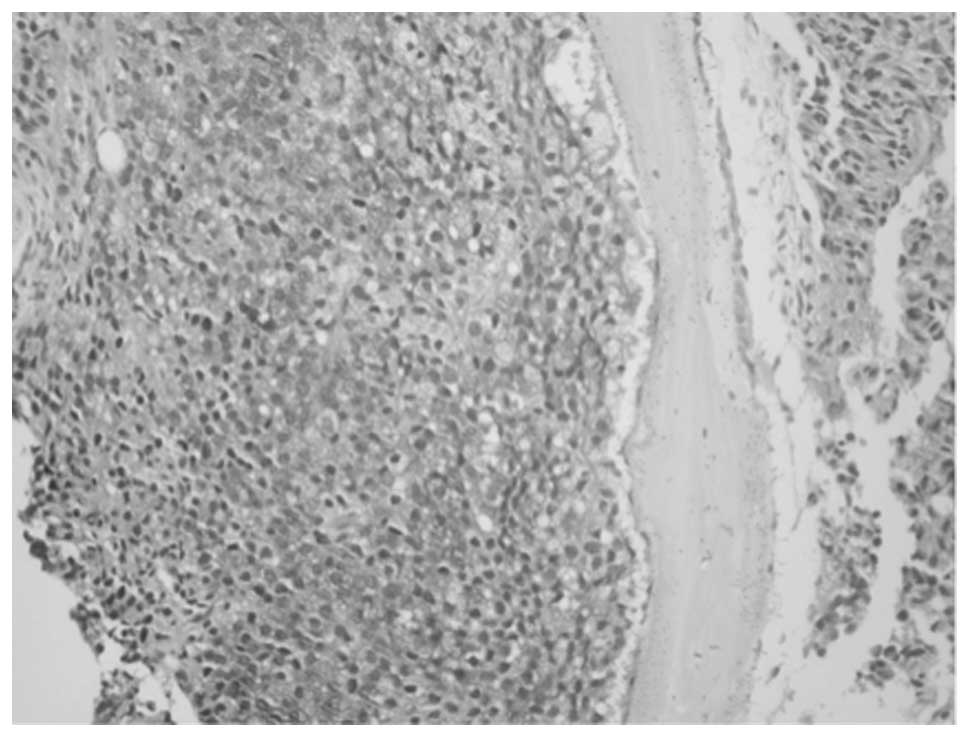
prominent nucleoli were strongly CT- or CTR-positive (Fig. 2C and D). Bone metastasis of PC
displayed intense cytoplasmic CT staining, suggesting tumor cells
may secrete CT after implanting in the bone (Fig. 3).
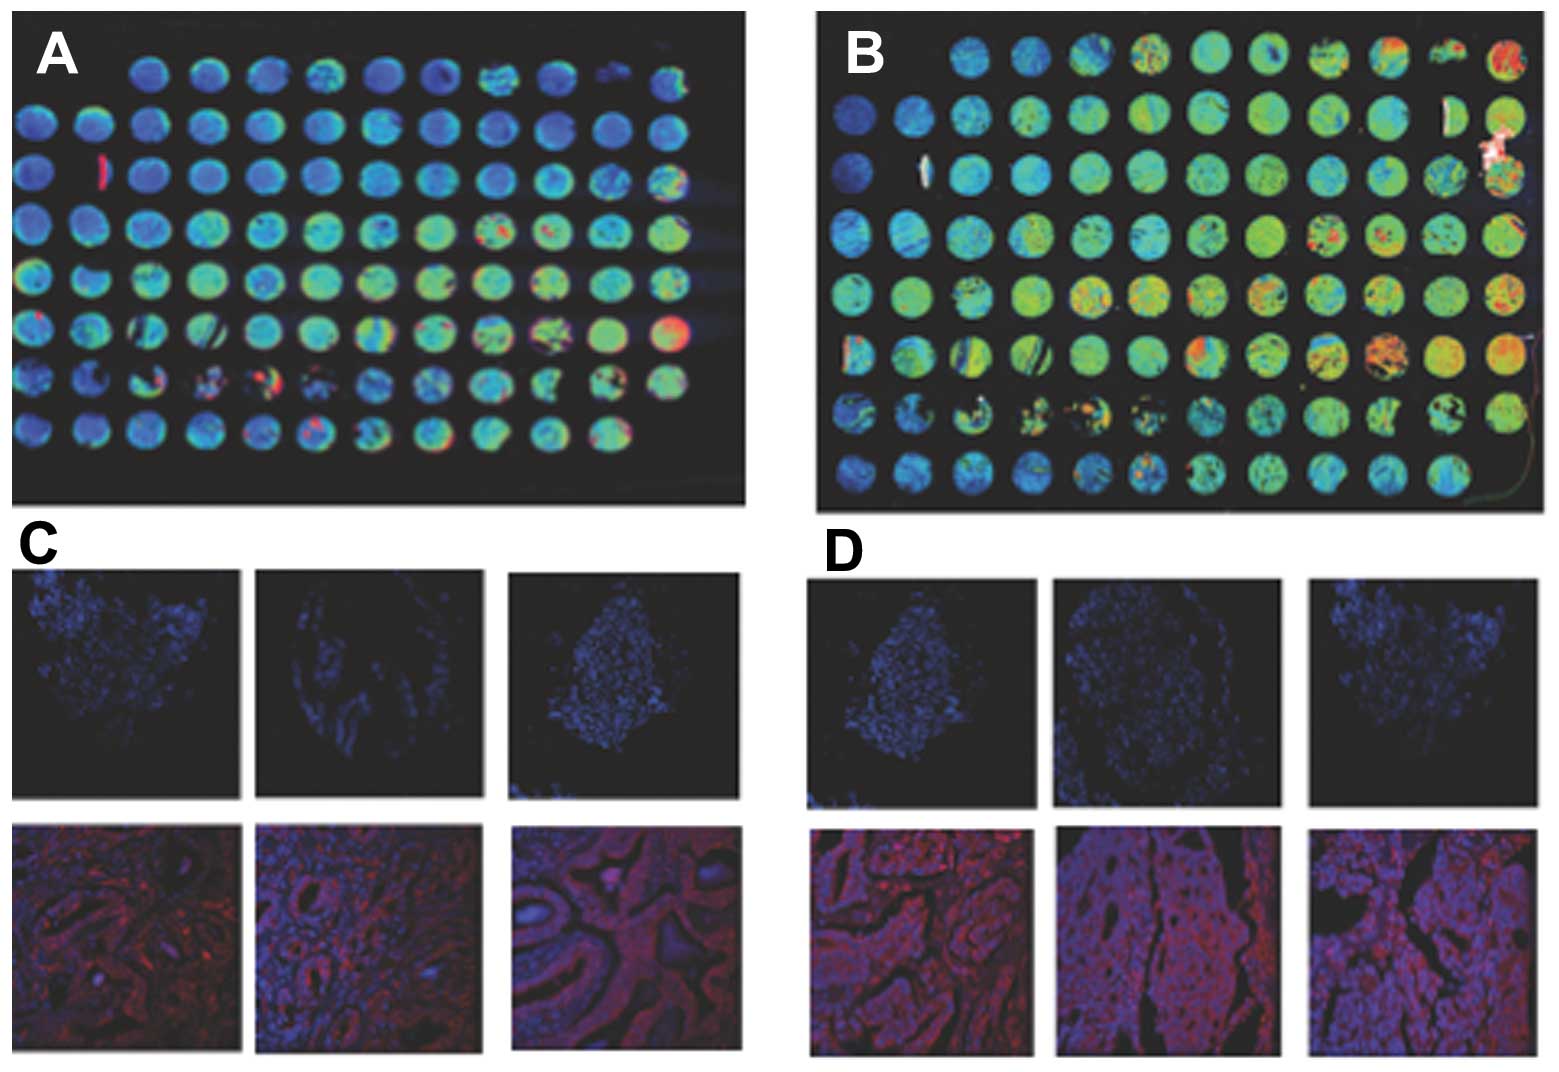
Paracrine CT-CTR axis converts to
autocrine in advanced PC
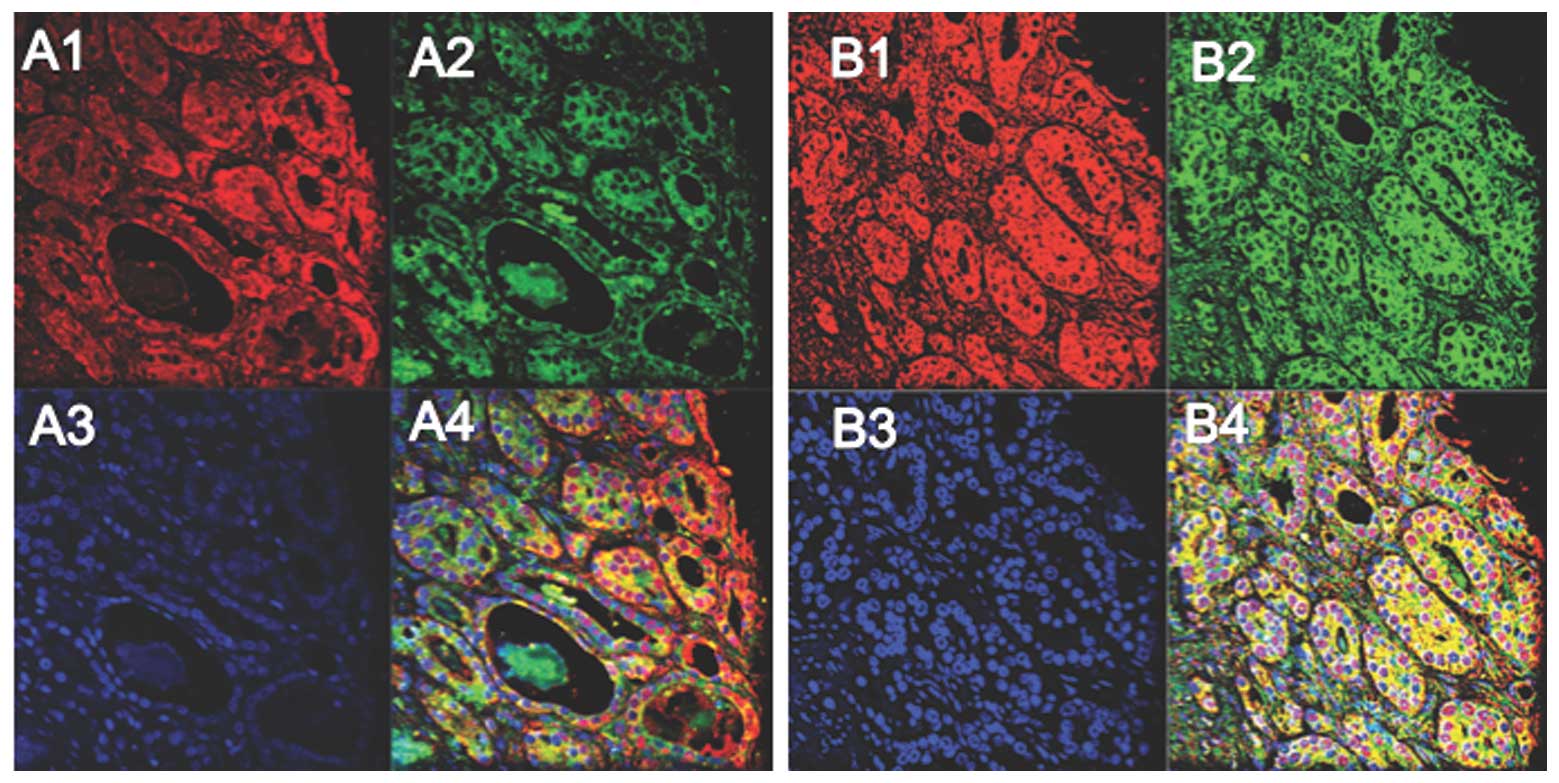
Since CT/CTR expression displayed a similar spatial
localization, we evaluated whether CT and CTR are co-expressed in
same cell populations. We performed double
immunofluorescence-stainings of prostate TMA sections (TI95; US
Biomax Inc.). A majority of cells in sections of PC of T stage 2 or
3 stained for either CT (red) or CTR (green) (Fig. 4A1–4). In contrast, a majority of
CT-positive cells co-expressed CTR in T stage 4 cases as
characterized by the yellow in the merged figure (Fig. 4B4 and C). These results, that CT-CTR
axis is predominantly paracrine in earlier stages of PC but
converts to autocrine in advanced stages, are consistent with our
earlier results that activation of CT-CTR autocrine loop enhances
the ability of PC cells to grow and metastasize (8,14,17).
CT/CTR expression is upregulated in
PC
Prostate specimens from pathology as well as TMA
showed considerable variability in CT/CTR staining (Fig. 5). Specifically, benign specimens
showed very weak stainings that increased to very strong in
metastatic PCs.
The generated data of CT/CTR staining in benign
prostates were pooled and compared with that from malignant
prostates. Among 40 benign prostate specimens, 34 displayed
negative staining for CT (85%) and 6 displayed low staining (15%).
Among 101 primary PC specimens: 3 were negative (<3%); 25 were
low (<25%); 28 were moderate (<28%); 18 were high (<18%);
and 36 were very high (<36%).
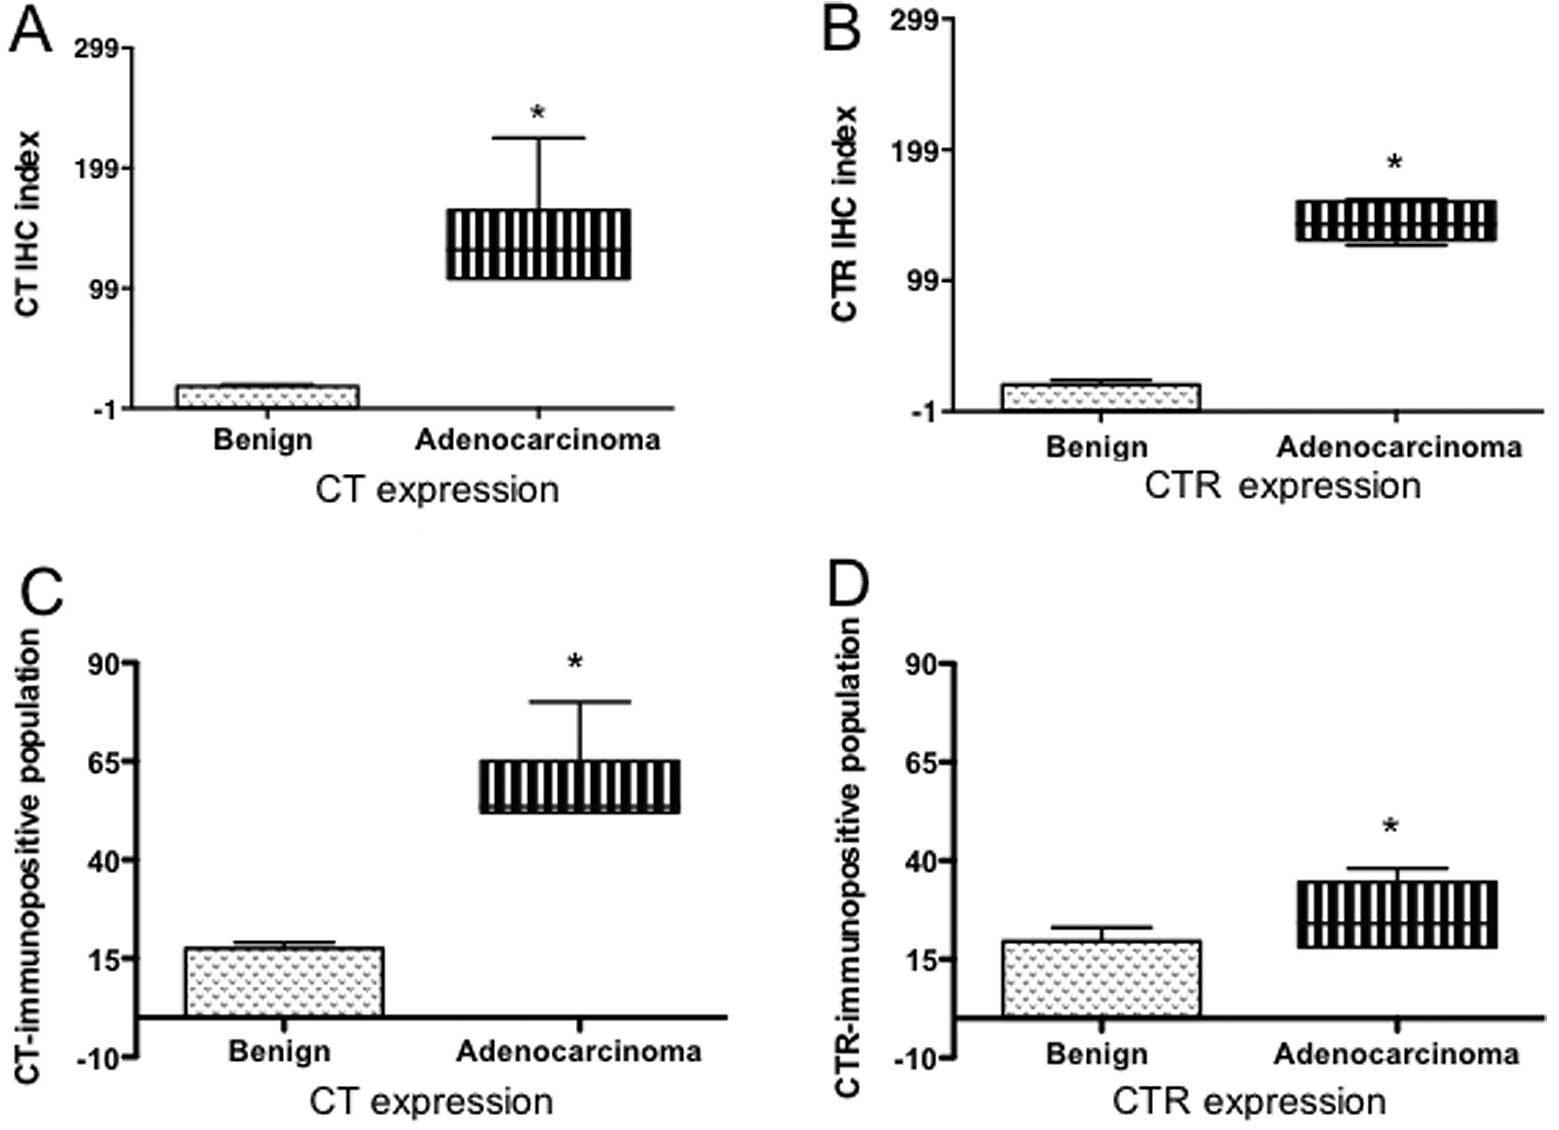
Significantly higher expression of CT and CTR in PC
specimens was evident when assessed either as IHC index or as
percent of immunopositive cells (Fig.
6A–D; P<0.0001 for benign vs. adenocarcinoma).
Interestingly, higher percentages of cells displayed CT expression
than CTR expression. However, the intensity of CTR staining seemed
stronger.
Is CT/CTR expression a prognostic marker
for metastatic PC?
We then stratified the data of PC specimens in two
groups: localized PC and metastatic PC. The comparison of these two
data sets show that metastatic PCs displayed significantly higher
CT/CTR expression than localized PCs when assessed either as IHC
index or as immunopositive cell populations (Fig. 6E–H). Stratification of the data
further into T stages indicated that CT/CTR IHC indices of
metastatic PCs in stages 2c and 3a were significantly higher than
those of localized PCs in same T stages, raising a possibility that
elevated CT/CTR expression in earlier T stages may be an indicator
of metastatic disease (Fig. 6I and
J).
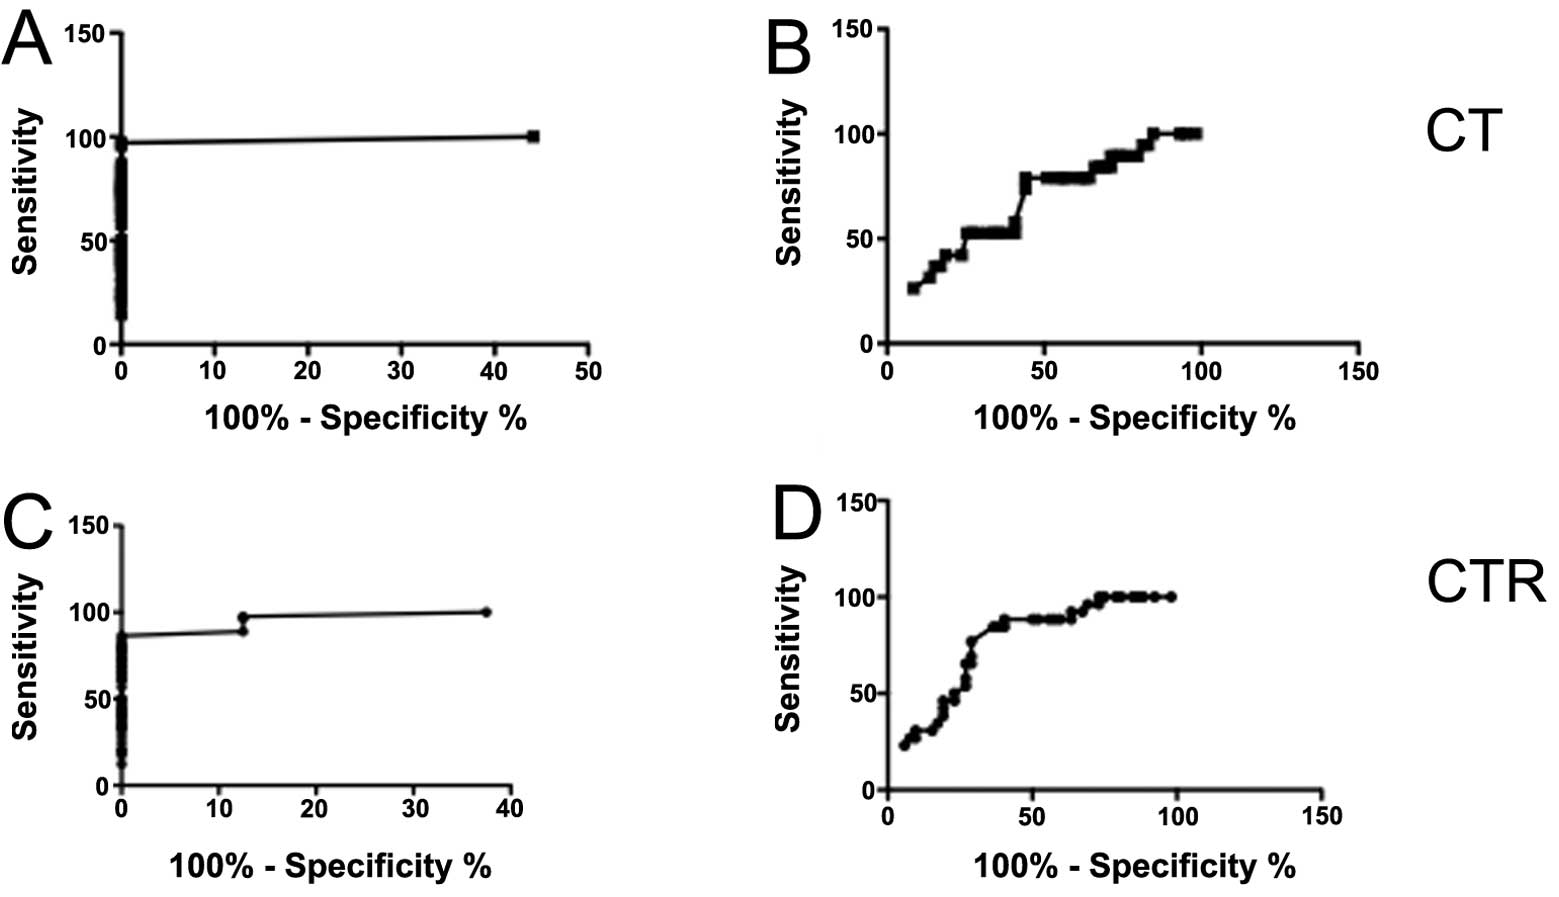
ROC analysis of CT/CTR IHC index as a
prognostic marker
We then analyzed the results by receiver operator
characteristic (ROC) curve in two ways. First, we analyzed CT IHC
index data from all PC vs. all benign samples. The curve yielded an
area under the curve (AUC) of 0.9936 (P<0.0001) (Fig. 7A). Choosing a cut-off of IHC index
of 2.15, a specificity of 100% yielded a sensitivity of 84%,
suggesting that CT/CTR IHC index >2.15 can reliably discriminate
cancer patients from non-cancer patients. Next, we compared the
data from localized cancer with that from metastatic cancer. The
ROC curve yielded the AUC of 0.6704 (P=0.0264) (Fig. 7B). With the cut-off of 9.5, a
specificity of 75% yielded the sensitivity of 53% for metastatic
disease indicating that the test can be reliably used to predict
clinical course of the disease. The corresponding analysis of CTR
expression data also showed similar predictability (Fig. 7C and D). Both, CT and CTR IHC
indices were better predictors for the cancer when compared with
preoperative serum PSA levels; and for metastatic disease when
compared with the Gleason score (data not shown).
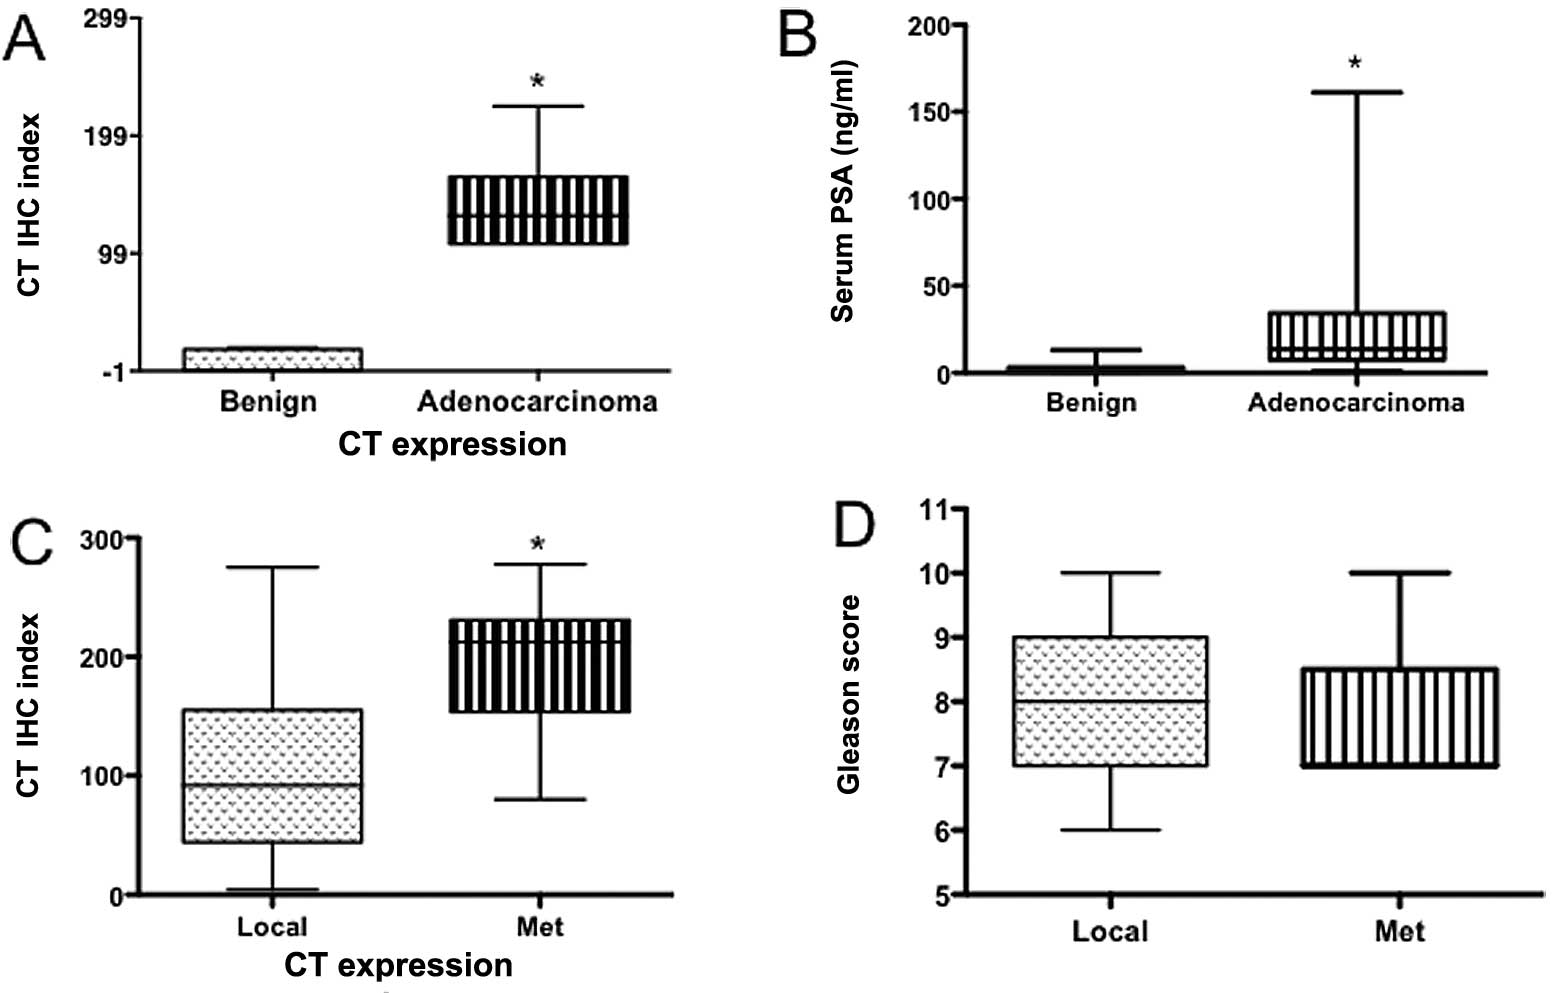
CT/CTR expression and clinicopathological
parameters
We then compared CT IHC indices of benign and PC
specimens with preoperative serum PSA levels of the subjects. This
is because serum PSA is currently used as a marker for PC. As shown
in Fig. 8A and B, CT IHC index as
well as preoperative serum PSA levels of this cohort displayed
significant discrimination between benign and PC patients. However,
the significance of CTR IHC index between these two groups (benign
vs. cancer) was higher than that of preoperative serum PSA levels.
Next, we compared the ability of CT IHC index and Gleason score to
discriminate local vs. metastatic disease (Fig. 8C and D). The analysis shows that CT
IHC index significantly discriminated metastatic disease from
localized disease, whereas the Gleason score could not. Likewise,
CTR IHC index data also demonstrated similar ability (Fig. 8E–H).
Next, contingency analysis of crosstables also
identified a significant association between high CT/CTR IHC
indices and metastatic cancers (Table
IIA and B). Thus, multiple comparative analyses of CT/CTR
expression with the established clinicopathological
markers/clinical outcome data demonstrate that CT/CTR expression
could potentially serve as a progonostic marker of metastatic
PC.
 | Table IICrosstables showing CT or CTR
expression (cases and percentage of cases in each category) in
relation with clinicopathological parameters. |
Table II
Crosstables showing CT or CTR
expression (cases and percentage of cases in each category) in
relation with clinicopathological parameters.
| A, CT expression |
|---|
|
|---|
| Variables | Total patients
(%) | Low CT IHC index
(≤150) (%) | High CT IHC index
(>150) (%) | P-value |
|---|
| Age (years) |
| >66 | 43 (100) | 20 (47) | 23 (53) | |
| ≤66 | 43 (100) | 18 (42) | 25 (58) | 0.8256 |
| Preoperative serum
PSA (ng/ml) |
| ≤10 | 22 (100) | 15 (68) | 7 (32) | |
| >10 | 61 (100) | 29 (48) | 32 (52) | 0.4626 |
| pT status |
| pT2 | 32 (100) | 17 (53) | 15 (47) | |
| pT3 | 49 (100) | 26 (53) | 23 (47) | |
| pT4 | 4 (100) | 0 (0) | 4 (100) | 0.1238 |
| Gleason score |
| 5–6 | 9 (100) | 6 (66) | 3 (34) | |
| 7 | 32 (100) | 14 (44) | 18 (56) | |
| 8–10 | 44 (100) | 25 (57) | 19 (43) | 0.3630 |
| Metastatic
events |
| No metastasis | 64 (100) | 38 (59) | 26 (41) | |
| Metastasis | 21 (100) | 6 (29) | 15 (71) | 0.0225 |
|
| B, CTR
expression |
|
| Variables | Total patients
(%) | Low CT IHC index
(≤150) (%) | High CT IHC index
(>150) (%) | P-value |
|
| Age (years) |
| >66 | 37 (100) | 15 (41) | 22 (59) | |
| ≤66 | 42 (100) | 17 (40) | 25 (60) | 1.000 |
| Preoperative serum
PSA (ng/ml) |
| ≤10 | 21 (100) | 8 (38) | 13 (62) | |
| >10 | 58 (100) | 24 (41) | 34 (59) | 1.000 |
| pT status |
| pT2 | 26 (100) | 15 (58) | 11 (42) | |
| pT3 | 49 (100) | 17 (35) | 32 (65) | |
| pT4 | 4 (100) | 1 (25) | 3 (75) | 0.1236 |
| Gleason score |
| 5–6 | 7 (100) | 4 (57) | 3 (43) | |
| 7 | 30 (100) | 15 (50) | 15 (50) | |
| 8–10 | 41 (100) | 15 (37) | 26 (63) | 0.3324 |
| Metastatic
events |
| No metastasis | 52 (100) | 31 (60) | 21 (40) | |
| Metastasis | 26 (100) | 6 (23) | 20 (77) | 0.0321 |
CT/CTR IHC indices and clinical outcome
of prostate cancer patients
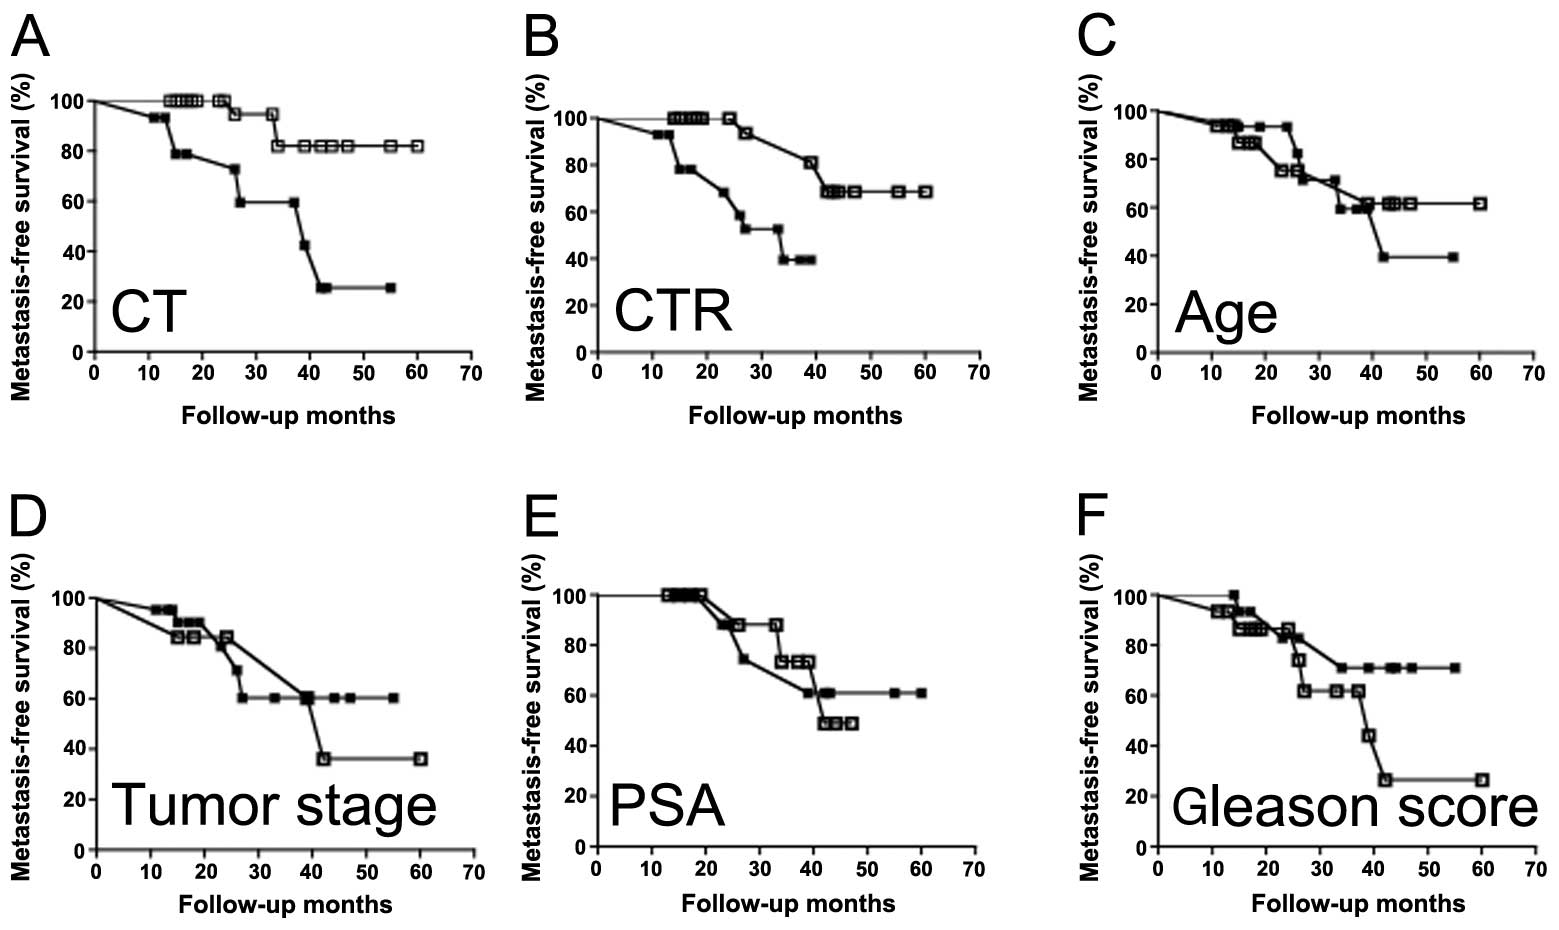
Next, we examined the prognostic ability of CT/CTR
expression as well as other clinicopathological markers on
metastasis-free survival of prostate cancer patients by
Kaplan-Meier analysis. Data of patients were divided into two, high
(>150) and low (≤150) CT/CTR IHC index groups; and survival
period of the patients was considered as a clinical outcome.
Likewise, the patients were also analyzed for other
clinicopathological parameters as described in Fig. 9. Patients with high CT/CTR
expression demonstrated significantly greater unfavorable disease
course than those with low CT/CTR expression (P<0.0005; Fig. 9A and B). Among other
clinicopathological parameters, only Gleason score showed
prognostic significance. However, the level of significance was
remarkably lower than that of CT/CTR expression [P=0.0491 vs.
P=0.0005 (for CT/CTR), Fig. 9F].
All other parameters failed the test (Fig. 9C–E; Table IVA and B). We further tested the
data with Cox regression analysis. In a stratified univariate
analysis, a highly significant prognostic value for high CT/CTR
expression was found with lower survival period; whereas in cases
with low CT/CTR levels, the survival period was longer (Table IV). Among other parameters, only
Gleason score displayed similar prognostic prediction with a lower
significance. In multivariate Cox analyses, CT/CTR expression and
Gleason scores showed significant prognostic values. Based on this
analysis, CT/CTR IHC index is a significantly better prognostic
indicator than Gleason score, preoperative serum PSA, age, or tumor
stage (Table IV).
| Table IVMetastasis-free survival and
clinicopathological paradigms. |
Table IV
Metastasis-free survival and
clinicopathological paradigms.
| Univariate | Multivariate |
|---|
|
|
|
|---|
| Paradigm | Hazard ratio | 95% CI | P-value | Hazard ratio | 95% CI | P-value |
|---|
| CT | 6.342 | 2.269–17.73 | 0.0004 | 6.284 | 1.402–28.167 | 0.016 |
| CTR | 6.237 | 2.216–17.56 | 0.0005 | 9.813 | 2.201–43.742 | 0.003 |
| PSA | 1.682 | 0.4673–5.034 | 0.4262 | | | |
| Age | 1.781 | 0.6303–5.034 | 0.2761 | | | |
| Tumor stage | 1.221 | 0.4106–3.632 | 0.7194 | | | |
| Gleason score | 0.2946 | 0.1075–0.8073 | 0.0175 | 0.571 | 0.151–2.165 | 0.410 |
Discussion
Present results demonstrate that both, CT and CTR,
are selectively localized in basal epithelium of benign prostate
acinii. However, this spatial specificity seems lost in PC, as
indicated by staining of CT and CTR staining in whole malignant
pseudoacinii, which lack basal cells. These results are consistent
with our earlier study on localization of CT/CTR mRNA expression in
the prostate, and validate the reagents and procedures used in the
present study (9). We also observed
that CT/CTR expression was elevated in HGPIN sections as well as
malignanant epithelia. Considering that HGPINs are shown to
represent premalignant lesions that may later develop into
neoplasms, the results raise a possibility that CT-CTR axis may be
among early genes activated during neoplastic transformation of the
prostate (18).
Present results have also identified several new
aspects of CT/CTR expression. First, CT/CTR-immunopositive
expression in metastatic PCs was remarkably higher even during
earlier tumor stages as compared to that in non-metastatic ones.
Second, much larger cell populations of metastatic PCs co-expressed
CT and CTR than non-metastatic ones. Third, CT was abundantly
stained in bone metastasis of PC. When combined with our earlier
results that the activation of CT-CTR autocrine axis significantly
increases tumorigenic capacity and metastasizing ability of
multiple PC cell lines (8,14), present results lend pathological
significance to our molecular studies on metastasis of prostate
cancer. Autocrine CT-CTR axis may promote tumor metastasis through
multiple actions including potent chemotactic actions,
destabilization of cell-cell junctions, loss of cell-cell adhesion
and activation of PI3K-Akt-survivin, cyclic AMP and Wnt-β-catenin
signaling pathways (17,19–21).
The patterns of CT/CTR expression observed in clinical samples such
as high CT/CTR expression in earlier T stages and the switching of
CT-CTR expression from paracrine to autocrine may prove useful in
differentiating metastatic tumors from non-metastatic ones. It is
important to note that numerous studies have reported genomic
alterations as well as elevated expression of CT/CTR genes in
several human malignancies (3–5,9,14,20,22–26).
This evidence further reinforces the potential role for CT-CTR axis
in pathology of prostate cancer progression.
There is an ongoing search for prognostic biomarkers
in PC as currently used markers are limited in predicting disease
outcome (27–29). Our results suggest that PCs with
high CT/CTR expression showed a tendency towards a worse course
(lower incidence of metastasis-free survival) than the patients
with low CT/CTR expression. Gleason score also provided similar
predictive value, but was less reliable than CT/CTR in these
cohorts. This led us to hypothesize the following
interdependencies. First, transformation of benign prostate to a
malignancy is associated with the loss of spatial specificity and
upregulation of CT/CTR expression. Second, the specimens from
metastatic PC displayed a switch of CT-CTR axis from a paracrine to
an autocrine one. Similar phenomenon has been shown to occur in
case of androgens as well (30).
Third, high level of CT/CTR expression is correlated with poor
prognosis and a higher probability of metastatic disease. Among
various clinicopathological factors studied, CT/CTR expression
provided best predictability of the clinical course. In conclusion,
the present data support the use of CT/CTR as therapeutic targets
for aggressive PC and provide a strong rationale for a larger study
to evaluate CT/CTR as prognostic markers for metastatic PC.
References
|
1
|
Horwich A, Parker C and Kataja V: Prostate
cancer: ESMO clinical recommendations for diagnosis, treatment and
follow-up. Ann Oncol. 20(Suppl 4): S76–S78. 2009. View Article : Google Scholar
|
|
2
|
Armstrong AJ and Febbo PG: Using surrogate
biomarkers to predict clinical benefit in men with
castration-resistant prostate cancer: an update and review of the
literature. Oncologist. 14:816–827. 2009.PubMed/NCBI
|
|
3
|
Deng B, Zhang S, Miao Y, et al:
Adrenomedullin expression in epithelial ovarian cancers and
promotes HO8910 cell migration associated with upregulating
integrin alpha5beta1 and phosphorylating FAK and paxillin. J Exp
Clin Cancer Res. 31:192012. View Article : Google Scholar : PubMed/NCBI
|
|
4
|
Wang X, Nakamura M, Mori I, et al:
Calcitonin receptor gene and breast cancer: quantitative analysis
with laser capture microdissection. Breast Cancer Res Treat.
83:109–117. 2004. View Article : Google Scholar : PubMed/NCBI
|
|
5
|
Delis S, Bakoyiannis A, Giannakou N,
Tsigka A, Avgerinos C and Dervenis C: Asymptomatic
calcitonin-secreting tumor of the pancreas. A case report. JOP.
7:70–73. 2006.PubMed/NCBI
|
|
6
|
Ferrigno D, Buccheri G and Biggi A: Serum
tumour markers in lung cancer: history, biology and clinical
applications. Eur Respir J. 7:186–197. 1994. View Article : Google Scholar : PubMed/NCBI
|
|
7
|
Shah GV, Noble MJ, Austenfeld M, Weigel J,
Deftos LJ and Mebust WK: Presence of calcitonin-like
immunoreactivity (iCT) in human prostate gland: evidence for iCT
secretion by cultured prostate cells. Prostate. 21:87–97. 1992.
View Article : Google Scholar : PubMed/NCBI
|
|
8
|
Thomas S, Chigurupati S, Anbalagan M and
Shah G: Calcitonin increases tumorigenicity of prostate cancer
cells: evidence for the role of protein kinase A and urokinase-type
plasminogen receptor. Mol Endocrinol. 20:1894–1911. 2006.
View Article : Google Scholar
|
|
9
|
Chien J, Ren Y, Qing Wang Y, et al:
Calcitonin is a prostate epithelium-derived growth stimulatory
peptide. Mol Cell Endocrinol. 181:69–79. 2001. View Article : Google Scholar : PubMed/NCBI
|
|
10
|
Conner AC, Simms J, Hay DL, et al:
Heterodimers and family-B GPCRs: RAMPs, CGRP and adrenomedullin.
Biochem Soc Trans. 32:843–846. 2004. View Article : Google Scholar : PubMed/NCBI
|
|
11
|
Purdue BW, Tilakaratne N and Sexton PM:
Molecular pharmacology of the calcitonin receptor. Receptors
Channels. 8:243–255. 2002. View Article : Google Scholar : PubMed/NCBI
|
|
12
|
Tolcos M, Tikellis C, Rees S, Cooper M and
Wookey P: Ontogeny of calcitonin receptor mRNA and protein in the
developing central nervous system of the rat. J Comp Neurol.
456:29–38. 2003. View Article : Google Scholar : PubMed/NCBI
|
|
13
|
Wookey PJ, McLean CA, Hwang P, et al: The
expression of calcitonin receptor detected in malignant cells of
the brain tumour glioblastoma multiforme and functional properties
in the cell line A172. Histopathology. 60:895–910. 2012. View Article : Google Scholar : PubMed/NCBI
|
|
14
|
Shah GV, Thomas S, Muralidharan A, et al:
Calcitonin promotes in vivo metastasis of prostate cancer cells by
altering cell signaling, adhesion, and inflammatory pathways.
Endocr Relat Cancer. 15:953–964. 2008. View Article : Google Scholar : PubMed/NCBI
|
|
15
|
Chigurupati S, Kulkarni T, Thomas S and
Shah G: Calcitonin stimulates multiple stages of angiogenesis by
directly acting on endothelial cells. Cancer Res. 65:8519–8529.
2005. View Article : Google Scholar : PubMed/NCBI
|
|
16
|
Jackel MC, Mitteldorf C, Schweyer S and
Fuzesi L: Clinical relevance of Fas (APO-1/CD95) expression in
laryngeal squamous cell carcinoma. Head Neck. 23:646–652. 2001.
View Article : Google Scholar : PubMed/NCBI
|
|
17
|
Shah GV, Muralidharan A, Gokulgandhi M,
Soan K and Thomas S: Cadherin switching and activation of β-catenin
signaling underlie proinvasive actions of calcitonin-calcitonin
receptor axis in prostate cancer. J Biol Chem. 284:1018–1030.
2009.
|
|
18
|
Brawer MK: Prostatic intraepithelial
neoplasia: an overview. Rev Urol. 7(Suppl 3): S11–S18. 2005.
|
|
19
|
Thomas S and Shah G: Calcitonin induces
apoptosis resistance in prostate cancer cell lines against
cytotoxic drugs via the Akt/survivin pathway. Cancer Biol Ther.
4:1226–1233. 2005. View Article : Google Scholar : PubMed/NCBI
|
|
20
|
Ritchie CK, Thomas KG, Andrews LR, Tindall
DJ and Fitzpatrick LA: Effects of the calciotrophic peptides
calcitonin and parathyroid hormone on prostate cancer growth and
chemotaxis. Prostate. 30:183–187. 1997. View Article : Google Scholar : PubMed/NCBI
|
|
21
|
Shah GV, Rayford W, Noble MJ, et al:
Calcitonin stimulates growth of human prostate cancer cells through
receptor-mediated increase in cyclic adenosine 3′,5′-monophosphates
and cytoplasmic Ca2+ transients. Endocrinology.
134:596–602. 1994.PubMed/NCBI
|
|
22
|
Goodman MT, Ferrell R, McDuffie K, et al:
Calcitonin gene polymorphism CALCA-624 (T/C) and ovarian cancer.
Environ Mol Mutagen. 46:53–58. 2005. View
Article : Google Scholar : PubMed/NCBI
|
|
23
|
Trimboli P, Rossi F, Baldelli R, et al:
Measuring calcitonin in washout of the needle in patients
undergoing fine needle aspiration with suspicious medullary thyroid
cancer. Diagn Cytopathol. 40:394–398. 2012. View Article : Google Scholar : PubMed/NCBI
|
|
24
|
Hebden C, Smalt R, Chambers T and Pondel
MD: Multiple promoters regulate human calcitonin receptor gene
expression. Biochem Biophys Res Commun. 272:738–743. 2000.
View Article : Google Scholar : PubMed/NCBI
|
|
25
|
Silverman AL, Park JG, Hamilton SR, Gazdar
AF, Luk GD and Baylin SB: Abnormal methylation of the calcitonin
gene in human colonic neoplasms. Cancer Res. 49:3468–3473.
1989.PubMed/NCBI
|
|
26
|
Shah GV: Calcitonin. Encyclopedia of
Cancer. 2:16–20. 2009.
|
|
27
|
Yigitbasi O, Ozturk U, Goktug HN, Gucuk A
and Bakirtas H: Prognostic factors in metastatic prostate cancer.
Urol Oncol. 29:162–165. 2011. View Article : Google Scholar : PubMed/NCBI
|
|
28
|
Andren O, Fall K, Franzen L, Andersson SO,
Johansson JE and Rubin MA: How well does the Gleason score predict
prostate cancer death? A 20-year followup of a population based
cohort in Sweden. J Urol. 175:1337–1340. 2006.PubMed/NCBI
|
|
29
|
Masieri L, Lanciotti M, Gontero P, et al:
The prognostic role of preoperative chromogranin A expression in
prostate cancer after radical prostatectomy. Arch Ital Urol Androl.
84:17–21. 2012.PubMed/NCBI
|
|
30
|
Gao J, Arnold JT and Isaacs JT: Conversion
from a paracrine to an autocrine mechanism of androgen-stimulated
growth during malignant transformation of prostatic epithelial
cells. Cancer Res. 61:5038–5044. 2001.
|