Introduction
Although tumor size is not a factor in deciding
tumor stage according to TNM classification of the UICC (Union for
International Cancer Control) or the Japanese classification of
colorectal carcinoma, tumor size is generally considered to be an
indicator of proliferation potency and thereby malignancy. There
are some colorectal cancer (CRC) cases with small tumors and
metastasis, and, conversely, tumors of large size without
metastasis. Such small tumors with the capability to metastasize
are estimated to have a tendency of vertical invasion and vascular
invasion, and these tumors often have a high malignancy grade that
induces lymph node or distant metastasis. Therefore, we
hypothesized that such small but advanced cancer might have
distinctive characteristics which are involved in cancer
metastasis, particularly for the lymph nodes.
Several researchers have studied
metastasis-regulating factors (1–3). Gene
expression arrays using in vivo models (2) and clinical samples (1,2) and
proteomics analysis using clinical samples (3) have all been carried out, and certain
genes and pathways have been identified as biomarkers for CRC
metastasis. There is some discord between past reports, however,
therefore the underlying factors that cause tumor metastasis remain
to be fully understood.
Lymph node metastasis is a significant factor that
has an impact on disease prognosis in CRC cases. While patients
without metastasis can mostly be cured by resection of the primary
tumor and thus have a 5-year survival rate exceeding 80%, patients
with lymph node metastasis often experience a relapse and therefore
have a 5-year survival rate of <50% (4,5). We
have, thus, focused on identifying biomarkers for CRC lymph node
metastasis, which will be helpful in determining treatment strategy
and may provide further insight into tumor biology.
In the present study, we investigated significant
factors for cancer metastasis, particularly lymph node metastasis,
by using gene expression microarray analysis of small tumors with
metastases and large tumors without metastases.
Materials and methods
Patients and sample collection
We used a total of 320 CRC samples, in which 148
were used as pure cancer tissues separated by laser microdissection
(71 cases for set 1 and all 148 cases for set 2) and 172 were used
in bulk (set 3). All samples were obtained during surgery. All
patients underwent resection of the primary tumor at Kyushu
University Hospital at Beppu and affiliated hospitals between 1992
and 2007. Written informed consent was obtained from all patients.
All patients had a clear histological diagnosis of CRC and were
closely followed up every 3 months. The follow-up period in set 1
ranged from 0.1 to 12.3 years, with a mean of 3.8 years; follow up
in set 2 ranged from 0.1 months to 3.2 years with a mean of 2.1
years. Resected cancer tissues were immediately cut and stored in
RNAlater (Ambion) or embedded in Tissue-Tek OCT (optimum
cutting temperature) medium (Sakura, Tokyo, Japan), frozen in
liquid nitrogen, and kept at −80ºC until RNA extraction. Frozen
tissue specimens were homogenized in guanidinium thiocyanate, and
total RNA was obtained by ultracentrifugation through a cesium
chloride cushion. cDNA for reverse-transcription PCR was
synthesized from 8.0 μg of total RNA with M-MLV Reverse
Transcriptase (Invitrogen, Carlsbad, CA, USA). Clinicopathological
factors and clinical stage were classified using the TNM system of
classification. All sample data, including age, gender, histology,
tumor depth, lymph node metastasis, lymphatic invasion, vascular
invasion, liver metastasis and postoperative liver recurrence, were
obtained from the clinical and pathological records.
Laser microdissection
Tissue samples were microdissected using the LMD6000
Laser microdissection system (Leica Laser Microdissection System;
Leica Microsystems, Wetzlar, Germany) as previously described
(6). For laser microdissection,
five micron frozen sections were fixed in 70% ethanol for 30 sec,
stained with hematoxylin and eosin, and dehydrated for 5 sec each
in 70, 95 and 100% ethanol. Sections were air-dried, then
microdissected with the LMD system. Target cells were excised, at
least 100 cells per section, and bound to the transfer film. Then,
total RNA was extracted.
Gene expression microarray
We used the commercially available Human Whole
Genome Oligo DNA Microarray kit (Agilent Technologies, Santa Clara,
CA, USA). A list of genes on this cDNA microarray is available at
http://www.chem.agilent.com/scripts/generic.asp?lpage=5175&indcol=Y&prodcol=Y&prodcol=N&indcol=Y&prodcol=N.
Cyanine (Cy)-labeled cRNA was prepared using T7 linear
amplification as described in the Agilent Low RNA Input Fluorescent
Linear Amplification kit manual (Agilent Technologies). Labeled
cRNA was fragmented and hybridized to an oligonucleotide microarray
(Whole Human Genome 4×44K Agilent G4112F). Fluorescence intensities
were determined with an Agilent DNA Microarray Scanner and were
analyzed using G2567AA Feature Extraction software version A.7.5.1
(Agilent Technologies), which used the LOWESS (locally weighted
linear regression curve fit) normalization method (7). This microarray study followed MIAME
guidelines issued by the Microarray Gene Expression Data group
(8).
Gene Ontology analysis
All 1662 genes which were significantly
differentially expressed between the two groups were further
analyzed using the Gene Ontology database (http://www.geneontology.org/).
Pathway analysis
Genesets and pathways mentioned in the Molecular
Signatures Database (http://www.broadinstitute.org/gsea/msigdb/index.jsp),
Kyoto Encyclopedia of Genes and Genomes (http://www.genome.jp/kegg/), SABioscience pathway
central (http://www.sabiosciences.com/pathwaycentral.php) and
Reactome (http://www.reactome.org/ReactomeGWT/entrypoint.html)
were corrected and analyzed with the EEM (Extraction of Expression
Modules) method (9).
Quantitative real-time reverse
transcription-PCR
For quantitative real-time reverse transcription
(qRT)-PCR, high mobility group A1 (HMGA1) (NM_145903.2,
NM_002131.3, NM_145902.2, NM_145905.2, NM_145899.2, NM_145901.2)
primer sequences were 5′-GAAAAGGACGGCACTGAGAA-3′ and
5′-CTCTTAGGTGTTGGCACTTCG-3′. To normalize for RNA concentration,
glyceraldehyde-3-phosphate dehydrogenase (GAPDH) served as an
internal control. The sequences of the GAPDH primers were: sense,
5′-TTGGTATCG TGGAAGGACTCA-3′ and antisense, 5′-TGTCATCATATT
TGGCAGGTT-3′. The amplification protocol included an initial
denaturation step at 95ºC for 10 min, followed by 45 cycles of 95ºC
for 10 sec and 60ºC for 30 sec. qRT-PCR was performed in a
LightCycler 480 instrument (Roche Applied Science, Basel,
Switzerland) using the LightCycler 480 Probes Master kit (Roche
Applied Science). All concentrations were calculated relative to
the concentration of cDNA using Human Universal Reference Total RNA
(Clontech, Palo Alto, CA, USA). The concentration of HMGA1 was then
divided by the concentration of the endogenous reference (GAPDH) to
obtain normalized expression values.
Statistical analysis
For gene expression array analysis, the differences
between groups were estimated using the Student’s t-test after
expression signals were calculated by log2-transformation of the
normalized data. Differentially expressed genes were detected by
using the P-value, fold-change value and q-value. All differences
were considered statistically significant at the level of P<0.05
or false discovery rate (FDR) P<0.05. Data from RT-PCR analyses
were analyzed using JMP 5 software (JMP, Cary, NC, USA). Overall
survival rates were calculated actuarially according to the
Kaplan-Meier method and were measured from the day of surgery.
Differences between groups were estimated using the Chi-square
test, Student’s t-test, repeated-measures ANOVA and log-rank test.
A probability level of 0.05 was selected for statistical
significance.
Results
A total of 1662 genes are differently
expressed between the two groups
We first selected 71 cases (set 1) and subdivided
them into two groups. Group 1 consisted of 6 colorectal cancers
which were <2 cm in size and had metastasis; group 2 consisted
of 65 cases with tumors >2 cm in size that lacked metastasis
(Table I). A significant difference
in expression level (FDR <0.05) between the two groups was found
in 62 genes and P<0.05 was observed in 1662 genes (data not
shown). These included some well described genes, such as the
angiogenesis factor hypoxia inducible factor 1 (HIF1A); cell cycle
regulators such as CDC34 and CD20; snail homolog 1 (SNAI1), which
is involved in the epithelial to mesenchymal transition (EMT); the
NF-κB pathway gene nuclear factor of κ light polypeptide gene
enhancer in B-cells inhibitor (NFKBI); the oncogenic pathway gene
RAS protein activator like 1 (RASAL1); and the colon cancer stem
cell relating gene leucine-rich repeat containing G protein-coupled
receptor 5 (LGR5).
 | Table IClinicopathological factors in
colorectal cancer cases of group 1 and group 2. |
Table I
Clinicopathological factors in
colorectal cancer cases of group 1 and group 2.
| Group 1 (N=6) | Group 2 (N=65) |
|---|
|
|
|
|---|
| Factors | n, % | n, % |
|---|
| Age (years) | 57.5±10.8 | 67.0±11.0 |
| Gender |
| Male | 3 (50.0) | 38 (58.0) |
| Female | 3 (50.0) | 27 (42.0) |
| Tumor size
(mm) | 19±2 | 49±19 |
| Histological
grade |
| Well | 1 (16.7) | 44 (67.7) |
| Moderate | 5 (83.3) | 21 (32.3) |
| Depth |
| M | | 1 (1.5) |
| SM | | 5 (7.7) |
| MP | 1 (16.7) | 14 (21.5) |
| SS, SE | 5 (83.3) | 41 (63.1) |
| SI | | 4 (6.2) |
| Lymph node
metastasis |
| Present | 6 (100.0) | 0 (0.0) |
| Absent | 0 (0.0) | 65 (100.0) |
| Lymphatic
invasion | | |
| Present | 6 (100.0) | 36 (55.4) |
| Absent | 0 (0.0) | 29 (44.6) |
| Venous
invasion |
| Present | 5 (83.3) | 31 (47.7) |
| Absent | 1 (16.7) | 34 (52.0) |
| Liver
metastasis |
| Present | 1 (16.7) | 0 (0.0) |
| Absent | 5 (83.3) | 65 (100.0) |
| Peritoneal
dissemination |
| Present | 0 (0.0) | 0 (0.0) |
| Absent | 6 (100.0) | 65 (100.0) |
| Distant
metastasis |
| Present | 0 (0.0) | 0 (0.0) |
| Absent | 6 (100.0) | 65 (100.0) |
Anti-apoptotic activity induces
metastasis formation
We performed Gene Ontology analysis to annotate the
1662 genes which were significantly differently regulated in group
1. Results are shown in Table II.
The Gene Ontologies ‘NF-κB binding’, ‘negative regulation of MAP
kinase activity’, ‘regulation of epidermal growth factor receptor
signaling pathway’ and ‘apoptotic process’ were significantly
enriched in this set of genes.
| Table IISignificantly different Gene Ontology
(GO) in 1662 significant genes. |
Table II
Significantly different Gene Ontology
(GO) in 1662 significant genes.
| Category | GO ID | Name | P-value |
|---|
| Molecular
function | GO:0005515 | Protein
binding | 1.58E-08 |
| GO:0019901 | Protein kinase
binding | 0.00892753 |
| GO:0019899 | Enzyme binding | 0.00489524 |
| GO:0005096 | GTPase activator
activity | 0.00288377 |
| GO:0004843 | Ubiquitin-specific
protease activity | 0.00878492 |
| GO:0003899 | DNA-directed RNA
polymerase activity | 0.00575996 |
| GO:0051059 | NF-κB binding | 0.00691413 |
| Biological
process | GO:0006915 | Apoptotic
process | 0.00842709 |
| GO:0006468 | Protein
phosphorylation | 0.00921 |
| GO:0009615 | Response to
virus | 0.00453601 |
| GO:0006974 | Response to DNA
damage stimulus | 0.00822752 |
| GO:0006368 | Transcription
elongation from RNA polymerase II promoter | 0.00160609 |
| GO:0043547 | Positive regulation
of GTPase activity | 0.00107171 |
| GO:0042384 | Cilium
assembly | 0.00586548 |
| GO:0050434 | Positive regulation
of viral transcription | 0.00386628 |
| GO:0021987 | Cerebral cortex
development | 0.00424518 |
| GO:0043407 | Negative regulation
of MAP kinase activity | 0.00318089 |
| GO:0006446 | Regulation of
translational initiation | 0.00468904 |
| GO:0006884 | Cell volume
homeostasis | 0.00686783 |
| GO:0042058 | Regulation of
epidermal growth factor receptor signaling pathway | 0.00861317 |
| Cellular
component | GO:0005829 | Cytosol | 0.00019253 |
| GO:0005730 | Nucleolus | 0.00011503 |
| GO:0005654 | Nucleoplasm | 0.00130461 |
| GO:0005794 | Golgi
apparatus | 0.00767627 |
| GO:0005856 | Cytoskeleton | 0.00269772 |
| GO:0043234 | Protein
complex | 0.00182768 |
| GO:0000242 | Pericentriolar
material | 0.00386903 |
We performed pathway analysis to identify the
pathways which actually determine the character of these tumors. A
summary result of the analysis is shown in Table III. No significant difference of
activation level was found in pathways associated with oncogenes
such as RAS and cell-cycle genes. However, we identified
significant inactivation of genes involved in the WNT signaling
pathway and several apoptosis-related pathways in group 1.
Inactivation of WNT signaling seemed to be associated with the
smaller tumor size of group 1. The inactivation of apoptosis in
group 1 tumors may contribute to their ability to form metastasis
sites.
| Table IIIPathways differently activated
between two groups. |
Table III
Pathways differently activated
between two groups.
| Average score | |
|---|
|
| |
|---|
| Gene set | Group 1 | Group 2 | P-value |
|---|
|
HOLLMAN_APOPTOSIS_VIA_CD40_UP | −0.849748231 | 0.472445257 | 0.001910051 |
|
LAU_APOPTOSIS_CDKN2A_UP | −0.833935125 | 1.308750297 | 0.004621955 |
|
KEGG_PHOSPHATIDYLINOSITOL_SIGNALING_SYSTEM | −0.662010266 | −0.386950146 | 0.007638363 |
| KEGG_WNT_SIGNALING_
PATHWAY | −0.735968923 | −0.413898949 | 0.010503868 |
|
TIAN_TNF_SIGNALING_VIA_NFKB | −0.584241501 | 0.67357094 | 0.026420951 |
| BREDEMEYER_RAG_
SIGNALING_VIA_ATM_NOT_ VIA_NFKB_UP | −0.777042962 | 0.118487532 | 0.032926144 |
|
WONG_EMBRYONIC_STEM_CELL_CORE | 0.402726415 | −0.179854864 | 0.039863172 |
| Apoptosis | −0.55085111 | −0.263926672 | 0.046064516 |
We also carried out gene expression array for 77
more cases for further analysis. Using the microarray results for
all 148 CRC cases, we investigated the correlation of the above
1662 genes with prognosis and the following clinicopathological
factors: overall survival, disease-free survival, tumor size,
histological grade, serosal invasion, lymph node metastasis,
lymphatic invasion, venous invasion, peritoneal dissemination,
liver metastasis and distant metastasis. Twenty-three genes, whose
count of significant factors was over three, were extracted
(Table IV). We focused on
HMGA1 as it is reported to have a critical role in both
neoplastic transformation and the inactivation of p53’s apoptotic
function (10). HMGA1 had an
FDR <0.05 in the analysis described above for the 1662
identified genes (data not shown).
| Table IVTwenty-three genes significantly
associated with more than three clinicopathological factors. |
Table IV
Twenty-three genes significantly
associated with more than three clinicopathological factors.
| Gene | No. of significant
factors | Overall
survival | Disease- free
survival | Tumor size (cut-off
2 cm) | Histological
grade | Serosal
invasion | Lymph node
metastasis | Lymphatic
invasion | Venous
invasion | Peritoneal
dissemination | Liver
metastasis | Distant
metastasis |
|---|
| ARHGDIG | 6 | * | | | | * | * | | * | | * | * |
| IQSEC1 | 5 | * | * | | | | | | * | * | * | |
| LRRC8E | 5 | * | * | | * | | | * | | | * | |
| IL17RD | 4 | * | * | | | * | | | * | | | |
| RHBDF1 | 3 | | | | | | * | * | * | | | |
| DBN1 | 4 | * | | | | * | | | | | * | * |
| ST3GAL4 | 4 | * | * | | | | * | | | | * | |
| ZNF296 | 4 | | | | * | | * | * | | * | | |
| UTP23 | 4 | * | * | | | * | | | | | * | |
| NUBPL | 3 | | | | | | | * | * | | * | |
| PTPN21 | 3 | * | | | | | | * | | | * | |
| HIST1H2AL | 3 | | | | * | | * | | | | * | |
| TMEM17 | 3 | * | | | | | | * | | | * | |
| TGFBR2 | 3 | | * | | | | | | | | * | * |
| GLB1L2 | 3 | * | | | | | * | | | | * | |
| DENND4C | 3 | * | | | | * | | | | | * | |
| C11orf51 | 3 | * | | | | | * | | | | * | |
| MEGF8 | 3 | | * | | | | | | | | * | * |
| PVT1 | 3 | | | | | | * | * | * | | | |
| RECQL4 | 3 | | | | | * | * | | * | | | |
| HMGA1 | 3 | * | | | * | | * | | | | | |
| BCL11B | 3 | * | | | * | | | | | | * | |
| KIAA1429 | 3 | | | | | * | | | * | | * | |
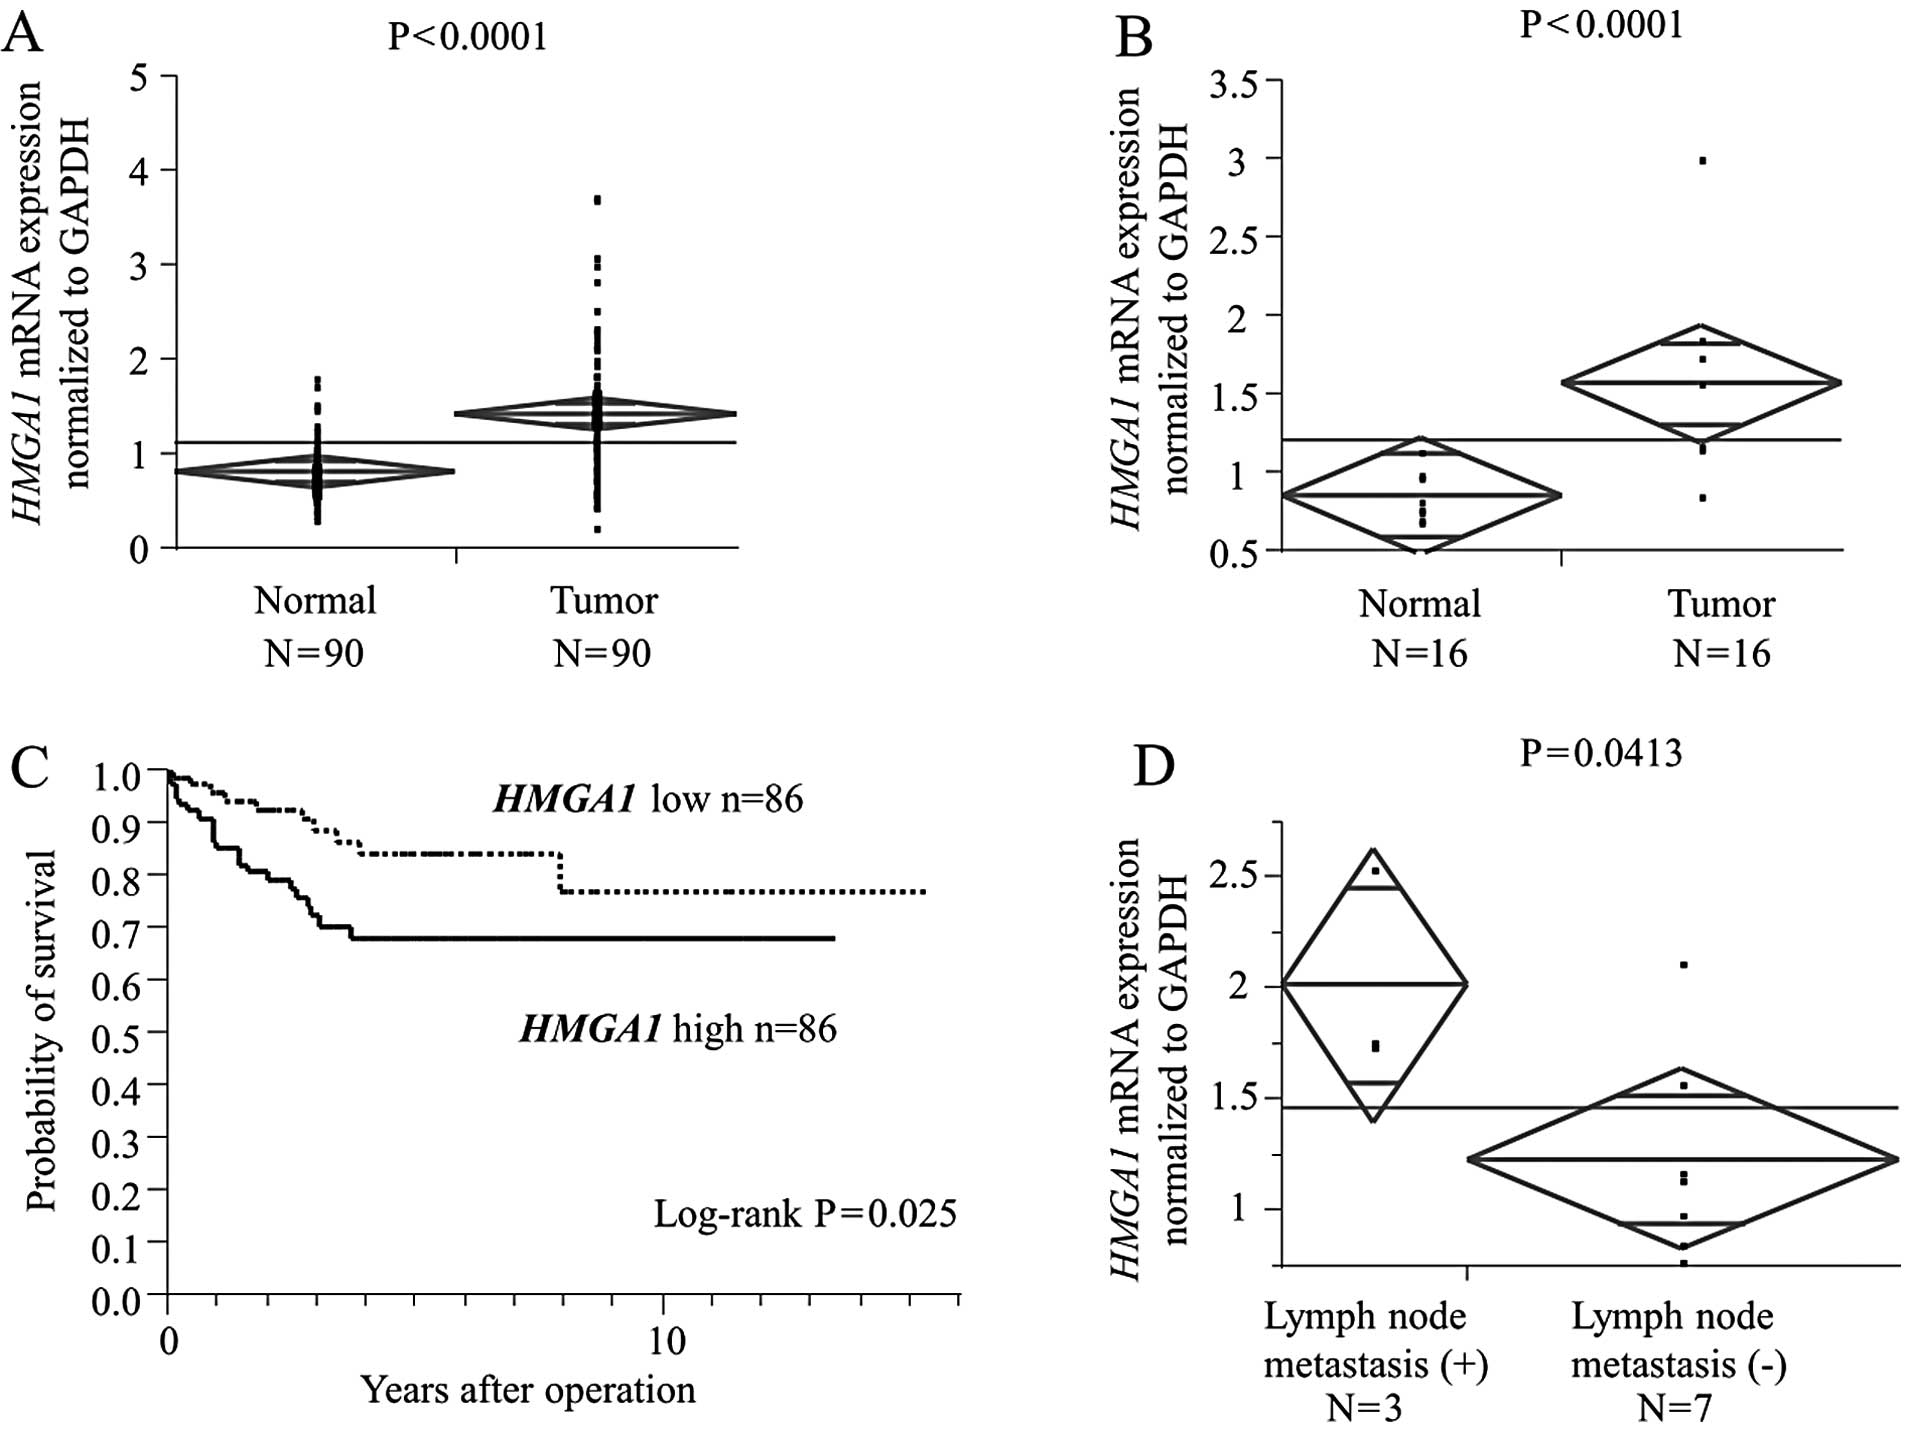
HMGA1 mRNA expression is a robust
indicator of lymph node metastasis and patient prognosis
HMGA1 mRNA expression in the bulk 172 tumor
tissues and corresponding normal tissues (case set 3) was examined
by qRT-PCR to validate the clinical significance of HMGA1
expression in CRC cases. HMGA1 mRNA levels in cancerous
tissues were significantly higher than those in non-cancerous
tissues (P<0.0001; Fig. 1A). The
significant difference was maintained in the analysis of small
sized tumors (<2 cm, P<0.0001; Fig. 1B).
Next, we divided the 172 patients with CRC into a
high HMGA1 expression group (n=86) and a low HMGA1
expression group (n=86), classified as having expression levels
higher or lower than the median value, respectively.
Clinicopathological factors were compared between the high and low
HMGA1 mRNA expression groups (Table V). The high HMGA1 expression
group showed higher risk for lymph node metastasis. Univariate
analysis of lymph node metastasis revealed that the relative level
of HMGA1 expression was a lymph node metastasis risk factor
similar to serosal invasion, lymphatic invasion, venous invasion
and liver metastasis (Table VI).
Variables with a value of P<0.05 were selected for multivariate
analysis. Multivariate analysis showed that HMGA1 expression
was an independent lymph node metastasis risk factor in patients
with CRC (relative risk, 3.46; P=0.001; Table VI). With regard to overall
survival, patients with high HMGA1 expression had a
significantly poorer prognosis than those with low HMGA1
expression (P=0.0046; Fig. 1C).
Furthermore, we performed subgroup analysis for submucosal invasive
cancer, which can be removed completely by local resection if lymph
node metastases do not exist. Lymph node metastasis was observed in
3 out of 10 submucosal invasive cancer cases, and 3 cases with
lymph node metastasis had significantly higher HMGA1 mRNA
expression than the other 7 cases without lymph node metastasis
(P=0.0413; Fig. 1D).
| Table VHMGA1 mRNA expression and
clinicopathological factors in 172 cases of colorectal cancer. |
Table V
HMGA1 mRNA expression and
clinicopathological factors in 172 cases of colorectal cancer.
| Low expression
(N=86) | High expression
(N=86) | |
|---|
|
|
| |
|---|
| Factors | n, % | n, % | P-value |
|---|
| Age (years) |
| <65 | 25 (29.07) | 35 (40.70) | 0.109 |
| ≥66 | 61 (70.93) | 51 (59.30) | |
| Gender |
| Male | 52 (60.47) | 51 (59.30) | 0.8761 |
| Female | 34 (39.53) | 35 (40.70) | |
| Histological
grade |
| Well/moderate | 80 (93.02) | 80 (93.02) | 1 |
| Other | 6 (6.98) | 6 (6.98) | |
| Tumor size
(mm) |
| ≤20 | 4 (4.65) | 11 (12.79) | 0.0505 |
| >20 | 78 (90.70) | 70 (81.40) | |
| Serosal
invasion |
| Absent | 27 (31.40) | 23 (26.74) | 0.5016 |
| Present | 59 (68.60) | 63 (73.26) | |
| Lymph node
metastasis |
| N0 | 57 (66.28) | 34 (39.53) | 0.0003a |
| N1–2 | 28 (32.56) | 52 (60.47) | |
| Lymphatic
invasion |
| Absent | 56 (65.12) | 44 (51.16) | 0.076 |
| Present | 30 (34.88) | 41 (47.67) | |
| Venous
invasion |
| Absent | 70 (81.40) | 64 (74.42) | 0.3321 |
| Present | 16 (18.60) | 21 (24.42) | |
| Liver
metastasis |
| Absent | 79 (91.86) | 75 (87.21) | 0.3172 |
| Present | 7 (8.14) | 11 (12.79) | |
| Peritoneal
dissemination |
| Absent | 84 (97.67) | 80 (93.02) | 0.1389 |
| Present | 2 (2.33) | 6 (6.98) | |
| Distant
metastasis |
| Absent | 84 (97.67) | 84 (97.67) | 1 |
| Present | 2 (2.33) | 2 (2.33) | |
| UICC stage |
| 0, I, II | 54 (62.79) | 34 (39.53) | 0.0022a |
| III, IV | 32 (37.21) | 52 (60.47) | |
| Table VIUnivariate and multivariate analysis
for lymph node metastasis (logistic regression model). |
Table VI
Univariate and multivariate analysis
for lymph node metastasis (logistic regression model).
| Univariate
analysis | Multivariate
analysis |
|---|
|
|
|
|---|
| Factors | RR | 95% CI | P-value | RR | 95% CI | P-value |
|---|
| Age (years)
(<65/≥66) | 0.39 | 0.204–0.744 | 0.0046 | - | - | - |
| Gender
(male/female) | 0.92 | 0.498–1.706 | 0.7991 | - | - | - |
| Serosal invasion
(absent/present) | 5.25 | 2.481–12.007 | <0.0001a | 2.80 | 1.177–7.040 | 0.023a |
| Lymphatic invasion
(absent/present) | 5.48 | 2.852–10.843 | <0.0001a | 2.83 | 0.297–6.253 | 0.009a |
| Venous invasion
(absent/present) | 5.83 | 2.575–14.578 | <0.0001a | 2.68 | 0.993–7.697 | 0.057 |
| Liver metastasis
(absent/present) | 0.55 | 3.024–71.924 | 0.0017a | 7.00 | 1.503–52.834 | 0.026a |
| HMGA1 mRNA
expression (low/high) | 3.11 | 1.679–5.882 | 0.0004a | 3.46 | 1.676–7.832 | 0.001a |
Discussion
In the present study, we focused on colorectal
cancer (CRC) with metastasis in spite of small size (<2 cm).
These cancer cells seem to have a greater ability for invasion and
migration. Therefore, we comprehensively analyzed the gene
expression profile of these cancer tissues to identify the genes or
pathways which regulate the cancer metastasis.
Biomarkers for CRC lymph node metastasis have been
reported as follows; Grade et al(1) carried out gene expression array
analysis on 73 colon cancer tissues and comparative genomic
hybridization (CGH) for 32 tumors. They identified 68 genes that
were significantly differentially expressed between lymph
node-negative and lymph node-positive tumors, the functional
annotation of which revealed a preponderance of genes that play a
role in cellular immune response and surveillance. Using an in
vivo orthotopic CRC model and clinical samples, Hao et
al(2) discovered that a
five-gene signature [v-yes-1 Yamaguchi sarcoma viral related
oncogene homolog (LYN), syndecan binding protein (SDCBP),
mitogen-activated protein kinase kinase kinase kinase 4
(MAP4K4), dickkopf 1 homolog (DKK1), and midline 1
(MID1)] was closely correlated with lymph node metastasis in
CRC. Using proteomics analysis, Meding et al(3) revealed that expression levels of FXYD
domain containing ion transport regulator 3 (FXYD3), S100 calcium
binding protein A11 (S100A11), and glutathione S-transferase mu 3
(GSTM3) are novel markers for regional lymph node metastasis in
colon cancer. In addition, specific signatures associated with
tumor stage and lymph node metastases were described (11,12).
In the present study, the FXYD5 and
S100A genes were significantly regulated in group 1;
however, we did not find most of the previously described markers.
In the present study, we identified lymph node metastasis-related
genes, particularly in small tumors (<20 mm), since we
considered that they would be the most informative for clinical
applications. This might explain the discrepancy between our
results and past reports.
As for the characteristics of the identified genes,
we found that anti-apoptotic activity played a key role in cancer
metastasis. In general, deregulated cell proliferation together
with suppressed apoptosis constitute the minimal common platform
upon which tumorigenesis is based (13). The initial population of malignant
cells avoids the apoptotic pathway and then continues to rampantly
proliferate. Anti-apoptotic activity must, therefore, be required
for cancer cells to form metastases. Notably, genes regulating the
epithelial-to-mesenchymal transition related pathways, which have
been considered to promote cancer cell invasion and migration
(14,15), and those regulating cancer stem cell
related pathways, which have the potential to initiate and sustain
tumor growth and metastasis (16,17),
did not affect metastatic ability in our study.
We showed that HMGA1 expression has a
significant correlation with lymph node metastasis in CRC cases.
The high-mobility group (HMG) proteins are low-molecular weight
nuclear factors with non-histone chromosomal accessory functions
(18). The A subgroup of HMG
interacts with the minor groove of numerous AT-rich promoters and
enhancers (19) and plays key roles
in chromatin architecture and gene transcription control (19,20).
Under physiological conditions, HMGA protein expression is high
during embryogenesis (21,22) and decreases to low to undetectable
levels in adult tissues. High HMGA expression in adult life
is associated only with pathological conditions such as human
carcinomas of the thyroid (23,24),
colon (25–27), prostate (28), pancreas (29), cervix (30), ovary (31) and breast (32). Moreover, large scale gene expression
studies show that high expression portends a poor prognosis in some
tumors (33,34). HMGA1 is also enriched in embryonic
stem cells and high grade (poorly differentiated) cancer, including
breast, bladder, and brain cancer (34) and is associated with tumor invasion
(10,35) and poorer clinical staging (36). HMGA1 overexpression induces
inactivation of p53’s apoptotic function to escape apoptosis in
neoplastic transformation (37,38)
and drives stem cell properties in colon cancer cells (39). In our results, HMGA1
expression level was an indicator of poor prognosis in CRC cases
and an independent risk factor for lymph node metastasis. We
consider that these results are due to the anti-apoptotic function
of HMGA1.
Intramucosal CRC generally does not metastasize to
lymph nodes and is thus a good candidate for endoscopic local
resection (40). By contrast, lymph
node metastasis occurs in approximately 6–12% patients with
submucosal invasive CRC, which requires surgical resection,
including lymph node dissection, for curative treatment (41–44).
Despite the low possibility of lymph node metastasis in submucosal
invasive CRC, surgical resection and removal of regional lymph
nodes are considered the standard treatment for this disease
(45). It is noteworthy that tumors
with lymph node metastasis had significantly higher HMGA1
expression levels in subgroup analysis for submucosal invasive CRC
cases in our results. Perhaps submucosal invasive CRC cases without
metastases, which might be cured by endoscopic local resection,
could be extracted by HMGA1 expression level. Further
studies using a larger number of cases are required.
In conclusion, our data strongly support the
clinical significance of HMGA1 expression as a predictive
indicator of lymph node metastasis in CRC cases, even in submucosal
invasive CRC tumors.
Acknowledgements
The present study was supported in part by the
following grants and foundations: CREST, Japan Science and
Technology Agency (JST), and the Funding Program for Next
Generation World-Leading Researchers (LS094). We would like to
thank T. Shimooka, M. Kasagi and T. Kawano for their technical
assistance.
References
|
1
|
Grade M, Hormann P, Becker S, et al: Gene
expression profiling reveals a massive, aneuploidy-dependent
transcriptional deregulation and distinct differences between lymph
node-negative and lymph node-positive colon carcinomas. Cancer Res.
67:41–56. 2007. View Article : Google Scholar
|
|
2
|
Hao JM, Chen JZ, Sui HM, et al: A
five-gene signature as a potential predictor of metastasis and
survival in colorectal cancer. J Pathol. 220:475–489.
2010.PubMed/NCBI
|
|
3
|
Meding S, Balluff B, Elsner M, et al:
Tissue-based proteomics reveals FXYD3, S100A11 and GSTM3 as novel
markers for regional lymph node metastasis in colon cancer. J
Pathol. 228:459–470. 2012.PubMed/NCBI
|
|
4
|
Gunderson LL, Jessup JM, Sargent DJ,
Greene FL and Stewart AK: Revised TN categorization for colon
cancer based on national survival outcomes data. J Clin Oncol.
28:264–271. 2010. View Article : Google Scholar : PubMed/NCBI
|
|
5
|
Weitz J, Koch M, Debus J, Hohler T, Galle
PR and Buchler MW: Colorectal cancer. Lancet. 365:153–165. 2005.
View Article : Google Scholar
|
|
6
|
Nishida K, Mine S, Utsunomiya T, et al:
Global analysis of altered gene expressions during the process of
esophageal squamous cell carcinogenesis in the rat: a study
combined with a laser microdissection and a cDNA microarray. Cancer
Res. 65:401–409. 2005.PubMed/NCBI
|
|
7
|
Quackenbush J: Microarray data
normalization and transformation. Nat Genet. 32(Suppl): 496–501.
2002. View
Article : Google Scholar
|
|
8
|
Brazma A, Hingamp P, Quackenbush J, et al:
Minimum information about a microarray experiment (MIAME)-toward
standards for microarray data. Nat Genet. 29:365–371. 2001.
View Article : Google Scholar : PubMed/NCBI
|
|
9
|
Niida A, Smith AD, Imoto S, Aburatani H,
Zhang MQ and Akiyama T: Gene set-based module discovery in the
breast cancer transcriptome. BMC Bioinformatics. 10:712009.
View Article : Google Scholar : PubMed/NCBI
|
|
10
|
Esposito F, Tornincasa M, Federico A,
Chiappetta G, Pierantoni GM and Fusco A: High-mobility group A1
protein inhibits p53-mediated intrinsic apoptosis by interacting
with Bcl-2 at mitochondria. Cell Death Dis. 3:e3832012. View Article : Google Scholar : PubMed/NCBI
|
|
11
|
Kwon HC, Kim SH, Roh MS, et al: Gene
expression profiling in lymph node-positive and lymph node-negative
colorectal cancer. Dis Colon Rectum. 47:141–152. 2004. View Article : Google Scholar : PubMed/NCBI
|
|
12
|
Koehler A, Bataille F, Schmid C, et al:
Gene expression profiling of colorectal cancer and metastases
divides tumours according to their clinicopathological stage. J
Pathol. 204:65–74. 2004. View Article : Google Scholar
|
|
13
|
Evan GI and Vousden KH: Proliferation,
cell cycle and apoptosis in cancer. Nature. 411:342–348. 2001.
View Article : Google Scholar : PubMed/NCBI
|
|
14
|
Thiery JP, Acloque H, Huang RY and Nieto
MA: Epithelial-mesenchymal transitions in development and disease.
Cell. 139:871–890. 2009. View Article : Google Scholar : PubMed/NCBI
|
|
15
|
Acloque H, Adams MS, Fishwick K,
Bronner-Fraser M and Nieto MA: Epithelial-mesenchymal transitions:
the importance of changing cell state in development and disease. J
Clin Invest. 119:1438–1449. 2009. View
Article : Google Scholar : PubMed/NCBI
|
|
16
|
Reya T, Morrison SJ, Clarke MF and
Weissman IL: Stem cells, cancer, and cancer stem cells. Nature.
414:105–111. 2001. View
Article : Google Scholar : PubMed/NCBI
|
|
17
|
Ailles LE and Weissman IL: Cancer stem
cells in solid tumors. Curr Opin Biotechnol. 18:460–466. 2007.
View Article : Google Scholar : PubMed/NCBI
|
|
18
|
Grosschedl R, Giese K and Pagel J: HMG
domain proteins: architectural elements in the assembly of
nucleoprotein structures. Trends Genet. 10:94–100. 1994. View Article : Google Scholar : PubMed/NCBI
|
|
19
|
Reeves R and Nissen MS: The
A.T-DNA-binding domain of mammalian high mobility group I
chromosomal proteins. A novel peptide motif for recognizing DNA
structure. J Biol Chem. 265:8573–8582. 1990.PubMed/NCBI
|
|
20
|
Reeves R: Structure and function of the
HMGI(Y) family of architectural transcription factors. Environ
Health Perspect. 108(Suppl 5): 803–809. 2000. View Article : Google Scholar : PubMed/NCBI
|
|
21
|
Zhou X, Benson KF, Ashar HR and Chada K:
Mutation responsible for the mouse pygmy phenotype in the
developmentally regulated factor HMGI-C. Nature. 376:771–774. 1995.
View Article : Google Scholar : PubMed/NCBI
|
|
22
|
Chiappetta G, Avantaggiato V, Visconti R,
et al: High level expression of the HMGI (Y) gene during embryonic
development. Oncogene. 13:2439–2446. 1996.PubMed/NCBI
|
|
23
|
Chiappetta G, Bandiera A, Berlingieri MT,
et al: The expression of the high mobility group HMGI (Y) proteins
correlates with the malignant phenotype of human thyroid
neoplasias. Oncogene. 10:1307–1314. 1995.PubMed/NCBI
|
|
24
|
Chiappetta G, Tallini G, De Biasio MC, et
al: Detection of high mobility group I HMGI(Y) protein in the
diagnosis of thyroid tumors: HMGI(Y) expression represents a
potential diagnostic indicator of carcinoma. Cancer Res.
58:4193–4198. 1998.
|
|
25
|
Fedele M, Bandiera A, Chiappetta G, et al:
Human colorectal carcinomas express high levels of high mobility
group HMGI(Y) proteins. Cancer Res. 56:1896–1901. 1996.PubMed/NCBI
|
|
26
|
Abe N, Watanabe T, Sugiyama M, et al:
Determination of high mobility group I(Y) expression level in
colorectal neoplasias: a potential diagnostic marker. Cancer Res.
59:1169–1174. 1999.PubMed/NCBI
|
|
27
|
Chiappetta G, Manfioletti G, Pentimalli F,
et al: High mobility group HMGI(Y) protein expression in human
colorectal hyperplastic and neoplastic diseases. Int J Cancer.
91:147–151. 2001. View Article : Google Scholar : PubMed/NCBI
|
|
28
|
Tamimi Y, van der Poel HG, Denyn MM, et
al: Increased expression of high mobility group protein I(Y) in
high grade prostatic cancer determined by in situ hybridization.
Cancer Res. 53:5512–5516. 1993.PubMed/NCBI
|
|
29
|
Abe N, Watanabe T, Izumisato Y, et al:
Diagnostic significance of high mobility group I(Y) protein
expression in intraductal papillary mucinous tumors of the
pancreas. Pancreas. 25:198–204. 2002. View Article : Google Scholar : PubMed/NCBI
|
|
30
|
Bandiera A, Bonifacio D, Manfioletti G, et
al: Expression of HMGI(Y) proteins in squamous intraepithelial and
invasive lesions of the uterine cervix. Cancer Res. 58:426–431.
1998.PubMed/NCBI
|
|
31
|
Masciullo V, Baldassarre G, Pentimalli F,
et al: HMGA1 protein over-expression is a frequent feature of
epithelial ovarian carcinomas. Carcinogenesis. 24:1191–1198. 2003.
View Article : Google Scholar : PubMed/NCBI
|
|
32
|
Chiappetta G, Botti G, Monaco M, et al:
HMGA1 protein overexpression in human breast carcinomas:
correlation with ErbB2 expression. Clin Cancer Res. 10:7637–7644.
2004. View Article : Google Scholar : PubMed/NCBI
|
|
33
|
Pomeroy SL, Tamayo P, Gaasenbeek M, et al:
Prediction of central nervous system embryonal tumour outcome based
on gene expression. Nature. 415:436–442. 2002. View Article : Google Scholar : PubMed/NCBI
|
|
34
|
Ben-Porath I, Thomson MW, Carey VJ, et al:
An embryonic stem cell-like gene expression signature in poorly
differentiated aggressive human tumors. Nat Genet. 40:499–507.
2008. View
Article : Google Scholar : PubMed/NCBI
|
|
35
|
Mu G, Liu H, Zhou F, et al: Correlation of
overexpression of HMGA1 and HMGA2 with poor tumor differentiation,
invasion, and proliferation associated with let-7 down-regulation
in retinoblastomas. Hum Pathol. 41:493–502. 2010. View Article : Google Scholar : PubMed/NCBI
|
|
36
|
Balcerczak M, Pasz-Walczak G, Balcerczak
E, Wojtylak M, Kordek R and Mirowski M: HMGI(Y) gene expression in
colorectal cancer: comparison with some histological typing,
grading, and clinical staging. Pathol Res Pract. 199:641–646. 2003.
View Article : Google Scholar : PubMed/NCBI
|
|
37
|
Pierantoni GM, Rinaldo C, Mottolese M, et
al: High-mobility group A1 inhibits p53 by cytoplasmic
relocalization of its proapoptotic activator HIPK2. J Clin Invest.
117:693–702. 2007. View Article : Google Scholar : PubMed/NCBI
|
|
38
|
Esposito F, Tornincasa M, Chieffi P, De
Martino I, Pierantoni GM and Fusco A: High-mobility group A1
proteins regulate p53-mediated transcription of Bcl-2 gene. Cancer
Res. 70:5379–5388. 2010. View Article : Google Scholar : PubMed/NCBI
|
|
39
|
Belton A, Gabrovsky A, Bae YK, et al:
HMGA1 induces intestinal polyposis in transgenic mice and drives
tumor progression and stem cell properties in colon cancer cells.
PloS One. 7:e300342012. View Article : Google Scholar : PubMed/NCBI
|
|
40
|
Morson BC, Whiteway JE, Jones EA, Macrae
FA and Williams CB: Histopathology and prognosis of malignant
colorectal polyps treated by endoscopic polypectomy. Gut.
25:437–444. 1984. View Article : Google Scholar : PubMed/NCBI
|
|
41
|
Kyzer S, Begin LR, Gordon PH and Mitmaker
B: The care of patients with colorectal polyps that contain
invasive adenocarcinoma. Endoscopic polypectomy or colectomy?
Cancer. 70:2044–2050. 1992. View Article : Google Scholar : PubMed/NCBI
|
|
42
|
Minamoto T, Mai M, Ogino T, et al: Early
invasive colorectal carcinomas metastatic to the lymph node with
attention to their nonpolypoid development. Am J Gastroenterol.
88:1035–1039. 1993.PubMed/NCBI
|
|
43
|
Nusko G, Mansmann U, Partzsch U, et al:
Invasive carcinoma in colorectal adenomas: multivariate analysis of
patient and adenoma characteristics. Endoscopy. 29:626–631. 1997.
View Article : Google Scholar : PubMed/NCBI
|
|
44
|
Cooper HS: Surgical pathology of
endoscopically removed malignant polyps of the colon and rectum. Am
J Surg Pathol. 7:613–623. 1983. View Article : Google Scholar : PubMed/NCBI
|
|
45
|
Colacchio TA, Forde KA and Scantlebury VP:
Endoscopic polypectomy: inadequate treatment for invasive
colorectal carcinoma. Ann Surg. 194:704–707. 1981. View Article : Google Scholar : PubMed/NCBI
|