Introduction
Breast cancer, a complex and heterogeneous disease,
is a leading cause of cancer death in women. Each year, there are
over 1.5 million newly diagnosed cases, and 500,000 women worldwide
die of this disease (1). Despite
combined treatment with surgery, radiotherapy, and anticancer
drugs, many breast cancer patients will ultimately develop
metastatic disease, at present incurable (2). Various epidemiological studies have
revealed that multiple factors including hormones, genetics,
reproductive history, radiation, socio-economic status, place of
residence, ethnicity, and the environment affect the incidence of
breast cancer (3). The main
therapeutic principles are to find the cellular signaling regulator
of the breast cancer. Cellular signaling that govern cell
proliferation, motility and survival are often deregulated in
cancer cells (4–6). Such regulation is managed by signaling
pathways acting through transcription factors that control
expression of specialized genes and their protein products to
control the differentiation as well as bioenergetic capacity of
cancer cells (7,8).
Of these signaling pathways, increasing attention
has been placed on mammalian target of rapamycin (mTOR) pathway,
which is recognized as serine/threonine protein kinase important
for cellular growth, proliferation, motility and survival (9). It belongs to the family of
phosphatidylinositol 3-kinase-related kinases, and dysregulation is
associated with various diseases including several malignancies
(10).
Mitochondrial biogenesis is regulated by a set of
transcription factors that include nuclear respiratory factor 1
(NRF1) and NRF2, mitochondrial transcription factor A (mtTFA), the
peroxisome proliferator-activated receptors (PPARs) coactivator 1α
(PGC-1α) and PGC-1β transcriptional coactivators (11,12).
PGC-1 proteins additionally serve as mediators between various
external physiological stress conditions that enhance mitochondrial
activity as well as drive the formation of slow type I myofibers
and their associated oxidative metabolic phenotype (13). Relatively little is known about what
controls PGC-1 gene expression or other mitochondrial regulators,
although some myogenic factors have been identified (14,15).
The nutrient sensor, mTOR, was also shown to promote mitochondrial
oxidative function through transcriptional control of PGC-1
(16,17).
In the present study, we hypothesized that PGC-1β
has a critical role in breast cancer cell growth through regulation
of the mTOR signaling pathway. To test this hypothesis,
short-hairpin RNA (shRNA)-specific PGC-1β was generated and the
expression of mTOR pathway-related genes in MDA-MB-231 cells was
investigated. Consistent with this hypothesis, phosphorylation of
AMP-activated protein kinase (AMPK), phosphorylation of Rictor on
Thr1135, Raptor and S6 protein is inhibited. Addtionally, Akt
phosphorylation on Ser473 is upregulated and cell apoptosis by
PGC-1β occurs. These findings provide novel insights into how
breast cancer cells are protected and highlight the importance of
PGC-1β in regulation of breast cancer cell apoptosis.
Materials and methods
Plasmids
pcDNA3.1-PGC-1β for the expression of human
full-length PGC-1β was a gift from Ling Wang (Peking Union Medical
College, China). Adenoviral vectors expressing green fluorescent
protein (GFP), PGC-1α or ERRα were generated using the AdEasy
system. The pGenesil vector expressing shRNAs against PGC-1β
(shPGC-1β) was constructed by our laboratory, targeting the
sequence 5′-ttgtacagaactacataagcac-3′ of human PGC-1β. All plasmid
constructs were verified by sequencing.
Cell culture
Human embryonic kidney 293 (HEK293) cells, from
Microbix Biopharmaceuticals (Toronto, ON, Canada) and human breast
cancer cells MDA-MB-231 from American Type Culture Collection
(ATCC, Manassas, VA, USA) were cultured in Dulbecco’s modified
Eagle’s medium (DMEM) supplemented with 10% fetal bovine serum
(FBS), 2 mM L-glutamine, 100 U/ml penicillin, and 100 μg/ml
streptomycin in a humidified atmosphere of 5% CO2 at
37°C.
Immunohistochemistry (IHC) analysis
The study population consists of the carcinoma of
breast treated between July, 2008 and March, 2012 at General
Hospital of Ningxia Medical University which are the main hospitals
for the treatment of breast cancer in Yinchuan, China. IHC study
was performed on paraffin-embedded, formalin-fixed tissue sections
using a commercial available Ultra Sensitive™ SP kit (Santa Cruz
Biotechnology, Inc., Santa Cruz, CA, USA), following the
manufacturer’s instructions and the guideline recommendations for
human PGC-1β testing in breast cancer. Briefly, this procedure
included the deparaffinization and rehydration steps, followed by
an epitope retrieval step in which the tissue sample was incubated
in a citrate buffer solution at 90–95°C for 20 min. The slides were
then subjected to a series of alternating washes in PBS buffer and
incubation steps with, first, a peroxidase-blocking reagent for 5
min and then with PGC-1β primary antibody, followed by a
visualization reagent for 30 min each, and finally with a
3,3′-diaminobenzidine chromogen solution. After a final wash, the
slides were counterstained with haematoxylin.
RNA isolation and quantitative real-time
PCR (qRT-PCR)
Total RNA from cultured cells was extracted using
TRIzol reagent (Invitrogen). cDNA was then reverse-transcribed and
amplified by PCR using a Transcriptor Reverse Transcriptase kit
(Roche). qRT-PCR was carried out using the SYBR-Green PCR system on
a Bio-Rad iQ5, and results were normalized to
glyceraldehyde-3-phosphate dehydrogenase (GAPDH) or cyclophilin A.
The sequences of primers are shown in Table I.
 | Table IPrimers of hCD40L. |
Table I
Primers of hCD40L.
| Primer | Forward
(5′–3′) | Reverse
(5′–3′) |
|---|
| COX I |
GGATTTGTTCACTGATTCCCATT |
CATCTGGGTAGTCTGAGTAGCG |
| COX II |
AGGCCGACTAAATCAAGCAAC | CTAGGACAAT
GGGCATAAAG |
| COX VIIa |
ATGAGGGCCCTACGGGTCT |
CATTGTCGGCCTGGAAGAG |
| Cyclophilin A |
TTCCTCCTTTCACAGAATTATTCC |
CCGCCAGTGCCATTATGG |
| GAPDH |
GGAGCGAGATCCCTCCAAAAT |
GGCTGTTGTCATACTTCTCATGG |
Western blot analysis
After treatments, cells were lysed by the addition
of cold RIPA buffer [150 mM NaCl, 50 mM Tris HCl, 0.1% SDS, 1%
Triton X-100, 1 mM PMSF, 2 mM NaF, Na3VO4,
β-glycerophosphate and 2 mM EDTA, and fresh protease inhibitor
cocktail (Sigma Aldrich)], and cell lysate was centrifuged at
14,000 × g at 4°C for 20 min. The supernatant was harvested and
analyzed for protein content using protein assay dye. Protein was
denatured in sample buffer, then separated on SDS-PAGE, and
transferred to polyvinylidene difluoride (PVDF) membranes using a
semi-dry Trans-Blot system. The blots were blocked for 1 h at room
temperature with Tris-buffered saline (TBS, 50 mM Tris-HCl, pH 7.5,
150 mM NaCl) containing 5% non-fat milk. The blots were washed
three times with TBST (50 mM Tris-HCl, pH 7.5, 150 mM NaCl and
0.02% Tween-20) and incubated with the indicated primary antibody
at 4°C overnight. The next day, the blots were incubated for 1 h at
room temperature with secondary antibody (1:5,000 dilutions), and
detected by ECL detection reagent. To ensure that equal amounts of
sample protein were applied for electrophoresis, GAPDH or the
indicated proteins were used as an internal control.
Cells were pretreated for the AMP and ATP
measurements
The AMP and ATP expression level was measured.
Briefly, culture medium was removed, cells were washed with
ice-cold PBS, and 500 ml of ice-cold 0.4 M perchloric acid was
added. The culture dishes were cooled to −80°C then cell lysates
were thawed on ice, scraped off, and transferred to microfuge
tubes. Samples were centrifuged at 15,000 × g for 10 min at 4°C.
The supernatant was neutralized with 50 ml 4 M
K2CO3, kept on ice for 10 min, and placed at
−80°C for 2 h to allow precipitation of the perchlorate. Samples
were centrifuged again and supernatants were kept at −80°C until
nucleotide measurements.
AMP determination by HPLC
For the quantification of AMP present in MDA-MB-231
cell extracts, the nucleotides were separated by HPLC using a
SynChropak AX100 anion exchange column (Phenomenex). The
nucleotides were eluted isocratically at ambient temperature with a
mobile phase of 125 mM K2HPO4, 0.5 M KCl,
adjusted to pH 6.0 with 5 N NaOH. Forty microliters of nucleotide
cell extracts described above were diluted to 100 ml in the mobile
phase and 50 ml were injected into the instrument. Absorbance was
monitored at 260 nm and retention time for AMP was 7.0 min. The
amount of AMP contained in each fraction was measured by comparing
the height of the peak with a standard curve of AMP, ranging from 0
to 40 pmoles.
ATP determination by fluorometric assay
kit
ATP quantification was performed using the Biovision
ATP Colorimetric/ Fluorometric Assay kit (Cedarlane). Briefly, the
fluorometric assay was performed as described by the manufacturer,
using a standard curve of 0 to 200 pmoles. Ten microliters of
nucleotide extract, diluted to 50 ml with ATP assay buffer, was
used for each quantification. Plates were incubated in the dark for
30 min. Data were acquired on a CytoFluor™ 2350 (Millipore) using
black 96-well assay plates. ATP was quantified by comparing the
absorbance values obtained at 590 nm with those of the standard
curve.
Cell transfection and microscopy
analysis
Cells were grown on coverslips in a 6-well plate and
transfected with 0.5 mg of the GFP-LC3 expression plasmid using
Lipofectamine™ 2000 (Invitrogen) according to the manufacture.
After treatment, as defined in the figure legends, cells were
washed with PBS and fixed with 4% formaldehyde in PBS for 15 min at
room temperature. Coverslips were inverted on a drop of
Fluoromount-G (SouthernBiotech). Transfected cells were observed
and images were taken using a fluorescence microscope (Leica
Microsystems).
Detection of cell apoptosis by flow
cytometry
Cells (1×10⁵) were washed with PBS and
incubated in a solution of 0.5 g/ml FITC-labeled Annexin V for 10
min, washed with PBS and stained by 10 μl of 20 μg/ml propidium
iodide (PI) for 10 min, add 190 μl binding buffer, all the step
following Annexin V-FITC Apoptosis Detection kit I (BD
Biosciences). Cells were then analysis by flow cytometry
(FACSCalibur; BD Biosciences), and CellQuest software. Ten thousand
events are acquired for statistical analysis.
Statistical analysis
All the results were expressed as mean ± standard
error of the mean (SEM). All statistical analysis was evaluated
using GraphPad Prism software (GraphPad Software, Inc., San Diego,
CA, USA). Data were analyzed by the paired t-test, and P-values
<0.05 was considered statistically significant.
Results
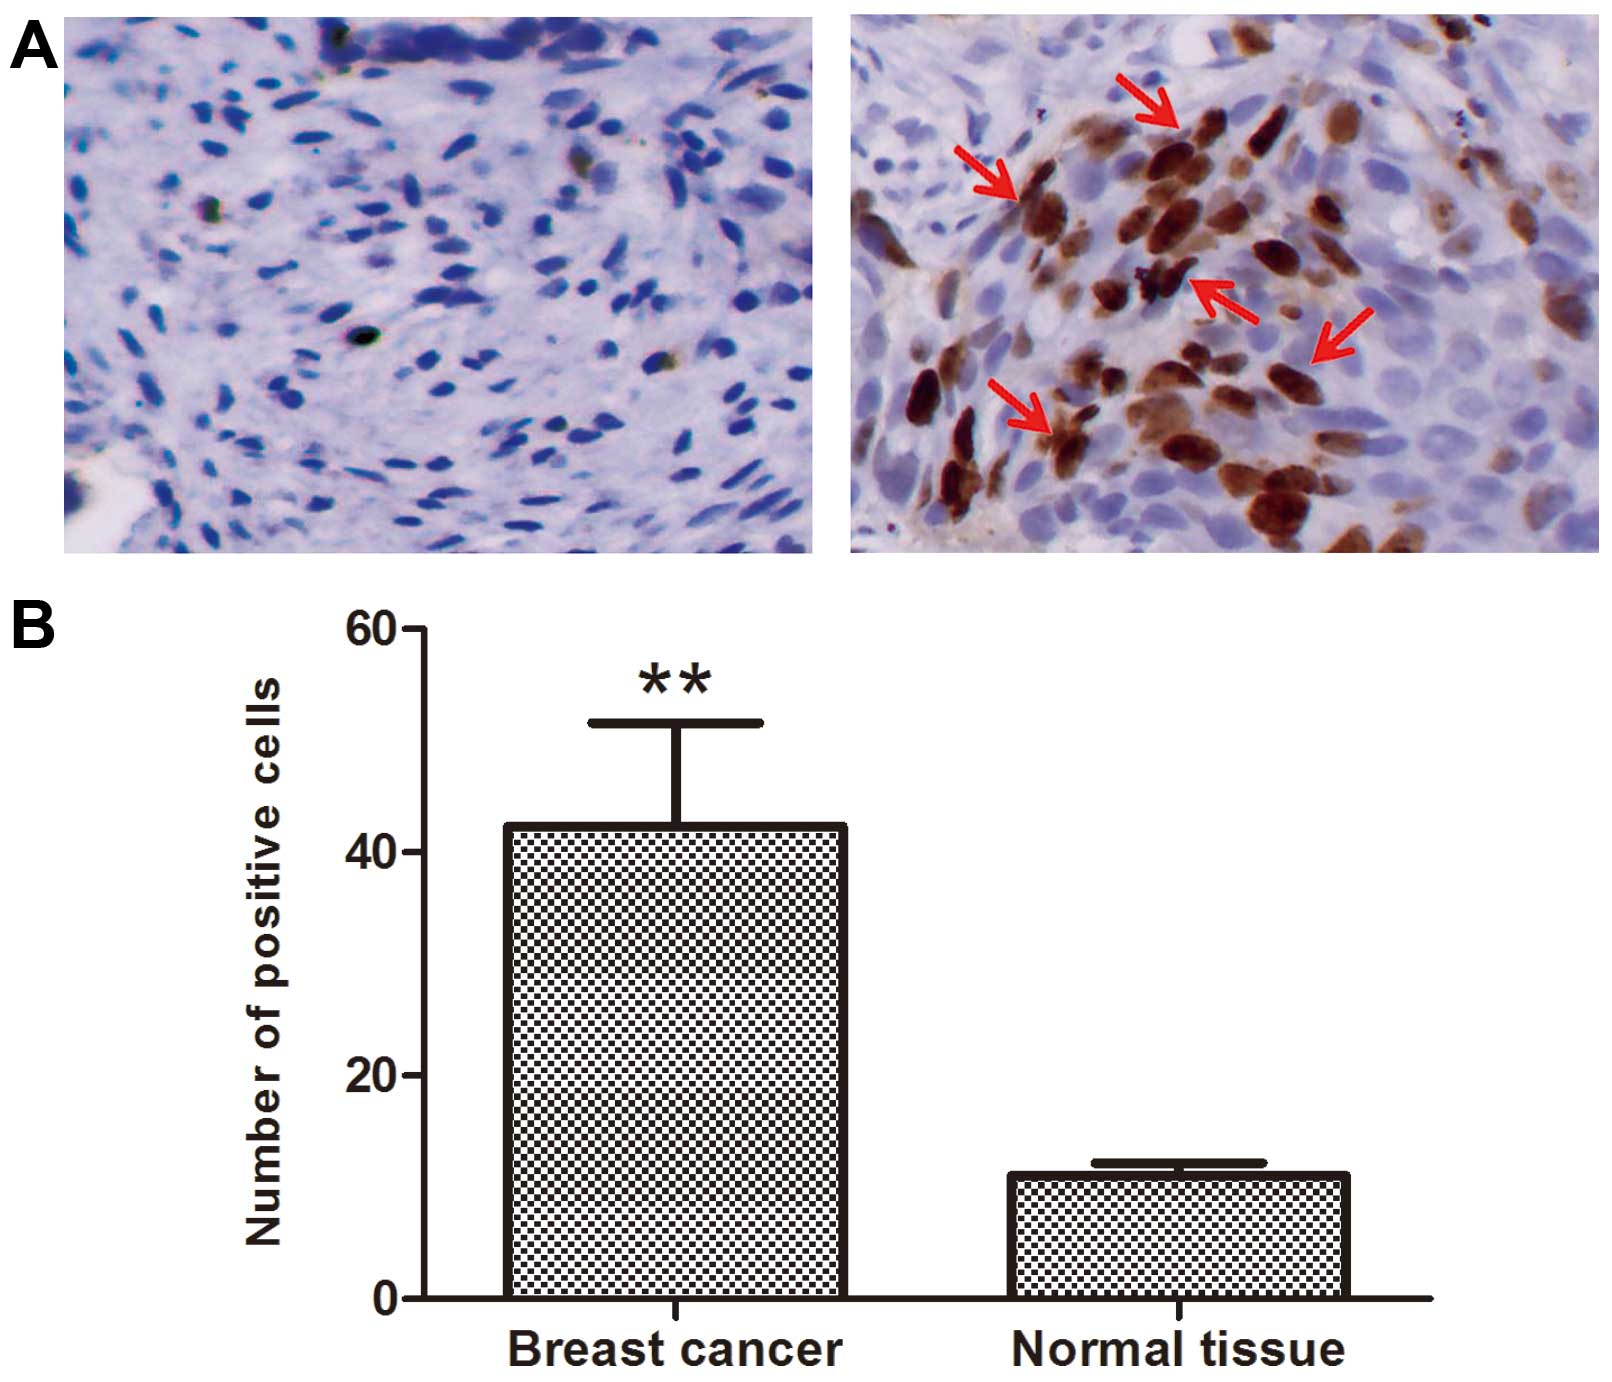
PGC-1β is overexpressed in human breast
cancer tissue vs. normal tissue
We determined the expression pattern of PGC-1β in
clinical human breast normal and cancer samples. Compared to the
normal tissue, the expression of PGC-1β in tumor samples was mostly
increased. We found that breast cancer samples showed strong
immunostaining of PGC-1β compared to normal breast cells,
representative images of both breast cancer and normal are shown in
Fig. 1. PGC-1β was significantly
overexpressed in breast cancer.
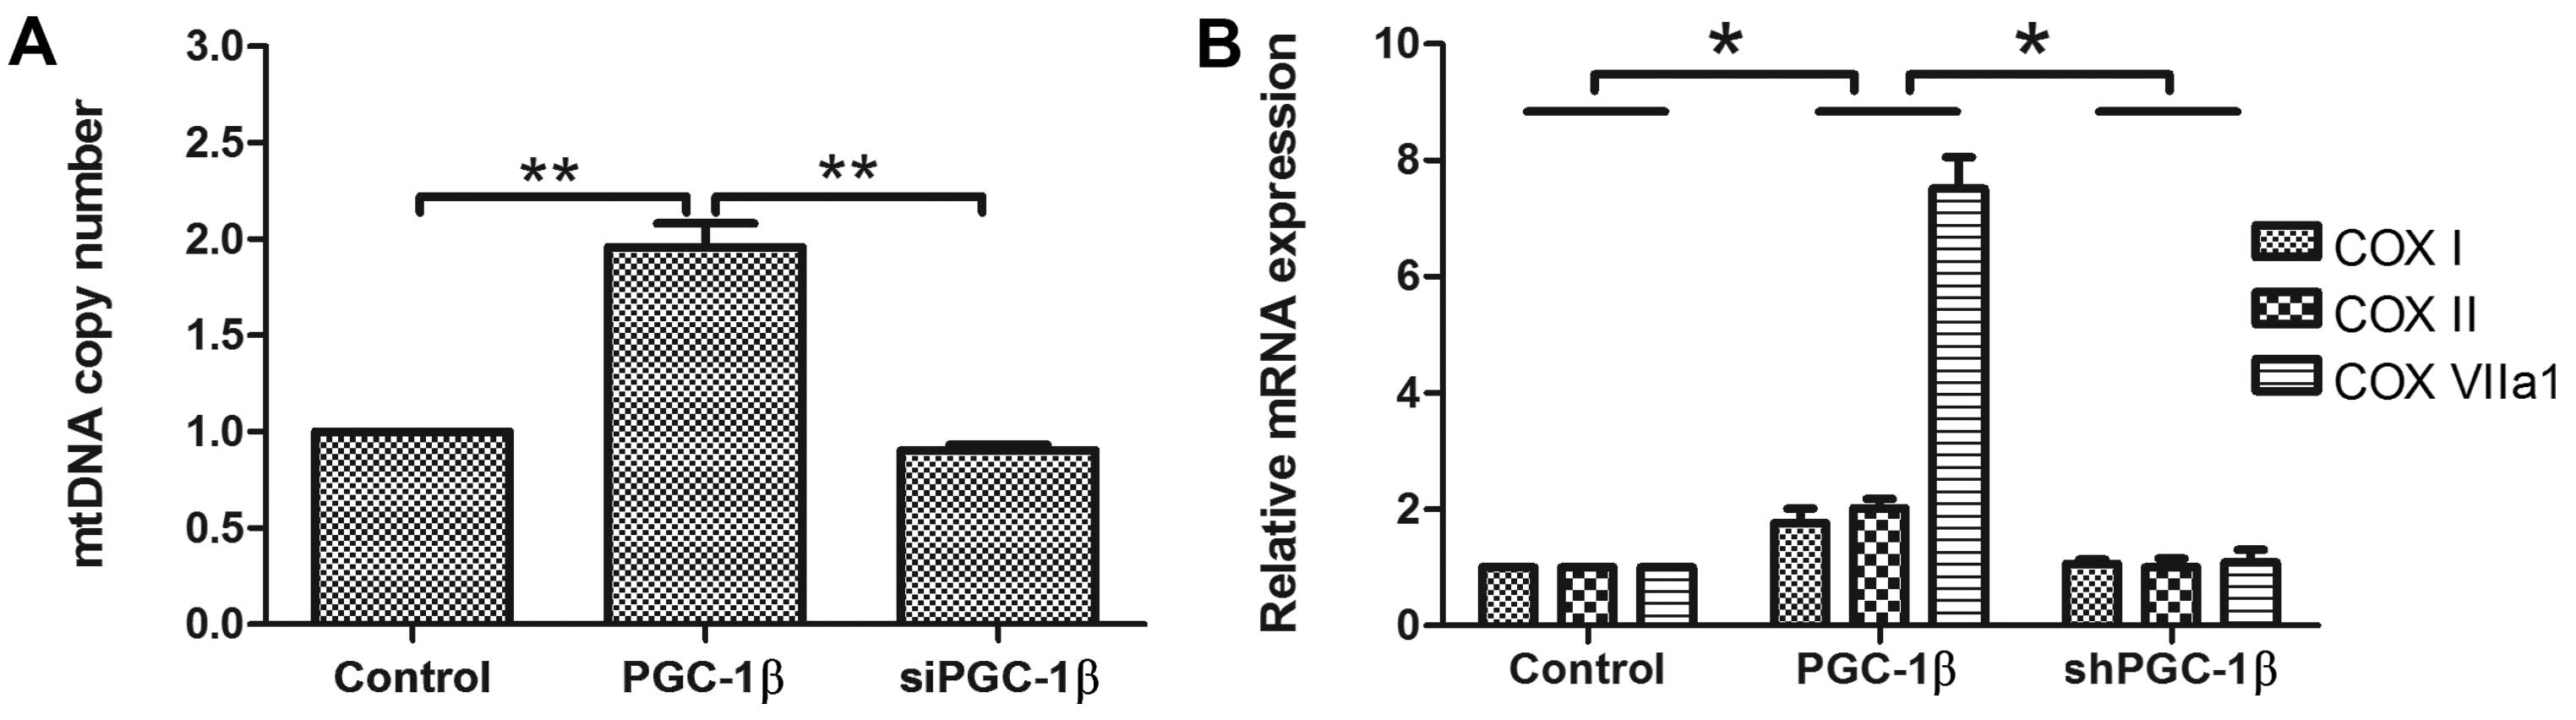
The effects of PGC-1β on intracellular
mitochondrial biogenesis
PGC-1 is suggested to be a potent stimulator of
mitochondrial biogenesis (18,19).
We evaluated the role of PGC-1 on mitochondrial biogenesis. To
measure mitochondrial DNA directly, we isolated total DNA and
determined the relative copy number of mitochondrial DNA by a qPCR
assay of the mitochondrial DNA-encoded cytochrome c oxidase (COX)
II gene. Overexpression of PGC-1β led to an increase in
mitochondrial DNA content/cell by 1.97-fold (Fig. 2A), while inhibition of endogenous
PGC-1β by shRNA changed the basal mitochondrial DNA content
(Fig. 2A). Furthermore, knockdown
of endogenous PGC-1β by shRNA reduced the induction of
mitochondrial biogenesis. In addition, mRNA transcript levels of
COX I and COX II (mitochondrial-encoded) and COX VIIa
(nuclear-encoded) were induced by PGC-1β (Fig. 2B). Knockdown of endogenous PGC-1β
blocked the effect of COX I, COX II and COX VIIa1 gene expression
(Fig. 2B). These results reveal the
important physiological role of PGC-1β in mitochondrial
biogenesis.
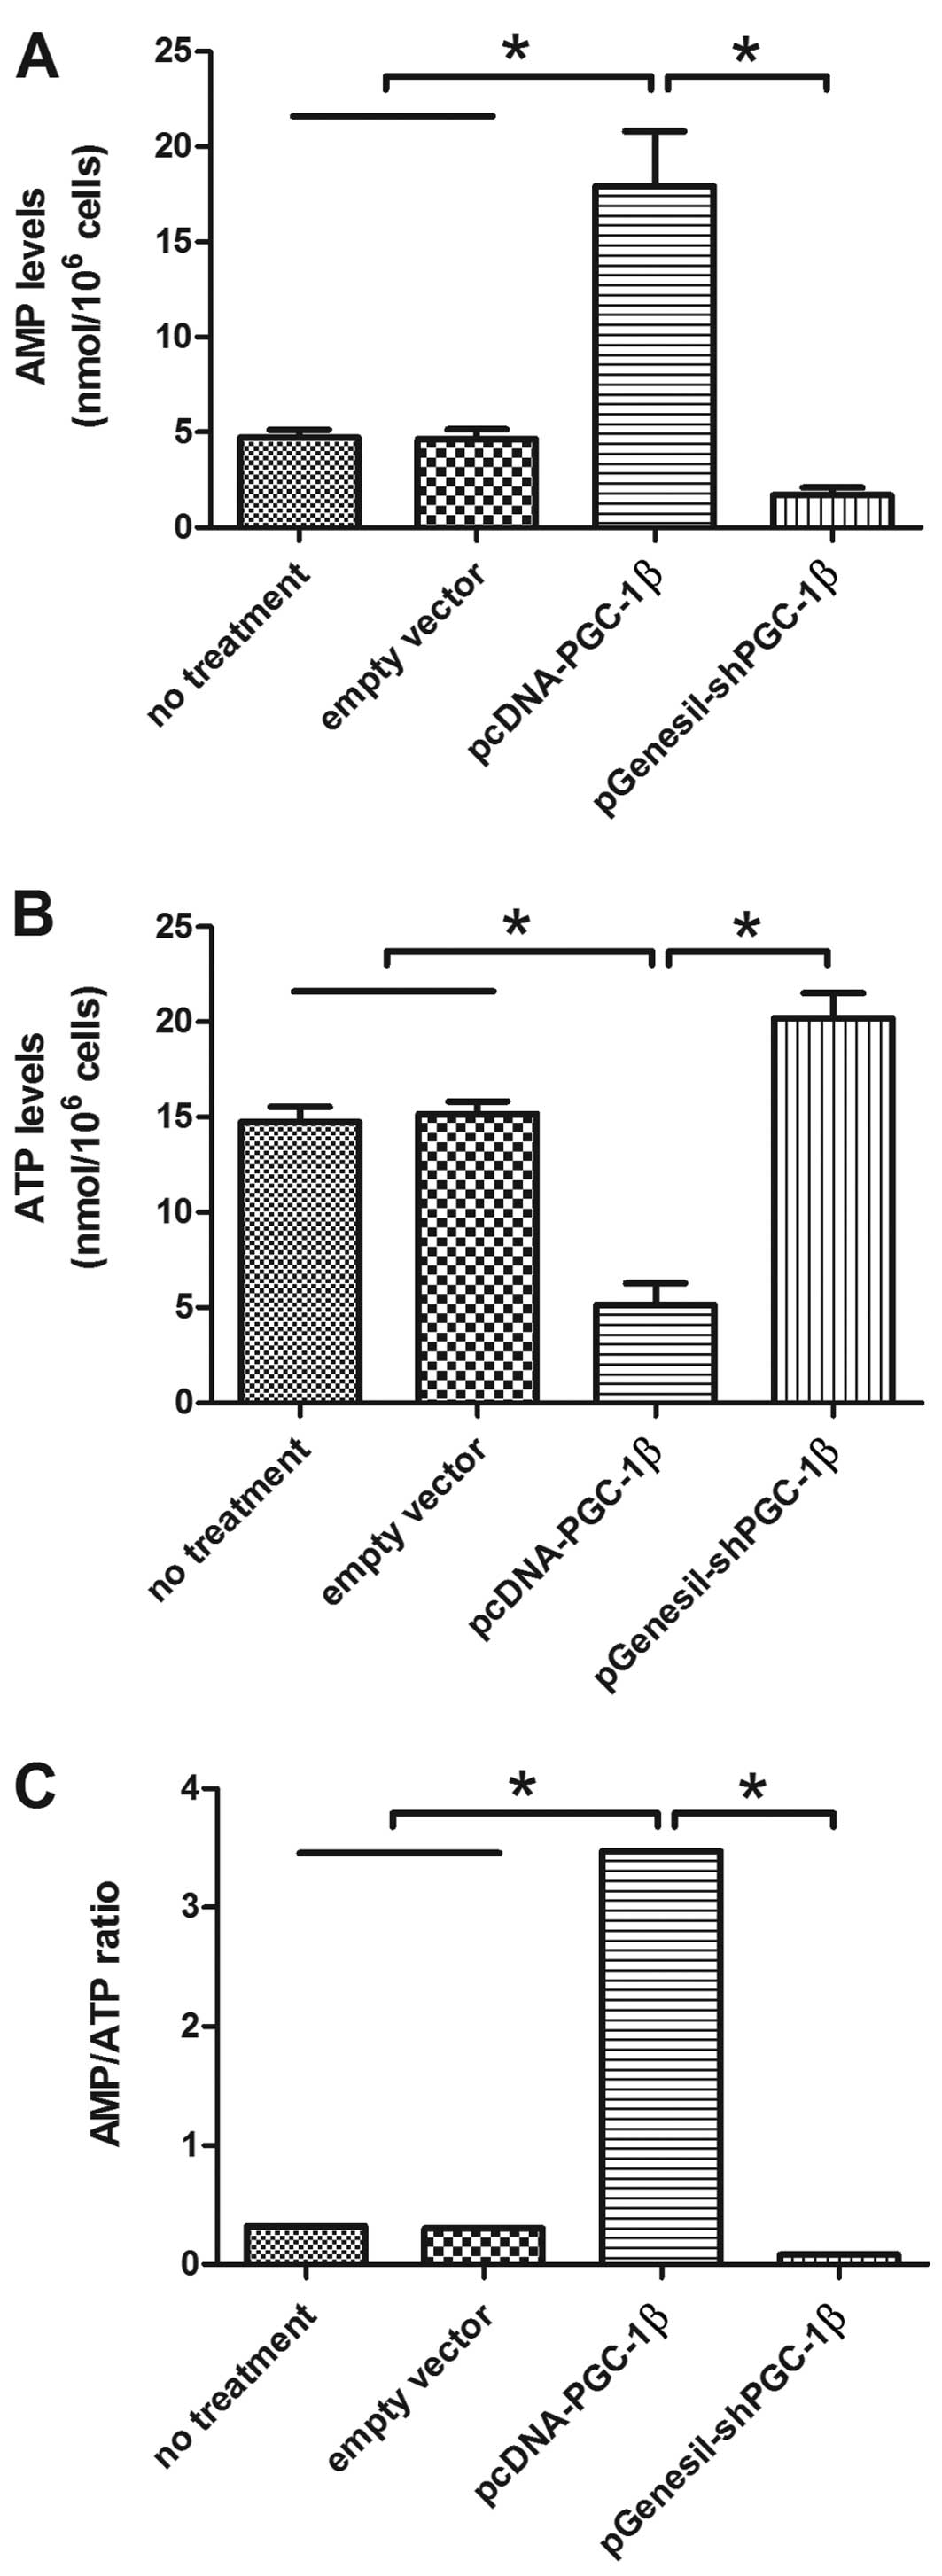
PGC-1β affects AMPK activation and
mTORC1/2 complexes
It is well documented that an increase in AMP/ATP
ratio is the key signal to activate AMPK in an attempt to preserve
cellular energy (20,21). In order to evaluate the energetic
status of cells, we treated MB-MD-231 cells with pcDNA3-PGC-1β or
pGenesil-shPGC-1β, then measured the levels of ATP and AMP after
treatment for 1 h. The drastic increase in AMP levels was observed
after treatment pcDNA3-PGC-1β for 1 h (Fig. 3A). We also observed a drastic
decrease in ATP levels 1 h following pcDNA3-PGC-1β transfection
(Fig. 3B). However, the AMP and ATP
remained at control levels when cells were treated with control
vector (Fig. 3A and B). The
variation in ATP and AMP levels in response to pcDNA3-PGC-1β
treatment is illustrated with the AMP/ATP ratio (Fig. 3C). We observed a significant
increase in the AMP/ATP ratio following pcDNA3-PGC-1β exposure for
1 h (P<0.05). To further validate the role of PGC-1β in
regulating AMP and ATP expression, RNA interference was employed to
knockdown the endogenous PGC-1β expression in MDA-MB-231 cells. AMP
level, AMP/ATP ratio was downregulated and ATP level upregulated
when PGC-1β expression and activity were suppressed with
pGenesil-shPGC-1β. We observed no change in the AMP/ATP ratio when
cells were treated with the control vector (Fig. 3).
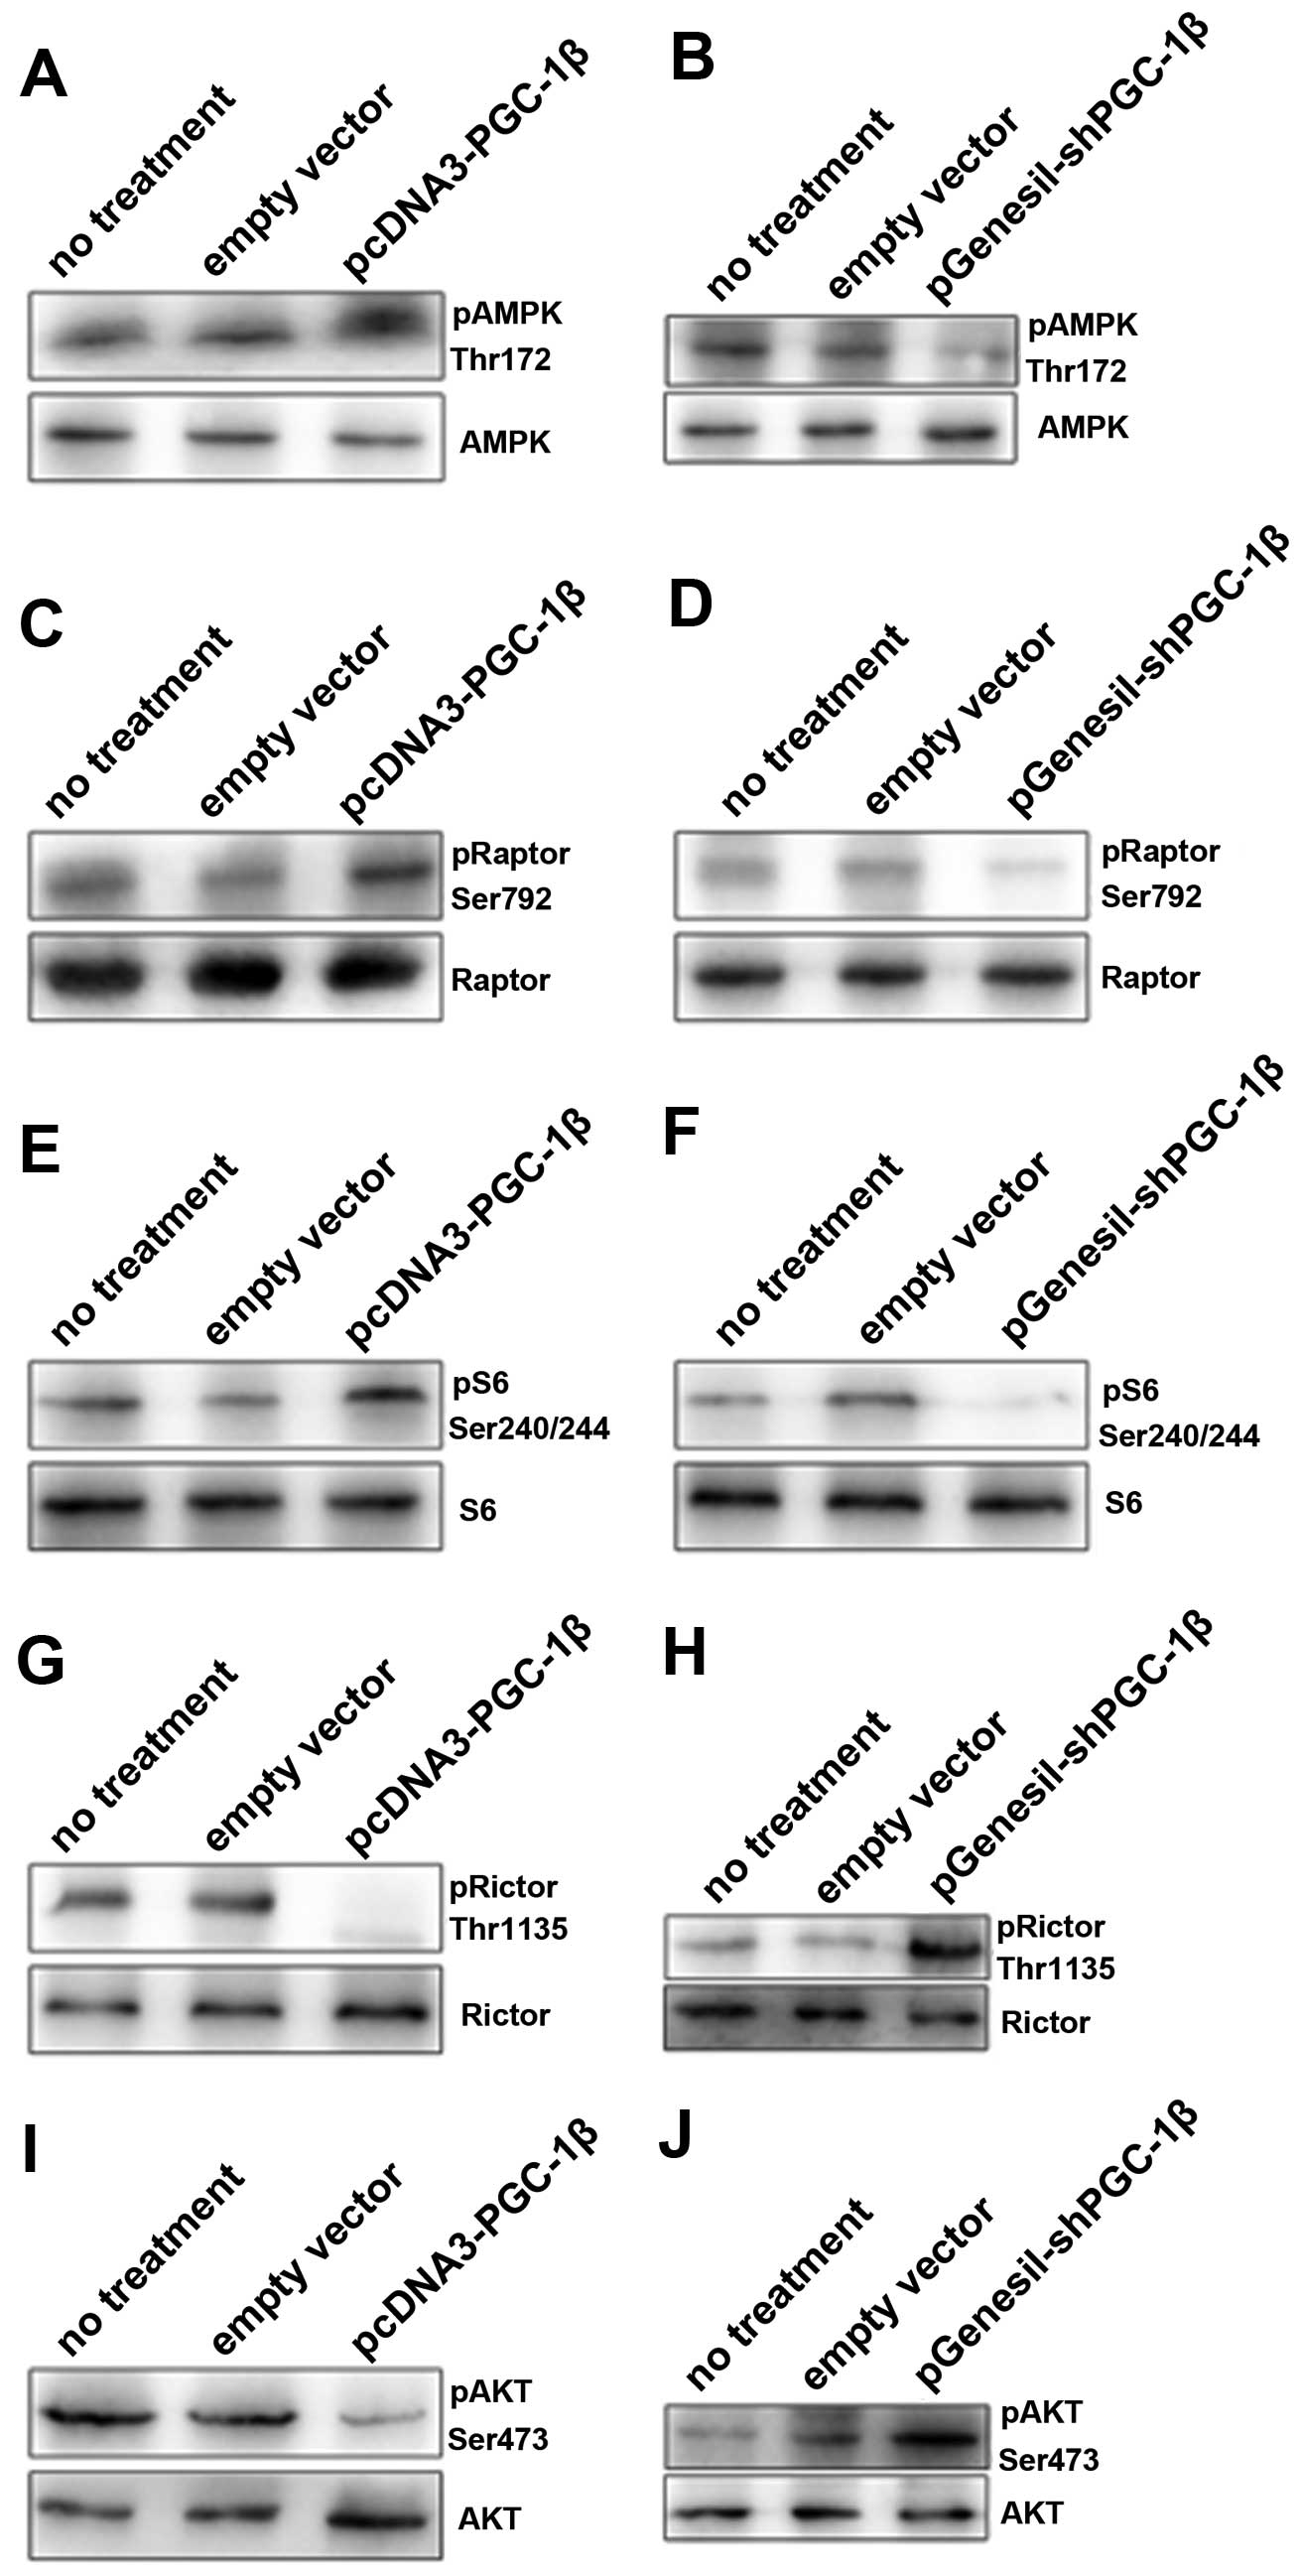
AMPK, the energy sensor of the cell, is a
heterotrimeric Ser/Thr protein kinase activated by alterations in
cellular AMP/ATP ratio (22). In
order to determine whether the increase in AMP/ATP ratio, caused by
PGC-1β upregulation, leads to the activation of AMPK, we analyzed
the phosphorylation levels of AMPK on Thr172 by immunoblotting. We
observed a significant activation of AMPK for 12 h, after
pcDNA3-PGC-1β treatment in MD-MB-231 cells (Fig. 4A). The activation of AMPK is coupled
with an increase in the cellular AMP/ATP ratio (Fig. 3C). Once AMPK activated, the AMPK
inhibits ATP consuming anabolic processes such as protein
translation.
mTOR encompasses two functionally distinct protein
complexes: mTOR complex 1 and complex 2. The mTORC1 consists of
mTOR, raptor, mLST8, and two negative regulators, PRAS40 and
DEPTOR, Raptor being a direct substrate of activated AMPK,
regulates mTOR activity and functions as a scaffold for recruiting
mTORC1 substrates (23). Since AMPK
activation achieves these effects largely through inhibition of
mTOR signaling (24). We observed
concomitant phosphorylation of the mTORC1 component Raptor on
Ser792 (Fig. 4C). Then, we observed
a drastic increase in the phosphorylation of the mTORC1 target S6
ribosomal protein, following pcDNA3-PGC-1β exposure (Fig. 4E). Furthermore, we observed a
significant decrease in the phosphorylation of Rictor on Thr1135,
which is a key component of the mTORC2 complex (Fig. 4G). In MDA-MB-231 cells exposed to
pGenesil-shPGC-1β, the levels of AMPK and phosphorylation of Raptor
were downregulated (Fig. 4D), while
phosphorylation of S6 and Rictor was reversed (Fig. 4F and H), indicating that these
events are specifically triggered by PGC-1β activation.
Interestingly, we observed a significant downregulation of Akt
phosphorylation at Ser473 after pcDNA3-PGC-1β exposure (Fig. 4I), while inhibition of PGC-1β
activation by pGenesil-shPGC-1β treatment led to a sustained and
significant activation of Akt phosphorylation (Fig. 4J).
In summary, these data suggest that the
PGC-1β-dependent AMP accumulation following pcDNA3-PGC-1β exposure
leads to AMPK activation which affects some components of the
mTORC1/2 signaling pathways.
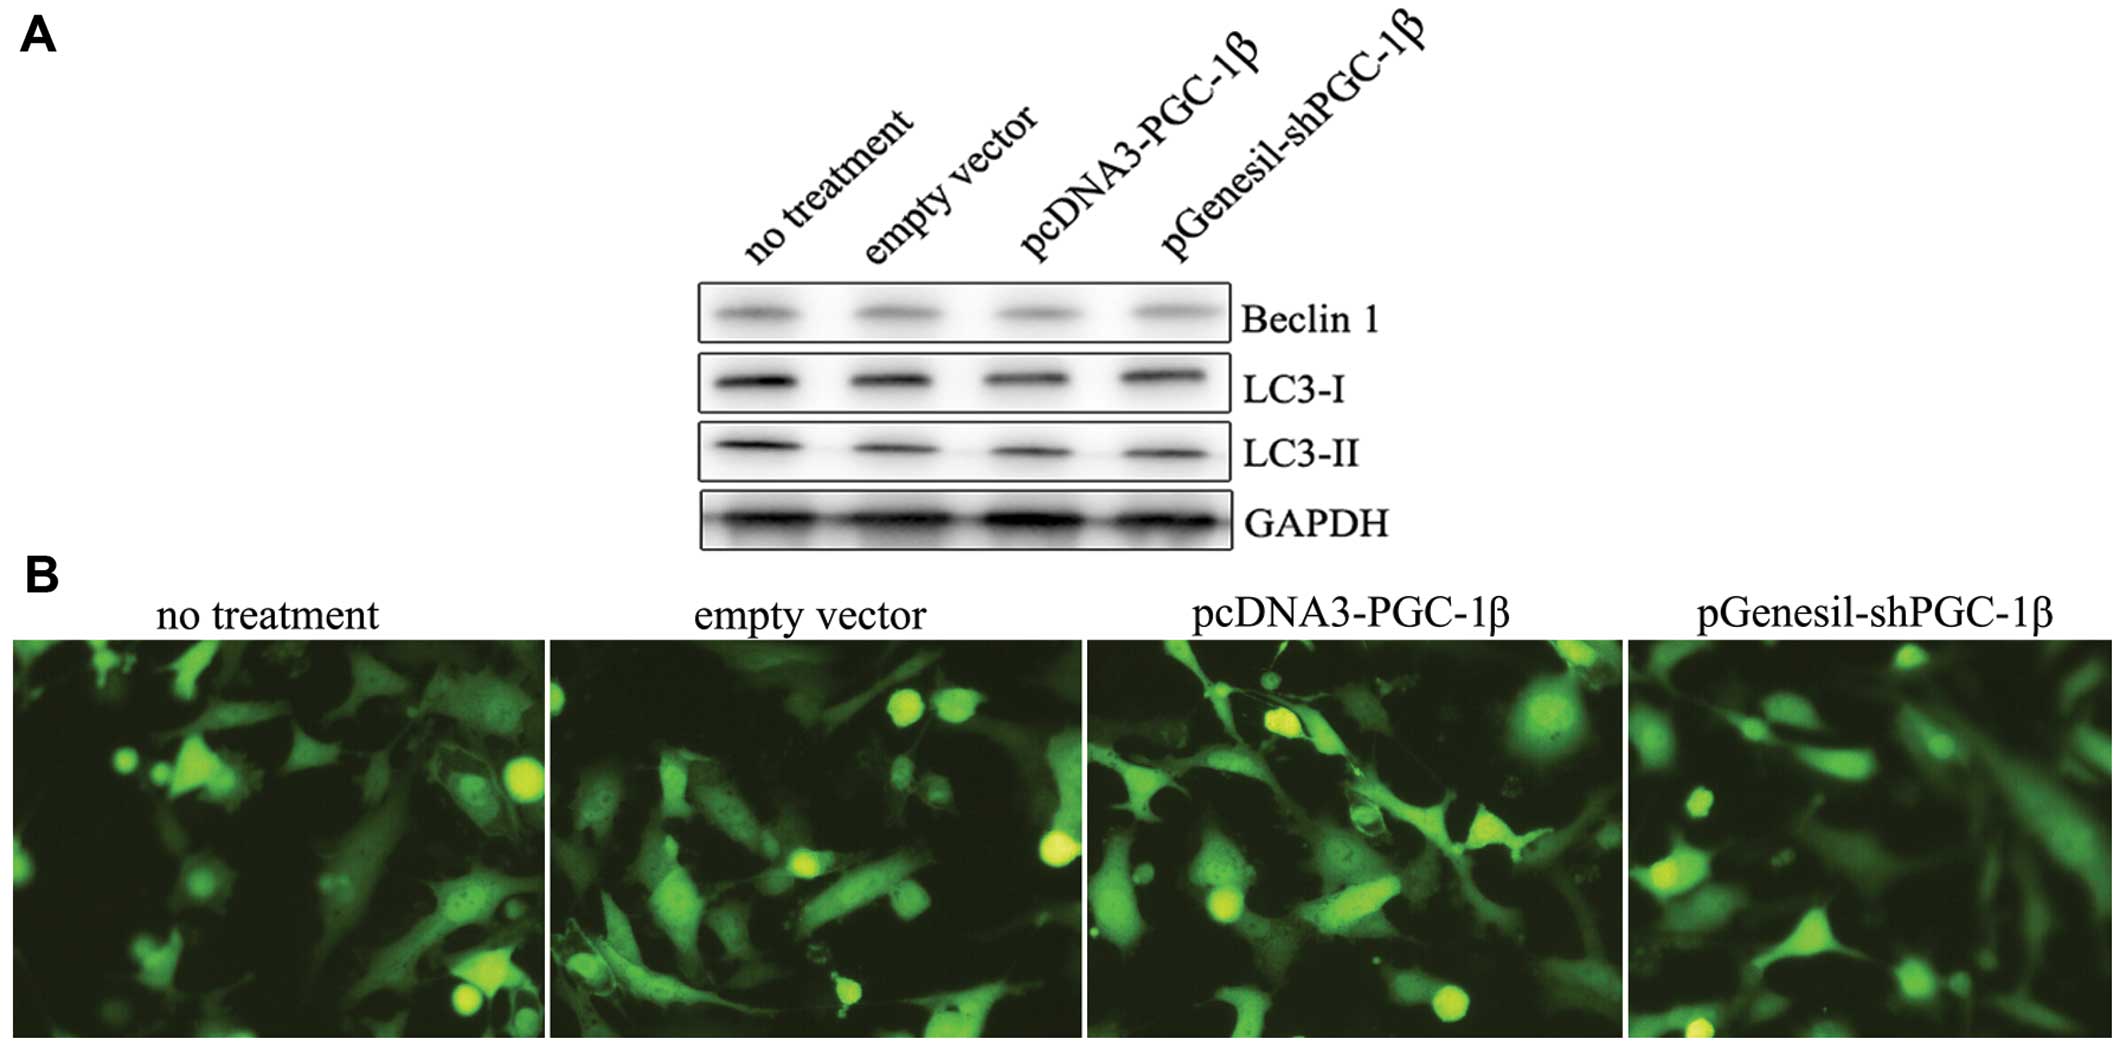
Effect of PGC-1β activation on Beclin 1
expression and on the autophagic marker LC3
The mTOR pathway regulates cell autophagy under
stress conditions, especially response to anticancer agents. Since
we observed that PGC-1β downregulation resulted in the suppression
of mTORC1 signaling, we verified whether autophagy was subsequently
induced. The conversion of LC3-I to LC3-II, a marker for autophagic
vesicles and autophagy activity (25), was analyzed by immunoblotting.
Unexpectedly, we did not observe significant conversion of LC3-I to
LC3-II following PGC-1β overexpression or downregulation (Fig. 5A). Autophagosome formation is
characterized by a punctuated distribution of GFP-LC3. Cells were
transiently transfected with GFP-LC3 and subcellular localization
was detected by fluorescence microscopy. But we did not observed
punctuated GFP fluorescence (Fig.
5B), suggesting that autophagy is not induced following PGC-1β
expression.
We also measured the expression of Beclin 1, which
is an essential autophagic protein (26,27),
and observed no change in the levels of Beclin 1 following PGC-1β
exposure (Fig. 5A). Therefore, our
results suggest that although mTORC1 is activated in MDA-MB-231
cells following pcDNA3-PGC-1β transfection, autophagy is not
induced.
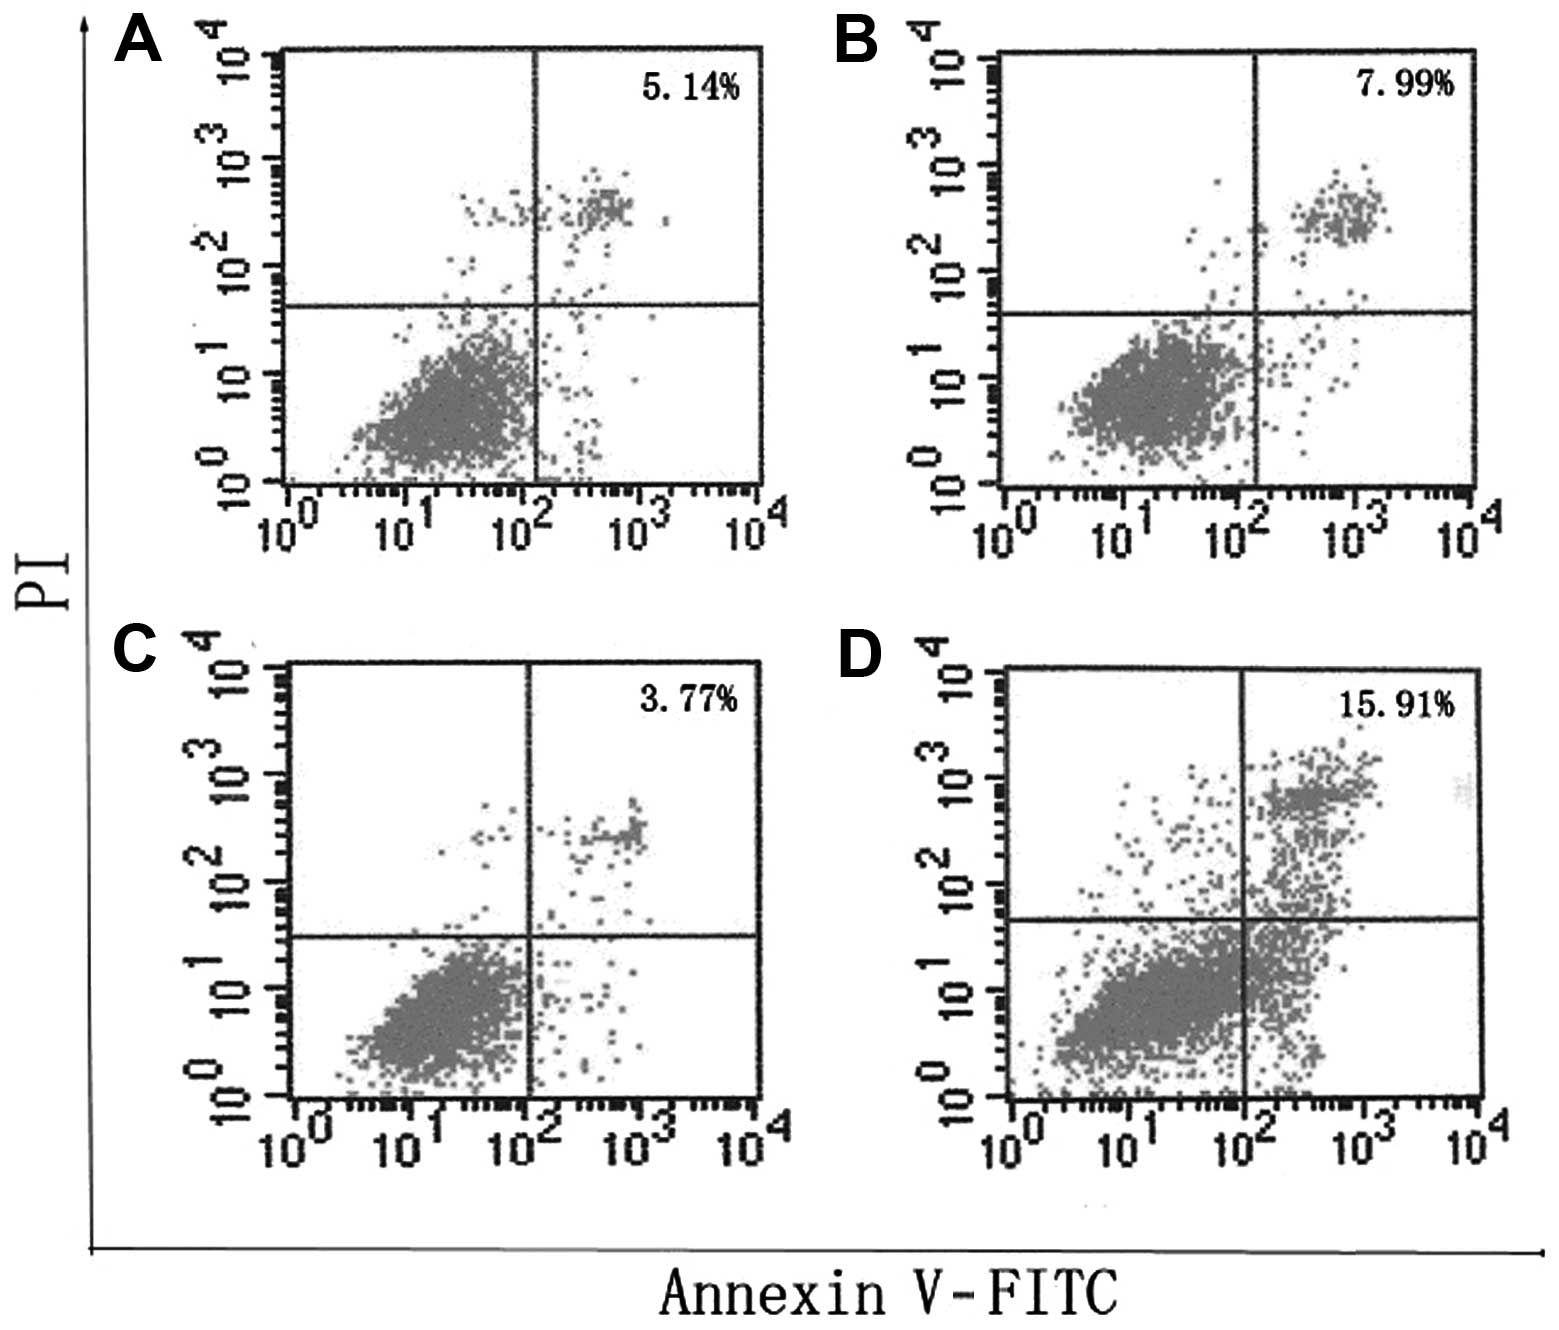
Inhibition of PGC-1β induced cell
apoptosis
To evaluate the percentage of cell apoptosis induced
by PGC-1β, cells were stained with Annexin V-FITC and PI and
analyzed by flow cytometry 24 h after pcDNA3-PGC-1β or
pGenesil-shPGC-1β exposure alone or in the presence of empty
vector. We observed an increase in FITC positive cells, 24 h after
pGenesil-shPGC-1β transfection, which was significantly reduced
when the pcDNA3-PGC-1β was present (Fig. 6).
Discussion
In this study, we have shown that PGC-1β-shRNA
exposure in MDA-MB-231 cells affects mTOR signaling, thus
modulating survival pathways, eventually causing cell death. We
propose that PGC-1β initially affects the mTORC1 signaling complex.
The increase in AMP levels leads to AMPK activation. We therefore
hypothesize that AMPK activation induced by the increase in the
AMP/ATP ratio following PAR synthesis inhibits mTORC1 in an attempt
to preserve cellular energy.
The balance between survival and death signals is
essential to cell fate. In our model, PGC-1β activation is rapid
and intense and although at first, in an attempt to survive,
activation of AMPK and inhibition of mTORC1 occur, the detrimental
effects of free ADP-ribose polymers, free ADP-ribose and
NAD+ depletion overcome the beneficial effect of AMPK
activation. Furthermore, our results suggest that mitochondria
production contributes to PGC-1β activation (Fig. 2B). After exposure to PGC-1β, the
Beclin 1, LC3-I and LC3-II modulation was not changed (Fig. 5).
Previous studies have shown that the PGC-1 family of
coactivators is a potent stimulator of mitochondrial respiration
and gene transcription in liver, heart, and skeletal muscle
(28,29). It has been shown that PGC-1 acts by
activating the NRF1 and NRF2 that in turn regulate expression of
mtTFA, essential for replication, maintenance, and transcription of
mitochondrial DNA (30). PGC-1 is
also important for the expression of nuclear genes encoding
respiratory chain subunits and other proteins that are required for
proper mitochondrial functions (31). Our studies demonstrate that PGC-1β
activation may trigger apoptotic responses, depending on cell type
and functional signaling pathways. Tumorigenesis is a complex,
multistep process characterized by the dysregulation of many
signaling cascades, including the mTOR signaling pathway (32). Many of mTOR’s upstream regulators
and downstream effectors are aberrantly activated in different
types of human cancer, heightening interest in mTOR signaling.
Because the malignant phenotype depends on these signaling
proteins, it is not surprising that mTOR is viewed as a potential
target for cancer therapy. Therefore, various approaches to
inhibiting the mTOR signaling pathway are being pursued for
clinical development (33,34).
It has been shown that phosphorylation of Raptor by
AMPK induces a metabolic check-point to inhibit cell growth
(23). Activation of AMPK and
subsequent suppression of mTORC1 activity can also induce a
cytoprotective autophagic response (35,36).
In our model, we observed AMPK activation and Raptor
phosphorylation following PGC-1β overexpression (Fig. 4A and C).
Autophagy is an apoptosis-alternative pathway to
induce cell death, PGC-1β-shRNA can downregulate the AMPK
activation and induce tumor cell apoptosis, but can not affect
autophagy. Our study showed the change of autophagic competent
LC3-II did not occur with or without PGC-1β (Fig. 5A). In addition, the lack of
formation of a punctuate signal of GFP-LC3 transiently transfected
in cancer cells (Fig. 5B), and the
unaltered Beclin 1 expression (Fig.
5A), indicate that autophagy is not induced.
In conclusion, these results provide new evidence
that cell apoptosis is orchestrated by the balance between several
signaling pathways. PGC-1β downregulation by shRNA leads to a
decrease in the expression of mTOR pathway-related genes in
MDA-MB-231 cells, and PGC-1β induced the cell apoptosis mediated by
mTOR signal pathway.
Acknowledgements
This study was supported by the National Nature
Science Foundation of China (NSFC, grant no. 81000958). The funders
had no role in study design, data collection and analysis, decision
to publish, or preparation of the manuscript. We thank Dr Shihai
Liu for his technical assistance. We also thank Drs Xi Yang, Hua
Zhou and Shihai Liu for critical reading of this manuscript.
References
|
1
|
Ginsburg OM and Love RR: Breast cancer: a
neglected disease for the majority of affected women worldwide.
Breast J. 17:289–295. 2011. View Article : Google Scholar : PubMed/NCBI
|
|
2
|
Lorico A and Rappa G: Phenotypic
heterogeneity of breast cancer stem cells. J Oncol.
2011:1350392011. View Article : Google Scholar : PubMed/NCBI
|
|
3
|
Misra Y, Bentley PA, Bond JP, Tighe S,
Hunter T and Zhao FQ: Mammary gland morphological and gene
expression changes underlying pregnancy protection of breast cancer
tumorigenesis. Physiol Genomics. 44:76–88. 2012. View Article : Google Scholar : PubMed/NCBI
|
|
4
|
Bray F, McCarron P and Parkin DM: The
changing global patterns of female breast cancer incidence and
mortality. Breast Cancer Res. 6:229–239. 2004. View Article : Google Scholar : PubMed/NCBI
|
|
5
|
Perou CM: Molecular stratification of
triple-negative breast cancers. Oncologist. 16(Suppl 1): S61–S70.
2011. View Article : Google Scholar
|
|
6
|
Liu S and Wicha MS: Targeting breast
cancer stem cells. J Clin Oncol. 28:4006–4401. 2010. View Article : Google Scholar : PubMed/NCBI
|
|
7
|
Tremblay AM and Giguère V: The NR3B
subgroup: an ovERRview. Nucl Recept Signal. 5:1–11. 2007.
|
|
8
|
Hartlerode A, Odate S, Shim I, Brown J and
Scully R: Cell cycle-dependent induction of homologous
recombination by a tightly regulated I-SceI fusion protein. PloS
One. 6:e165012011. View Article : Google Scholar : PubMed/NCBI
|
|
9
|
Vezina C, Kudelski A and Sehgal SN:
Rapamycin (AY-22,989), a new antifungal antibiotic. I. Taxonomy of
the producing streptomycete and isolation of the active principle.
J Antibiot (Tokyo). 28:721–726. 1975. View Article : Google Scholar : PubMed/NCBI
|
|
10
|
Cunningham JT, Rodgers JT, Arlow DH,
Vazquez F, Mootha VK and Puigserver P: mTOR controls mitochondrial
oxidative function through a YY1-PGC-1alpha transcriptional
complex. Nature. 450:736–740. 2007. View Article : Google Scholar : PubMed/NCBI
|
|
11
|
Kelly DP and Scarpulla RC: Transcriptional
regulatory circuits controlling mitochondrial biogenesis and
function. Genes Dev. 18:357–368. 2004. View Article : Google Scholar : PubMed/NCBI
|
|
12
|
Spiegelman BM: Transcriptional control of
mitochondrial energy metabolism through the PGC1 coactivators.
Novartis Found Symp. 287:60–69. 2007. View Article : Google Scholar : PubMed/NCBI
|
|
13
|
Arany Z, Lebrasseur N, Morris C, et al:
The transcriptional coactivator PGC-1beta drives the formation of
oxidative type IIX fibers in skeletal muscle. Cell Metab. 5:35–46.
2007. View Article : Google Scholar : PubMed/NCBI
|
|
14
|
Czubryt MP, McAnally J, Fishman GI and
Olson EN: Regulation of peroxisome proliferator-activated receptor
gamma coactivator 1 alpha (PGC-1 alpha) and mitochondrial function
by MEF2 and HDAC5. Proc Natl Acad Sci USA. 100:1711–1716. 2003.
View Article : Google Scholar : PubMed/NCBI
|
|
15
|
Attia RR, Connnaughton S, Boone LR, et al:
Regulation of pyruvate dehydrogenase kinase 4 (PDK4) by thyroid
hormone: role of the peroxisome proliferator-activated receptor
gamma coactivator (PGC-1 alpha). J Biol Chem. 285:2375–2385. 2010.
View Article : Google Scholar
|
|
16
|
Schieke SM, Phillips D, McCoy JP Jr, et
al: The mammalian target of rapamycin (mTOR) pathway regulates
mitochondrial oxygen consumption and oxidative capacity. J Biol
Chem. 281:27643–27652. 2006. View Article : Google Scholar : PubMed/NCBI
|
|
17
|
Ramanathan A and Schreiber SL: Direct
control of mitochondrial function by mTOR. Proc Natl Acad Sci USA.
106:22229–22232. 2009. View Article : Google Scholar : PubMed/NCBI
|
|
18
|
Wu Z, Puigserver P, Andersson U, et al:
Mechanisms controlling mitochondrial biogenesis and respiration
through the thermogenic coactivator PGC-1. Cell. 98:115–124. 1999.
View Article : Google Scholar : PubMed/NCBI
|
|
19
|
St-Pierre J, Lin J, Krauss S, et al:
Bioenergetic analysis of peroxisome proliferator-activated receptor
gamma coactivators 1alpha and 1beta (PGC-1alpha and PGC-1β) in
muscle cells. J Biol Chem. 278:26597–26603. 2003.PubMed/NCBI
|
|
20
|
Hardie DG: Minireview: the AMP-activated
protein kinase cascade: the key sensor of cellular energy status.
Endocrinology. 144:5179–5183. 2003. View Article : Google Scholar : PubMed/NCBI
|
|
21
|
Kemp BE, Stapleton D, Campbell DJ, et al:
AMP-activated protein kinase, super metabolic regulator. Biochem
Soc Trans. 31:162–168. 2003. View Article : Google Scholar : PubMed/NCBI
|
|
22
|
Willer A: Reduction of the individual
cancer risk by physical exercise. Onkologie. 26:283–289. 2003.
View Article : Google Scholar : PubMed/NCBI
|
|
23
|
Gwinn DM, Shackelford DB, Egan DF, et al:
AMPK phosphorylation of raptor mediates a metabolic checkpoint. Mol
Cell. 30:214–226. 2008. View Article : Google Scholar : PubMed/NCBI
|
|
25
|
Kabeya Y, Mizushima N, Ueno T, et al: LC3,
a mammalian homologue of yeast Apg8p, is localized in
autophagosome membranes after processing. EMBO J. 19:5720–5728.
2000.
|
|
24
|
Hardie DG, Salt IP, Hawley SA and Davies
SP: AMP-activated protein kinase: an ultrasensitive system for
monitoring cellular energy charge. Biochem J. 338:717–722. 1999.
View Article : Google Scholar : PubMed/NCBI
|
|
26
|
Cao Y and Klionsky DJ: Physiological
functions of Atg6/Beclin 1: a unique autophagy-related protein.
Cell Res. 17:839–849. 2007. View Article : Google Scholar : PubMed/NCBI
|
|
27
|
Pattingre S, Espert L, Biard-Piechaczyk M
and Codogno P: Regulation of macroautophagy by mTOR and Beclin 1
complexes. Biochimie. 90:313–323. 2008. View Article : Google Scholar : PubMed/NCBI
|
|
28
|
Meirhaeghe A, Crowley V, Lenaghan C, et
al: Characterization of the human, mouse and rat PGC1 beta
(peroxisome-proliferator-activated receptor-gamma co-activator 1
beta) gene in vitro and in vivo. Biochem J. 373:155–165. 2003.
View Article : Google Scholar : PubMed/NCBI
|
|
29
|
Lin J, Tarr PT, Yang R, et al: PGC-1βeta
in the regulation of hepatic glucose and energy metabolism. J Biol
Chem. 278:30843–30848. 2003.
|
|
30
|
Finck BN and Kelly DP: PGC-1 coactivators:
inducible regulators of energy metabolism in health and disease. J
Clin Invest. 116:615–622. 2006. View
Article : Google Scholar : PubMed/NCBI
|
|
31
|
Feige JN and Auwerx J: Transcriptional
coregulators in the control of energy homeostasis. Trends Cell
Biol. 17:292–301. 2007. View Article : Google Scholar : PubMed/NCBI
|
|
32
|
Peralba JM, DeGraffenried L, Friedrichs W,
et al: Pharmacodynamic evaluation of CCI-779, an inhibitor of mTOR,
in cancer patients. Clin Cancer Res. 9:2887–2892. 2003.PubMed/NCBI
|
|
33
|
Boulay A, Zumstein-Mecker S, Stephan C, et
al: Antitumor efficacy of intermittent treatment schedules with the
rapamycin derivative RAD001 correlates with prolonged inactivation
of ribosomal protein S6 kinase 1 in peripheral blood mononuclear
cells. Cancer Res. 64:252–261. 2004. View Article : Google Scholar
|
|
34
|
Basso AD, Mirza A, Liu G, Long BJ, Bishop
WR and Kirschmeier P: The farnesyl transferase inhibitor (FTI)
SCH66336 (lonafarnib) inhibits Rheb farnesylation and mTOR
signaling. Role in FTI enhancement of taxane and tamoxifen
anti-tumor activity. J Biol Chem. 280:31101–31108. 2005. View Article : Google Scholar : PubMed/NCBI
|
|
35
|
Harhaji-Trajkovic L, Vilimanovich U,
Kravic-Stevovic T, Bumbasirevic V and Trajkovic V: AMPK-mediated
autophagy inhibits apoptosis in cisplatin-treated tumour cells. J
Cell Mol Med. 13:3644–3654. 2009. View Article : Google Scholar : PubMed/NCBI
|
|
36
|
Herrero-Martin G, Høyer-Hansen M,
Garcia-Garcia C, et al: TAK1 activates AMPK-dependent
cytoprotective autophagy in TRAIL-treated epithelial cells. EMBO J.
28:677–685. 2009. View Article : Google Scholar : PubMed/NCBI
|