Introduction
Breast cancer is the most common malignancy and the
major cause of cancer-related mortality in women worldwide
(1). Although the 5-year survival
rate has greatly increased with advances in the detection and
treatment, many breast cancer patients still die from tumor
malignancy. Therefore, more effective methods for the prevention
and treatment are greatly needed.
BTG1 was originally identified as a translocation
partner of the c-MYC gene in a case of B-cell chronic lymphocytic
leukemia and belongs to a family of antiproliferative genes that
also includes BTG2, BTG3, TOB and TOB2 (2,3).
Proteins encoded by members of this gene family have been
implicated in the induction of growth arrest or apoptosis in a
variety of cell systems (4).
Overexpression of BTG1 was found to block proliferation during
normal erythroid differentiation (5) and to induce growth arrest in a B-cell
lymphoma model (6). One study
demonstrated that BTG1 regulates the glucocorticoid receptor
(GR)-dependent transcriptional response in leukemic cells (7), which indicates that this gene is an
important target for modulating therapeutic response. The BTG1
protein has no proven intrinsic enzymatic activity, but the
presence of several protein interaction domains suggests that BTG1
functions either as an adaptor molecule or as a cofactor involved
in transcriptional regulation. For instance, BTG1 was identified as
coactivator of the homeobox transcription factor HoxB9 (8) and the transcriptional regulator CAF1
(9). Moreover, BTG1 was shown to
stimulate the activity of several myogenic transcription factors as
well as nuclear receptors during muscle cell differentiation
(10).
BTG1 is also essentially expressed in many tumor
cells and can inhibit the proliferation of a variety of cancer
cells. For instance, BTG1 is expressed predominantly in quiescent
cells at the G0/G1 phase transition, with levels declining as cells
enter S phase (11). Exogenous
expression of BTG1 was found to result in reduced proliferation
with G1 arrest and/or apoptosis in several cell types, including
NIH3T3 murine fibroblasts (2,11),
microglia (12) and myoblasts
(13). A role for BTG1 in cellular
differentiation has been proposed based on experiments showing that
BTG1 expression stimulates myoblast differentiation (13), and that BTG1 is upregulated in
leukemic cells upon treatment with chemicals that induce
differentiation (14). Thus, BTG1
appears to play roles in inhibiting proliferation, promoting
apoptosis and stimulating cellular differentiation in multiple cell
types.
While several studies suggest that BTG1 exhibits
certain characteristics of a tumor-suppressor gene, it has not been
determined whether BTG1 is a breast cancer suppressor gene, and the
role of BTG1 in breast cancer cell growth remains unclear. Thus,
the present study was undertaken to evaluate the effect of BTG1 on
breast cancer cell (MDA-MB-231 and MCF-7) proliferation, cell cycle
distribution and apoptosis by creating stable transfectants and
evaluating their effect on cell growth potential in vitro.
We investigated changes in cell proliferation, cell cycle
progression and cell apoptosis. We also evaluated changes in the
expression of several proteins that are directly related to the
cell cycle (cyclin B1, cyclin D1, cyclin E1 and cell division cycle
gene) and cell apoptosis (Bcl-2, Bax and caspase-3). Furthermore,
we examined whether these changes are also observed in vivo
using nude mice. Our aim was to determine the role of the BTG1 gene
in breast cancer cell growth.
Materials and methods
Cell culture and clinical specimens
Human breast cancer cell lines, MCF-7, T-47D,
MDA-MB-231, MCF-10A and MDA-MB-435, were obtained from the Shanghai
Cell Bank (Shanghai, China). Human normal cells EPH4, AG11132A,
HBEC, HMEC were stored in our laboratory. Cells were cultured in
Dulbecco’s modified Eagle’s medium (Gibco-BRL, Carlsbad, CA, USA)
containing 10% fetal bovine serum in a humidified atmosphere with
5% CO2 at 37°C. Clinical specimens were obtained from
the Second Affiliated Hospital of Soochow University.
Generation of stable cell lines
To generate BTG1 overexpressing stable cell lines,
cDNAs for full-length human BTG1 were amplified by PCR using the
following primer sequences: forward
(5′-CACCATGCATCCCTTCTACACCCGG-3′) and reverse
(5′-TTAACCTGATACAGTCATCATATTG-3′). The full-length cDNA was cloned
into XhoI and BamHI linearized plasmid vector pcDNA3
(Clontech). The control vector pcDNA3 and human BTG1 expression
vector pcDNA3-BTG1 were transfected into MCF-7 and MDA-MB-231 cells
using Lipofectamine 2000 (Invitrogen). Stable clones were selected
in medium containing G418 (500 μg/ml) (Sigma). Individual clones
were isolated and expanded for further characterization. The empty
vector pcDNA3 was also transfected into MCF-7 and MDA-MB-231 cells
and served as the control group. The expression of BTG1 was
determined by RT-PCR and western blot analysis.
Cell proliferation assay
Cell proliferation was measured with MTT assay.
Briefly, cells from each experimental group were plated in 96-well
plates at a density of 5×10³ cells, and 180 μl culture
medium was added to each well. The cells were incubated at 37°C for
1, 2, 3, 4, 5, 6, 7 or 8 days at which time the cells were
incubated with 100 μl of MTT solution (5 g/l; Sigma, St. Louis, MO,
USA) for 2 h. The reaction was stopped by the addition of l50 μl
DMSO (Sigma), and the absorbance of samples at 570 nm was then
measured. A growth curve was plotted for each sample as the log
cell number vs. time, and the growth rates were derived from the
slope of each growth curve. Three independent experiments were
performed, and the results were used for plotting the relative
growth rate with SD.
Flow cytometric analysis of cell cycle
distribution and apoptosis
For cell cycle analysis, after 48 h of culture,
cells from each experimental group were collected and digested with
trypsin and fixed with 75% ice-cold ethanol at 4°C overnight. Cells
(1×10⁶) were centrifuged at 1,000 rpm for 5 min, and the
pellets were resuspended with 100 μg/ml propidium iodide (Sigma)
for 30 min in the dark before analysis. The cell cycle profiles
were assayed using the FACSCan ESP flow cytometer at 488 nm, and
data were analyzed using MultiCycle software (BD Biosciences). For
analysis of apoptosis, cells from each experimental group were
collected and digested with trypsin and processed as described in
the Annexin V-Fluorescein Isothiocynate (FITC) Apoptosis Detection
Kit I manual (BD Biosciences) and analyzed by FACScan flow
cytometry (BD Biosciences).
RNA isolation and reverse
transcription-polymerase chain reaction (RT-PCR)
Total RNA from the cells of each experimental group
was extracted by TRIzol (Gibco-BRL) according to the manufacturer’s
instructions. cDNA was generated from total RNA, using M-MLV RT
(MBI; Fermentas, Waltham, MA, USA). Amplification was performed
over 28 cycles consisting of 94°C for 30 sec, 57°C for 30 sec and
72°C for 1 min. PCR products were separated by electrophoresis on a
1.5% agarose gel and stained with ethidium bromide to visualize the
bands. To compare differences among the samples, the relative
intensity of each band was normalized against the intensity of the
GAPDH band amplified from the same sample. The primer sequences for
the genes and expected product sizes were as follows:
5′-TGAACGGGAAGCTCACTGG-3′ (sense) and 5′-TCCACCACCCTGTTGCTGTA-3′
(antisense) for GAPDH (307 bp); 5′-CACCATGCATCCCTTCTACACCCGG-3′
(sense) and 5′-GCTGAGCCGCCAAAAGGT-3′ (antisense) for BTG1 (498
bp).
Western blot analysis
Cells from each experimental group were lysed with
SDS sample buffer (80 mM Tris-HCl, 2% SDS, 300 mM NaCl and 1.6 mM
EDTA). Cell extracts were separated using 10% SDS-PAGE gel
electrophoresis, transferred onto nitrocellulose membranes and
blocked with 5% skimmed milk. Following blocking, membranes were
incubated with antibodies against β-actin, BTG1, p-CDC2, cyclin D1,
cyclin B1, cyclin E1, Bax, Bcl-2, caspase-3 (Santa Cruz
Biotechnology) and then incubated with HRP-conjugated anti-mouse or
anti-rabbit IgG antibodies (Santa Cruz Biotechnology). Protein
bands were visualized with ECL solution.
In vivo studies
Four-week-old female nude mice (SPF BALB/c) were
obtained from the Laboratory Animal Center of Soochow University
and kept in a room at constant temperature (23±2°C) and humidity
(50–70%) with a 12-h light-dark cycle. After being grown to
subconfluency, transfected (pcDNA3-BTG1 or negative control
pcDNA3-neo) and non-treated MDA-MB-231 cells were trypsinized and
harvested, washed twice with PBS and resuspended in 0.2 ml PBS
(5×10⁶ cells/0.2 ml). Each group consisted of 6 nude
mice. Every five days, the tumor diameter was measured, and the
volume was calculated according to the formula: V = 0.4 × largest
diameter × smallest diameter. The growth curve of each tumor was
plotted, and the tumor growth ratio was calculated. Four weeks
after injection of the cells, the mice were sacrificed, and the
weights of the tumors were recorded and collected for histological
analysis. The animal treatment protocol used in the present study
was approved by the Institutional Animal Care and Use
Committee.
Immunohistochemistry
The tumor xenografts were removed and fixated in 10%
phosphate-buffered formaldehyde at room temperature for 48 h,
embedded in paraffin and sectioned at 4–6 μm. Tumors were confirmed
in H&E-stained sections. Expression levels of molecular BTG1
and Bcl-2 were also examined using immunohistochemistry. The
sections were deparaffinized, rehydrated and antigen retrieved in
Tris/EDTA buffer at 100°C for 15 min and left in the buffer for 10
min after boiling. Following a rinse in distilled water and
phosphate-buffered saline (PBS), the sections were treated with
0.03% hydrogen peroxide for 5 min to block endogenous peroxidase
activity, before incubation with mouse anti-human BTG1 and Bcl-2
antibody (Santa Cruz Biotechnology), diluted 1:100 for 30 min at
room temperature. Negative controls were set by replacement of the
primary antibody with normal polyclonal mouse IgG of the same
subclass and concentration. Following a rinse in PBS, the sections
were incubated with labeled HRP-conjugated anti-mouse antibody for
30 min at room temperature, and then rinsed two times in PBS before
a 10-min incubation with diaminobenzene. After rinsing they were
counterstained with hematoxylin, rinsed, dipped briefly in a water
bath containing several drops of ammonia, before dehydration and
mounting in Diatex. The stained sections were reviewed and scored
using a Nikon microscope to visualize cytoplasmic and nuclear
staining of BTG1 and Bcl-2.
TUNEL end staining assay
Terminal deoxynucleotidyltransferase-mediated
dUTP-biotin nick-end labeling (TUNEL) assay was performed using
recombinant terminal transferase (TdT) and biotin-16-dUTP (Sigma).
Three groups of MDA-MB-231 xenograft sections were processed
following the manufacturer’s protocol, and then the stained
sections were reviewed and scored using a Nikon microscope.
Statistical analysis
The results shown are the means ± SD. A P-value
<0.05 was considered to indicate a statistically significant
difference. Statistical analyses were calculated using SPSS 17.0.
Each experiment was repeated 3 times.
Results
BTG1 expression in breast cancer cell
lines and clinical specimens
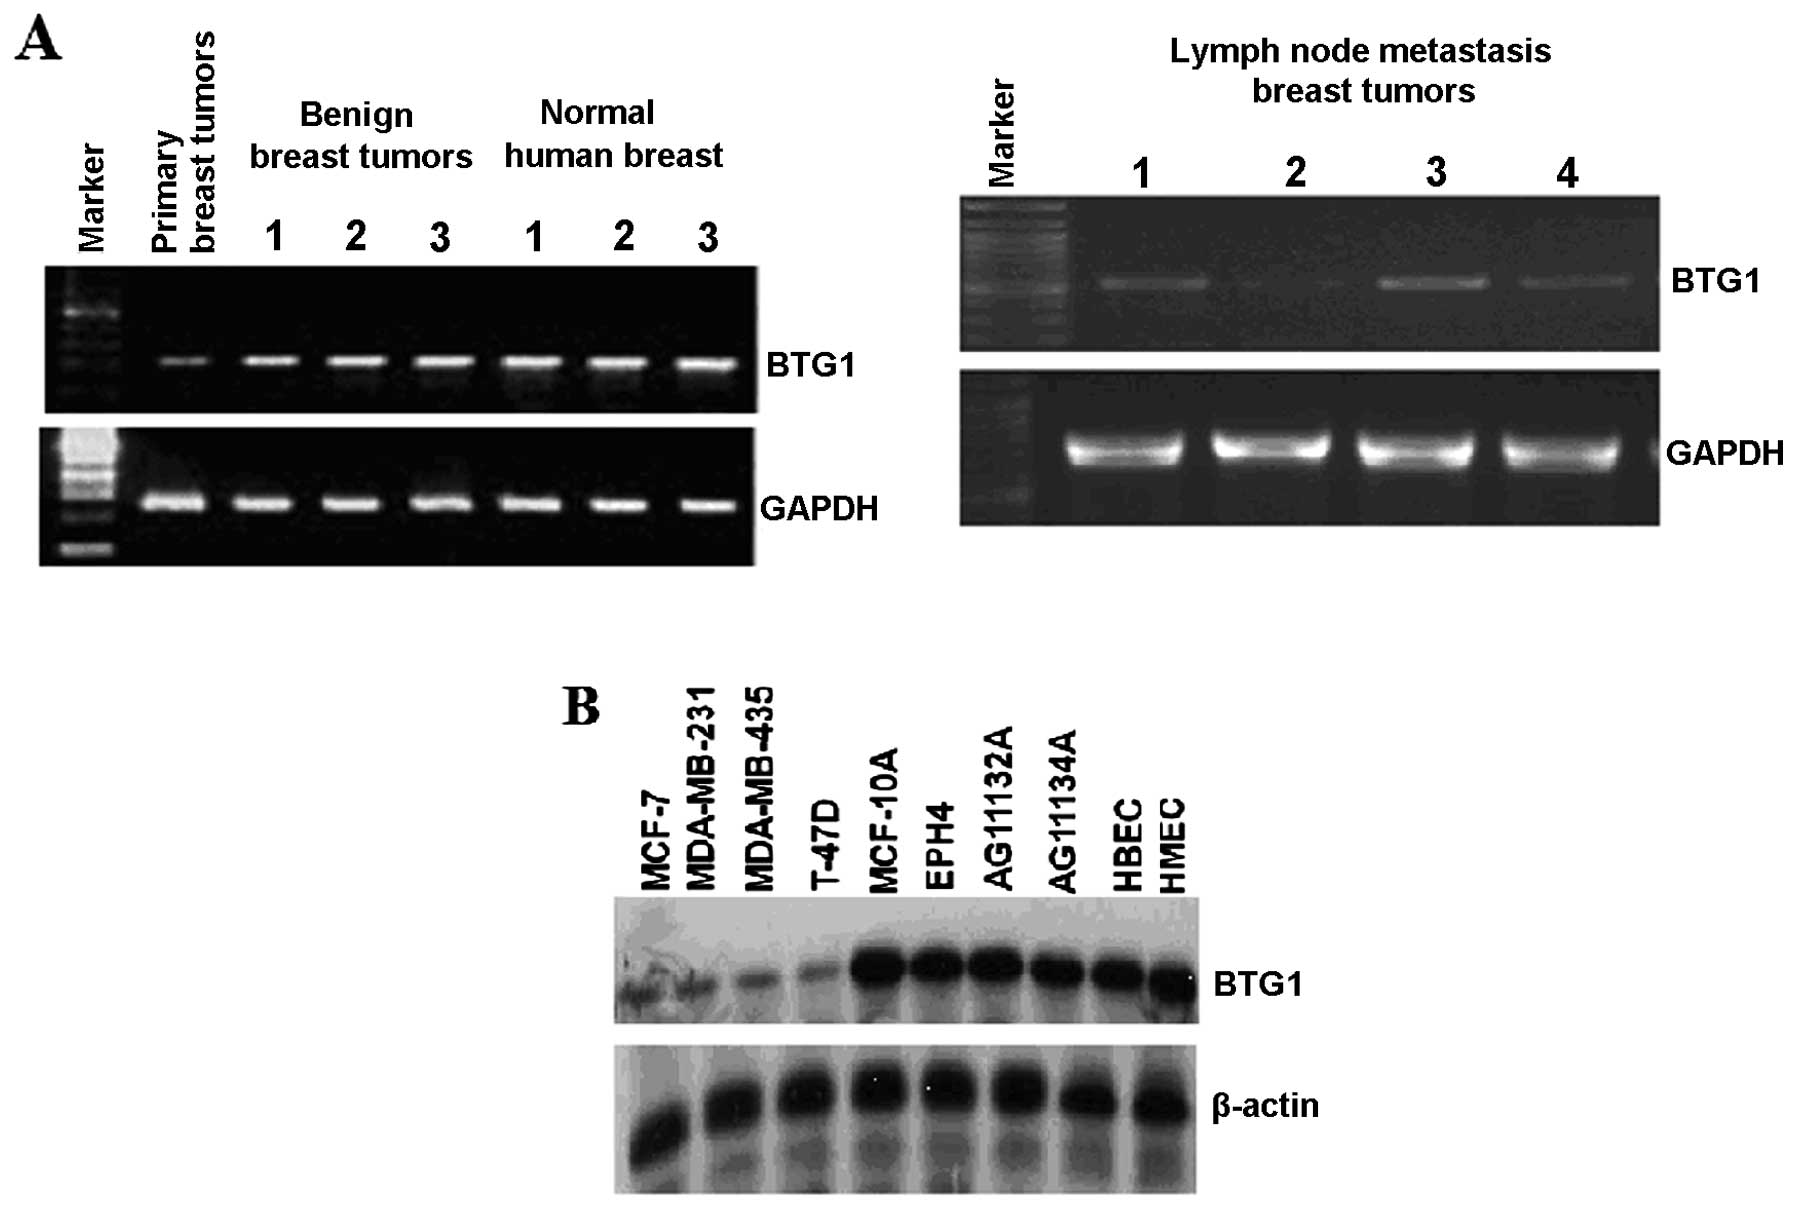
RT-PCR was used to assess the expression of BTG1 in
human breast cancer tissues from primary tumors, lymph node
metastasis, benign breast tumors and normal human breast (Fig. 1A). As assessed by RT-PCR, the BTG1
mRNA levels in benign breast tumors and normal human breast were
significantly higher than levels in the primary breast tumors and
lymph node metastasis tumors. We also tested a panel of breast cell
lines, including normal mammary epithelial and vascular endothelial
cell lines MCF-10A, EPH4, AG11132A, AG11134A, HBEC, HMEC, and
breast cancer cell lines MCF-7, MDA-MB-23, MDA-MB-435, T47D, as
shown in Fig. 1B. The western blot
results revealed that the BTG1 protein was present in all the
tested breast cell lines, and the BTG1 protein levels in normal
mammary epithelial cells and vascular endothelial cell lines were
significantly higher than levels in the breast cancer cell
lines.
Overexpression of BTG1 inhibits breast
cancer cell proliferation
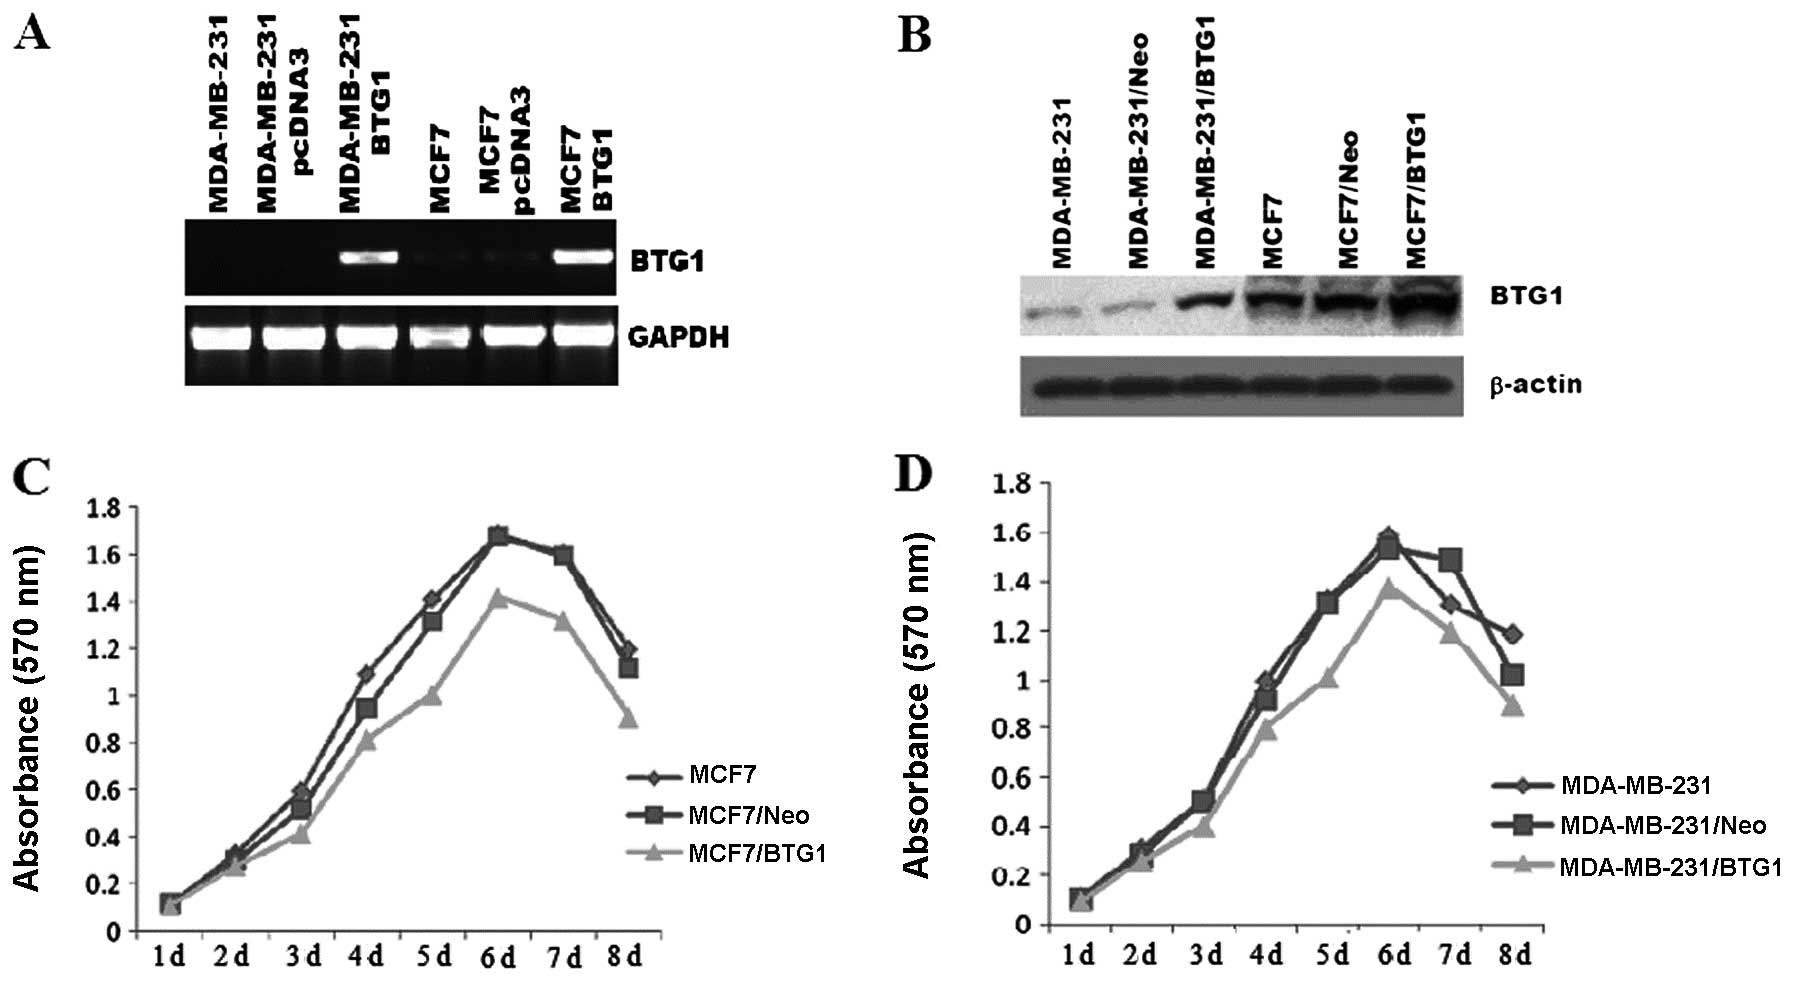
To further explore the role of BTG1 in breast
cancer, MCF-7 and MDA-MB-231 cells were transfected with DNA
constructs expressing BTG1 (pcDNA3-BTG1) or a control vector
(pcDNA3-neo). The G418-resistant mix clones were selected for
further experiments. As shown in Fig.
2A and B, the BTG1 mRNA and protein levels in the MCF-7 and
MDA-MB-231 cells were measured by RT-PCR and western blot analysis,
respectively. When compared with the control cells, BTG1 expression
was significantly increased in the pcDN3-BTG1 sense
vector-transfected MCF-7/BTG1 and MDA-MB-231/BTG1 cells. An MTT
assay was employed to determine the effect of BTG1 on cell
proliferation. The untreated MCF-7 and MDA-MB-231 cells, control
cells, as well as the MCF-7/BTG1 and MDA-MB-231/BTG1 cells were
grown in culture for 8 days. The cell proliferative ability of the
MCF-7/BTG1 and MDA-MB-231/BTG1 cells was decreased compared with
the control and untreated cells in a time-dependent manner
(Fig. 2C and D).
Overexpression of BTG1 induces G0/G1 cell
cycle arrest and inhibits cyclin D1 and cyclin B1 expression in
MCF-7 and MDA-MB-231 cells
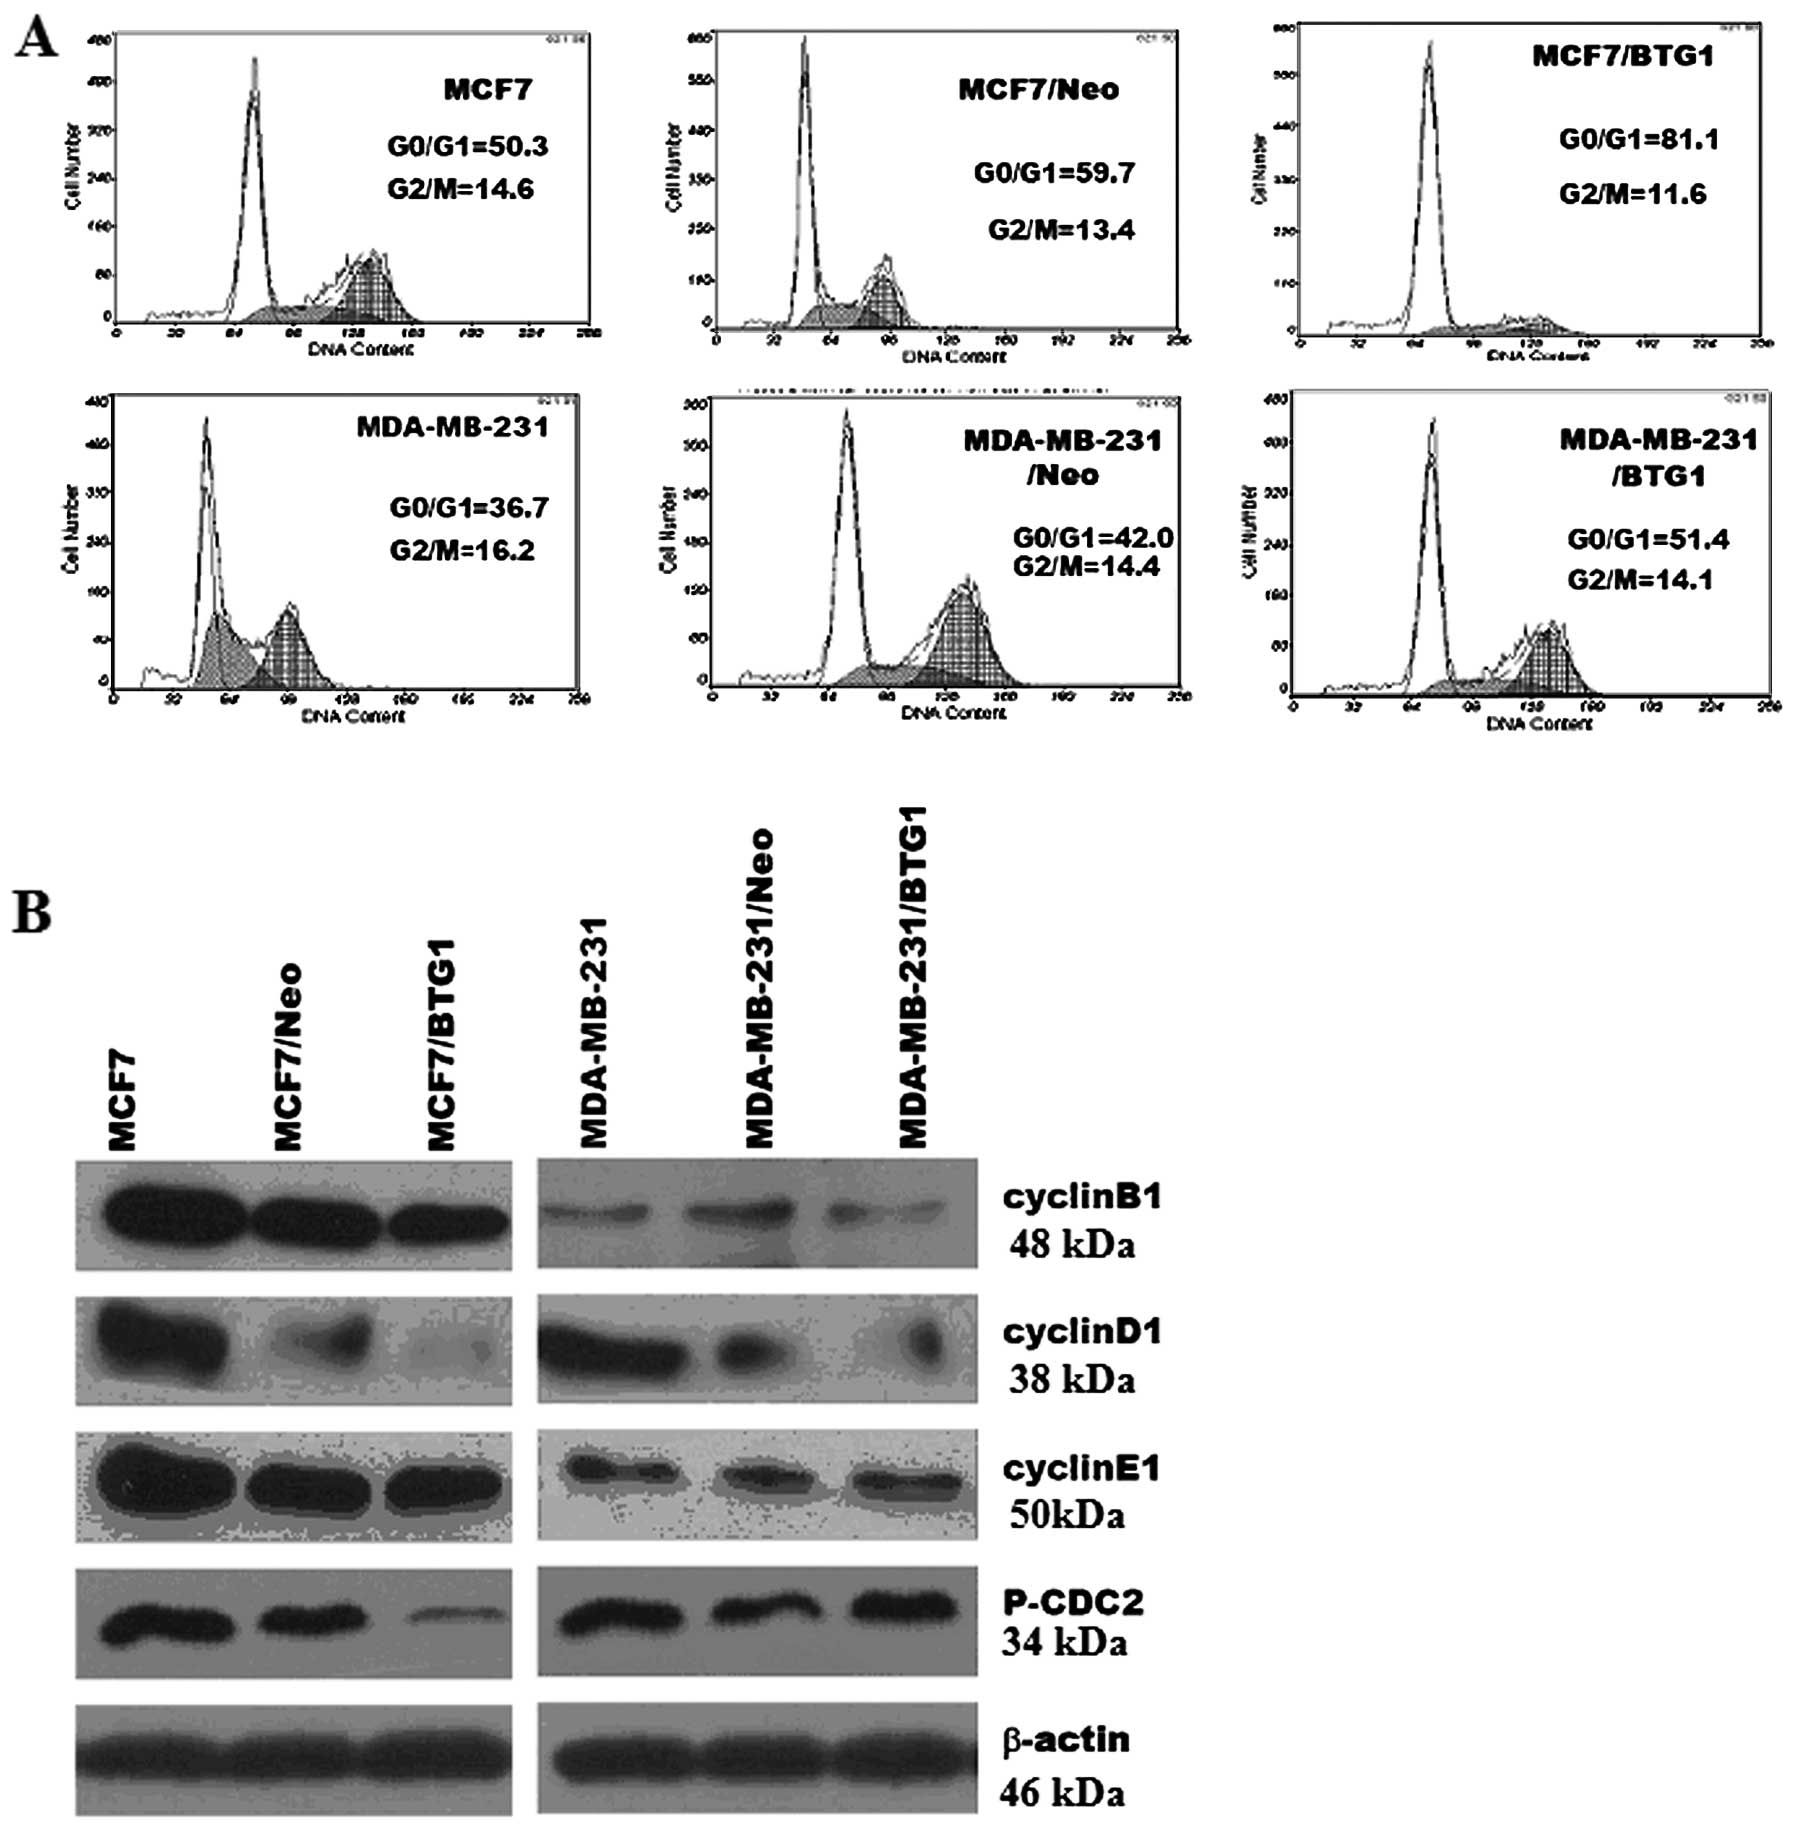
We further investigated the effects of BTG1 on the
cell cycle of MCF-7 and MDA-MB-231 cells. Representative results of
cell cycle distribution in untreated cells, control cells and
MCF-7/BTG1 and MDA-MB-231/BTG1 cells are shown in Fig. 3A. Flow cytometric analysis revealed
a statistically significant increase in the number of MCF-7/BTG1
cells in the G0/G1 phase (22% increase, P<0.05; Fig. 3A) accompanied by a decrease in the
number of cells in the S and G2/M phase. In MDA-MB-231/BTG1 cells
the number of cells in the G0/G1 phase was incresased (9% increase,
P<0.05; Fig. 3A) accompanied by
a decrease in the number of S phase cells.
Next, we evaluated the effects of BTG1 on the
expression of the cell cycle proteins cyclin B1, cyclin D1, cyclin
E1 and cell division cycle gene (CDC2) protein in MCF-7 and
MDA-MB-231 cells using western blot analysis. As shown in Fig. 3A, overexpression of BTG1 inhibited
expression of cyclin B1, cyclin D1, cyclin E1 and phosphorylated
CDC2 in the MCF-7 cells. In MDA-MB-231 cells, BTG1 inhibited the
expression of cyclin B1 and cyclin D1, but not cyclin E1 and
phosphorylated CDC2. In summary, these results revealed that an
increase in the level of BTG1 expression inhibited cyclin B1 and
cyclin D1 expression in MCF-7 and MDA-MB-231 cells, which, in turn,
may affect breast cancer cell (MCF-7 and MDA-MB-231) cycle
distribution, and induce G0/G1 phase arrest and significantly
reduce the number of S phase cells.
Effect of overexpression of BTG1 on
breast cancer cell apoptosis and expression of Bcl-2, Bax and
caspase-3
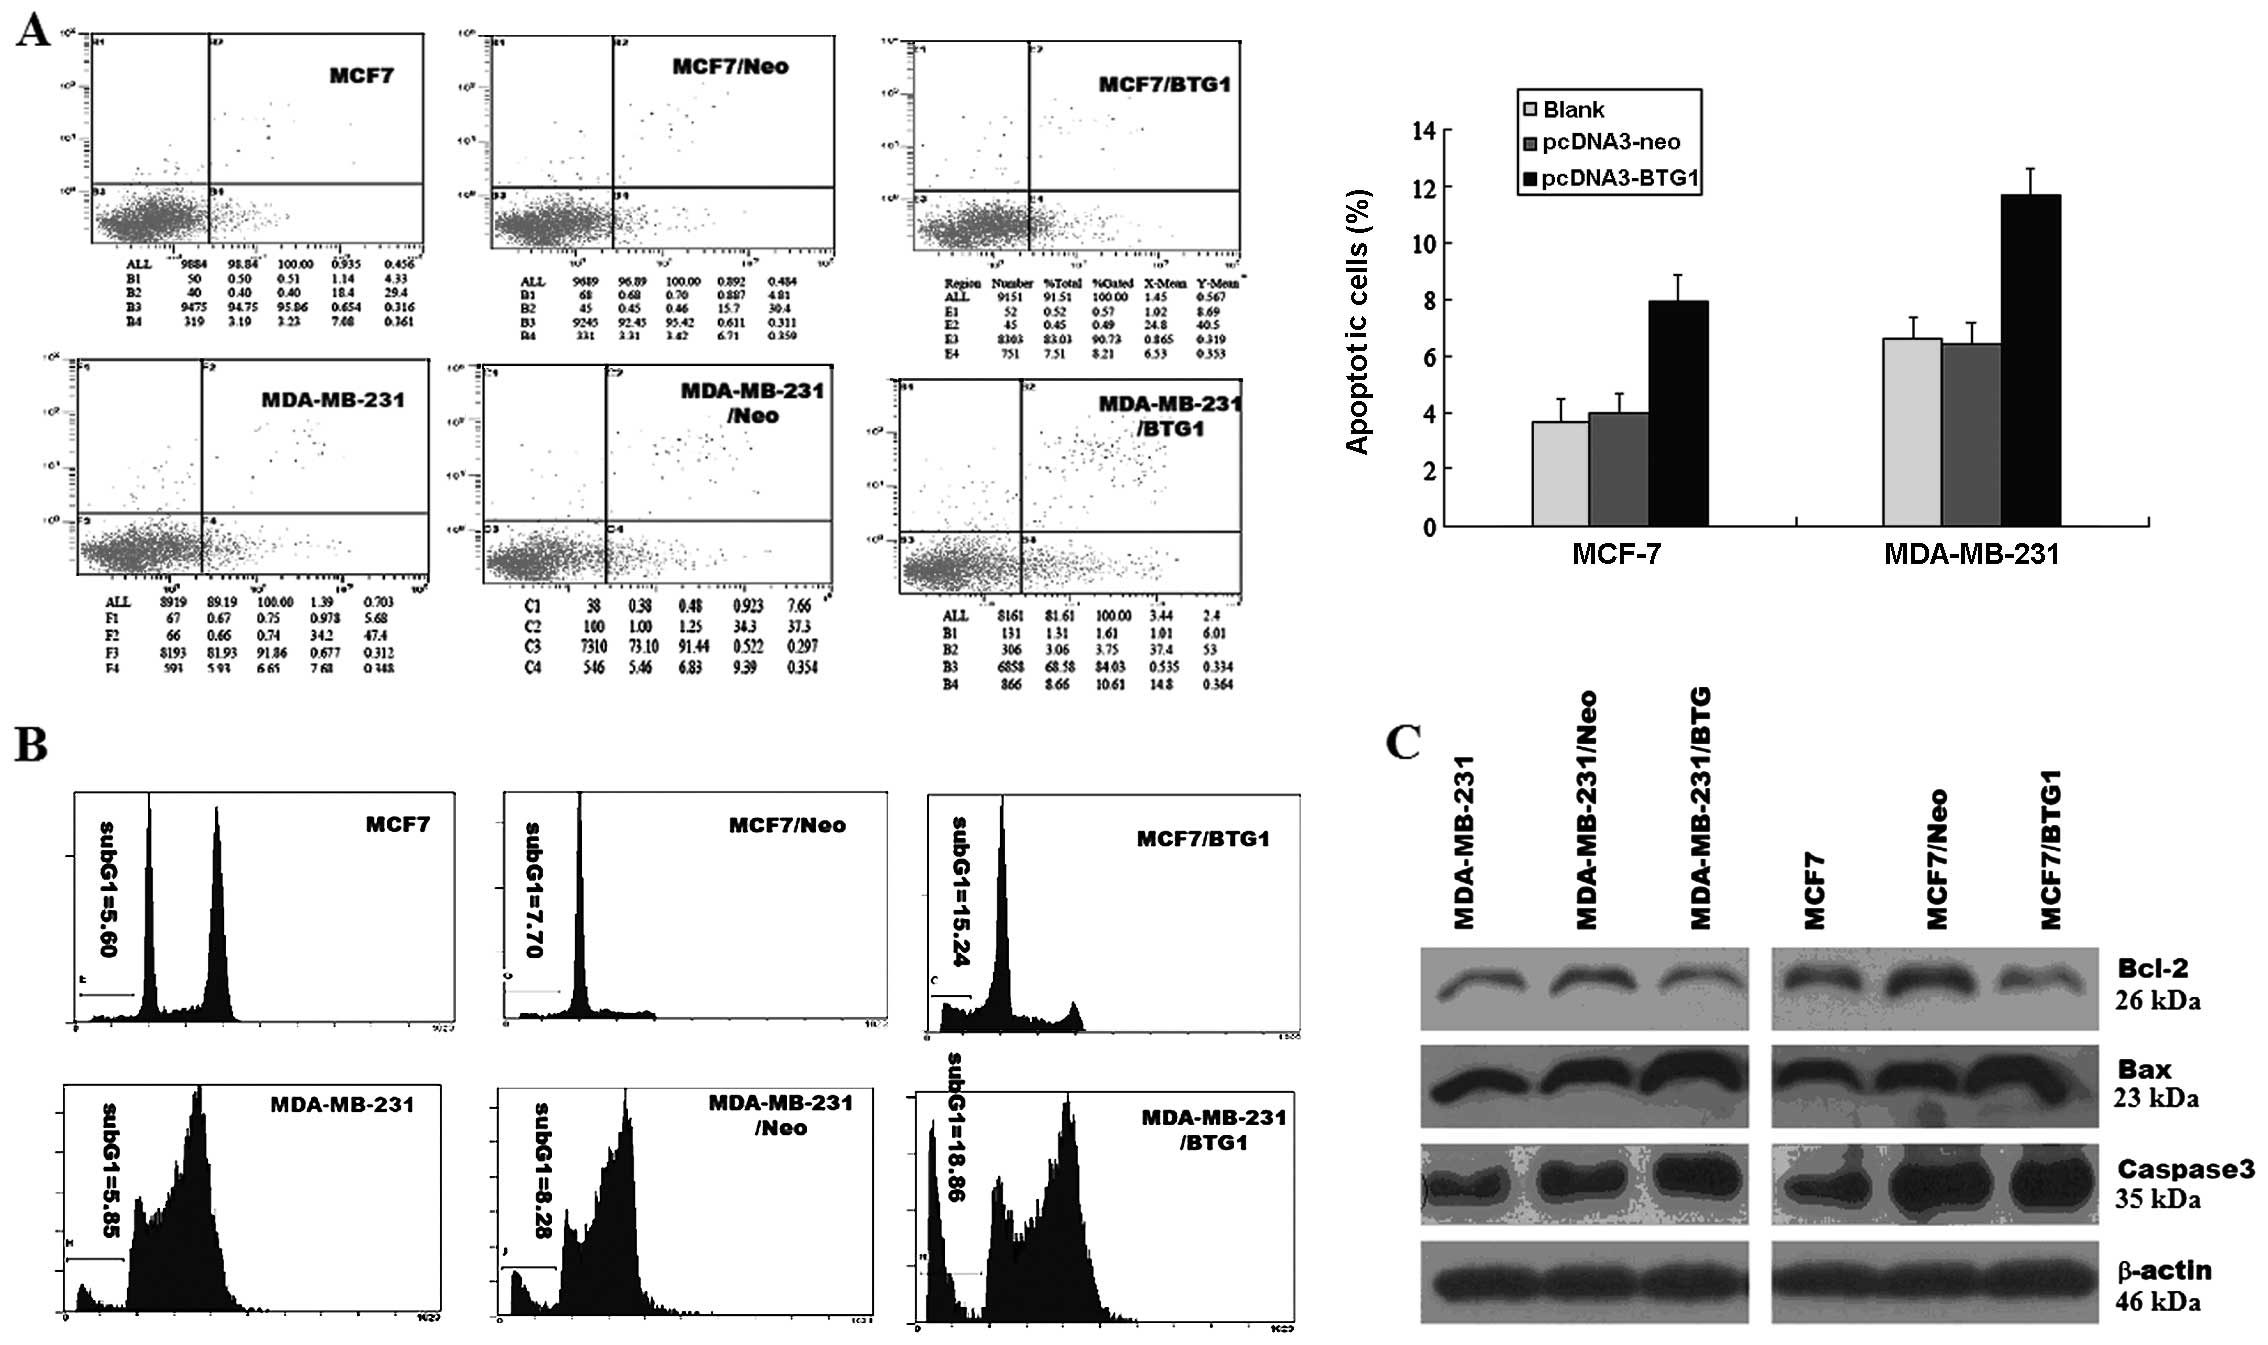
The extent of apoptosis was investigated by
determining the percentage of Annexin V-stained cells, a marker of
early stage apoptosis, and the apoptosis peak of flow cytometry. As
determined by Annexin V assay, in MCF-7/BTG1 and MDA-MB-231/BTG1
cells, the percentage of apoptotic cells was higher than that in
the control cells (Fig. 4A), and
the sub-G1 peaks of flow cytometry were higher than in the control
cells (Fig. 4B). Next, we detected
the expression of anti-apoptotic factor Bcl-2 and pro-apoptotic
factors, Bax and caspase-3, using western blot analysis. As shown
in Fig. 4C, overexpression of BTG1
upregulated the expression of the anti-apoptotic protein Bcl-2, and
downregulated the expression of the pro-apoptosis proteins Bax and
caspase-3 in MCF-7 and MDA-MB-231 cells. These results indicate
that the promotive effect on cell apoptosis by BTG1 is most likely
mediated by Bcl-2, Bax and caspase-3 in breast cancer cells.
Overexpression of BTG1 mediates
inhibition of xenograft formation and growth in vivo
The in vitro experiments with the MCF-7 and
MDA-MB-231 cells showed that the overexpression of BTG1 induced
G0/G1 cell cycle arrest and cell apoptosis and inhibited cell
growth. Hence, we examined whether this could also be observed
in vivo.
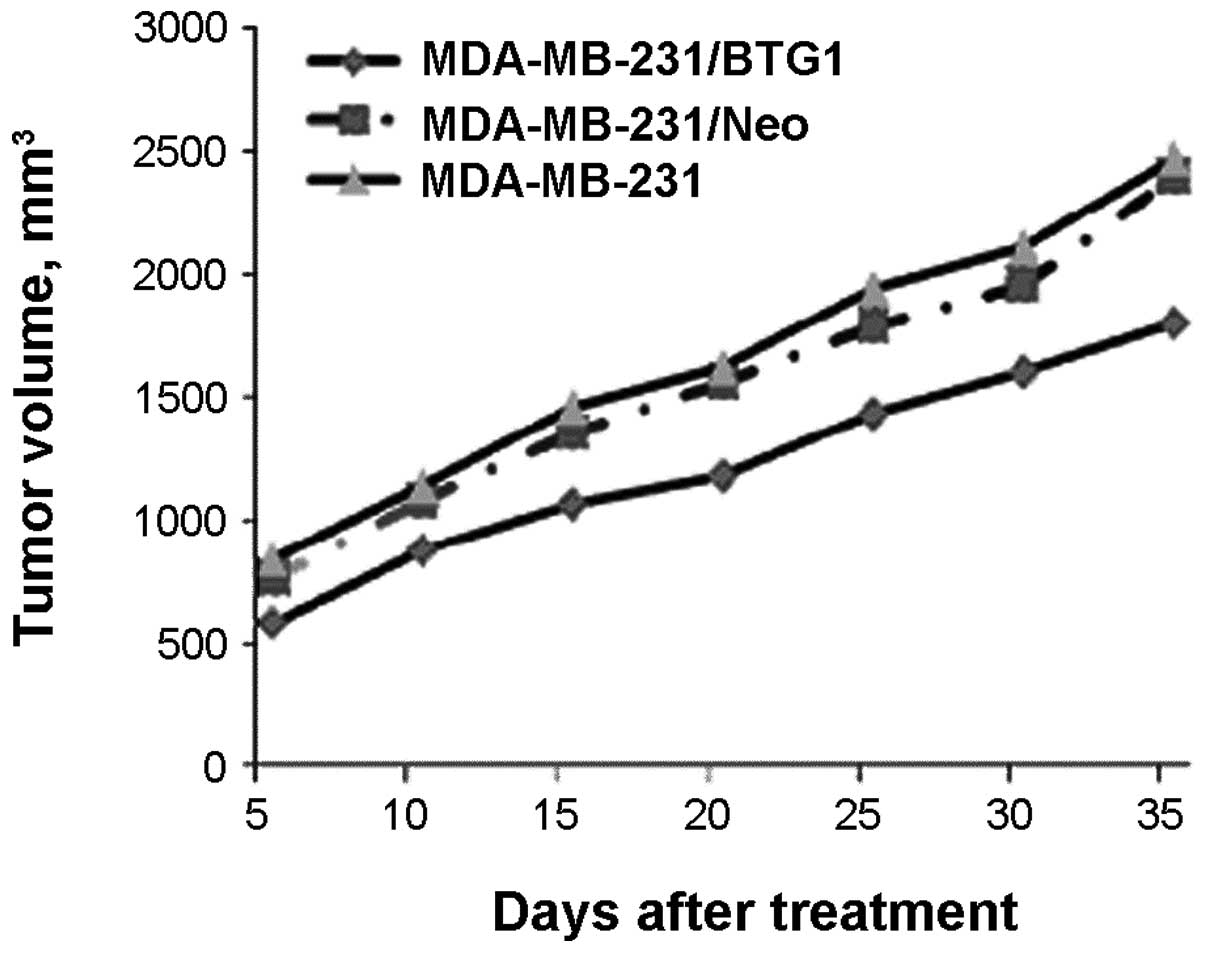
Transfected (pcDNA3-BTG1 or negative control
pcDNA3-neo) and non-treated MDA-MB-231 cells were subcutaneously
injected into nude mice (n=6 per group). After four weeks of
growth, the tumor masses obtained from the MDA-MB-231/BTG1 cell
xenografts were markedly smaller than those from the control mice
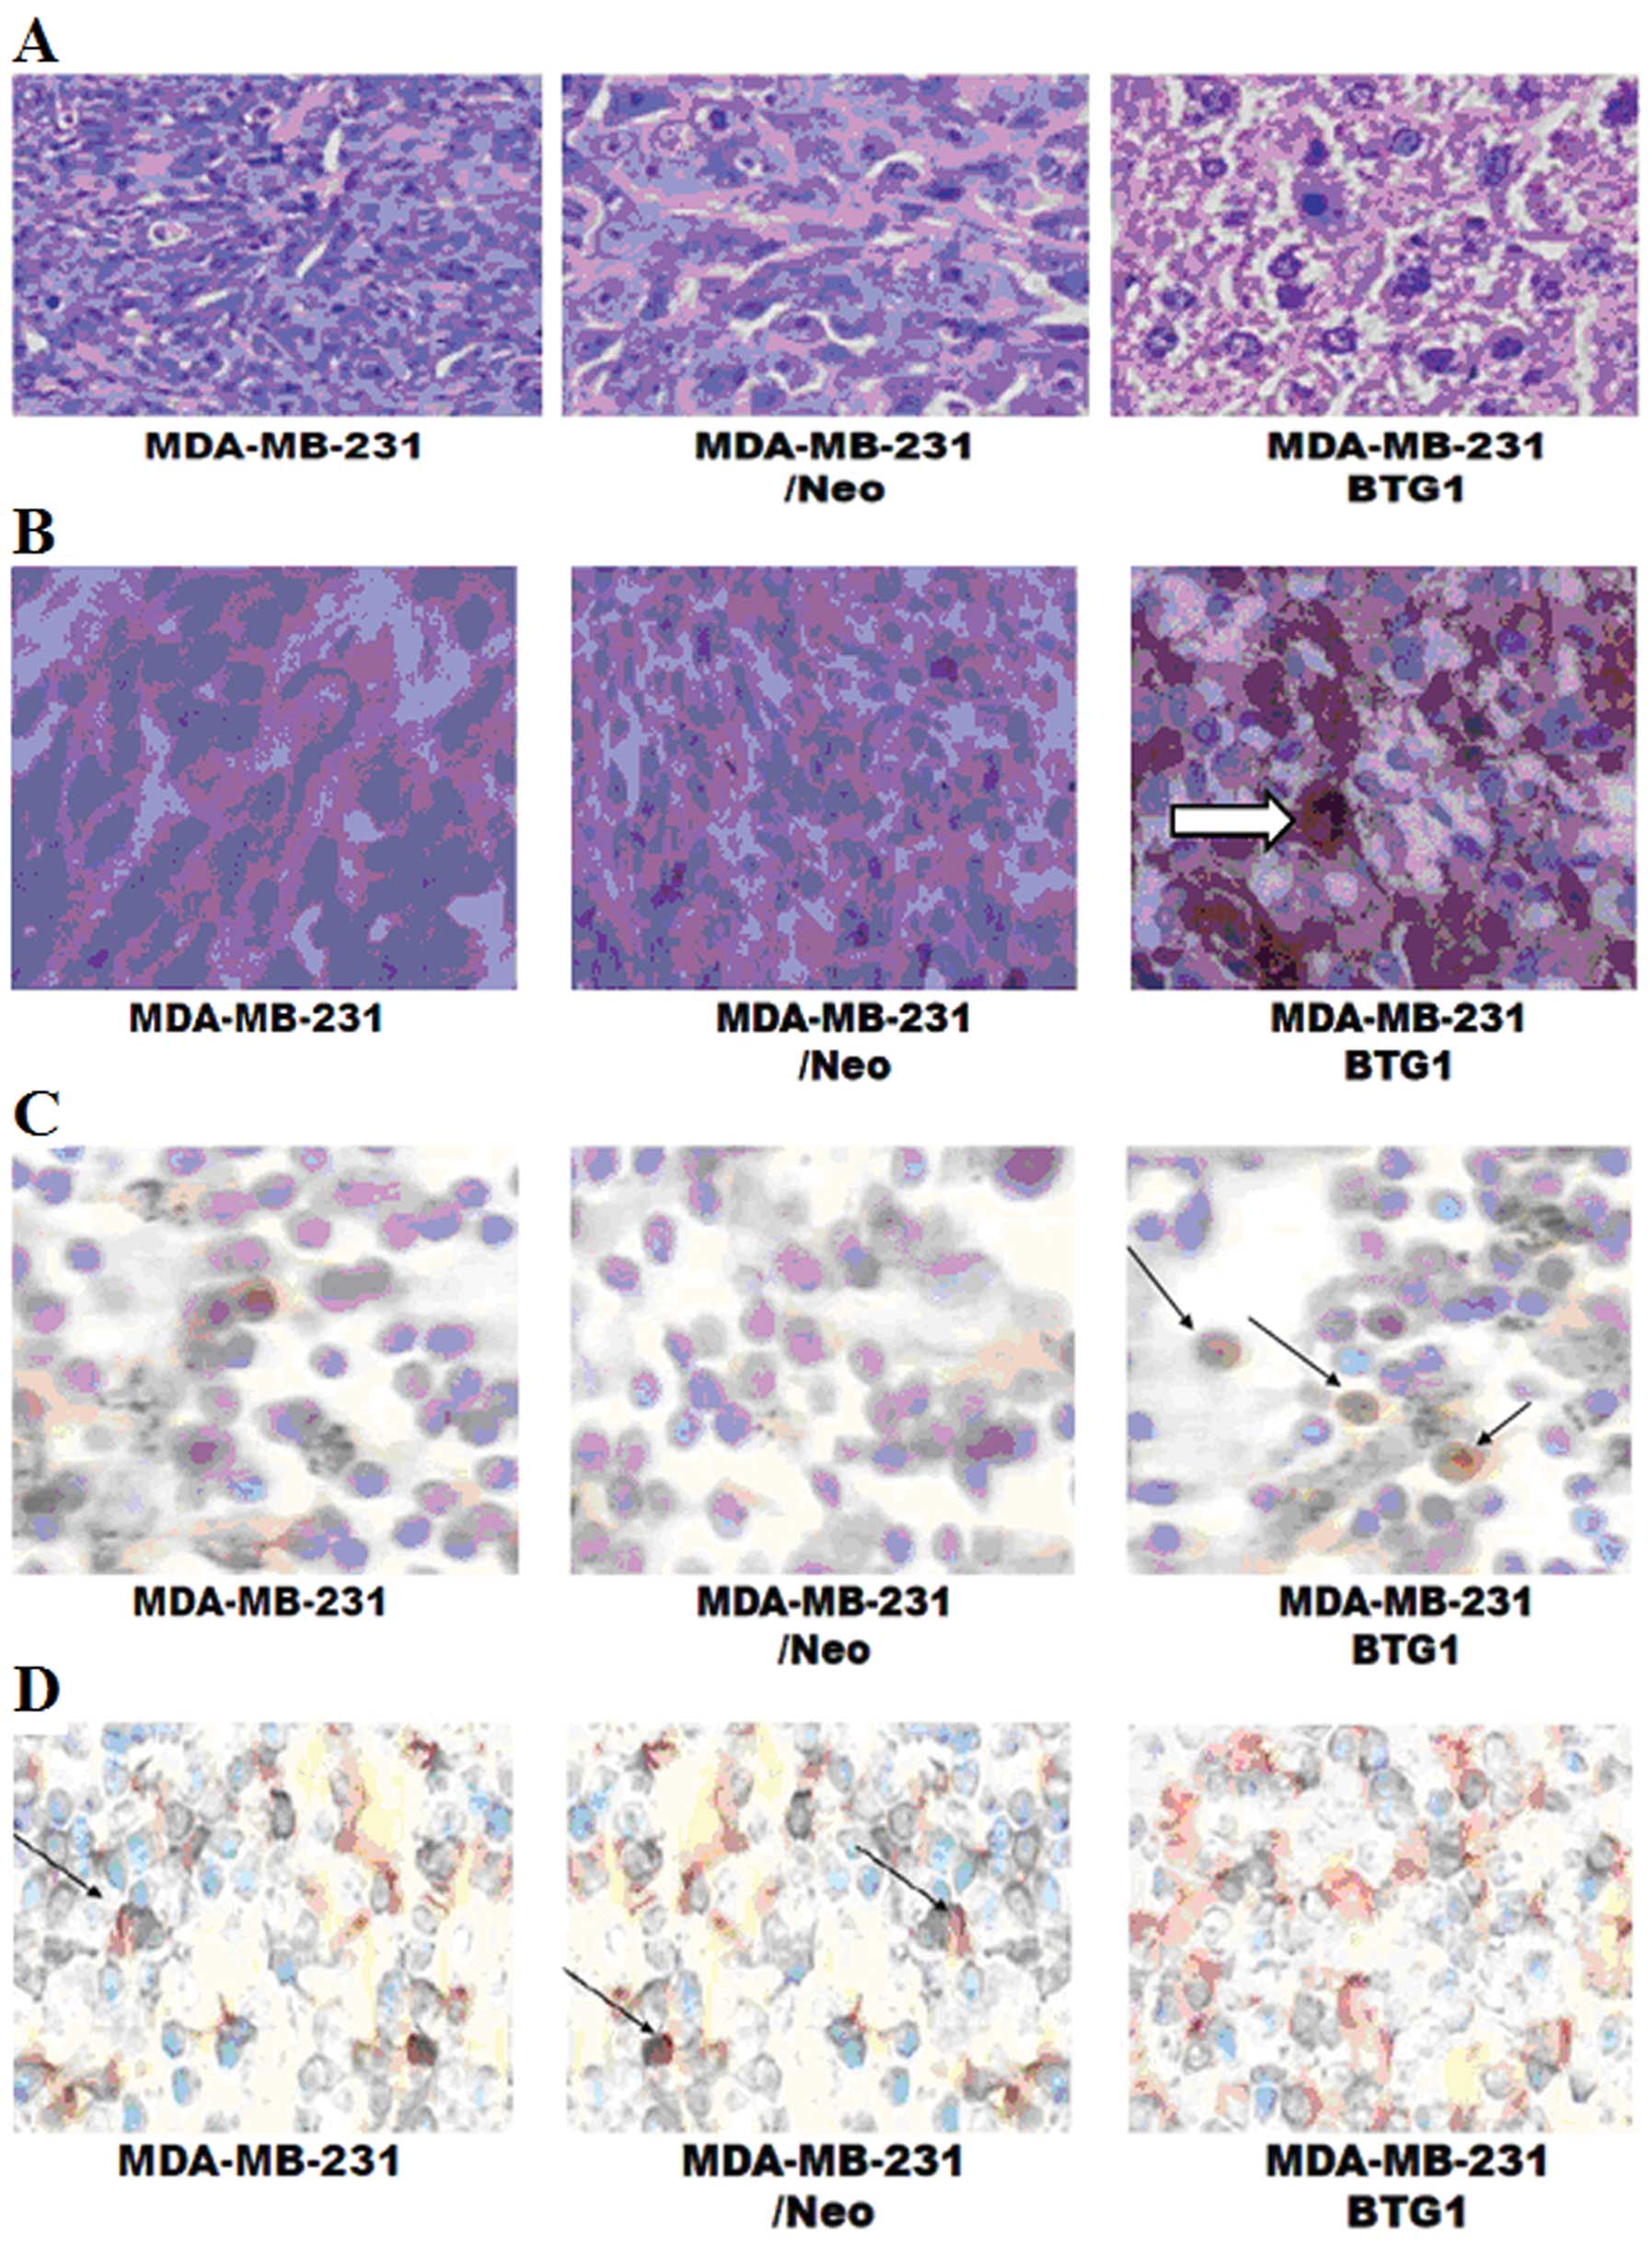
(Fig. 5; P<0.05). H&E
staining showed that tumor density in the MDA-MB-231/BTG1 cell
tumors was deceased when compared to the control cell tumors, but
no significantly higher degree of tumor necrosis and no cancer cell
infiltration were noted around the tumor capsule (Fig. 6A). The immunochemical staining
showed that the level of BTG1 expression was higher in the
MDA-MB-231/BTG1 cell tumors (Fig.
6B), whereas the level of Bcl-2 expression was lower in the
MDA-MB-231/BTG1 cell tumors (Fig.
6C). Next, we assessed tumor necrosis and apoptosis by TUNEL
end staining assay. As shown in Fig.
6D, some cells exhibited nuclear pyknosis and were fragmented,
irregular, inconsistent in size, and stained brownish yellow
indicating cell apoptosis. Clearly, these in vivo results
strongly confirmed the effect observed in vitro indicating
that BTG1 plays an important role in breast cancer cell growth.
Discussion
In the present study, we examined the role of BTG1
in breast cancer cell growth. The BTG1 expression vector induced
overexpression of BTG1 mRNA and protein in breast cancer cells
resulted in inhibition of cell proliferation, cell G0/G1 phase
arrest and cell apoptosis, which also resulted in inhibition of
xenograft formation and growth in vivo. Our findings
demonstrated that BTG1 plays a certain role in breast cancer cell
growth. Furthermore, in attempts to elucidate the mechanisms
underlying the observed effects, we obtained evidence for the
regulation of key genes involved in the cell cycle and cell
apoptosis by BTG1.
The control of the cell cycle plays an essential
role in cell growth and in the activation of important cellular
processes. A large number of cells show modulated expression of
molecules responsible for cell cycle arrest (15), including cyclins and
cyclin-dependent protein kinases (CDKs). These molecules form the
regulatory subunits (cyclins) and catalytic subunits (CDKs) of cell
cycle-regulated kinases (16).
Cyclin B1 and cyclin D1 both play an important role in cell cycle
progression. Cyclin B1 expression is minimal at the initiation of S
phase and peaks at the G2-M border; this peak in cyclin B1 activity
is required for cells to enter mitosis (17); but cyclin B1 protein level is very
low in the G1 phase. In addition, cyclin B1 is degraded by the
ubiquitin pathway through the activation of the APC (18,19);
activation of the APC through specific phosphorylation of its
components and the synthesis or activation of cyclin B1-directing
components with the subsequent degradation of cyclin B appears to
be necessary for the exit from mitosis (18). Cyclin D1 belongs to the family of
D-type cyclins, which regulate G1-S cell cycle progression
(20). Cyclin D1 acts through
activation of CDKs that phosphorylate and inactivate the
retinoblastoma protein. However, recent findings indicate that
cyclin D1 also promotes cell cycle progression through
CDK-independent mechanisms, such as interaction with and modulation
of transcription factor activities (21,22).
In the present study, we found that overexpression of BTG1 affects
breast cancer cell (MCF-7 and MDA-MB-231) cycle distribution, and
induces G0/G1 phase arrest and significantly reduces the number of
S phase cells. Furthermore, we evaluated the proteins that are
directly related to cell cycle and found that overexpression of
BTG1 decreased cyclin B1 and cyclin D1 protein. These results
indicate that BTG1 induced G0/G1 cell cycle arrest, mediated by
cyclin B1 and cyclin D1.
Apoptosis occurs through two major pathways, the
extrinsic or cytoplasmic pathway, which is regulated by the Fas
death receptor, and the intrinsic pathway, which is controlled in
part by the Bcl-2 family of proteins (23,24).
This family is composed of various pro-apoptotic and anti-apoptotic
proteins that heterodimerize and modulate each other’s function.
Thus, the relative concentration of each Bcl-2 family member is
thought to determine whether cell suicide will occur. The ratio of
anti-apoptotic Bcl-2 to pro-apoptotic Bax is a critical determinant
of apoptosis, as Bcl-2 heterodimerizes with Bax, blocking apoptosis
(25). The central component of the
apoptotic machinery is a proteolytic system consisting of a family
of cysteinyl proteases with an absolute requirement for cleavage
after aspartic acid, therefore called caspases (26,27).
Caspase-3 is the most intensively studied effector caspase. It has
been shown that depletion of caspase-3 by homologous recombination
leads to accumulation of neuronal cells whereas other tissues were
not affected (28). In the present
study, we demonstrated that overexpression of BTG1 induced breast
cancer cell apoptosis, accompanied by a decline in Bcl-2 and an
increase in Bax and caspase-3. These results indicate that the
inhibitory effect on cell apoptosis by BTG1 is most likely mediated
by Bcl-2, Bax and caspase-3 in breast cancer cells.
Importantly, the finding that BTG1 inhibited breast
cancer cell growth in vitro was confirmed in our animal
model. The growth rate of established BTG1-upregulated xenografts
was slower than the rate in the vector control group, and the
immunochemical staining showed that the level of Bcl-2 expression
was lower than that in the control group. Next, we found that there
were many cells exhibiting nuclear pyknosis which were fragmented,
irregular, inconsistent in size, and stained brownish yellow in the
experimental group xenografts, as detected by TUNEL end staining
assay. The data indicate that BTG1 induced cell apoptosis through a
decrease in Bcl-2 expression, and inhibited tumor growth in
vivo.
In summary, the present study investigating the role
of BTG1 in breast cancer cell growth demonstrated that the protein
reduced cell cycle-related proteins inducing cell cycle arrest, and
altered several proteins that are directly related to cell
apoptosis, and inhibited cell growth both in vitro and in
vivo. These findings provide new insight into the role of BTG1
in breast cancer and may have important implication for the
development of targeted therapeutics for breast cancer.
Acknowledgements
The present study was supported by the National
Natural Science Foundation of China (no. 81001185), and the
Universities Natural Science Foundation of Jiangsu Province (no.
10KJB310011)
References
|
1
|
Parrella P: Epigenetic signatures in
breast cancer: clinical perspective. Breast Care. 5:66–73. 2010.
View Article : Google Scholar : PubMed/NCBI
|
|
2
|
Rouault JP, Rimokh R, Tessa C, Paranhos G,
Ffrench M, Duret L, Garoccio M, Germain D, Samarut J and Magaud JP:
BTG1, a member of a new family of antiproliferative genes. EMBO J.
11:1663–1670. 1992.PubMed/NCBI
|
|
3
|
Berthet C, Guehenneux F, Revol V, Samarut
C, Lukaszewicz A, Dehay C, Dumontet C, Magaud JP and Rouault JP:
Interaction of PRMT1 with BTG/TOB proteins in cell signalling:
molecular analysis and functional aspects. Genes Cells. 7:29–39.
2002. View Article : Google Scholar : PubMed/NCBI
|
|
4
|
Matsuda S, Rouault J, Magaud J and Berthet
C: In search of a function for the TIS21/PC3/BTG1/TOB family. FEBS
Lett. 497:67–72. 2001. View Article : Google Scholar : PubMed/NCBI
|
|
5
|
Bakker WJ, Blazquez-Domingo M, Kolbus A,
Besooyen J, Steinlein P, Beug H, Coffer PJ, Lowenberg B, von
Lindern M and van Dijk TB: FoxO3a regulates erythroid
differentiation and induces BTG1, an activator of protein arginine
methyl transferase 1. J Cell Biol. 164:175–184. 2004. View Article : Google Scholar : PubMed/NCBI
|
|
6
|
Hata K, Nishijima K and Mizuguchi J: Role
for Btg1 and Btg2 in growth arrest of WEHI-231 cells through
arginine methylation following membrane immunoglobulin engagement.
Exp Cell Res. 313:2356–2366. 2007. View Article : Google Scholar
|
|
7
|
van Galen JC, Kuiper RP, van Emst L,
Levers M, Tijchon E, Scheijen B, Waanders E, van Reijmersdal SV,
Gilissen C, van Kessel AG, et al: BTG1 regulates glucocorticoid
receptor autoinduction in acute lymphoblastic leukemia. Blood.
115:4810–4819. 2010.PubMed/NCBI
|
|
8
|
Prevot D, Voeltzel T, Birot AM, Morel AP,
Rostan MC, Magaud JP and Corbo L: The leukemia-associated protein
Btg1 and the p53-regulated protein Btg2 interact with the
homeoprotein Hoxb9 and enhance its transcriptional activation. J
Biol Chem. 275:147–153. 2000. View Article : Google Scholar : PubMed/NCBI
|
|
9
|
Prevot D, Morel AP, Voeltzel T, Rostan MC,
Rimokh R, Magaud JP and Corbo L: Relationships of the
antiproliferative proteins BTG1 and BTG2 with CAF1, the human
homolog of a component of the yeast CCR4 transcriptional complex:
involvement in estrogen receptor alpha signaling pathway. J Biol
Chem. 276:9640–9648. 2001. View Article : Google Scholar
|
|
10
|
Busson M, Carazo A, Seyer P, Grandemange
S, Casas F, Pessemesse L, Rouault JP, Wrutniak-Cabello C and
Cabello G: Coactivation of nuclear receptors and myogenic factors
induces the major BTG1 influence on muscle differentiation.
Oncogene. 24:1698–1710. 2005. View Article : Google Scholar : PubMed/NCBI
|
|
11
|
Corjay MH, Kearney MA, Munzer DA, Diamond
SM and Stoltenborg JK: Antiproliferative gene BTG1 is highly
expressed in apoptotic cells in macrophage-rich areas of advanced
lesions in Watanabe heritable hyperlipidemic rabbit and human. Lab
Invest. 78:847–858. 1998.PubMed/NCBI
|
|
12
|
Lee H, Cha S, Lee MS, Cho GJ, Choi WS and
Suk K: Role of antiproliferative B cell translocation gene-1 as an
apoptotic sensitizer in activation-induced cell death of brain
microglia. J Immunol. 171:5802–5811. 2003. View Article : Google Scholar : PubMed/NCBI
|
|
13
|
Rodier A, Marchal-Victorion S, Rochard P,
Casas F, Cassar-Malek I, Rouault JP, Magaud JP, Mason DY, Wrutniak
C and Cabello G: BTG1: a triiodothyronine target involved in the
myogenic influence of the hormone. Exp Cell Res. 249:337–348. 1999.
View Article : Google Scholar : PubMed/NCBI
|
|
14
|
Cho JW, Kim JJ, Park SG, Lee DH, Lee SC,
Kim HJ, Park BC and Cho S: Identification of B-cell translocation
gene 1 as a biomarker for monitoring the remission of acute myeloid
leukemia. Proteomics. 4:3456–3463. 2004. View Article : Google Scholar : PubMed/NCBI
|
|
15
|
Farhana L, Dawson M, Rishi AK, Zhang Y,
Van Buren E, Trivedi C, Reichert U, Fang G, Kirschner MW and
Fontana JA: Cyclin B and E2F-1 expression in prostate carcinoma
cells treated with the novel retinoid CD437 are regulated by the
ubiquitin-mediated pathway. Cancer Res. 62:3842–3849.
2002.PubMed/NCBI
|
|
16
|
Musgrove EA, Hamilton JA, Lee CS, Sweeney
KJ, Watts CK and Sutherland RL: Growth factor, steroid, and steroid
antagonist regulation of cyclin gene expression associated with
changes in T-47D human breast cancer cell cycle progression. Mol
Cell Biol. 13:3577–3587. 1993.PubMed/NCBI
|
|
17
|
Hwang A, McKenna WG and Muschel RJ: Cell
cycle-dependent usage of transcriptional start sites. A novel
mechanism for regulation of cyclin B1. J Biol Chem.
273:31505–31509. 1998. View Article : Google Scholar : PubMed/NCBI
|
|
18
|
Hershko A: Mechanisms and regulation of
the degradation of cyclin B. Philos Trans R Soc Lond B Biol Sci.
354:1571–1576. 1999. View Article : Google Scholar : PubMed/NCBI
|
|
19
|
Vorlaufer E and Peters JM: Regulation of
the cyclin B degradation system by an inhibitor of mitotic
proteolysis. Mol Biol Cell. 9:1817–1831. 1998. View Article : Google Scholar : PubMed/NCBI
|
|
20
|
Quelle DE, Ashmun RA, Shurtleff SA, Kato
JY, Bar-Sagi D, Roussel MF and Sherr CJ: Overexpression of mouse
D-type cyclins accelerates G1 phase in rodent fibroblasts. Genes
Dev. 7:1559–1571. 1993. View Article : Google Scholar : PubMed/NCBI
|
|
21
|
Ewen ME and Lamb J: The activities of
cyclin D1 that drive tumorigenesis. Trends Mol Med. 10:158–162.
2004. View Article : Google Scholar : PubMed/NCBI
|
|
22
|
Arnold A and Papanikolaou A: Cyclin D1 in
breast cancer pathogenesis. J Clin Oncol. 23:4215–4224. 2005.
View Article : Google Scholar : PubMed/NCBI
|
|
23
|
Nahta R and Esteva FJ: Bcl-2 antisense
oligonucleotides: a potential novel strategy for the treatment of
breast cancer. Semin Oncol. 30:143–149. 2003. View Article : Google Scholar : PubMed/NCBI
|
|
24
|
Ghobrial IM, Witzig TE and Adjei AA:
Targeting apoptosis pathways in cancer therapy. CA Cancer J Clin.
55:178–194. 2005. View Article : Google Scholar : PubMed/NCBI
|
|
25
|
Kymionis GD, Dimitrakakis CE,
Konstadoulakis MM, Arzimanoglou I, Leandros E, Chalkiadakis G,
Keramopoulos A and Michalas S: Can expression of apoptosis genes,
bcl-2 and bax, predict survival and responsiveness to chemotherapy
in node-negative breast cancer patients? J Surg Res. 99:161–168.
2001. View Article : Google Scholar : PubMed/NCBI
|
|
26
|
Cohen GM: Caspases: the executioners of
apoptosis. Biochem J. 326:1–16. 1997.
|
|
27
|
Thornberry NA and Lazebnik Y: Caspases:
enemies within. Science. 281:1312–1316. 1998. View Article : Google Scholar : PubMed/NCBI
|
|
28
|
Kuida K, Zheng TS, Na S, Kuan C, Yang D,
Karasuyama H, Rakic P and Flavell RA: Decreased apoptosis in the
brain and premature lethality in CPP32-deficient mice. Nature.
384:368–372. 1996. View
Article : Google Scholar : PubMed/NCBI
|