Introduction
Clear-cell renal cell cancer is the most common
subtype of kidney cancer and comprises ~70% of renal cell
carcinomas (RCCs) (1). Clear-cell
renal cell carcinomas (ccRCCs) are associated with Von
Hippel-Lindau (VHL) disease, an autosomal dominant disorder caused
by germline mutations of the VHL tumor-suppressor gene. By the age
of 70, ~70% of patients with VHL disease develop ccRCC, and the
mean age of manifestation is 37 vs. 61 years for sporadic ccRCC
(2). Furthermore, vhl
inactivation by methylation or mutation has been reported in up to
91% of sporadic ccRCCs.
The VHL protein (pVHL) targets the α subunit of
hypoxia inducible factor (HIF) for ubiquitin-mediated degradation.
Thus, inactivation of vhl results in accumulation of HIF-α
subunits (3). Mammals possess three
isoforms of HIF-α (HIF1-α, HIF2-α and HIF3-α) of which HIF1-α and
HIF2-α are best characterized (4).
Recent findings indicate that HIF2-α is the isoform critical for
tumorigenesis of ccRCC (5), whereas
HIF1-α may act as a tumor suppressor (6). Apart from the regulation of HIF, pVHL
influences p53-mediated cell cycle arrest and apoptosis (7), primary cilium maintenance (8), microtubule-dependent functions
(9) and response to DNA damage
(10).
Recently, loss of pVHL was reported to induce
senescence mediated by retinoblastoma protein and p400 (EP400, E1A
binding protein p400) (11). This
implies that senescence is a downstream line of defense in the
tumorigenesis of VHL-associated malignancies. p400 belongs to the
SWI2/SNF2 family of chromatin remodeling proteins, acts as a DNA
damage response protein (12) and
regulates p21-induced senescence (13) and E1A-induced apoptosis (14,15).
Ki-67 is a proliferation-associated antigen, and
Ki-67 labeling is used to estimate proliferation. The MIB1
antibody, which is reactive against Ki-67, can be used on
paraffin-embedded tissue (16) and
correlates with the mitotic index (17). Prognostic value is confirmed in many
tumor entities including RCC (18–21).
Although absence of proliferation does not necessarily mean
senescence, senescent cells do not proliferate. Therefore, in
combination with other markers, Ki-67 is often used to characterize
senescent cells (22).
To the best of our knowledge, there is no data
concerning the expression of p400 in RCCs, although ccRCCs are the
most common tumors associated with loss of pVHL function. We,
therefore, investigated the expression of p400 in a large and well
documented series of RCCs with long-term follow-up information.
Furthermore, we assessed proliferation by Ki-67 labeling and
correlated the findings with the results obtained by p400
immunohistochemistry.
Patients and methods
Patients
Tissue samples from 868 patients with primary renal
cell carcinoma, treated at the Department of Urology (University of
Heidelberg, Germany) between 1987 and 2005, were collected in the
Tumor Tissue Bank of the National Center for Tumor Diseases
(Heidelberg) and studied after approval by the Ethics Committee of
the University of Heidelberg. Samples were graded according to the
4-tiered nuclear grading system and staged based on the TNM
classification (2002) by experienced pathologists. No adjuvant
treatment was administered for localized disease. Patients with
metastasized disease, with a Karnofsky performance index of ≥80 and
without medical contraindications received interferon-α- and
interleukin-2-based immunotherapy. Clinical follow-up was available
for all cases. Patients were prospectively evaluated every 3 months
for the first 2 years after treatment; every 6 months for the next
3 years, and yearly thereafter (chest X-ray or thoracic CT scan;
abdominal sonography or CT scan or MRI; serum chemistry).
Tissue microarray
A series of tissue microarrays containing 932
primary tumor and corresponding normal tissue samples from 932
patients was assembled as previously described (23).In total, a set of 19 array blocks was
generated, each containing 200 tissue core specimens, representing
50 patients per array.
Immunohistochemistry
The tissue microarray slides were dewaxed and
rehydrated using xylene and a series of graded alcohols, followed
by heat-induced antigen retrieval using a target retrieval solution
(S2031; DakoCytomation, Glostrup, Denmark) in a pressure cooker for
15 min. Staining was performed using an automated staining system
(Techmate 500; DakoCytomation) with polyclonal anti-P400 rabbit
antiserum (1:100; Sigma-Aldrich, St. Louis, MO, USA) for 45 min and
avidin-biotin-complex peroxidase technique using
aminoethylcarbazole for visualization and hematoxylin for
counterstaining. In accordance with the manufacturer’s
instructions, the following solutions were used: ChemMate Detection
kit (K5003; DakoCytomation, containing Dako REAL™ Link,
ready-to-use biotinylated goat anti-mouse and anti-rabbit
immunoglobulins, and Dako REAL™ AEC/H2O2
substrate solution), ChemMate Buffer kit (K5006; DakoCytomation),
and for reduction of non-specific avidin/biotin-related staining
the Avidin/Biotin Blocking kit (SP-2001; Vector Laboratories,
Burlingame, CA, USA). As a negative control for the
immunohistochemical staining procedure, the primary antibody was
omitted with all other experimental conditions kept constant.
Staining intensity was categorized as: 0, negative; 1, low; 2,
medium; and 3, high. Staining quantity was categorized as: 0, no
expression; 1, positivity in 1–9% of cells; 2, positivity in 10–50%
of cells; 3, positivity in 50–100% of cells. For the
semi-quantitative immunohistochemical assessment of p400
expression, a score was calculated by multiplying the staining
intensity by staining quantity (range, 0–9). Two independent scores
were obtained for each patient from two different cylindrical core
tissue specimens. If divergent p400 expression scores were observed
in the 2 cores, then the higher score was used for further
analyses. In addition to the investigation of individual expression
categories, a p400 expression score >4 was defined as ‘increased
p400 expression’ and lower scores as ‘decreased p400 expression’.
Ki-67 labeling was performed as previously published (24).
Statistical methods
The non-normal distribution of expression scores and
patient/tumor characteristics motivated the use of non-parametric
statistics. Chi-squared tests were used to investigate the possible
relationship between the expression of p400 and Ki-67, and clinical
and pathological characteristics. Spearman’s rank correlation was
estimated to quantify the relationship between p400 expression and
the Ki-67 proliferative index.
Survival was calculated from the date of nephrectomy
to three different events: overall survival (OS, event, death by
any cause), cancer-specific survival (CS, event, tumor-related
death), and progression-free survival (PFS, event, recurrence,
metastasis, or death by any cause). Survival time was censored for
patients who did not experience the investigated event; for
example, patients alive at last contact (OS, CS and PFS) or
patients with a non-tumor-related death (CS and PFS). The
association between survival times and p400/Ki-67 expression was
first assessed by log-rank tests and represented using Kaplan-Meier
plots. In order to account for the influence of established
prognostic factors, hazard ratios (HRs) and 95% confidence
intervals (CIs) were adjusted for patient gender and age,
histology, tumor extent, lymph node metastasis, distant metastasis,
grade of malignancy, resection type and Karnofsky performance in a
multiple Cox proportional hazard regression. The present study had
80% power to identify an adjusted HR >2.81 or <0.48 (5% type
I error probability, 10% of patients with increased p400
expression). Statistical analyses were implemented using R
(http://www.rproject.org). Probability values
<0.05 were considered to indicate a statistically significant
result.
Results
Clinical characteristics of the
patients
The patient collective included 868 patients with
complete clinical and pathological information. The median time of
follow-up among the 409 patients who died was 27.2 months. By the
end of the follow-up, 251 patients had died from RCC, 158 died due
to another cause and 459 were still alive. Table I provides a summary of the clinical
and pathological data. As expected, established prognostic factors
for RCCs including tumor stage, grade and occurrence of distant
metastasis correlated with patient prognosis. For example, 73% (213
out of 290) of patients affected by stage 3 tumors died in
comparison to 31% of patients with stage 1 tumors, resulting in an
estimated HR of 2.07 (95% CI, 1.62–2.64).
 | Table IClinical and pathological
characteristics in the investigated patient collective and their
association with survival (results from the multivariate Cox
regression). |
Table I
Clinical and pathological
characteristics in the investigated patient collective and their
association with survival (results from the multivariate Cox
regression).
| | Overall
survival | Cancer-specific
survival | Progression-free
survival |
|---|
| |
|
|
|
|---|
|
Characteristics | Patients | Global P-value | Na | HR with 95% CI | Global P-value | Na | HR with 95% CI | Global P-value | Na | HR with 95% CI |
|---|
| Gender |
| Male | 544 | 0.0006 | 278 | 0.69
(0.55–0.85) | 0.01 | 174 | 0.70
(0.53–0.93) | 0.004 | 118 | 0.61
(0.44–0.85) |
| Female | 324 | | 131 | (Ref.) | | 77 | (Ref.) | | 53 | (Ref.) |
| Age at diagnosis
(years) |
| <60 | 314 |
<.0001 | 115 | 1.64
(1.31–2.05) | 0.07 | 164 | 1.29
(0.97–1.70) | 0.64 | 56 | 1.08
(0.78–1.51) |
| ≥60 | 554 | | 294 | (Ref.) | | 164 | (Ref.) | | 115 | (Ref.) |
| Histology |
| Clear-cell | 742 | 0.07 | 371 | (Ref.) | 0.10 | 229 | (Ref.) | 0.05 | 157 | (Ref.) |
| Papillary | 87 | | 26 | 0.79
(0.53–1.19) | | 12 | 0.84
(0.47–1.55) | | 10 | 0.51
(0.26–0.98) |
| Chromophobe | 31 | | 5 | 0.40
(0.17–0.98) | | 3 | 0.36
(0.11–1.14) | | 2 | 0.24
(0.06–0.97) |
| Other | 8 | | 1 | 1.74
(0.80–3.77) | | 7 | 1.98
(0.90–4.34) | | 2 | 1.01
(0.24–4.26) |
| Tumor extent
(T) |
| 1 | 476 |
<0.0001 | 147 | (Ref.) |
<0.0001 | 53 | (Ref.) |
<0.0001 | 47 | (Ref.) |
| 2 | 89 | | 37 | 1.32
(0.92–1.91) | | 25 | 2.30
(1.42–3.73) | | 25 | 4.03
(2.41–6.73) |
| 3 | 290 | | 213 | 2.07
(1.62–2.64) | | 162 | 3.57
(2.51–5.06) | | 92 | 4.43
(2.92–6.73) |
| 4 | 13 | | 12 | 1.95
(1.04–3.66) | | 11 | 3.16
(1.57–6.38) | | 7 | 26.2
(10.6–64.7) |
| Lymph node
metastasis (N) |
| No | 804 | 0.16 | 352 | (Ref.) | 0.10 | 198 | (Ref.) |
<0.0001 | 145 | (Ref.) |
| Yes | 64 | | 57 | 1.25
(0.91–1.72) | | 53 | 1.34
(0.95–1.90) | | 26 | 4.05
(2.49–6.58) |
| Distant metastasis
(M) |
| No | 728 |
<0.0001 | 283 | (Ref.) |
<0.0001 | 131 | (Ref.) |
<0.0001 | 158 | (Ref.) |
| Yes | 140 | | 126 | 4.11
(3.18–5.31) | | 120 | 6.20
(4.60–8.36) | | 13 | 0.21
(0.41–21.4) |
| Grade of
malignancy |
| 1 | 223 |
<0.0001 | 86 | (Ref.) |
<0.0001 | 34 | (Ref.) | 0.0003 | 35 | (Ref.) |
| 2 | 500 | | 207 | 1.05
(0.81–1.37) | | 116 | 1.16
(0.78–1.73) | | 91 | 1.28
(0.85–1.93) |
| 3/4 | 145 | | 116 | 1.91
(1.38–2.64) | | 101 | 2.43
(1.57–3.76) | | 45 | 2.55
(1.55–4.19) |
| Type of
surgery |
| Nephrectomy | 727 | 0.78 | 367 | (Ref.) | 0.64 | 235 | (Ref.) | 0.02 | 147 | (Ref.) |
| Resection | 141 | | 42 | 0.95
(0.68–1.34) | | 16 | 0.88
(0.51–1.50) | | 24 | 1.84
(1.12–3.03) |
| Karnofsky
performance |
| ≥80% | 800 |
<0.0001 | 352 | (Ref.) | 0.006 | 223 | (Ref.) | 0.84 | 155 | (Ref.) |
| <80% | 68 | | 57 | 2.28
(1.70–3.06) | | 28 | 1.78
(1.18–2.69) | | 16 | 1.06
(0.62–1.81) |
p400 expression, patient prognosis and
tumor characteristics
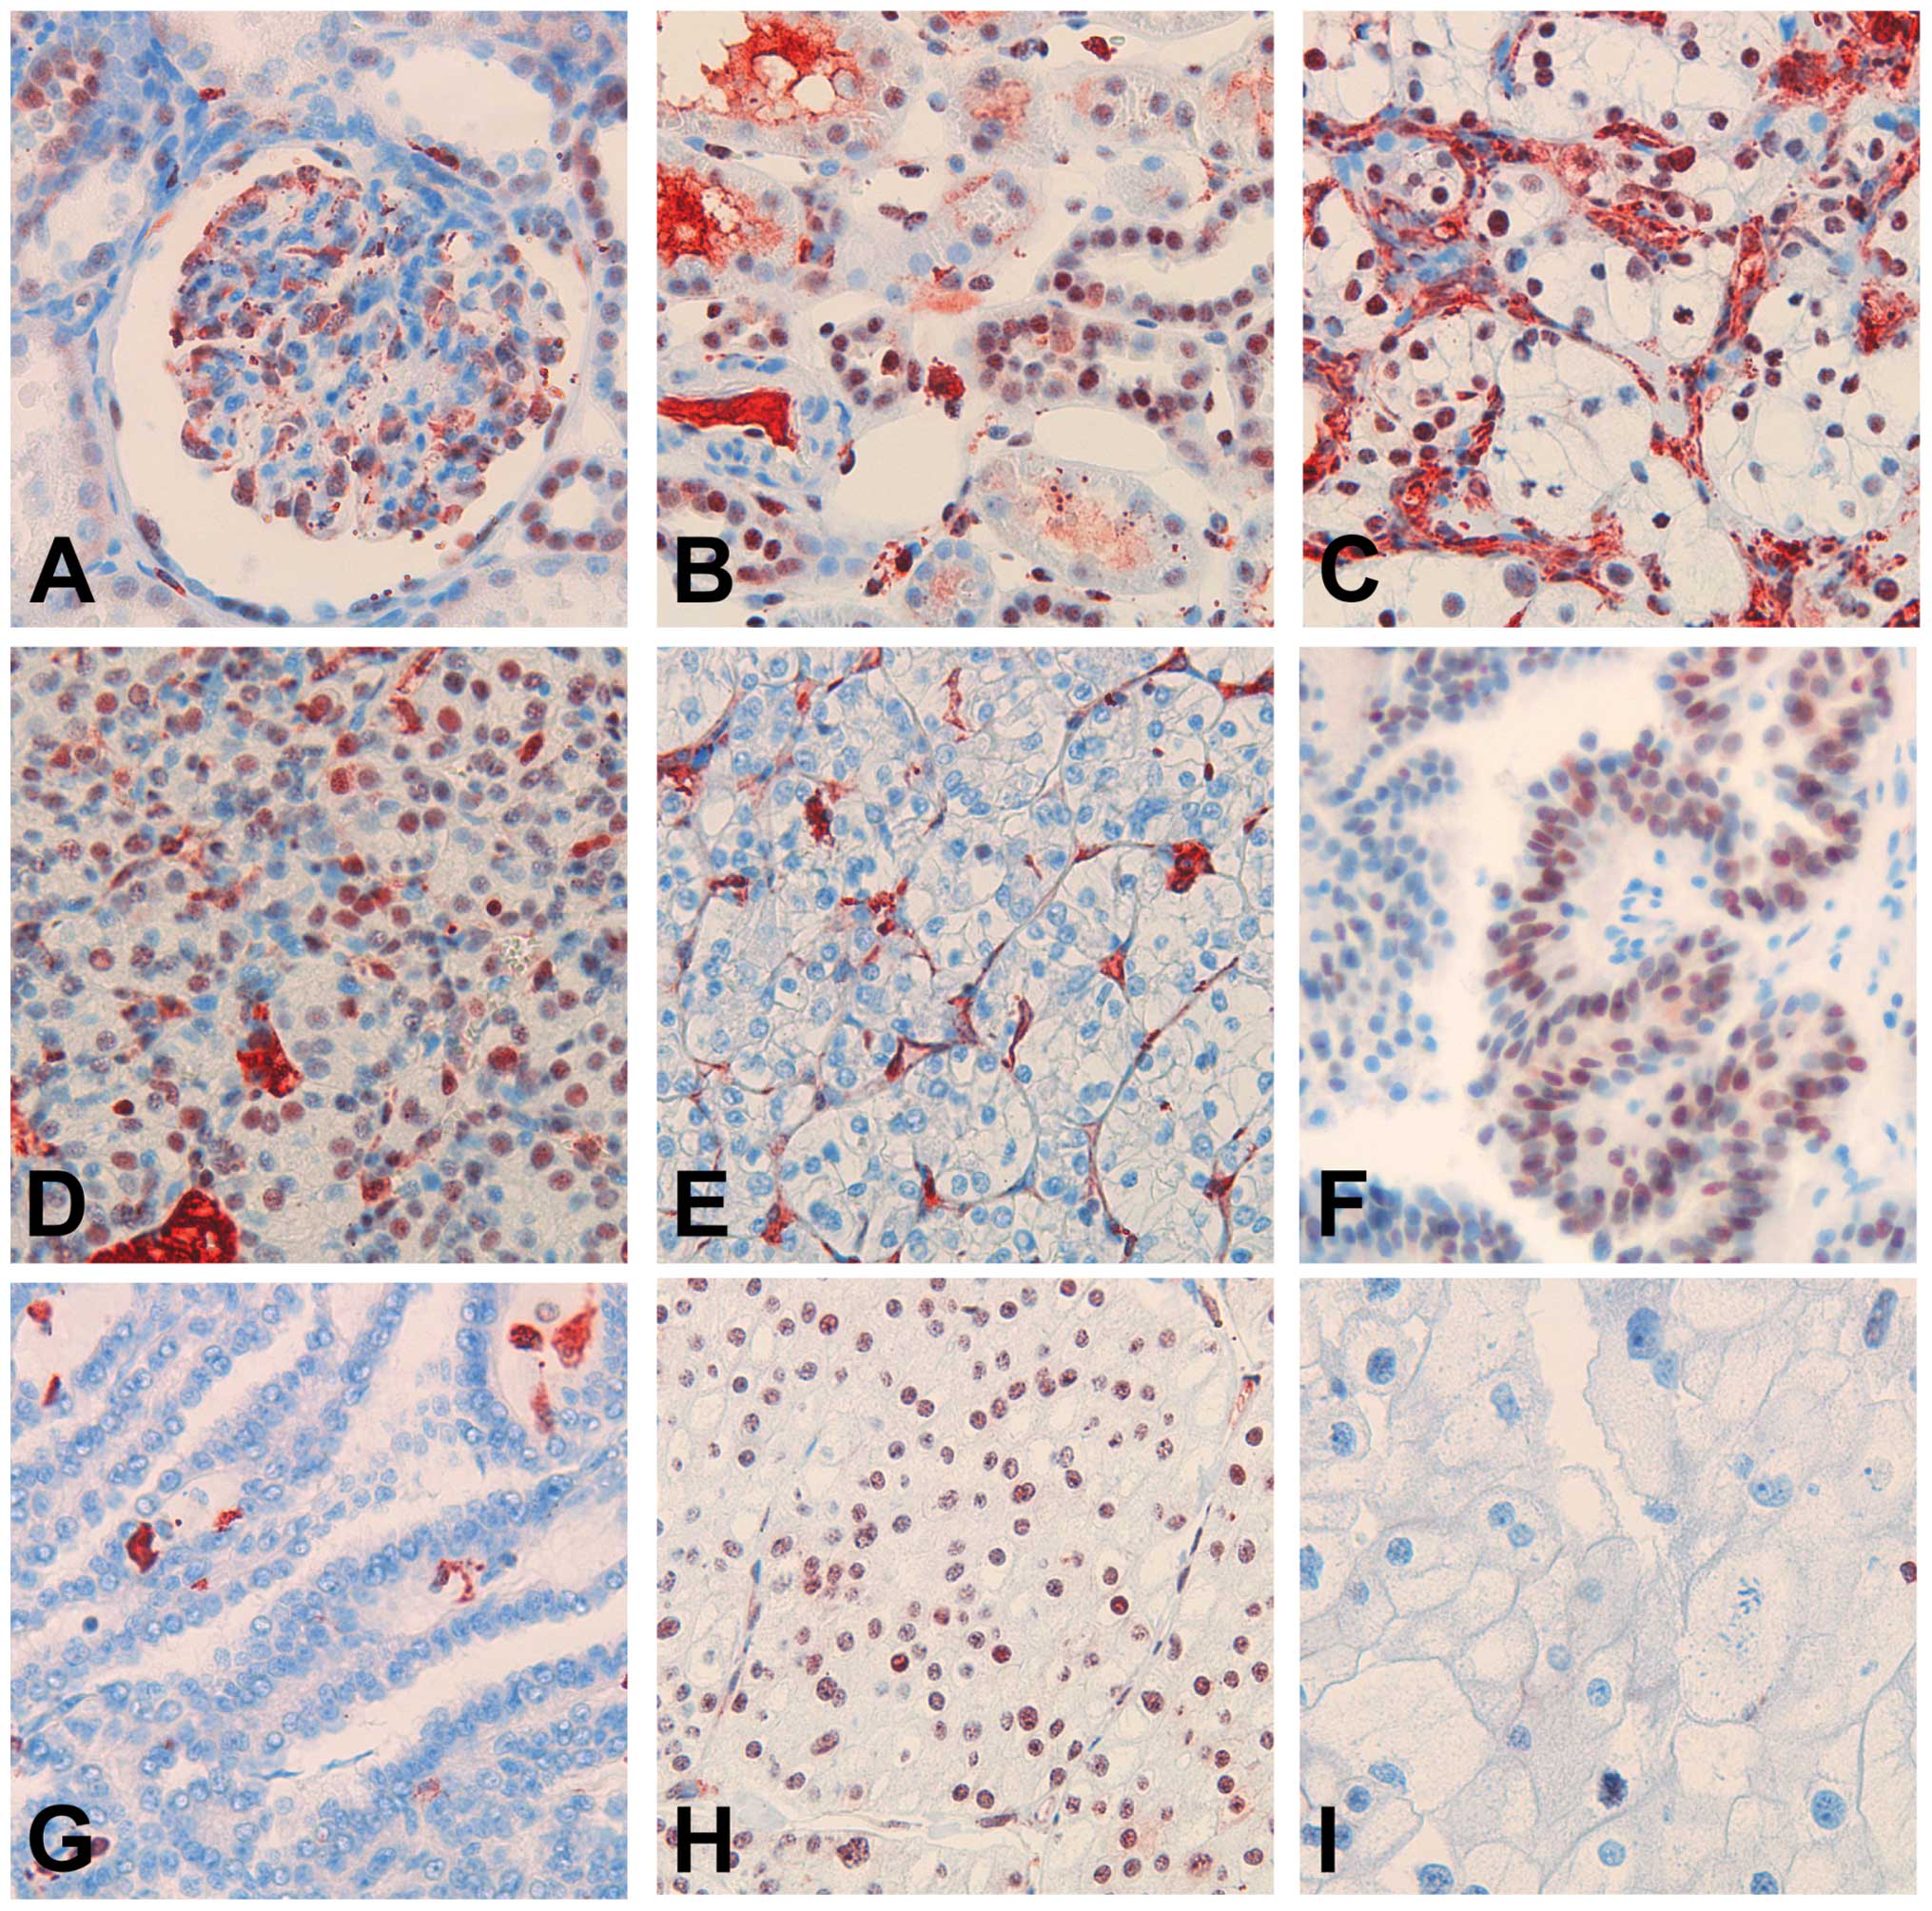
Nuclear p400 was weakly detected in glomerular
podocytes, the majority of distal tubules, and, only inconsistently
and weakly, in the proximal tubule epithelium (Fig. 1A and B). P400 expression scores were
obtained for 787 tumors; 81 samples were excluded due to
insufficient tumor tissue and fixation artifacts. The majority of
tumors showed complete loss of p400 expression (n=502, 64%),
whereas the remaining tumors showed nuclear positivity with
variable intensity and percentage of nuclei (Fig. 1C–I). Cytoplasmic staining was
considered as unspecific.
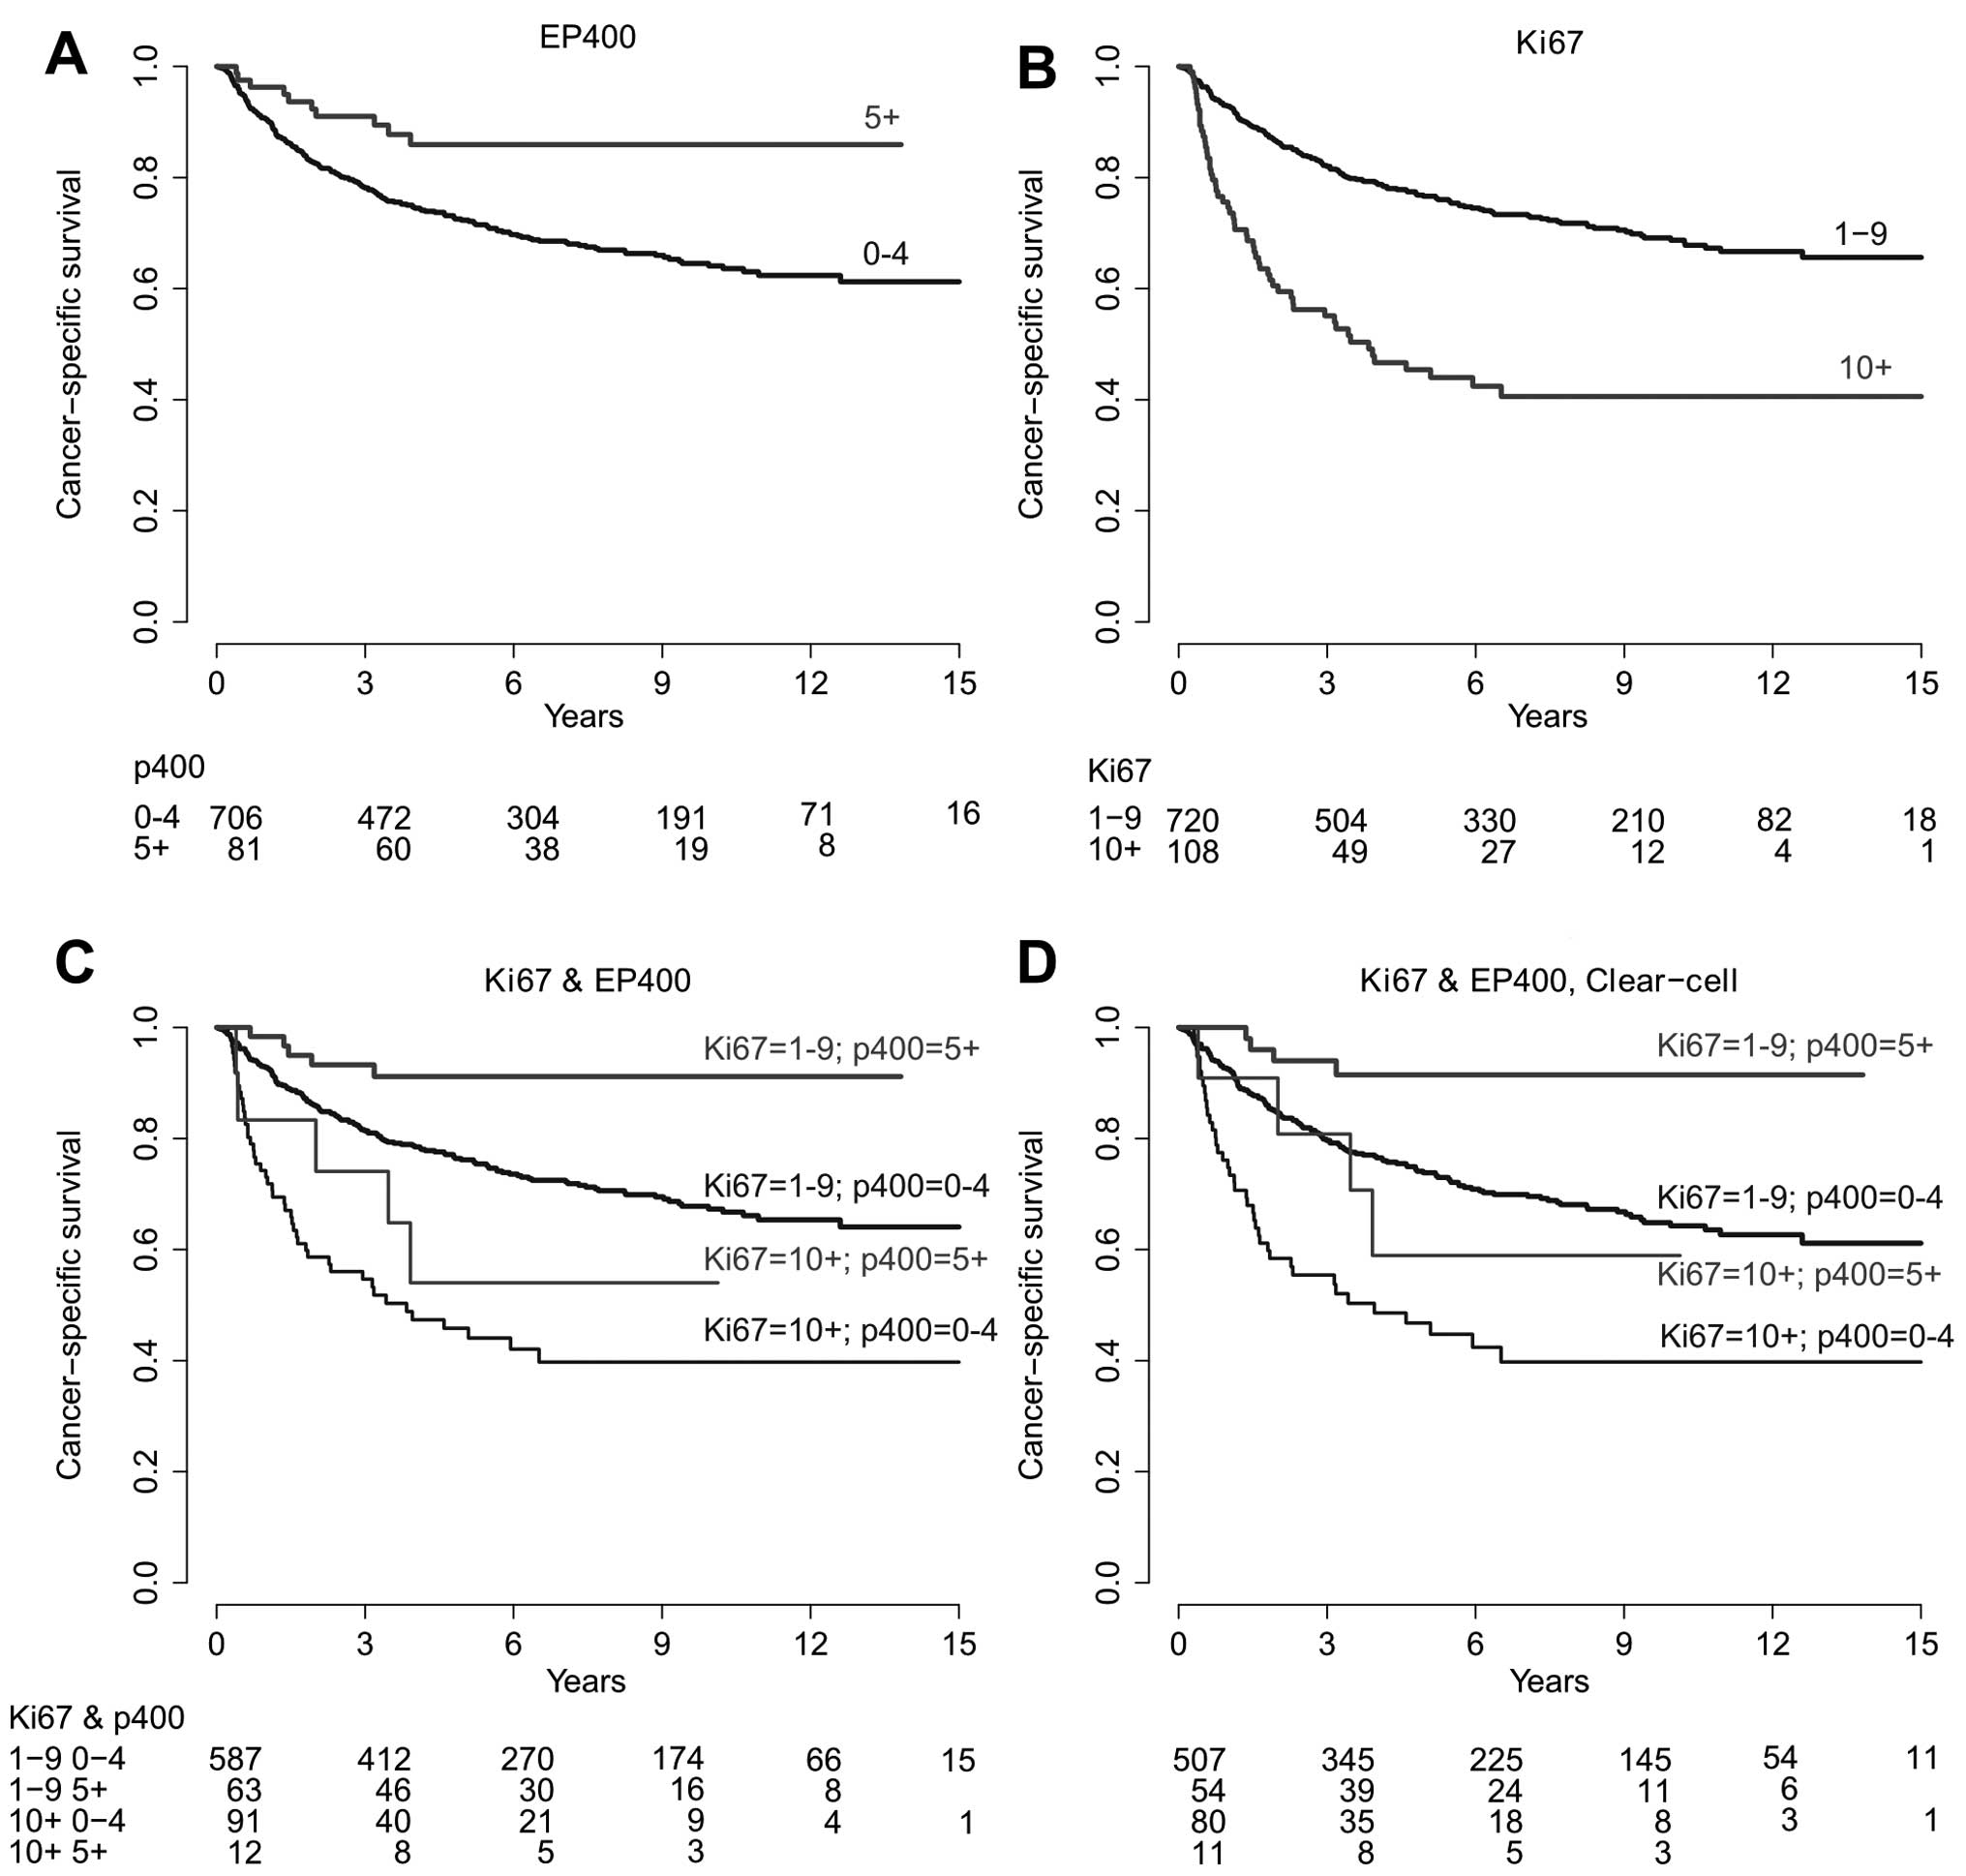
When tumors were grouped according to p400
expression, univariate survival analysis revealed an improved OS,
CS and PFS in patients affected by tumors with increased p400
expression (5+, Table II).
Kaplan-Meier plots are depicted in Fig.
2. Global probability values from multiple regression analysis
on OS, CS and PFS did not reach statistical significance (Table II).
| Table IIAssociation between p400/Ki-67
expression and patient survival. |
Table II
Association between p400/Ki-67
expression and patient survival.
| | Overall
survival | Cancer-specific
survival | Progression-free
survival |
|---|
| |
|
|
|
|---|
| Marker | Patients | Global P-value | Na | HR with 95% CI | Global P-value | Na | HR with 95% CI | Global P-value | Na | HR with 95% CI |
|---|
| Raw estimates |
| p400 |
| 0 | 502 | 0.02 | 247 | (Ref.) | 0.02 | 156 | (Ref.) | 0.02 | 114 | (Ref.) |
| 1 | 73 | | 39 | 1.09
(0.78–1.53) | | 21 | 0.95
(0.60–1.50) | | 13 | 0.78
(0.44–1.39) |
| 2 | 61 | | 34 | 1.15
(0.80–1.64) | | 20 | 1.11
(0.69–1.76) | | 8 | 0.56
(0.27–1.14) |
| 3,4 | 70 | | 29 | 0.83
(0.56–1.22) | | 15 | 0.67
(0.39–1.14) | | 11 | 0.65
(0.35–1.20) |
| 5–9 | 81 | | 21 | 0.51
(0.32–0.79) | | 10 | 0.37
(0.20–0.71) | | 6 | 0.29
(0.13–0.66) |
| Ki-67 |
| 1 | 216 |
<0.0001 | 99 | (Ref.) |
<0.0001 | 53 | (Ref.) | 0.002 | 34 | (Ref.) |
| 2 | 151 | | 73 | 1.02
(0.75–1.38) | | 44 | 1.15
(0.77–1.72) | | 31 | 1.28
(0.79–2.09) |
| 3 | 252 | | 102 | 0.81
(0.62–1.07) | | 58 | 0.86
(0.60–1.25) | | 52 | 1.24
(0.81–1.92) |
| 5 | 101 | | 47 | 1.03
(0.72–1.45) | | 32 | 1.31
(0.85–2.04) | | 19 | 1.25
(0.71–2.19) |
| 10+ | 108 | | 74 | 2.18
(1.61–2.95) | | 56 | 2.92
(2.00–4.25) | | 30 | 2.61
(1.60–4.28) |
| Adjusted
estimates |
| p400 |
| 0 | 502 | 0.11 | 247 | (Ref.) | 0.14 | 156 | (Ref.) | 0.32 | 114 | (Ref.) |
| 1 | 73 | | 39 | 1.19
(0.84–1.68) | | 21 | 1.16
(0.73–1.86) | | 13 | 0.84
(0.46–1.51) |
| 2 | 61 | | 34 | 1.43
(1.00–2.06) | | 20 | 1.61
(1.00–2.59) | | 8 | 0.73
(0.35–1.50) |
| 3,4 | 70 | | 29 | 1.16
(0.78–1.72) | | 15 | 1.02
(0.59–1.79) | | 11 | 1.11
(0.59–2.08) |
| 5–9 | 81 | | 21 | 0.72
(0.45–1.13) | | 10 | 0.61
(0.32–1.17) | | 6 | 0.44
(0.19–1.02) |
| Ki-67 |
| 1 | 216 | 0.16 | 99 | (Ref.) | 0.20 | 53 | (Ref.) | 0.40 | 34 | (Ref.) |
| 2 | 151 | | 73 | 0.93
(0.69–1.27) | | 44 | 0.99
(0.66–1.48) | | 31 | 1.32
(0.81–2.16) |
| 3 | 252 | | 102 | 0.78
(0.59–1.03) | | 58 | 0.76
(0.52–1.12) | | 52 | 1.30
(0.84–2.01) |
| 5 | 101 | | 47 | 0.82
(0.57–1.17) | | 32 | 0.86
(0.54–1.35) | | 19 | 1.29
(0.73–2.27) |
| 10+ | 108 | | 74 | 1.11
(0.81–1.54) | | 56 | 1.21
(0.81–1.80) | | 30 | 1.69
(1.01–2.82) |
Table III shows
the distribution of p400 expression according to tumor/patient
characteristics. The proportion of tumors with increased p400
expression decreased with tumor extent (P=0.02), lymph node
metastasis (P=0.01) and was lower in tumors treated with
nephrectomy (P<0.0001).
| Table IIIRelationship between clinical and
pathological characteristics and Ki-67/p400 expression. |
Table III
Relationship between clinical and
pathological characteristics and Ki-67/p400 expression.
| p400 | Ki-67 | Ki-67 and p400 |
|---|
|
|
|
|
|---|
|
Characteristics | 0–4 n (%) | 5+ n (%) | P-value | 1–9 n (%) | 10+ n (%) | P-value | Other n (%) | 10+ and 0–4 n
(%) | P-value |
|---|
| Gender |
| Male | 442 (91) | 44 (9) | 0.47 | 449 (87) | 69 (13) | 0.76 | 404 (87) | 59 (13) | 0.48 |
| Female | 269 (89) | 32 (11) | | 271 (87) | 39 (13) | | 258 (89) | 32 (11) | |
| Age at diagnosis
(years) |
| <60 | 249 (89) | 31 (11) | 0.32 | 259 (89) | 31 (11) | 0.14 | 237 (91) | 23 (9) | 0.05 |
| ≥60 | 462 (91) | 45 (9) | | 461 (86) | 77 (14) | | 425 (86) | 68 (14) | |
| Histology |
| Clear-cell | 606 (90) | 65 (10) | 0.42 | 623 (87) | 95 (13) | 0.005 | 572 (88) | 80 (12) | 0.01 |
| Papillary | 74 (94) | 5 (6) | | 74 (89) | 9 (11) | | 68 (89) | 8 (11) | |
| Chromophobe | 26 (84) | 5 (16) | | 19 (100) | 0 (0) | | 19 (100) | 0 (0) | |
| Other | 5 (83) | 1 (17) | | 4 (50) | 4 (50) | | 3 (50) | 3 (50) | |
| Tumor extent
(T) |
| 1 | 382 (88) | 54 (12) | 0.02 | 412 (91) | 40 (9) |
<0.0001 | 384 (93) | 31 (7) |
<0.0001 |
| 2 | 76 (92) | 7 (8) | | 73 (87) | 11 (13) | | 67 (86) | 11 (14) | |
| 3 | 241 (94) | 15 (6) | | 228 (81) | 52 (19) | | 204 (82) | 45 (18) | |
| 4 | 12 (100) | 0 (0) | | 7 (58) | 5 (42) | | 7 (64) | 4 (36) | |
| Lymph node
metastasis (N) |
| No | 656 (90) | 76 (10) | 0.01 | 678 (88) | 89 (12) |
<0.0001 | 626 (89) | 74 (11) |
<0.0001 |
| Yes | 55 (100) | 0 (0) | | 42 (69) | 19 (31) | | 36 (68) | 17 (32) | |
| Distant metastasis
(M) |
| No | 595 (90) | 67 (10) | 0.31 | 616 (89) | 76 (11) |
<0.0001 | 566 (90) | 66 (10) | 0.001 |
| Yes | 116 (93) | 9 (7) | | 103 (76) | 32 (24) | | 96 (79) | 25 (21) | |
| Grade of
malignancy |
| 1 | 172 (87) | 26 (13) | 0.08 | 201 (95) | 11 (5) |
<0.0001 | 181 (96) | 8 (4) |
<0.0001 |
| 2 | 421 (91) | 43 (9) | | 427 (89) | 51 (11) | | 403 (91) | 42 (9) | |
| 3/4 | 118 (94) | 7 (6) | | 92 (67) | 46 (33) | | 78 (66) | 41 (34) | |
| Type of
surgery |
| Nephrectomy | 616 (93) | 45 (7) |
<0.0001 | 601 (86) | 95 (14) | 0.23 | 554 (87) | 81 (13) | 0.19 |
| Resection | 95 (75) | 31 (25) | | 119 (90) | 13 (10) | | 108 (92) | 10 (8) | |
| Karnofsky
performance |
| ≥80% | 650 (90) | 74 (10) | 0.07 | 668 (87) | 96 (13) | 0.16 | 614 (88) | 80 (12) | 0.11 |
| <80% | 61 (97) | 2 (3) | | 52 (81) | 12 (19) | | 48 (81) | 11 (19) | |
Comparison of p400 and Ki-67
expression
As loss of p400 may induce senescence in RCCs, we
used Ki-67 labeling to estimate the proliferation index. Although
the absence of proliferation is not equivalent with senescence,
tumors with a high amount of senescent cells are expected to show
less proliferation.
Ki-67 labeling was obtained for 828 tumors. The
expression of Ki-67 was not available for 34 patients with data on
p400 expression.
As expected, univariate survival analysis revealed a
less favorable CS in patients affected with tumors characterized by
a high proliferation rate (Ki-67 >10%). Kaplan-Meier plots are
depicted in Fig. 2. Global
probability values from multiple regression analysis on OS, CS and
PFS did not reach statistical significance (Table II). Kaplan-Meier plots stratified
by p400 and Ki-67 expression are shown in Fig. 2. The distribution of patients by
Ki-67 expression and tumor/patient characteristics is shown in
Table III.
Notably, patients affected by low proliferative
tumors showed a particularly good prognosis in the case of
increased p400 expression (cancer-specific HR, 0.28; 95% CI,
0.12–0.69, compared to decreased p400 expression; Table III). Approximately 12% (91/753) of
the patients were diagnosed with highly proliferative tumors that
showed a decreased p400 expression. These patients had a poor
prognosis (cancer-specific HR, 2.79; 95% CI, 2.01–3.87, compared to
low proliferative tumors with a decreased p400 expression).
Cancer-specific survival differences among the 4 groups combining
Ki-67 and p400 expression categories remained statistically
significant after adjustment for established prognostic factors in
the multiple regression survival analysis (Table IV).
| Table IVCombined effect of Ki-67 and p400
expression on patient survival. |
Table IV
Combined effect of Ki-67 and p400
expression on patient survival.
| | Overall
survival | Cancer-specific
survival | Progression-free
survival |
|---|
| |
|
|
|
|---|
|
Characteristics | Patients | Global P-value | Na | HR with 95% CI | Global P-value | Na | HR with 95% CI | Global P-value | Na | HR with 95% CI |
|---|
| Whole study
population |
| Raw estimates |
| Ki-67 1–9, p400
0–4 | 587 |
<0.0001 | 275 | (Ref.) |
<0.0001 | 159 | (Ref.) | 0.0001 | 116 | (Ref.) |
| Ki-67 1–9, p400
5+ | 63 | | 14 | 0.47
(0.27–0.80) | | 5 | 0.28
(0.12–0.69) | | 4 | 0.29
(0.11–0.80) |
| Ki-67 10+, p400
0–4 | 91 | | 63 | 2.29
(1.74–3.01) | | 47 | 2.79
(2.01–3.87) | | 26 | 2.23
(1.45–3.42) |
| Ki-67 10+, p400
5+ | 12 | | 6 | 1.27
(0.56–2.84) | | 5 | 1.73
(0.71–4.21) | | 2 | 0.96
(0.24–3.87) |
| Adjusted
estimates |
| Ki-67 1–9, p400
0–4 | 587 | 0.07 | 275 | (Ref.) | 0.02 | 159 | (Ref.) | 0.13 | 116 | (Ref.) |
| Ki-67 1–9, p400
5+ | 63 | | 14 | 0.58
(0.34–1.01) | | 5 | 0.40
(0.16–0.98) | | 4 | 0.35
(0.13–0.97) |
| Ki-67 10+, p400
0–4 | 91 | | 63 | 1.27
(0.95–1.70) | | 47 | 1.43
(1.02–2.02) | | 26 | 1.29
(0.80–2.07) |
| Ki-67 10+, p400
5+ | 12 | | 6 | 1.19
(0.53–2.70) | | 5 | 1.53
(0.62–3.79) | | 2 | 1.23
(0.30–4.99) |
| Clear-cell
only |
| Adjusted
estimates |
| Ki-67 1–9, p400
0–4 | 507 | 0.19 | 252 | (Ref.) | 0.06 | 149 | (Ref.) | 0.13 | 108 | (Ref.) |
| Ki-67 1–9, p400
5+ | 54 | | 13 | 0.64
(0.37–1.13) | | 4 | 0.37
(0.14–1.02) | | 3 | 0.30
(0.09–0.93) |
| Ki-67 10+, p400
0–4 | 80 | | 56 | 1.25
(0.92–1.70) | | 41 | 1.40
(0.97–2.02) | | 24 | 1.29
(0.79–2.12) |
| Ki-67 10+, p400
5+ | 11 | | 5 | 1.02
(0.42–2.50) | | 4 | 1.26
(0.46–3.47) | | 2 | 1.24
(0.31–5.06) |
The expression of p400 and Ki-67 showed a weak
positive correlation (Spearman’s rank correlation rho=0.10; 95% CI,
0.03–0.17; P=0.006). This correlation was higher among grade I
tumors (rho=0.25; 95% CI, 0.11–0.37; P=0.004) and nearly absent
among grade 3 tumors (rho=−0.01; 95% CI, 0.19–0.16; P=0.88; data
not shown).
In the present, study high proliferation was only
noted in 6% of low grade carcinomas. In contrast, this fraction
increased up to 12% in low grade RCCs with high p400 expression,
which outnumbers the fraction of high proliferative intermediate
carcinomas (all G2) (10%) and nearly equals the fraction of high
proliferative carcinomas based on the whole collective (13%)
(Table V).
| Table VInteraction between Ki-67 and p400
regarding tumor grade. |
Table V
Interaction between Ki-67 and p400
regarding tumor grade.
| Ki-67-
labeling | P400
expression | Grade |
|---|
|
|---|
| 1, n (%) | 2, n (%) | 3/4, n (%) |
|---|
| 1–9 | 0–4 | 155 (82) | 361 (81) | 71 (60) |
| 1–9 | 5+ | 23 (12) | 36 (8) | 4 (3) |
| 10+ | 0–4 | 8 (4) | 42 (9) | 41 (34) |
| 10+ | 5+ | 3 (2) | 6 (1) | 3 (3) |
Discussion
Inactivation of vhl is a pivotal event in the
carcinogenesis of the majority of either sporadic or hereditary
clear-cell renal cell carcinoma (ccRCC) (25,26).
In addition to the well-known function of regulating hypoxia
inducible factor (HIF), VHL protein (pVHL) influences several
additional intracellular processes including senescence. Recently,
Young et al(27) reported
activation of an HIF-independent senescence program mediated by
loss of pVHL, downregulation of p400, stabilization of
p27KIP and activation of Rb.
In the present study, we investigated the expression
status of p400 in a large series of RCCs and compared the findings
with the proliferation rate and clinical and pathological
parameters. We found that loss of p400 expression was observed in
the majority of RCCs. Notably, the proportion of carcinomas with
decreased p400 expression increased with advancing tumor stage (T1,
88%; T2, 92%; T, 94%; T4, 100%) and loss of differentiation (G1,
87%; G2, 91%; G3, 94%) and was more often encountered in carcinomas
with established regional lymph node metastasis. Furthermore, the
proportion of carcinomas with compete loss of p400 increased with
advancing tumor stage (T1, 59%; T2, 63%; T3/4, 72%; P=0.002) and
loss of differentiation (G1, 58%; G2, 63%; and G3, 78%;
P<0.0001) and was more often encountered in carcinomas with
established regional lymph node metastasis (P=0.02) (data not
shown).
Induction of senescence by inactivation of
tumor-suppressor genes such as vhl(28,29),
nf1(30) or
pten(31) but also by
activation of oncogenes such as ras(32) or braf(22) has been reported and is considered an
important mechanism of mammalian cells by which to limit tumor
development (33). Cellular
senescence denotes a stable loss of proliferative capacity, and
Ki-67 labeling in combination with other markers is recommended to
detect senescent cells (33).
Comparison of p400 expression and proliferation, measured by Ki-67
immunohistochemistry, showed a statistically significant positive
correlation in well-differentiated carcinomas and was almost null
among G3 carcinomas. In addition, high proliferation (Ki-67 index
10+) was found in 12% of carcinomas with a positive p400
expression, in contrast to only 5% in p400-negative low grade RCCs.
This may indicate that retained p400 expression is required for
proliferation in low grade carcinomas whereas in dedifferentiated
tumors other mechanisms might contribute to the escape of
senescence.
In human cells, loss of p400 also triggers the
p53/p21-dependent senescence pathway (13) and, although RCCs rarely harbor p53
mutations, repression of the p53 pathway in RCC-derived cell lines
has been reported (34). Burrows
et al(35) reported that
Polybromo-1 (BAF180, PBRM1) is required for p53-induced senescence;
hence mutations of pbrm1 may provide a mechanism to
antagonize p53 function in cancer cells. Polybromo-1 has
recently gained attention as truncated mutations have been
identified in up to 41% of ccRCCs (36), indicating that pbrm1 may be a
second major cancer-related gene in the carcinogenesis of ccRCCs.
Therefore, mutations in pbrm1 may be an additional mechanism
in RCCs to escape senescence induced by loss of vhl. Given
that kidney cancer is not a single tumor entity but comprises a
number of different types of cancer (25) and ccRCCs by themselves show
substantial genetic heterogeneity (37), it is quite likely that a variety of
other pathomechanisms contribute to the escape from senescence
induced by loss of VHL.
Importantly, the present study showed that patients
affected by highly proliferative RCCs with decreased p400
expression have a very unfavorable clinical course with a 5-year
cancer-specific survival rate of only 44% (standard error, SE 0.06)
in contrast to 76% (SE, 0.02) among low proliferative RCCs with
decreased p400 expression, and 92% (SE, 0.04) in low proliferative
RCCs with an increased p400 expression. The proliferation rate
obtained by Ki-67 labeling is an established well-known prognostic
factor in RCCs (18). In our
collective, high proliferation (10+) was also an unfavorable
prognostic marker. However, after implementing p400 in the
multivariate model, only highly proliferative carcinomas with
decreased p400 protein levels exhibited worse clinical outcome (HR,
2.79; 95% CI, 2.01–3.87) in contrast to the subgroup of tumors
characterized by high proliferation rate and increased p400
expression (HR, 1.73; 95% CI, 0.71–4.21), both hazard ratios taking
low proliferative tumors with decreased p400 expression as
reference.
Young et al(27) showed that induction of senescence
triggered by loss of VHL was mediated by downregulation of p400 and
a downstream pathway including Skp2, p27KIP and Rb. Our
data suggest that at least in low grade RCCs a retained p400 is
demanded for high proliferation. Therefore, patients with highly
proliferative and p400-positive RCCs may in particular benefit from
new pro-senescence therapy strategies. For example, the
SKP1-CUL1-F-box protein (SCF)-SKP2 complex inhibitor (MLN4924) is
currently in phase I trials and has the ability to induce
senescence by stabilization of p27KIP and inhibits tumor
growth in vitro and in vivo(38,39).
Acknowledgements
The authors thank Hildegard Jakobi and Karl-Heinz
Ellsässer for their valuable assistance in the acquisition and
analysis of the clinical data. We thank Bettina Walter and Andrea
Hain for their excellent technical assistance. Special thanks to
Raj Bandaru and Humphrey Gardner for their help in the
immunohistochemistry and data analysis. The authors thank Novartis
Institutes for Biomedical Research, Boston, MA, USA. The present
study was supported by a Postdoc Fellowship from the University of
Heidelberg to S.M.G. and by the Tissue Bank of the National Center
for Tumor Diseases, Heidelberg, Germany.
References
|
1
|
Cohen HT and McGovern FJ: Renal-cell
carcinoma. N Engl J Med. 353:2477–2490. 2005. View Article : Google Scholar : PubMed/NCBI
|
|
2
|
Merino MJ, Eccles DM, Linehan WM, et al:
Familial renal cell carcinoma. Pathology and Genetics of Tumors of
the Urinary System and Male Genital Organs. Eble JN, Sauter G,
Epstein J and Sesterhenn IA: IARC Press; Lyon: pp. 15–22. 2004
|
|
3
|
Maxwell PH, Wiesener MS, Chang GW, et al:
The tumour suppressor protein VHL targets hypoxia-inducible factors
for oxygen-dependent proteolysis. Nature. 399:271–275. 1999.
View Article : Google Scholar : PubMed/NCBI
|
|
4
|
Kaelin WG Jr and Ratcliffe PJ: Oxygen
sensing by metazoans: the central role of the HIF hydroxylase
pathway. Mol Cell. 30:393–402. 2008. View Article : Google Scholar : PubMed/NCBI
|
|
5
|
Raval RR, Lau KW, Tran MGB, et al:
Contrasting properties of hypoxia-inducible factor 1 (HIF-1) and
HIF-2 in von Hippel-Lindau-associated renal cell carcinoma. Mol
Cell Biol. 25:5675–5686. 2005. View Article : Google Scholar : PubMed/NCBI
|
|
6
|
Shen C, Beroukhim R, Schumacher SE, et al:
Genetic and functional studies implicate HIF1α as a 14q kidney
cancer suppressor gene. Cancer Discov. 1:222–235. 2011.PubMed/NCBI
|
|
7
|
Roe JS and Youn HD: The positive
regulation of p53 by the tumor suppressor VHL. Cell Cycle.
5:2054–2056. 2006. View Article : Google Scholar : PubMed/NCBI
|
|
8
|
Thoma CR, Frew IJ, Hoerner CR, Montani M,
Moch H and Krek W: pVHL and GSK3β are components of a primary
cilium-maintenance signalling network. Nat Cell Biol. 9:588–595.
2007.
|
|
9
|
Lolkema MP, Mans DA, Snijckers CM, et al:
The von Hippel-Lindau tumour suppressor interacts with microtubules
through kinesin-2. FEBS Lett. 581:4571–4576. 2007. View Article : Google Scholar : PubMed/NCBI
|
|
10
|
Roe JS, Kim HR, Hwang IY, Cho EJ and Youn
HD: von Hippel-Lindau protein promotes Skp2 destabilization on DNA
damage. Oncogene. 30:3127–3138. 2011. View Article : Google Scholar : PubMed/NCBI
|
|
11
|
Young AP and Kaelin WG Jr: Senescence
triggered by the loss of the VHL tumor suppressor. Cell Cycle.
7:1709–1712. 2008. View Article : Google Scholar : PubMed/NCBI
|
|
12
|
Xu Y, Sun Y, Jiang X, et al: The p400
ATPase regulates nucleosome stability and chromatin ubiquitination
during DNA repair. J Cell Biol. 191:31–43. 2010. View Article : Google Scholar : PubMed/NCBI
|
|
13
|
Chan HM, Narita M, Lowe SW and Livingston
DM: The p400 E1A-associated protein is a novel component of the p53
--> p21 senescence pathway. Genes Dev. 19:196–201. 2005.
View Article : Google Scholar : PubMed/NCBI
|
|
14
|
Samuelson AV, Narita M, Chan HM, et al:
p400 is required for E1A to promote apoptosis. J Biol Chem.
280:21915–21923. 2005. View Article : Google Scholar : PubMed/NCBI
|
|
15
|
Flinterman MB, Mymryk JS, Klanrit P, et
al: p400 function is required for the adenovirus E1A-mediated
suppression of EGFR and tumour cell killing. Oncogene.
26:6863–6874. 2007. View Article : Google Scholar : PubMed/NCBI
|
|
16
|
van Diest PJ, van der Wall E and Baak JPA:
Prognostic value of proliferation in invasive breast cancer: a
review. J Clin Pathol. 57:675–681. 2004.PubMed/NCBI
|
|
17
|
Spyratos F, Ferrero-Poüs M, Trassard M, et
al: Correlation between MIB-1 and other proliferation markers:
clinical implications of the MIB-1 cutoff value. Cancer.
94:2151–2159. 2002. View Article : Google Scholar : PubMed/NCBI
|
|
18
|
de Riese WT, Crabtree WN, Allhoff EP, et
al: Prognostic significance of Ki-67 immunostaining in
nonmetastatic renal cell carcinoma. J Clin Oncol. 11:1804–1808.
1993.PubMed/NCBI
|
|
19
|
Aleskandarany MA, Rakha EA, Macmillan RD,
Powe DG, Ellis IO and Green AR: MIB1/Ki-67 labelling index can
classify grade 2 breast cancer into two clinically distinct
subgroups. Breast Cancer Res Treat. 127:591–599. 2011. View Article : Google Scholar : PubMed/NCBI
|
|
20
|
Rioux-Leclercq N, Turlin B, Bansard J, et
al: Value of immunohistochemical Ki-67 and p53 determinations as
predictive factors of outcome in renal cell carcinoma. Urology.
55:501–505. 2000. View Article : Google Scholar : PubMed/NCBI
|
|
21
|
Scarpa A, Mantovani W, Capelli P, et al:
Pancreatic endocrine tumors: improved TNM staging and
histopathological grading permit a clinically efficient prognostic
stratification of patients. Mod Pathol. 23:824–833. 2010.
View Article : Google Scholar
|
|
22
|
Michaloglou C, Vredeveld LCW, Soengas MS,
et al: BRAFE600-associated senescence-like cell cycle arrest of
human naevi. Nature. 436:720–724. 2005. View Article : Google Scholar : PubMed/NCBI
|
|
23
|
Macher-Goeppinger S, Aulmann S, Tagscherer
KE, et al: Prognostic value of tumor necrosis factor-related
apoptosis-inducing ligand (TRAIL) and TRAIL receptors in renal cell
cancer. Clin Cancer Res. 15:650–659. 2009. View Article : Google Scholar : PubMed/NCBI
|
|
24
|
Dupont Jensen J, Laenkholm AV, Knoop A, et
al: PIK3CA mutations may be discordant between primary and
corresponding metastatic disease in breast cancer. Clin Cancer Res.
17:667–677. 2011.
|
|
25
|
Linehan WM, Srinivasan R and Schmidt LS:
The genetic basis of kidney cancer: a metabolic disease. Nat Rev
Urol. 7:277–285. 2010. View Article : Google Scholar : PubMed/NCBI
|
|
26
|
Baldewijns MM, van Vlodrop IJH, Vermeulen
PB, Soetekouw PM, van Engeland M and de Bruïne AP: VHL and HIF
signalling in renal cell carcinogenesis. J Pathol. 221:125–138.
2010. View Article : Google Scholar : PubMed/NCBI
|
|
27
|
Young AP, Schlisio S, Minamishima YA, et
al: VHL loss actuates a HIF-independent senescence programme
mediated by Rb and p400. Nat Cell Biol. 10:361–369. 2008.
View Article : Google Scholar : PubMed/NCBI
|
|
28
|
Welford SM, Dorie MJ, Li X, Haase VH and
Giaccia AJ: Renal oxygenation suppresses VHL loss-induced
senescence that is caused by increased sensitivity to oxidative
stress. Mol Cell Biol. 30:4595–4603. 2010. View Article : Google Scholar : PubMed/NCBI
|
|
29
|
Mack FA, Patel JH, Biju MP, Haase VH and
Simon MC: Decreased growth of Vhl−/−
fibrosarcomas is associated with elevated levels of cyclin kinase
inhibitors p21 and p27. Mol Cell Biol. 25:4565–4578.
2005.PubMed/NCBI
|
|
30
|
Courtois-Cox S, Genther Williams SM,
Reczek EE, et al: A negative feedback signaling network underlies
oncogene-induced senescence. Cancer Cell. 10:459–472. 2006.
View Article : Google Scholar : PubMed/NCBI
|
|
31
|
Chen Z, Trotman LC, Shaffer D, et al:
Crucial role of p53-dependent cellular senescence in suppression of
Pten-deficient tumorigenesis. Nature. 436:725–730. 2005. View Article : Google Scholar : PubMed/NCBI
|
|
32
|
Serrano M, Lin AW, McCurrach ME, Beach D
and Lowe SW: Oncogenic ras provokes premature cell senescence
associated with accumulation of p53 and p16INK4a. Cell.
88:593–602. 1997. View Article : Google Scholar : PubMed/NCBI
|
|
33
|
Kuilman T, Michaloglou C, Mooi WJ and
Peeper DS: The essence of senescence. Genes Dev. 24:2463–2479.
2010. View Article : Google Scholar : PubMed/NCBI
|
|
34
|
Gurova KV, Hill JE, Razorenova OV,
Chumakov PM and Gudkov AV: p53 pathway in renal cell carcinoma is
repressed by a dominant mechanism. Cancer Res. 64:1951–1958. 2004.
View Article : Google Scholar : PubMed/NCBI
|
|
35
|
Burrows AE, Smogorzewska A and Elledge SJ:
Polybromo-associated BRG1-associated factor components BRD7 and
BAF180 are critical regulators of p53 required for induction of
replicative senescence. Proc Natl Acad Sci USA. 107:14280–14285.
2010. View Article : Google Scholar : PubMed/NCBI
|
|
36
|
Varela I, Tarpey P, Raine K, et al: Exome
sequencing identifies frequent mutation of the SWI/SNF complex gene
PBRM1 in renal carcinoma. Nature. 469:539–542. 2011.
View Article : Google Scholar : PubMed/NCBI
|
|
37
|
Dalgliesh GL, Furge K, Greenman C, et al:
Systematic sequencing of renal carcinoma reveals inactivation of
histone modifying genes. Nature. 463:360–363. 2010. View Article : Google Scholar
|
|
38
|
Lin HK, Chen Z, Wang G, et al: Skp2
targeting suppresses tumorigenesis by Arf-p53-independent
cellular senescence. Nature. 464:374–379. 2010. View Article : Google Scholar
|
|
39
|
Nardella C, Clohessy JG, Alimonti A and
Pandolfi PP: Pro-senescence therapy for cancer treatment. Nat Rev
Cancer. 11:503–511. 2011. View
Article : Google Scholar : PubMed/NCBI
|