Introduction
Recent studies continue to support the CSC
hypothesis in which CSC is claimed to be the root of
carcinogenesis. The existence of liver CSC has also been validated
by researchers through varying approaches. Currently, most studies
focusing on liver CSCs rely on cell surface markers, such as
CD13(1,2), OV6(3), CD133(4), CD90(5), ABCG2(6) and EpCAM (7). This approach identified stem-like
cancer cells with clonogenic and tumorigenic capacity, strongly
supporting the existence of CSCs in HCC. However, different markers
from different researchers make it confusing to understand liver
CSC. Alternatively, SP approach, which is based on the functional
property of CSCs to exclude Hoechst 33342 dye via
ABCG2-transporters, might have certain advantages for prospective
isolation and characterization of CSCs (8–11). The
SP assay requires an incubation step for appropriate equilibration
of the dye Hoechst 33342 between the extracellular and
intracellular compartments prior to dye efflux by cells expressing
ABC transporters. ABC transporter-mediated dye efflux is an active
and dynamic biological process and thus highly sensitive to even
slight modifications, leading to discrepancies in the SP percentage
(12). Therefore, it is critical to
optimize Hoechst 33342 staining procedure to achieve a consistent
and tumorigenic SP subtype.
Sphere-forming assays have been widely used to
retrospectively identify stem cells based on their capacity to
evaluate self-renewal and differentiation in vitro(13). The sphere-forming assay has also
been applied to cultivate various CSCs. Uchida et
al(14) demonstrated
sphere-forming cells in a variety of live cancer cell lines and
confirmed the stemness in these cells.
More and more studies have shown involvement of
several miRNAs in the regulation of CSCs in the past a few years
(15). In liver cancer, the miR-181
is important for the maintenance of hepatic CSC by
posttranslational downregulation of two hepatic transcriptional
regulators of differentiation and an inhibitor of Wnt/β-catenin
signaling (16). Li et al
compared the miRNA profiles between rat liver CSC and normal liver
stem cells, his study suggest that liver CSCs may have a distinct
miRNA expression fingerprint (17).
Moreover, a relationship between CSC and epithelial-mesenchymal
transition (EMT) has recently emerged with evidence suggesting that
EMT cells have cancer stem cell-like features and CSCs exhibit a
mesenchymal-like phenotype (18).
Many miRNAs are shown to be involved in both processes. For
example, MiR-194 can target BMI-1 which is a self-renewal gene to
inhibit EMT in endometrial cancer (19,20).
The miR-125b recently was found to be necessary for stem cell
fission and make stem cells insensitive to chemotherapy (21). Also miR-125b can regulate EMT
process by directly targeting oncogene LIN28B2 (22). Given the strong link between miRNAs
and CSCs, this study focuses on an accurate identification of liver
CSC and CSC- specific miRNAs.
Materials and methods
Cell lines and animals
HCC cell line PLC/PRF/5, Huh-7 and Hep-3B were
purchased from Shanghai Cell Center. PLC/PRF/5 cells were cultured
in MEM (Hyclone, Logan, UT, USA) containing 10% fetal bovine serum
(FBS, Hyclone), while Huh-7 and Hep-3B in PRMI-1640 (Hyclone) with
10% FBS. Cells were incubated at 37°C in a humidified atmosphere
containing 5% CO2. Male non-obese diabetic/severe
combined immunodeficiency (NOD/SCID) mice (6–8 weeks) were
purchased from Shanghai Institute of Material Medicine, Chinese
Academy of Science and housed in lamina flow cabinets under
specific pathogen-free conditions. The experiments were done in
accordance with our institutional guidelines for the use of
laboratory animals.
Hoechst 33342 staining optimization
The cultured cells with 75% confluence were detached
with 0.25% trypsin-EDTA and suspended at 1×10⁶ cells/ml
in fresh medium. Cells were counted using trypan blue at least
twice to ensure an identical staining density (1×10⁶
cells/ml). The cells collected at different culture times were then
incubated with different concentrations of Hoechst 33342
(Invitrogen, Carlsbad, CA, USA) either alone or in the presence of
50 μg/ml verapamil (Sigma-Aldrich, St. Louis, MO, USA) at 37°C for
60 or 90 or 120 min with different shaking intervals. The 4
factors, incubation time, shaking interval, culture time and dye
concentration, were all tested independently. Verapamil was
traditionally used as a guiding parameter to determine the boundary
between SP and NSP cells. Samples were then washed, centrifuged and
resuspended in 1 ml cold PBS supplemented with 3% FBS. Propidium
iodide (PI, Sigma-Aldrich) was added at 1 μg/ml to exclude the dead
cells before FCM analysis. Each assay was done in triplicate.
MoFlo XDP analysis and sorting
strategy
MoFlo XDP was used to analyze and sort SP and NSP
cells. The Hoechst 33342 was excited with the UV laser at 350 nm
and fluorescence emission was measured with 450 (Hoechst blue) and
675 (Hoechst red) optical filters. When sorting, MoFlo XDP checkup
was done each time to ensure accuracy and SP gate was also refined.
Sorted cells were placed on ice to increase viability and then
stored in RNAprotect Cell Reagent (Qiagen, Hilden, Germany) for
further isolation of high quality miRNAs. The purity of sorted
cells was also analyzed.
Floating sphere cultivation
To culture floating spheres, SP and NSP cells sorted
from the three cell lines were re-suspended respectively, in
serum-free medium (SFM) containing DMEM/F12 (Hyclone) supplemented
with 20 ng/ml EGF (Peprotech, Princeton, NJ, USA), 10 ng/ml bFGF
(Peprotech), 5 μg/ml insulin (Upstate, NY, USA) and 10 μl/ml B27
(PAA, Pasching, Austria), 1×10⁴ cells/well in 6-well
plates. Cells were then incubated at 37°C in a humidified
atmosphere containing 5% CO2.
Tumorigenicity assay in vivo
To explore the tumorigenic capacity, SP and NSP
cells sorted from the three HCC cell lines, suspended in 200 μl
DMEM and Matrigel (1:1, BD Biosciences, San Jose, CA, USA), were
injected into the right and left axila of NOD/SCID mice at a total
number of 10, 1×10², 1×10³ and
1×10⁴ cells, respectively. Tumor formation was monitored
weekly after implantation. Animals were sacrificed after 12 weeks.
Each group contained 5 animals in tumor initiation experiment.
MiRNA profiling by qPCR assay
Freshly isolated three batches of SP and NSP cells
were kept in RNAprotect Cell Reagent and shipped to Beijing
Genomics of Sciences for miRNA isolation and qPCR assay. Total RNAs
were then obtained by miRNeasy Micro kit. The extracted RNAs were
evaluated with Nanadrop 8000 and agarose gel electrophoresis to
ensure its quality. Three steps-based qPCR method was then adopted.
A-Plus bacterial polyA polymerase was used to add polyA tail to
mature form of miRNAs and reverse transcription (RT) was done for
first strand cDNA synthesis. Subsequently SYBR Green-based qPCR
reaction was conducted on ABI 7500 (Life Technologies, Foster City,
CA, USA) under optimized conditions. A total of 370 miRNAs were
tested using primers provided by Beijing Genomics of Sciences. U6
was used as an internal control during the process of RNA
isolation, poly(A) plus, cDNA synthesis and qPCR. Second qPCR
quality control was used during the qPCR procedure. The
CT values of 370 miRNAs were evaluated and the data were
shown as fold changes (2−ΔΔCT) to analyze the miRNA
expression levels. The results were normalized against U6 and
t-test was used for comparison among groups. P<0.05 was
considered statistically significant.
MiRNA verification by qPCR assay
To evaluate whether the profiling result is
univerval across differential HCC cell lines, the differential
miRNAs were tested again in SP and NSP cells from Huh-7 and Hep-3B
cell lines. The qPCR procedures were the same as stated above.
Results
SP staining optimization and MoFlo XDP
sorting
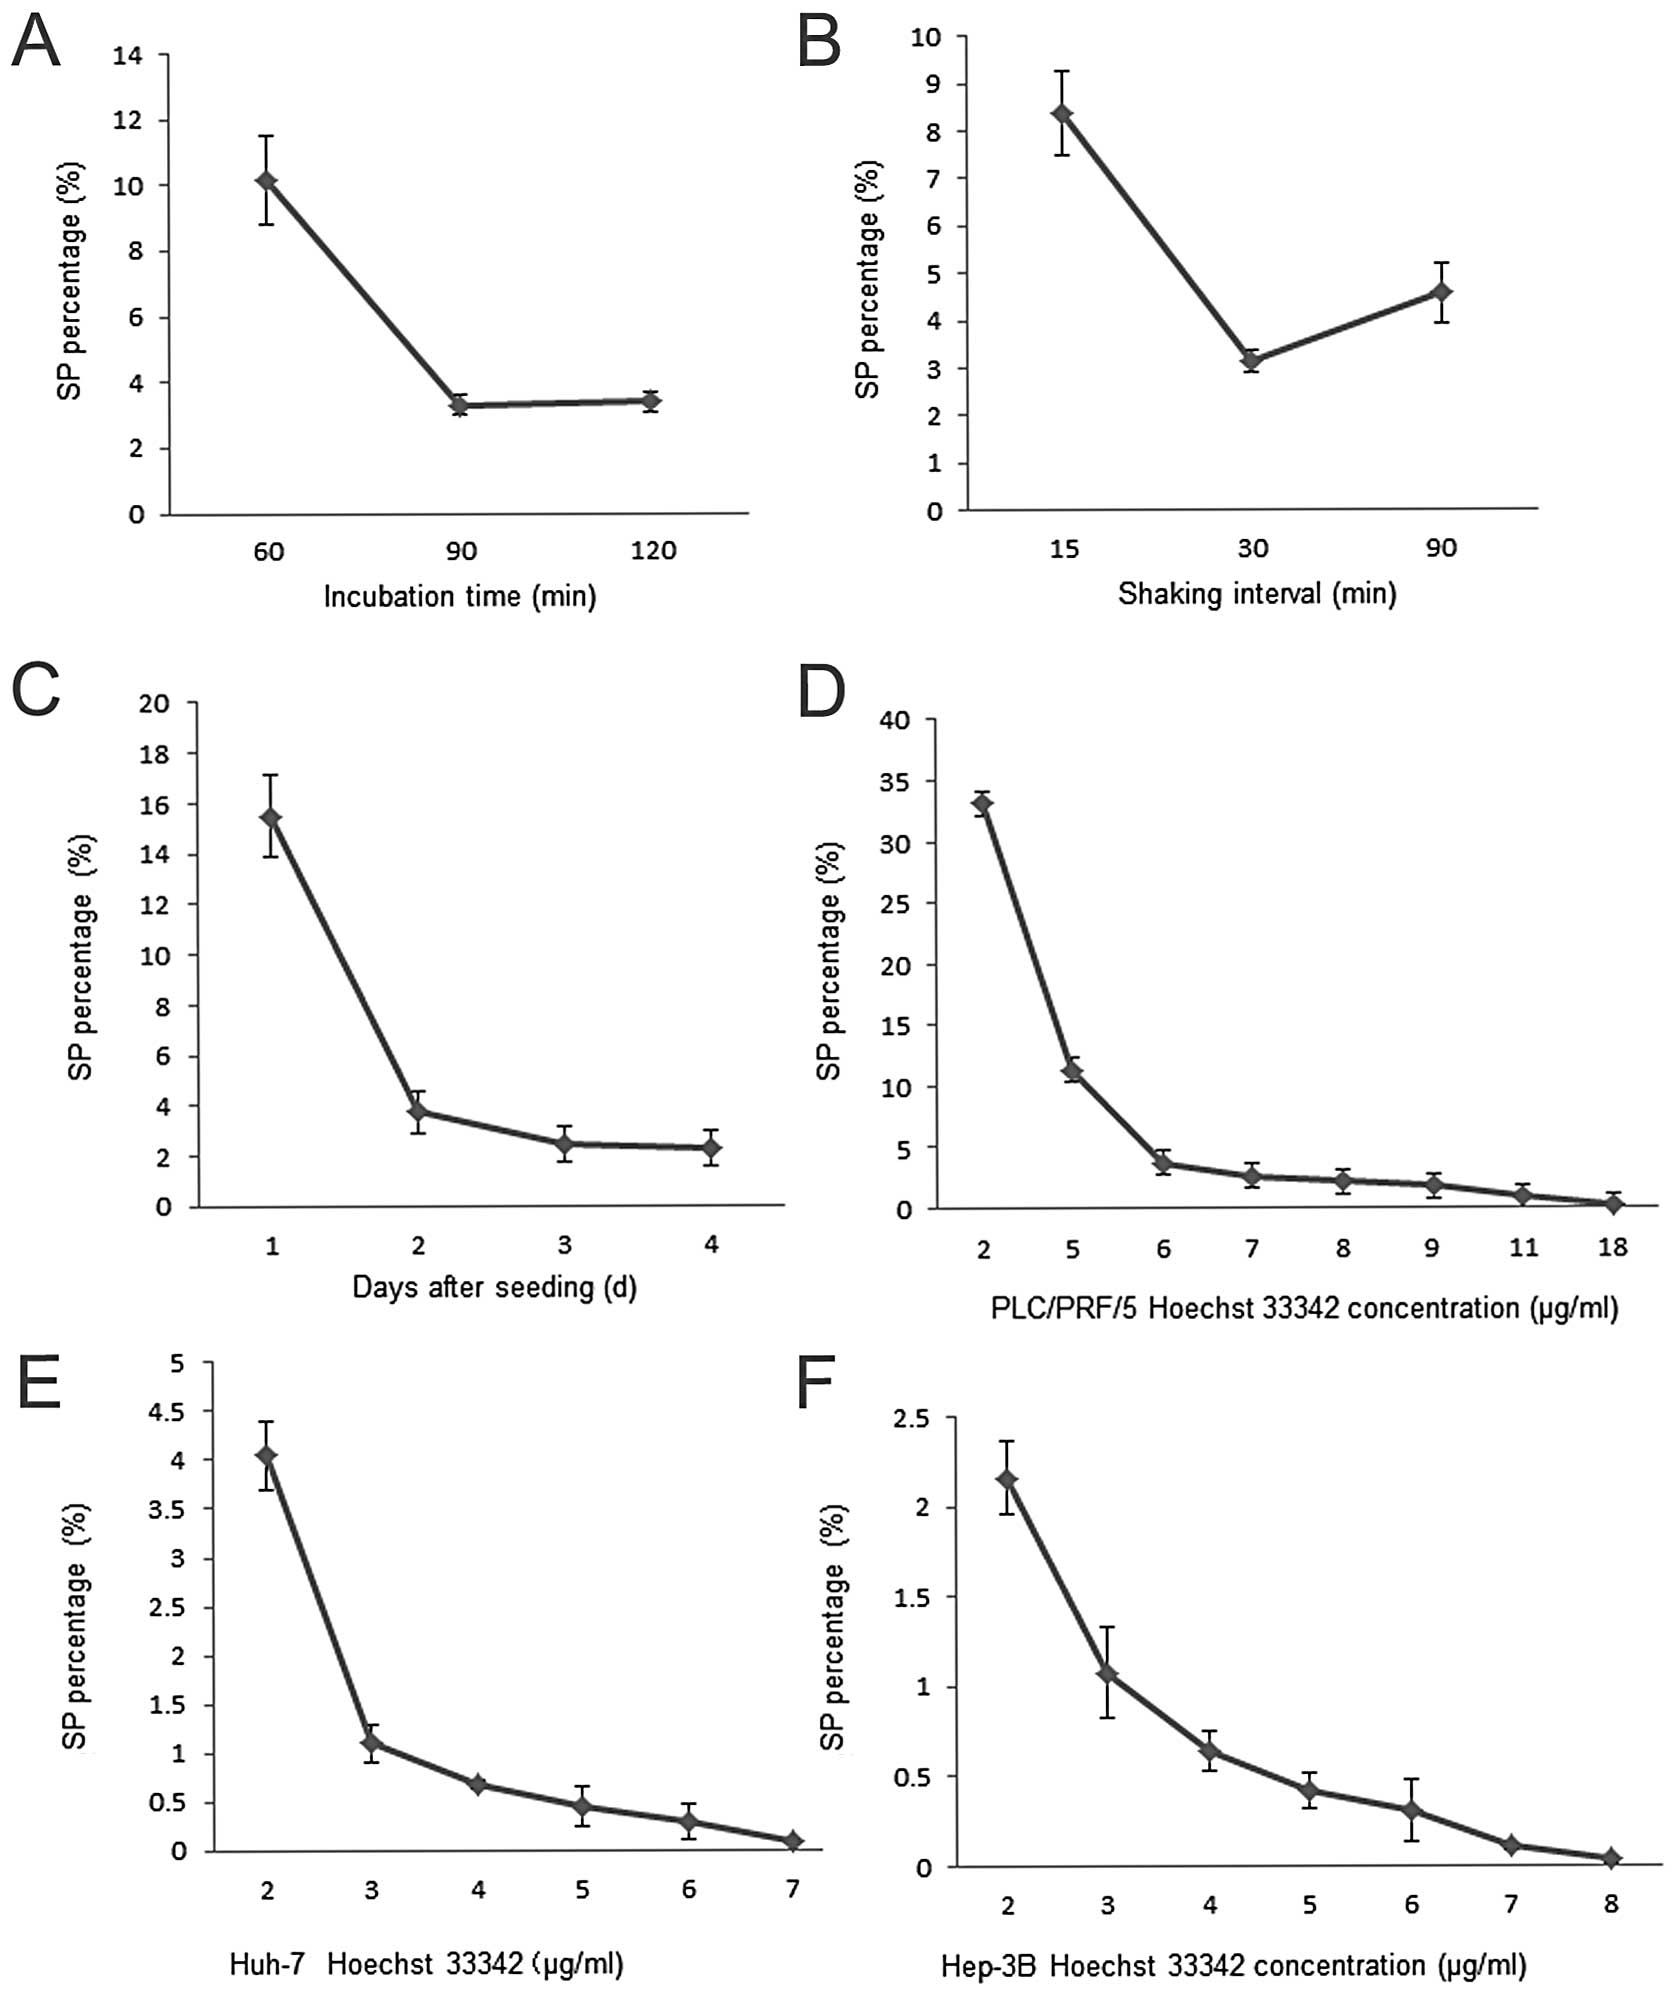
The 4 factors, incubation time, shaking interval,
culture time and dye concentration were tested one by one when the
other three were fixed. The optimal incubation time and shaking
interval were determined by staining PLC/PRF/5 cells cultured for 2
days with 9 μg/ml of Hoechst 33342 for 60, 90 and 120 min with 30
min of shaking interval and then for 90 min with 15, 30 and 90 min
of shaking interval, respectively. We found that 90-min incubation
time produced a lower SP percentage, so did the 30-min shaking
interval.
To determine the culture time, PLC/PRF/5 cells were
seeded into 4 T-25 flasks at 0.5×10⁶ cells/ml under the
same conditions. The cells were cultured for up to 4 days and
harvested at the end of day 1, 2, 3 and 4, respectively. They were
then used to determine SP percentage under the standard staining
protocol. The SP percentage was highest at day 1 and lowest at days
3 and 4, indicating that the SP percentage reached plateau stage
before day 3 (Fig. 1).
Different concentrations of Hoechst 33342 ranging
from 2 to 18 μg/ml were used respectively, to stain day 3
PLC/PRF/5, Huh-7 as well as Hep-3B cells for 90-min incubation with
30-min shaking interval. The results showed that dye concentration
exerted a pronounced effect on SP%. As Hoechst concentration
decreased, SP percentages also decreased, first sharply then
slightly, suggesting the optimal dye concentration for staining is
11 μg/ml for PLC/PRF/5, 4 μg/ml for Huh-7 and 5 μg/ml for Hep-3B
cells (Fig. 1).
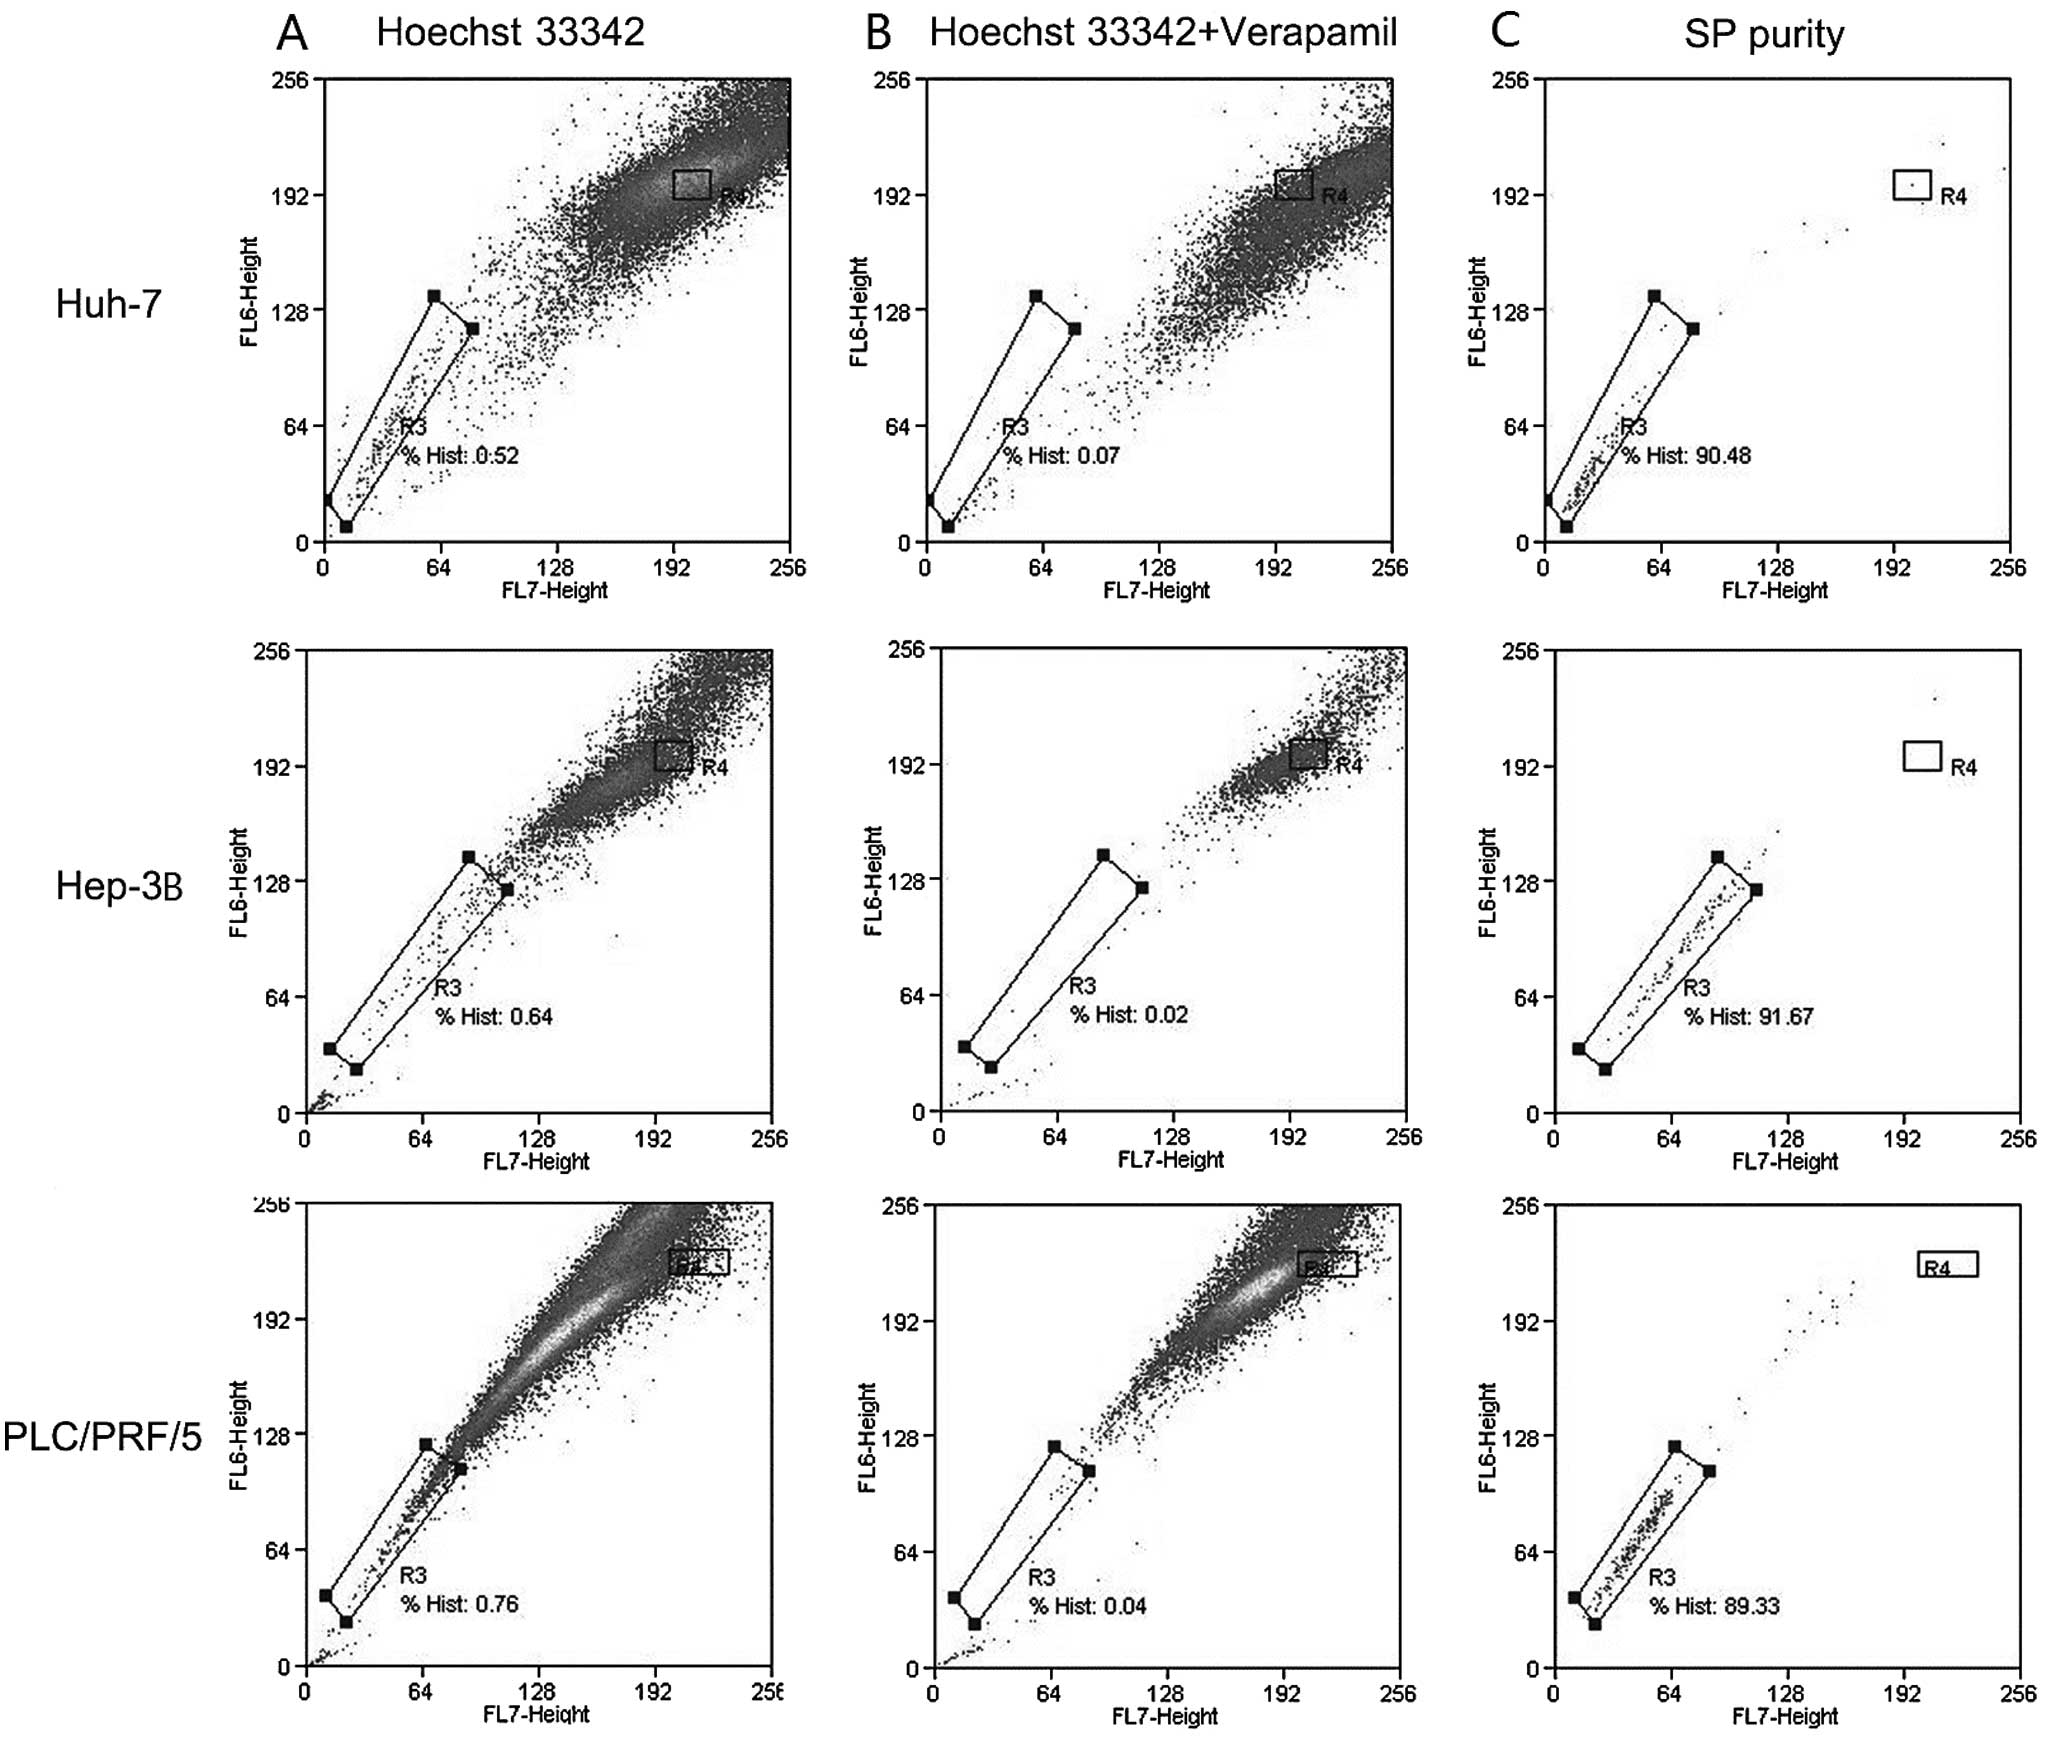
Under the optimized procedure, the resultant SP
percentage was 0.73±0.12% in PLC/PRF/5 cells, 0.49±0.04% in Huh-7
and 0.63±0.08% in Hep-3B cells. The purity of sorted SP cells was
>85% (Fig. 2).
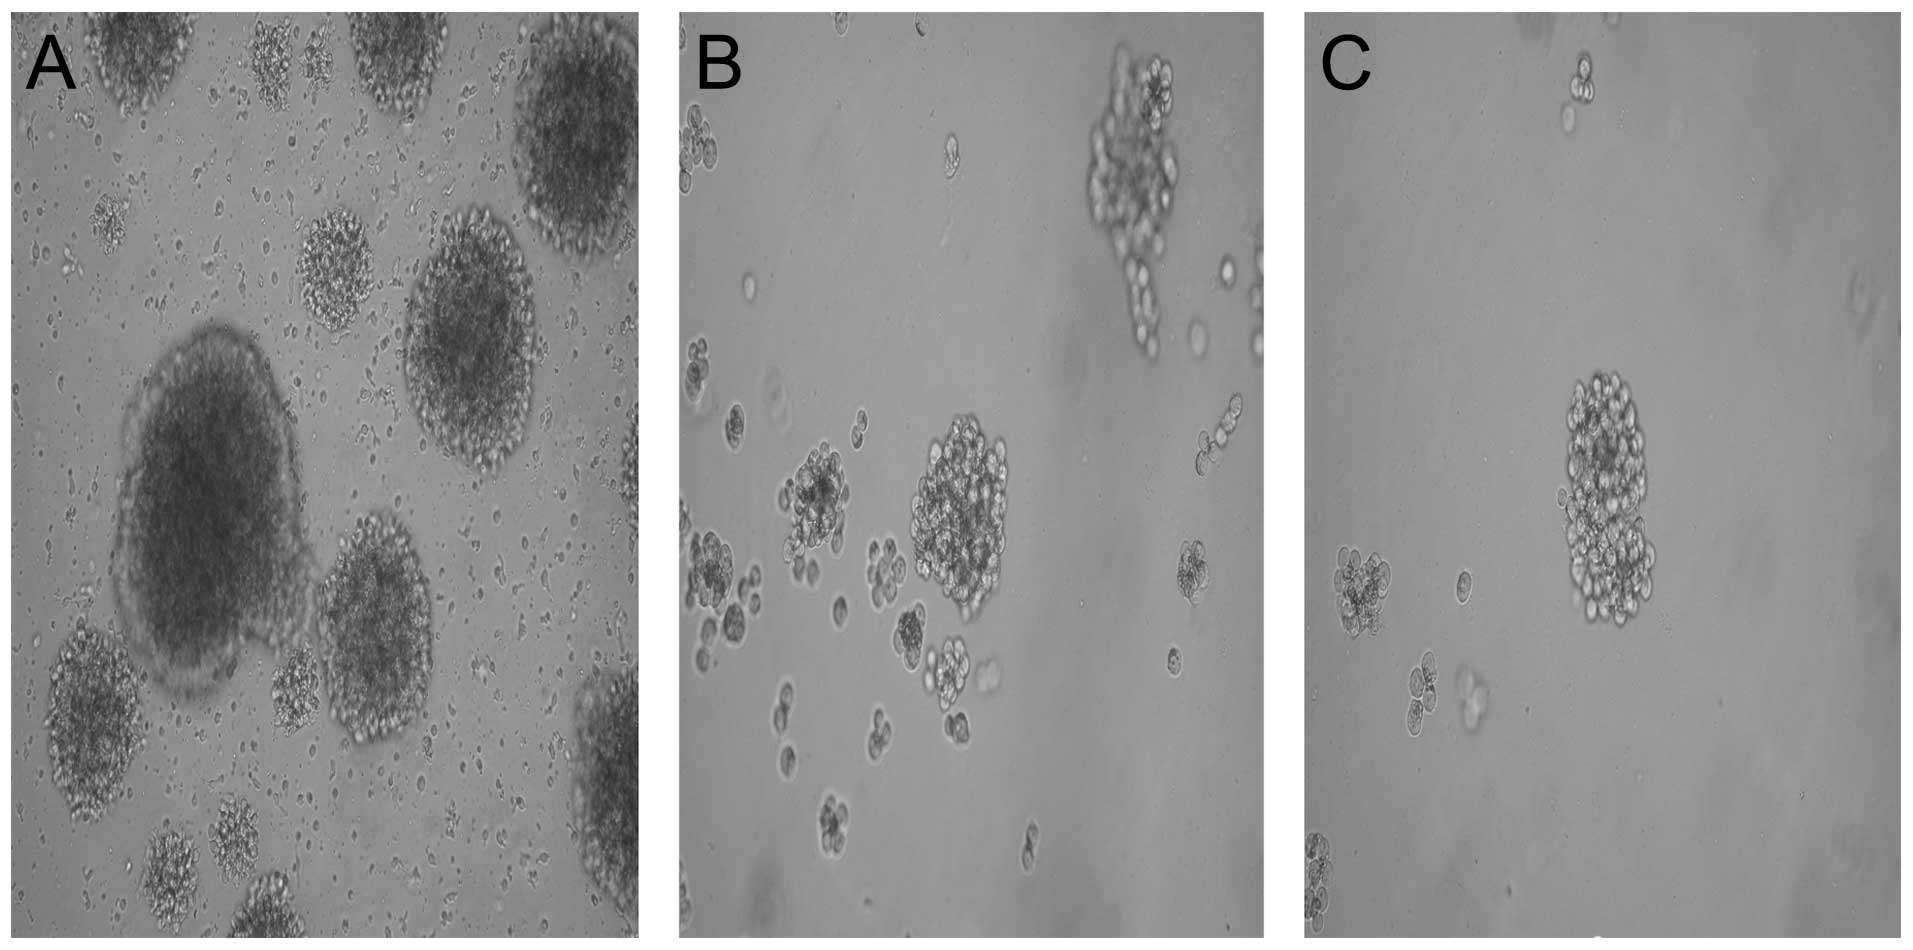
Floating sphere assay
To test CSC characteristics, SP and NSP cells were
sorted out to cultivate in SFM. Many sorted SP cells were able to
survive in SFM. On day 4, sorted SP cells were beginning to
propagate into floating cells. NSP cells could not form a single
floating sphere and eventually died. When the spheres were
dispersed into single cells, secondary and tertiary spheres also
formed. Of the three cell lines, Hep-3B SP cells formed the largest
floating spheres, while Huh-7 the smallest (Fig. 3, SP ×400).
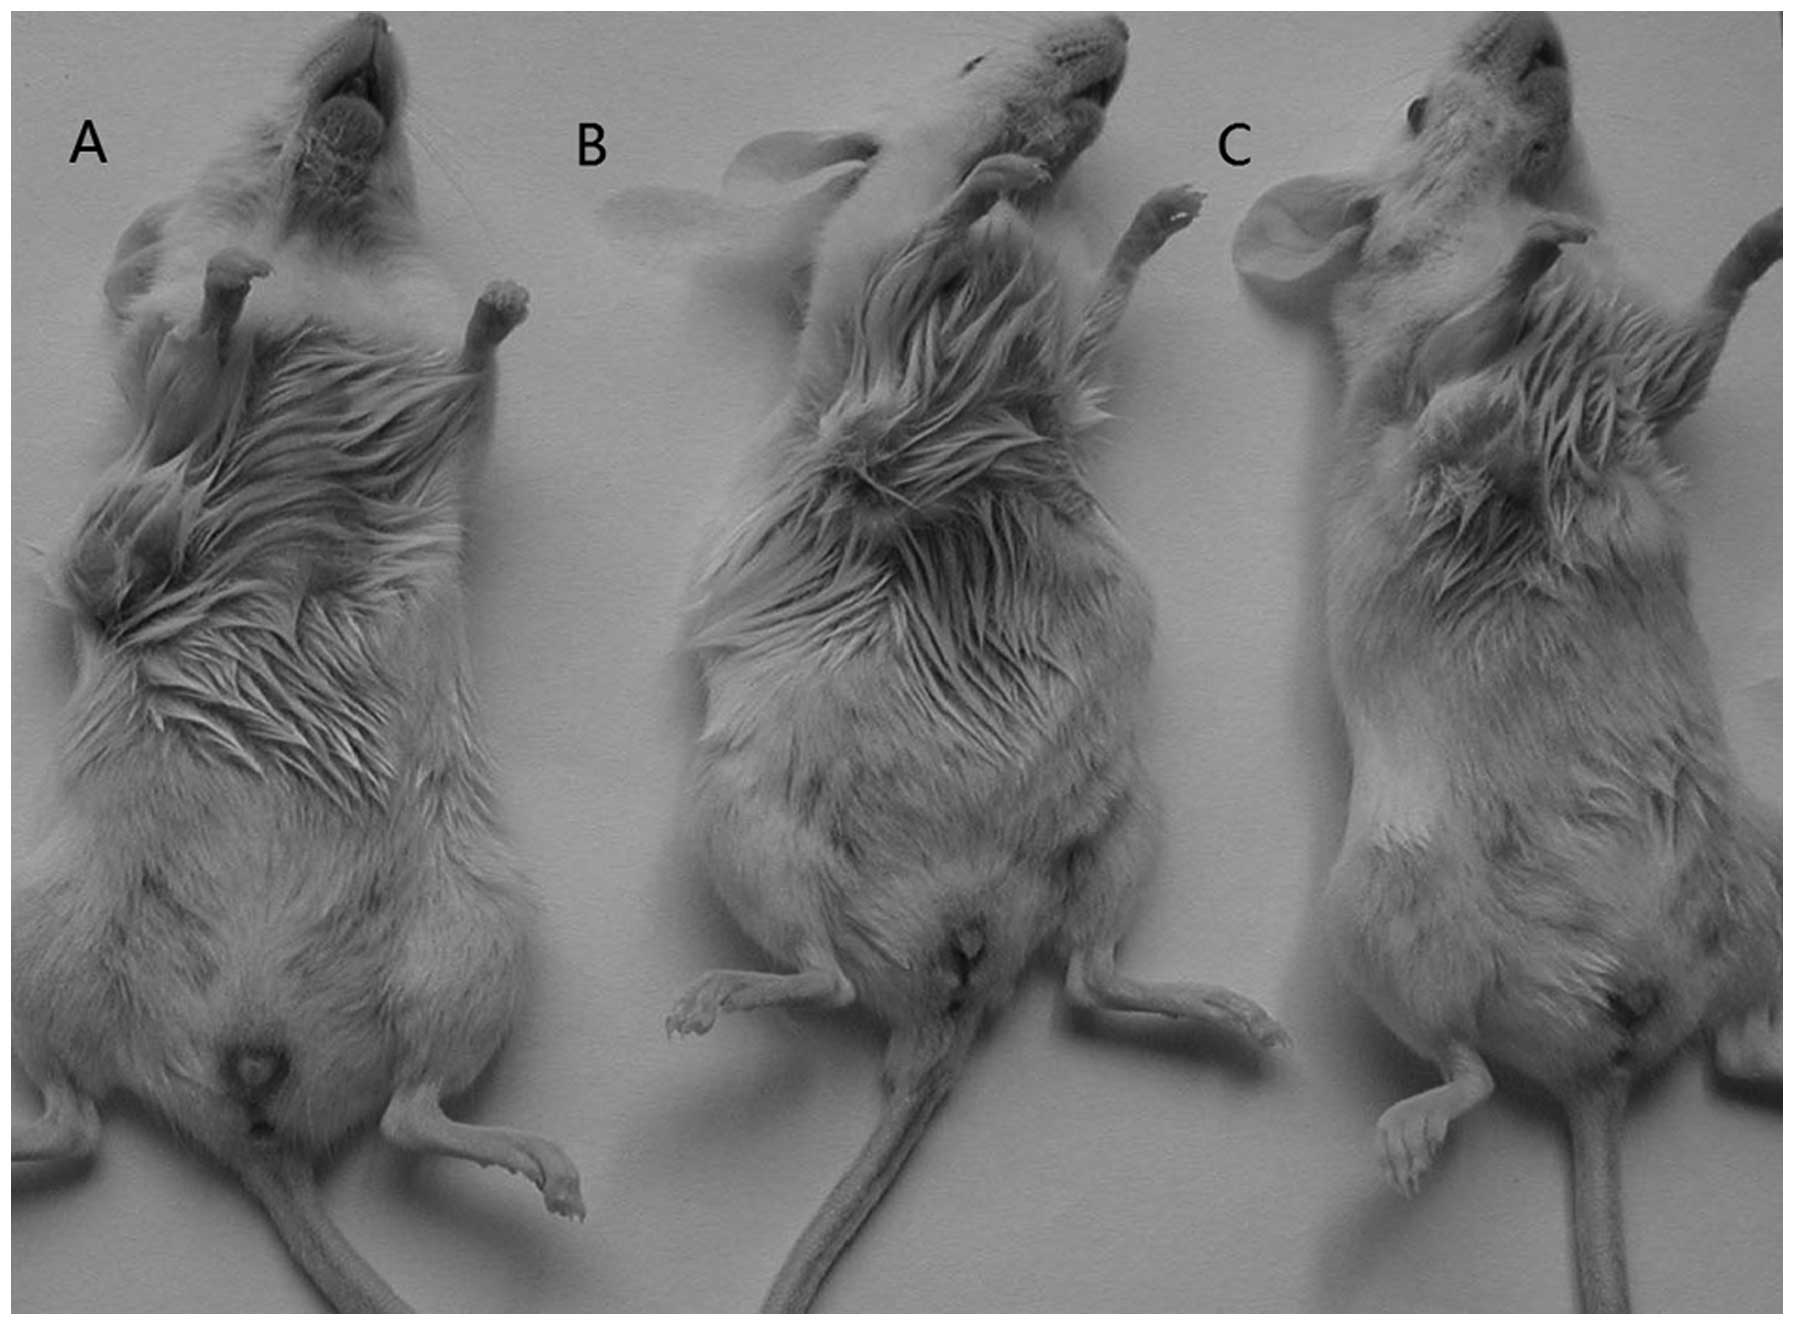
Tumor formation assay in NOD/SCID
mice
To determine whether the SP cells were more
tumorigenic than NSP cells, the two types of cells from each of the
three cell lines were inoculated s.c. into the axillae of NOD/SCID
mice at different cell concentrations, respectively, with SP cells
in the left and NSP the right side. The mice were sacrificed 12
weeks later. When 10 cells were injected, neither SP nor NSP cells
could form tumors. At 1×10⁴ cells, all SP cells could
form tumors in the three cell lines, while NSP cells formed fewer
tumors. The larger amount of injected cells was, the more tumor
masses were produced. Mice injected with SP cells on the right side
formed more tumor masses than their NSP counterparts did (Table I and Fig. 4).
 | Table ITumors formed in NOD/SCID mice
(n=5). |
Table I
Tumors formed in NOD/SCID mice
(n=5).
| | Tumor formed |
|---|
| |
|
|---|
| Cell line | Group | 10 | 1×10² | 1×10³ | 1×10⁴ |
|---|
| PLC/PRF/5 | SP cells | 0/5 | 1/5 | 5/5 | 5/5 |
| NSP cells | 0/5 | 0/5 | 0/5 | 2/5 |
| Huh-7 | SP cells | 0/5 | 1/5 | 4/5 | 5/5 |
| NSP cells | 0/5 | 0/5 | 1/5 | 1/5 |
| Hep-3B | SP cells | 0/5 | 2/5 | 5/5 | 5/5 |
| NSP cells | 0/5 | 0/5 | 1/5 | 2/5 |
MiRNA qPCR expression profiling in SP and
NSP samples
MiRNA expression of both SP and NSP cells from
PLC/PRF/5 cell line was tested by 3 step-based qPCR method. MiRNAs
with fold changes (SP/NSP)>2 or <0.5 (P<0.05) were
selected. A total of 370 miRNA species were analyzed in 3 batches
of SP and NSP. By the criteria stated above, 27 miRNAs were
identified as differentially expressed, all of which were
downregulated in SP (Table
II).
| Table IIFold changes of differentially
expressed miRNAs in SP samples vs NSP samples (n=3). |
Table II
Fold changes of differentially
expressed miRNAs in SP samples vs NSP samples (n=3).
| miRNA ID | P-value
(<0.05) | Fold changes
(SP/NSP) |
|---|
| miR-9 | 0.0027 | −3.00 |
|
miR-9* | 0.0044 | −2.41 |
| miR-23b | 0.0025 | −2.12 |
| miR-27b | 0.0024 | −2.35 |
|
miR-9*6 | 0.0077 | −2.80 |
| miR-151-3p | 0.0044 | −2.65 |
| miR-151-5p | 0.0042 | −2.57 |
|
miR-183* | 0.0088 | −2.23 |
| miR-183 | 0.0082 | −3.16 |
| miR-194 | 0.0032 | −2.03 |
| miR-146a | 0.0073 | −3.44 |
| miR-148b | 0.0001 | −3.14 |
| miR-340-3p | 0.0001 | −2.85 |
| miR-421 | 0.0042 | −2.32 |
|
miR-135b* | 0.0158 | −3.55 |
| miR-489 | 0.0380 | −3.28 |
| miR-15a | 0.028 | −2.79 |
| miR-21 | 0.0106 | −2.67 |
| miR-22 | 0.0331 | −2.50 |
| miR-365 | 0.0388 | −2.47 |
| miR-450a-5p | 0.0215 | −2.46 |
| miR-7a | 0.0158 | −2.44 |
| miR-26b | 0.0264 | −2.28 |
| miR-125a-5p | 0.0231 | −2.27 |
| miR-25 | 0.0118 | −2.22 |
| miR- 126-3p | 0.0329 | −2.15 |
| miR-182 | 0.0119 | −2.14 |
MiRNA verification by qPCR assay
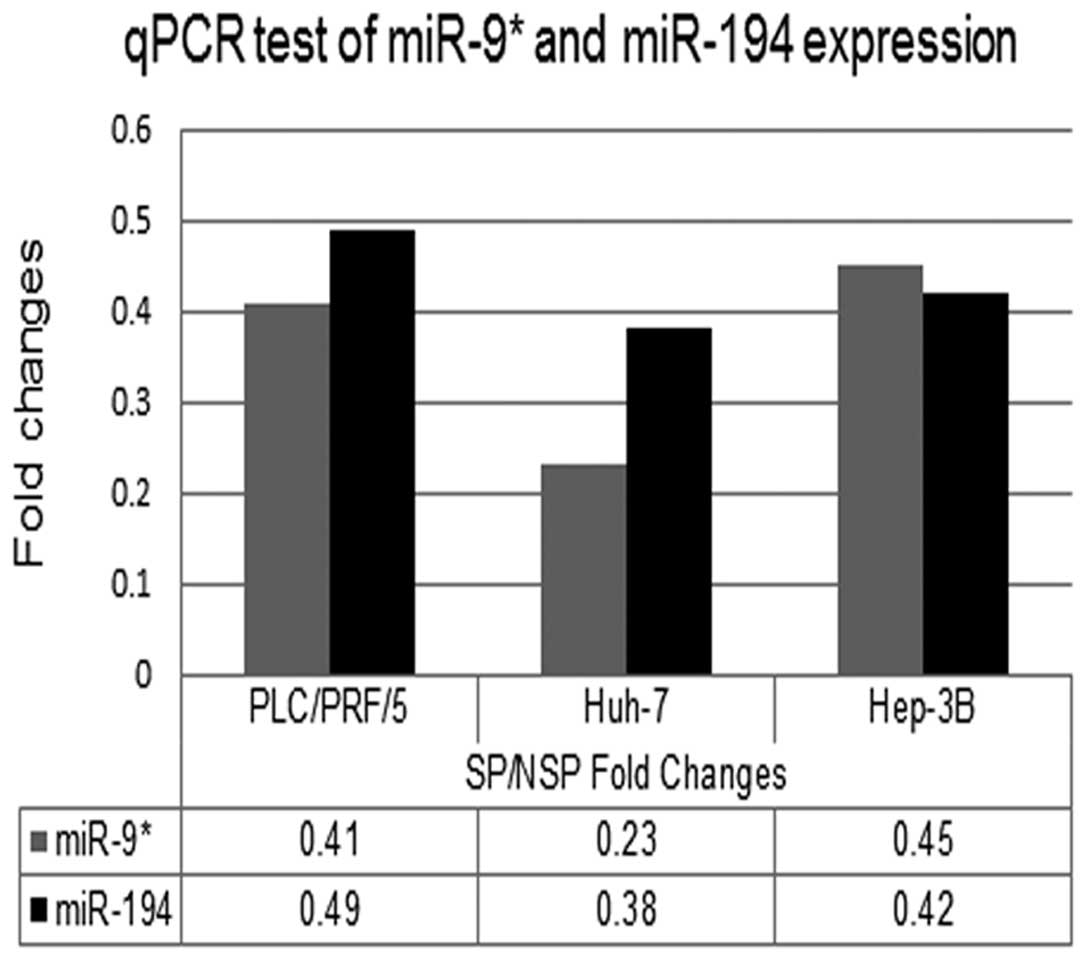
MiRNA expressions of the 27 differential miRNAs were
further tested in both the SP and NSP cells from Huh-7 and Hep-3B
cell lines by 3 step-based qPCR method. MiRNAs with fold changes
(SP/NSP) >2 or <0.5 (P<0.05) were selected. By the
criteria stated above, miR-9* and miR-194 were
identified (Fig. 5).
Discussion
The CSCs can be identified and isolated by different
methodologies, including isolation by CSC-specific cell surface
marker expression, detection of SP phenotype by Hoechst 33342
exclusion, assessment of their ability to grow as floating spheres
and aldehyde dehydrogenase (ALDH) activity assay. None of the
methods mentioned are exclusively used to isolate the solid tumor
CSCs, highlighting the need to delineate more specific markers or
to use combinatorial markers and methodologies (23). Therefore, we combined SP phenotype
and floating sphere formation methods to identify liver CSC.
In the SP phenotype assay, we firstly examined the 4
factors involved in the actual staining procedure and the results
showed that all 4 factors contributed significantly to changes in
SP percentage. The optimal Hoechst 33342 concentrations were
determined when the other three conditions were fixed. As Hoechst-
33342 concentration decreased, cells were shifted from the NSP to
SP region (24). Therefore the
optimal Hoechst 33342 concentration should be chosen within a
plateau region of the curve with complete verapamil inhibition.
Apart from the 4 factors mentioned above, cell viability, storage
time of Hoechst 33342 solution and even water bath temperature may
result in variations in SP percentage. As long as the SP cells are
limited to only verapamil-sensitive cells with the lowest Hoechst
33342 incorporation, the obtained SP is more homogeneous.
Many researchers have also proved the existence of
SP in these cell lines with slightly different SP percentages from
ours (8–10). However, they adopted only the SP
method to define CSC. CSC can grow as non-adherent spheres. Uchida
et al demonstrated sphere formation in HepG2, Hep3B and
PLC/PRF/5 cells, but not in SK-Hep1 and Huh-7 cells (14). In our study, Huh-7, Hep3B and
PLC/PRF/5 all formed floating spheres. The difference might be in
the starting cells. We used SP cells to cultivate floating spheres,
while Uchida et al used the whole population. Our assay
proves that SP cells are the only cells with spheres-forming
ability.
We then compared the tumorigenic ability of SP and
NSP cells by assessing tumor formation in NOD/SCID mice, the gold
standard for proving the existence of cancer stem cells despite its
limitations. The assay confirmed a stronger proliferative and
tumorigenic ability with SP cells, suggesting that our SP staining
and isolation methods are eligible for isolating liver CSC.
MiRNAs regulate self-renewal, differentiation and
division of cells via post-transcriptional gene silencing. Aberrant
miRNA levels, specifically an overall downregulation, are present
in many cancers and CSCs (25). Our
study identified 27 downregulated miRNAs in SP cells from PLC/PRF/5
cell line. Among them, many are involved in the process of
self-renewal and metastasis in various cancers.
miR-9*(26) and Let-7
family (27) are reported to impart
stemness potential via their downregulation in breast cancer and
glioma cells, respectively. MiR-194 (19,20)
and miR-125b (21,22) can regulate the EMT and CSC processes
in hepatocellular carcinoma, endometrial and breast cancer. MiR-146
can suppress breast cancer metastasis (28). All these data to some extent suggest
that SP cells from PLC/PRF/5 cell line possess CSC
characteristics.
To evaluate whether the 27 miRNAs are universally
downregulated across different HCC cell lines, their expression
were further tested in both SP and NSP cells from Huh-7 and Hep-3B
cell lines. Of all the 27 miRNAs, miR-9* and miR-194
were also shown to be downregulated, suggesting the
miR-9* and miR-194 might be critical in maintaining the
liver CSC ability. MiR-9* and miR-194 are both reported
to regulate EMT and CSC via different mechanism in different
cancers, but their functions in liver cancer are not fully
explored. Our future studies will focus on the function of
miR-9* and miR-194 in hepatic carcinogenesis as well as
their expression in tumor specimens, in the hope of finding a new
cure for HCC patients.
Acknowledgements
This study was supported by Natural Science
Foundation of Fujian Province (no. 2008J0077) and (no. 2012J05138).
We thank Professor Shiyou Li from the Beijing Institute of Genomics
for support of miRNA qPCR profiling.
References
|
1
|
Haraguchi N, Ishii H, Mimori K, et al:
CD13 is a therapeutic target in human liver cancer stem cells. J
Clin Invest. 120:3326–3339. 2010. View
Article : Google Scholar : PubMed/NCBI
|
|
2
|
Kim HM, Haraguchi N, Ishii H, et al:
Increased CD13 expression reduces reactive oxygen species,
promoting survival of liver cancer stem cells via an
epithelial-mesenchymal transition-like phenomenon. Ann Surg Oncol.
19:539–548. 2011. View Article : Google Scholar : PubMed/NCBI
|
|
3
|
Yang W, Wang C, Lin Y, et al: OV6(+)
tumor-initiating cells contribute to tumor progression and invasion
in human hepatocellular carcinoma. J Hepatol. 57:613–620. 2012.
|
|
4
|
Piao LS, Hur W, Kim TK, et al:
CD133+ liver cancer stem cells modulate radioresistance
in human hepatocellular carcinoma. Cancer Lett. 315:129–137.
2011.
|
|
5
|
Lingala S, Cui YY, Chen X, et al:
Immunohistochemical staining of cancer stem cell markers in
hepatocellular carcinoma. Exp Mol Pathol. 89:27–35. 2010.
View Article : Google Scholar : PubMed/NCBI
|
|
6
|
Sukowati CH, Rosso N, Pascut D, et al:
Gene and functional up-regulation of the BCRP/ABCG2 transporter in
hepatocellular carcinoma. BMC Gastroenterol. 12:1602012. View Article : Google Scholar : PubMed/NCBI
|
|
7
|
Yamashita T, Ji J, Budhu A, et al:
EpCAM-positive hepatocellular carcinoma cells are tumor-initiating
cells with stem/progenitor cell features. Gastroenterology.
136:1012–1024. 2009. View Article : Google Scholar : PubMed/NCBI
|
|
8
|
Shi GM, Xu Y, Fan J, et al: Identification
of side population cells in human hepatocellular carcinoma cell
lines with stepwise metastatic potentials. J Cancer Res Clin Oncol.
134:1155–1163. 2008. View Article : Google Scholar : PubMed/NCBI
|
|
9
|
Ma S, Chan KW, Hu L, et al: Identification
and characterization of tumorigenic liver cancer stem/progenitor
cells. Gastroenterology. 132:2542–2556. 2007. View Article : Google Scholar : PubMed/NCBI
|
|
10
|
Chiba T, Miyagi S, Saraya A, et al: The
polycomb gene product BMI1 contributes to the maintenance of
tumor-initiating side population cells in hepatocellular carcinoma.
Cancer Res. 68:7742–7749. 2008. View Article : Google Scholar : PubMed/NCBI
|
|
11
|
Chiba T, Kita K, Zheng YW, et al: Side
population purified from hepatocellular carcinoma cells harbors
cancer stem cell-like properties. Hepatology. 44:240–251. 2006.
View Article : Google Scholar : PubMed/NCBI
|
|
12
|
Golebiewska A, Brons NH, Bjerkvig R and
Niclou SP: Critical appraisal of the side population assay in stem
cell and cancer stem cell research. Cell Stem Cell. 8:136–147.
2011. View Article : Google Scholar : PubMed/NCBI
|
|
13
|
Pastrana E, Silva-Vargas V and Doetsch F:
Eyes wide open: a critical review of sphere-formation as an assay
for stem cells. Cell Stem Cell. 8:486–498. 2011. View Article : Google Scholar : PubMed/NCBI
|
|
14
|
Uchida Y, Tanaka S, Aihara A, et al:
Analogy between sphere forming ability and stemness of human
hepatoma cells. Oncol Rep. 24:1147–1151. 2010.PubMed/NCBI
|
|
15
|
Zimmerman AL and Wu S: MicroRNAs, cancer
and cancer stem cells. Cancer Lett. 300:10–19. 2006. View Article : Google Scholar : PubMed/NCBI
|
|
16
|
Ji J, Yamashita T, Budhu A, et al:
Identification of microRNA-181 by genome-wide screening as a
critical player in EpCAM-positive hepatic cancer stem cells.
Hepatology. 50:472–480. 2009. View Article : Google Scholar : PubMed/NCBI
|
|
17
|
Li R, Qian N, Tao K, et al: MicroRNAs
involved in neoplastic transformation of liver cancer stem cells. J
Exp Clin Cancer Res. 29:1692012. View Article : Google Scholar : PubMed/NCBI
|
|
18
|
DiMeo TA, Anderson K, Phadke P, et al: A
novel lung metastasis signature links Wnt signaling with cancer
cell self-renewal and epithelial-mesenchymal-transition in
basal-like breast cancer. Cancer Res. 69:5364–5373. 2009.
View Article : Google Scholar : PubMed/NCBI
|
|
19
|
Meng Z, Fu X, Chen X, et al: miR-194 is a
marker of hepatic epithelial cells and suppresses metastasis of
liver cancer cells in mice. Hepatology. 52:2148–2157. 2010.
View Article : Google Scholar : PubMed/NCBI
|
|
20
|
Dong P, Kaneuchi M, Watari H, et al:
MicroRNA-194 inhibits epithelial to mesenchymal transition of
endometrial cancer cells by targeting oncogene BMI-1. Mol Cancer.
10:992011. View Article : Google Scholar : PubMed/NCBI
|
|
21
|
Shi L, Zhang J, Pan T, et al: MiR-125b is
critical for the suppression of human U251 glioma stem cell
proliferation. Brain Res. 1312:120–126. 2010. View Article : Google Scholar : PubMed/NCBI
|
|
22
|
Liang L, Wong CM, Ying Q, et al:
MicroRNA-125b suppressesed human liver cancer cell proliferation
and metastasis by directly targeting oncogene LIN28B2. Hepatology.
52:1731–1740. 2012. View Article : Google Scholar : PubMed/NCBI
|
|
23
|
Tirino V, Desiderio V, Paino F, et al:
Cancer stem cells in solid tumors: an overview and new approaches
for their isolation and characterization. FASEB J. 27:13–24. 2013.
View Article : Google Scholar : PubMed/NCBI
|
|
24
|
Mo SL, Li J, Loh YS, et al: Factors
influencing the abundance of the side population in a human myeloma
cell line. Bone Marrow Res. 52:2148–2157. 2011.
|
|
25
|
Mott JL: MicroRNAs involved in tumor
suppressor and oncogene pathways: implications for hepatobiliary
neoplasia. Hepatology. 50:630–637. 2009. View Article : Google Scholar : PubMed/NCBI
|
|
26
|
Jeon HM, Sohn YW, Oh SY, et al: ID4
imparts chemoresistance and cancer stemness to glioma cells by
derepressing miR-9*-mediated suppression of SOX2. Cancer
Res. 71:3410–3421. 2011. View Article : Google Scholar : PubMed/NCBI
|
|
27
|
Yu F, Yao H, Zhu P, et al: let-7 regulates
self- renewal and tumorigenicity of breast cancer cells. Cell.
131:1109–1123. 2007. View Article : Google Scholar : PubMed/NCBI
|
|
28
|
Hurst DR, Edmonds MD, Scott GK, et al:
Breast cancer metastasis suppressor 1 up-regulates miR-146, which
suppresses breast cancer metastasis. Cancer Res. 69:1279–1283.
2009. View Article : Google Scholar : PubMed/NCBI
|