Introduction
Surgical resection is one of the most reliable
treatment modalities for rectal cancer (RC), which is one of the
commonest malignancies in the world. At present, concurrent
chemoradiation therapy (CRT) is the standard treatment modality,
which, when administered preoperatively, is useful for tumor
downstaging, for increasing the curative resection rate, and for
decreasing the local recurrence rate (1–3). There
is, however, inter-individual variability in the response to CRT,
thus, in order to avoid its indication for those who will not
benefit from it, it is desirable to identify the individuals who
are less sensitive to CRT. However, at present, no effective
markers of the response to CRT have been reported.
The response to CRT depends not only on the direct
injury of cancer cells by chemotherapeutic agents and/or the
radiation, but also on the tumor antigen-specific T-cell responses
elicited by the injured cancer cells. It is well-known that the
biological behavior of cancer cells, or the tumor microenvironment,
which includes inflammatory cells and cytokines, might determine,
or at least influence, the response to therapy (4–6).
The immune system is divided into innate and
adaptive, which extensively interact (crosstalk) with each other.
The innate response includes several cellular effectors, such as
natural killer (NK) cells, macrophages, dendritic cells (DCs), and
plays an important role as the first line of defense. Adaptive
immunity is a more specific response, which is mediated by
antibodies and helper [CD4(+)] and cytotoxic [CD8(+)] T-cells. Both
innate and adaptive immune responses play an important role in
antitumor immunity. Recently, the existence of cells with
suppressive effects on the immune system, namely regulatory T-cells
(Tregs) and myeloid-derived suppressor cells (MDSCs), which play
important roles in the escape of cancer cells from the host immune
response, thus contributing to the development and progression of
cancer, has been reported (7,8).
Therefore, the balance between the antitumor effector cells and the
immunosuppressive cells is important in determining the response to
therapy.
Generally, cancer cells and immune cells interact
with each other through direct cell-cell contact or by production
of soluble factors, such as cytokines. Cancer cells are known as an
important source of inflammatory cytokines/growth factors, and the
production of different cytokines in the tumor microenvironment
determines cancer behavior. Alternatively, cytokines can be
produced by effector cells that promote antitumor immunity,
inhibiting tumor development and progression. By contrast,
cytokines that promote tumor growth, attenuate apoptosis and
facilitate invasion and metastasis can be produced by host immune
cells (6,9–11). An
endocrine loop between cancer cells, effector and suppressor cells,
cross-linked by tumor-derived soluble factors, such as transforming
growth factor-β (TGF-β) and interleukin (IL)-10, can generate a
potent immunoinhibitory effect on the antitumor immune response,
promoting cancer cell survival and proliferation. Thus, this
complex interaction between cancer cells and the host immune
system, involving production of cytokines, may play an important
role in the response to CRT.
In a recent report (Tada et al, unpublished
data), we investigated the predictive value of host immune cells,
especially lymphocyte subsets, in the response of RC to CRT, and
found that the pre-CRT counts of T-lymphocytes and helper
T-lymphocytes significantly correlated with the response to
CRT.
In the present study, we aimed to investigate the
concentrations of various cytokines in the plasma of RC patients
receiving CRT, and their correlation with the response to therapy,
in an attempt to find potential predictive markers of the response
to CRT, which would help the selection of those patients who would
or would not benefit from receiving therapy, and to understand the
complex interaction between cancer cells and the tumor
microenvironment, mediated by various cytokines.
Materials and methods
Patients
The study protocol was approved by the local ethics
committee, and written informed consent was obtained from all
patients. The studied population included 35 consecutive patients
with primary RC of clinical stage T3-4 and M0, receiving treatment
at the Department of Surgical Oncology, the University of Tokyo
Hospital, in the period between January 2010 and August 2012.
The enrolled patients received a total dose of 50 Gy
of radiation and concomitant 5-FU-based chemotherapy, followed by
standardized curative resection, applied in an interval of 6–8
weeks. Peripheral venous blood samples were obtained before
neoadjuvant CRT and 4–6 weeks following completion of CRT, prior to
surgery.
Flow cytometry
Peripheral blood cells (PBS) were analyzed on the
FACSCalibur flow cytometer using the Multiset software package, and
the collected data were analyzed using the CellQuest software (all
from BD Biosciences, San Jose, CA, USA).
A combination of fluorescein isothiocyanate (FITC)
and phycoerythrin (PE)-conjugated monocolonal antibody (BD
Biosciences) was used to identify the lymphocyte subsets and the
MDSCs, as follows: CD3(+)/CD19(−) for the T-lymphocytes,
CD3(−)/CD19(+) for the B-lymphocytes, CD3(−)/CD56(+) for the NK
cells, and CD33(+)/HLA(−)DR(−) for MDSCs (Table I).
 | Table ISurface marker expression according to
the cell phenotype. |
Table I
Surface marker expression according to
the cell phenotype.
| Surface marker
FITC/PE | Leukocyte subset |
|---|
| CD3(+)/CD19(−) | T-lymphocytes |
| CD3(−)/CD19(+) | B-lymphocytes |
| CD3(−)/CD56(+) | NK cells |
|
CD33(+)/HLA(−)DR(−) | MDSCs |
Biochemical determination
The serum samples were clarified by spinning at
3,000 rpm for 10 min at 20–25°C, and immediately stored at −40°C
prior to biochemical analyses. The serum concentration of IL-2,
IL-4, IL-6, IL-10, interferon (IFN)-γ, tumor necrosis factor
(TNF)-α, monocyte-chemoattractant protein (MCP)-1, chemokine
ligand-5 [(CCL-5, previously known as regulated on activation
normal T-cell expressed and secreted (RANTES)], tumor necrosis
factor-related apoptosis inducing ligand (TRAIL) and soluble
CD40-ligand (sCD40L) was measured using a Procarta polystyrene
bead-based multiplex immunoassay (Affymetrix, Inc., Santa Clara,
CA, USA) on the Luminex instrument and the data were analyzed using
the Luminex IS2.2/2.3 software.
Histological study
All the resected specimens were histologically
examined, and the findings were recorded in accordance with the TMN
classification. The histological regression of the primary rectal
lesions in response to CRT was evaluated by pathologists, and
classified as high or low, based on the amount of residual cancer,
according to the Japanese Classification of Colorectal Carcinoma:
cases in which more than two-thirds of the cancer had degraded,
necrotized, or disappeared were classified as high histological
regression (High-R), and those with less than two-third reduction
were classified as low histological regression (Low-R).
Statistical Analysis
The analyses of the associations between the serum
concentration of cytokines and the clinicopathological variables
were carried out using the Mann-Witney U test. The difference in
the serum pre- and post-CRT concentration of cytokines was
calculated using the Wilcoxon matched paired t-test. All analyses
were performed with JMP 9.0 software, and a P-value <0.05 was
considered to indicate a statistically significant difference.
Results
The clinicopathological features of the patients are
provided in Table II. Among them,
23 (65.7%) were male and 12 (34.3%)female. The median age was 62
(range 43–85) years. According to the pathological response to CRT,
the patients were divided into two groups, i.e., low response
(Low-R) (18 cases, 51.4%) and high response (High-R) (17 cases,
48.6%), and the four cases of pathological complete response (CR)
were included in the High-R.
| Table IIPatient characteristics (n=35). |
Table II
Patient characteristics (n=35).
| Characteristics | No. of patients
(%) |
|---|
| Gender |
| Male | 23 (65.7) |
| Female | 12 (34.3) |
| Age (years) |
| Median | 62 |
| Range | 43–85 |
| Histological
regression |
| Low-R | 18 (51.4) |
| High-R | 17 (48.6) |
| Depth of tumor |
| ypT0-pT2 | 17 (48.6) |
| ypT3-pT4 | 18 (51.4) |
| Lymph node
metastasis |
| Absent | 24 (68.6) |
| Present | 11 (31.4) |
| Lymphatic
invasion |
| Absent | 31 (88.6) |
| Present | 4 (11.5) |
| Venous
invasion |
| Absent | 14 (40.0) |
| Present | 21 (60.0) |
| Histological
classification |
|
Well-differentiated adenocarcinoma | 13 (37.1) |
| Moderately
differentiated adenocarcinoma | 15 (42.9) |
| Mucinous
carcinoma | 1 (2.9) |
| No cancer
remaining | 6 (17.1) |
First, the correlation between the pre-/post-CRT
cytokine levels and clinicopathological factors of the patients was
evaluated. A significant correlation between pre-CRT levels of
sCD40L and the depth of invasion and the venous invasion was
observed (Table III), but the
correlation was not found in the post-CRT. Cases of T0-2, i.e.,
those with remarkable dowsizing of T factor, showed significantly
higher concentrations of pre-CRT sCD40L compared to those without
(T3–4), and cases without venous invasion had higher levels of
sCD40L than those without. Similarly, post-CRT levels of CCL-5
significantly correlated with the depth of tumor invasion and with
venous invasion, with higher levels found in the ypT3-4 cases
compared to ypT0-2 ones, and in those with venous invasion compared
to those without (Table III).
| Table IIICorrelations between
clinicopathological factors and the cytokine levels. |
Table III
Correlations between
clinicopathological factors and the cytokine levels.
| A, Depth of
invasion |
|---|
|
|---|
| Pre-CRT | Post-CRT |
|---|
|
|
|
|---|
| Cytokinesa | ypT0-2 | ypT3-4 | P-value | ypT0-2 | ypT3-4 | P-value |
|---|
| IFN-γ | 0.69±0.94 | 0.17±0.25 | 0.038b | 0.34±0.55 | 0.21±0.23 | 0.369 |
| IL-10 | 1.45±1.87 | 0.74±0.86 | 0.171 | 1.08±1.47 | 1.07±1.28 | 0.988 |
| IL-2 | 3.44±5.43 | 1.53±2.53 | 0.199 | 2.31±4.26 | 1.59±2.52 | 0.554 |
| IL-4 | 10.40±13.54 | 5.21±6.66 | 0.167 | 6.68±7.97 | 7.02±9.89 | 0.911 |
| IL-6 | 11.76±12.68 | 8.32±5.59 | 0.316 | 44.51±91.88 | 23.60±28.05 | 0.426 |
| MCP-1 | 33.69±23.61 | 38.12±21.15 | 0.563 | 34.94±36.52 | 35.77±24.46 | 0.938 |
| CCL-5 | 1.29±1.05 | 1.86±1.10 | 0.114 | 1.05±0.71 | 1.63±0.98 | 0.05b |
| sCD40L | 10.85±3.79 | 7.67±3.24 | 0.012b | 6.85±3.22 | 7.61±5.03 | 0.594 |
| TNF-α | 4.06±4.98 | 2.44±3.27 | 0.267 | 3.54±4.01 | 7.33±13.68 | 0.274 |
| TRAIL | 46.56±26.39 | 34.18±11.32 | 0.109 | 53.04±73.36 | 35.01±13.97 | 0.349 |
|
| B, Lymph node
metastasis |
|
| Pre-CRT | Post-CRT |
|
|
|
| Cytokinesa | Absent | Present | P-value | Absent | Present | P-value |
|
| IFN-γ | 0.43±0.73 | 0.39±0.72 | 0.89 | 0.30±0.45 | 0.22±0.33 | 0.59 |
| IL-10 | 1.01±1.44 | 1.25±1.58 | 0.68 | 1.01±1.29 | 1.22±1.55 | 0.69 |
| IL-2 | 2.04±3.92 | 3.37±4.97 | 0.45 | 1.83±3.66 | 2.19±3.07 | 0.76 |
| IL-4 | 7.49±10.77 | 8.26±11.20 | 0.85 | 7.24±10.04 | 6.01±5.91 | 0.66 |
| IL-6 | 8.83±9.47 | 12.54±10.21 | 0.32 | 43.38±78.47 | 13.30±14.05 | 0.11 |
| MCP-1 | 34.98±25.35 | 38.13±13.58 | 0.64 | 36.29±35.93 | 33.35±13.25 | 0.73 |
| CCL-5 | 1.54±1.01 | 1.62±1.33 | 0.87 | 1.22±0.83 | 1.63±1.01 | 0.27 |
| sCD40L | 9.35±3.88 | 8.92±3.84 | 0.76 | 7.80±4.49 | 6.02±3.39 | 0.21 |
| TNF-α | 3.09±4.20 | 3.53±4.41 | 0.79 | 6.72±12.02 | 2.81±3.57 | 0.16 |
| TRAIL | 42.30±23.09 | 34.89±12.68 | 0.25 | 37.75±17.46 | 56.01±88.18 | 0.51 |
|
| C, Lymphatic
invasion |
|
| Pre-CRT | Post-CRT |
|
|
|
| Cytokinesa | Absent | Present | P-value | Absent | Present | P-value |
|
| IFN-γ | 0.39±0.67 | 0.66±1.12 | 0.67 | 0.26±0.41 | 0.38±0.55 | 0.72 |
| IL-10 | 1.01±1.39 | 1.68±2.11 | 0.58 | 0.92±1.16 | 2.30±2.26 | 0.31 |
| IL-2 | 2.12±3.85 | 5.10±6.77 | 0.45 | 1.68±3.27 | 3.94±4.62 | 0.41 |
| IL-4 | 7.24±9.87 | 11.53±17.71 | 0.67 | 6.74±9.05 | 7.77±8.54 | 0.83 |
| IL-6 | 8.99±8.90 | 17.72±13.68 | 0.29 | 6.47±69.99 | 13.11±12.13 | 0.13 |
| MCP-1 | 34.79±22.81 | 45.06±13.35 | 0.29 | 35.40±32.14 | 35.09±13.20 | 0.97 |
| CCL-5 | 1.60±1.09 | 1.36±1.35 | 0.75 | 1.36±0.91 | 1.30±0.88 | 0.90 |
| sCD40L | 9.19±3.89 | 9.43±3.74 | 0.91 | 7.58±4.33 | 4.63±1.62 | 0.03b |
| TNF-α | 2.85±3.86 | 6.12±6.25 | 0.19 | 5.82±10.78 | 2.94±3.87 | 0.32 |
| TRAIL | 40.17±21.29 | 38.21±12.62 | 0.83 | 35.85±16.80 | 101.24±145.69 | 0.44 |
|
| D, Venous
invasion |
|
| Pre-CRT | Post-CRT |
|
|
|
| Cytokinesa | Absent | Present | P-value | Absent | Present | P-value |
|
| IFN-γ | 0.52±0.83 | 0.36±0.64 | 0.53 | 0.28±0.45 | 0.28±0.41 | 1.00 |
| IL-10 | 1.10±1.61 | 1.08±1.40 | 0.98 | 0.87±1.40 | 1.21±1.35 | 0.48 |
| IL-2 | 2.26±4.64 | 2.52±4.08 | 0.91 | 1.84±3.94 | 2.01±3.16 | 0.90 |
| IL-4 | 7.76±12.71 | 7.71±9.56 | 0.99 | 5.46±7.04 | 7.78±9.98 | 0.43 |
| IL-6 | 8.97±11.44 | 10.67±8.61 | 0.64 | 36.53±94.33 | 31.51±44.51 | 0.87 |
| MCP-1 | 30.51±23.70 | 39.61±20.85 | 0.25 | 33.02±39.86 | 36.93±23.16 | 0.74 |
| CCL-5 | 1.40±1.08 | 1.68±1.13 | 0.46 | 0.97±0.50 | 1.60±1.02 | 0.02b |
| sCD40L | 10.91±3.83 | 8.09±3.45 | 0.04b | 7.10±3.11 | 7.34±4.88 | 0.86 |
| TNF-α | 3.16±4.40 | 3.27±4.18 | 0.94 | 3.03±4.12 | 7.12±12.65 | 0.18 |
| TRAIL | 41.46±21.87 | 39.11±20.16 | 0.77 | 56.38±80.91 | 35.57±15.56 | 0.38 |
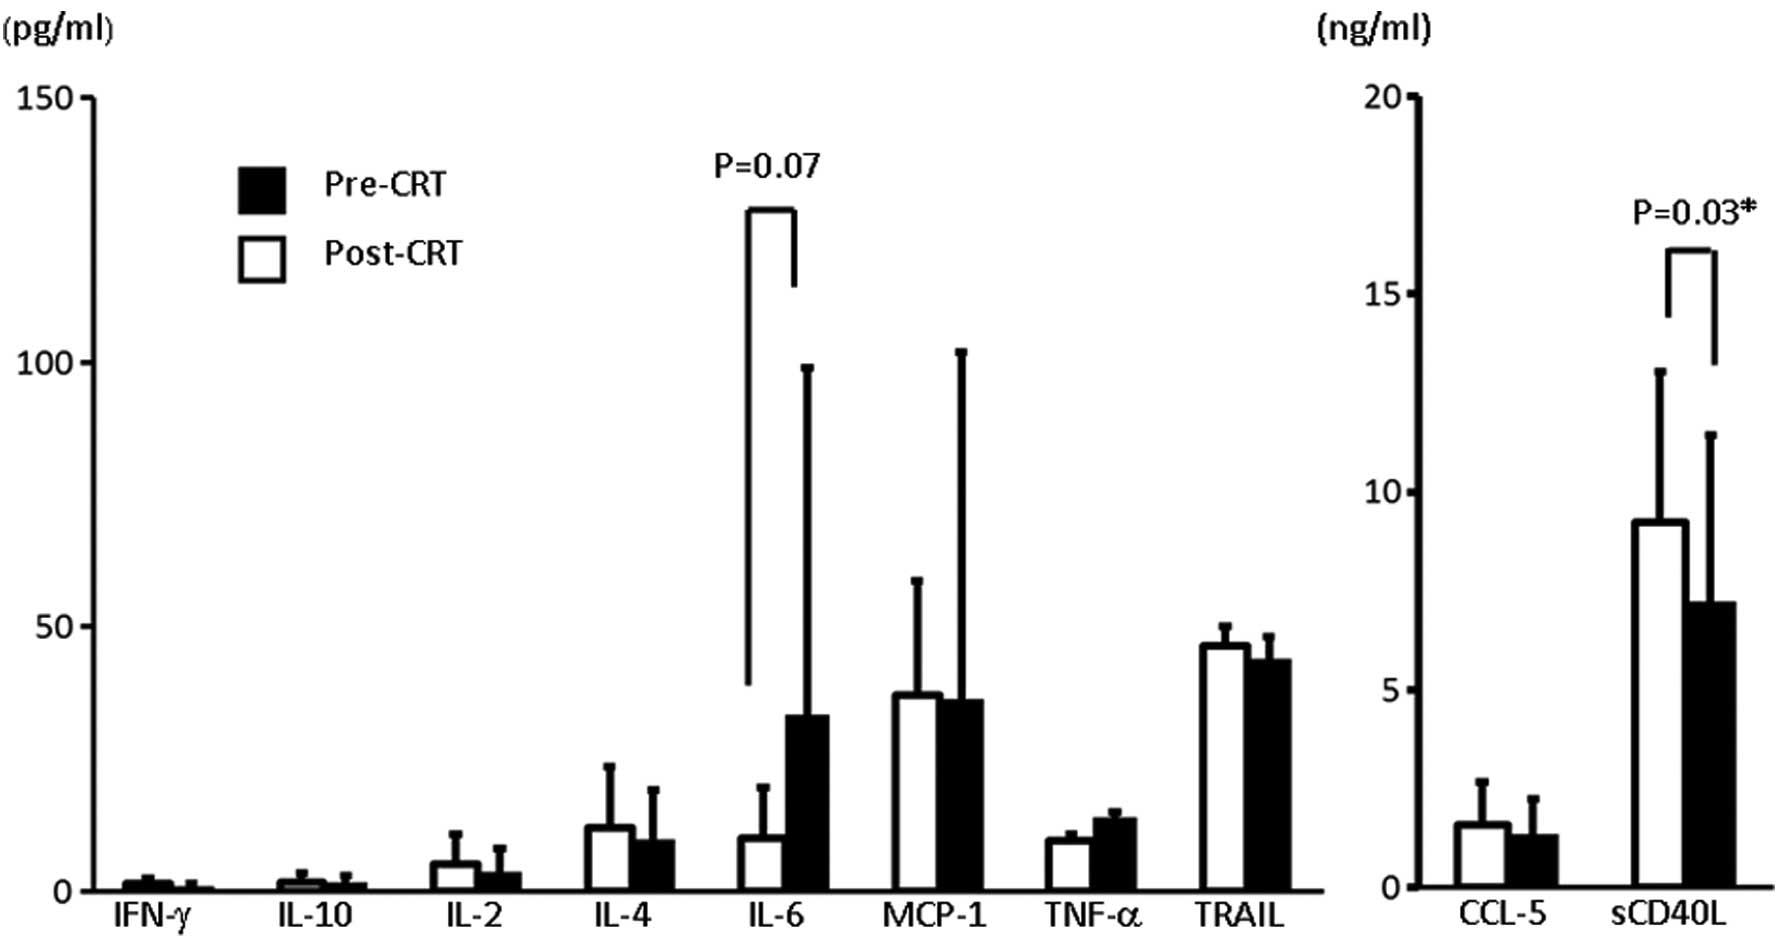
Next, the plasma levels of various cytokines were
compared between pre- and post-CRT samples, and a significant
decrease in the level of sCD40L was observed in post-CRT compared
to pre-CRT (Fig. 1). The levels of
IL-6 showed a tendency to increase in post-CRT samples, but this
result was not statistically significant. There were no significant
differences between the pre- and post-CRT concentrations of the
other cytokines tested, namely IL-2, IL-4, IL-10, IFN-γ, TNF-α,
MCP-1, CCL-5 and TRAIL. Next, the pre- and post-CRT levels of the
plasma cytokines were analyzed according to the pathological
response to CRT, i.e., High-R and Low-R. A significant difference
between High-R and Low-R was observed in the post-CRT levels of
IL-6 and TNF-α, both being higher in Low-R compared to High-R. None
of the pre-CRT cytokine levels correlated with the pathological
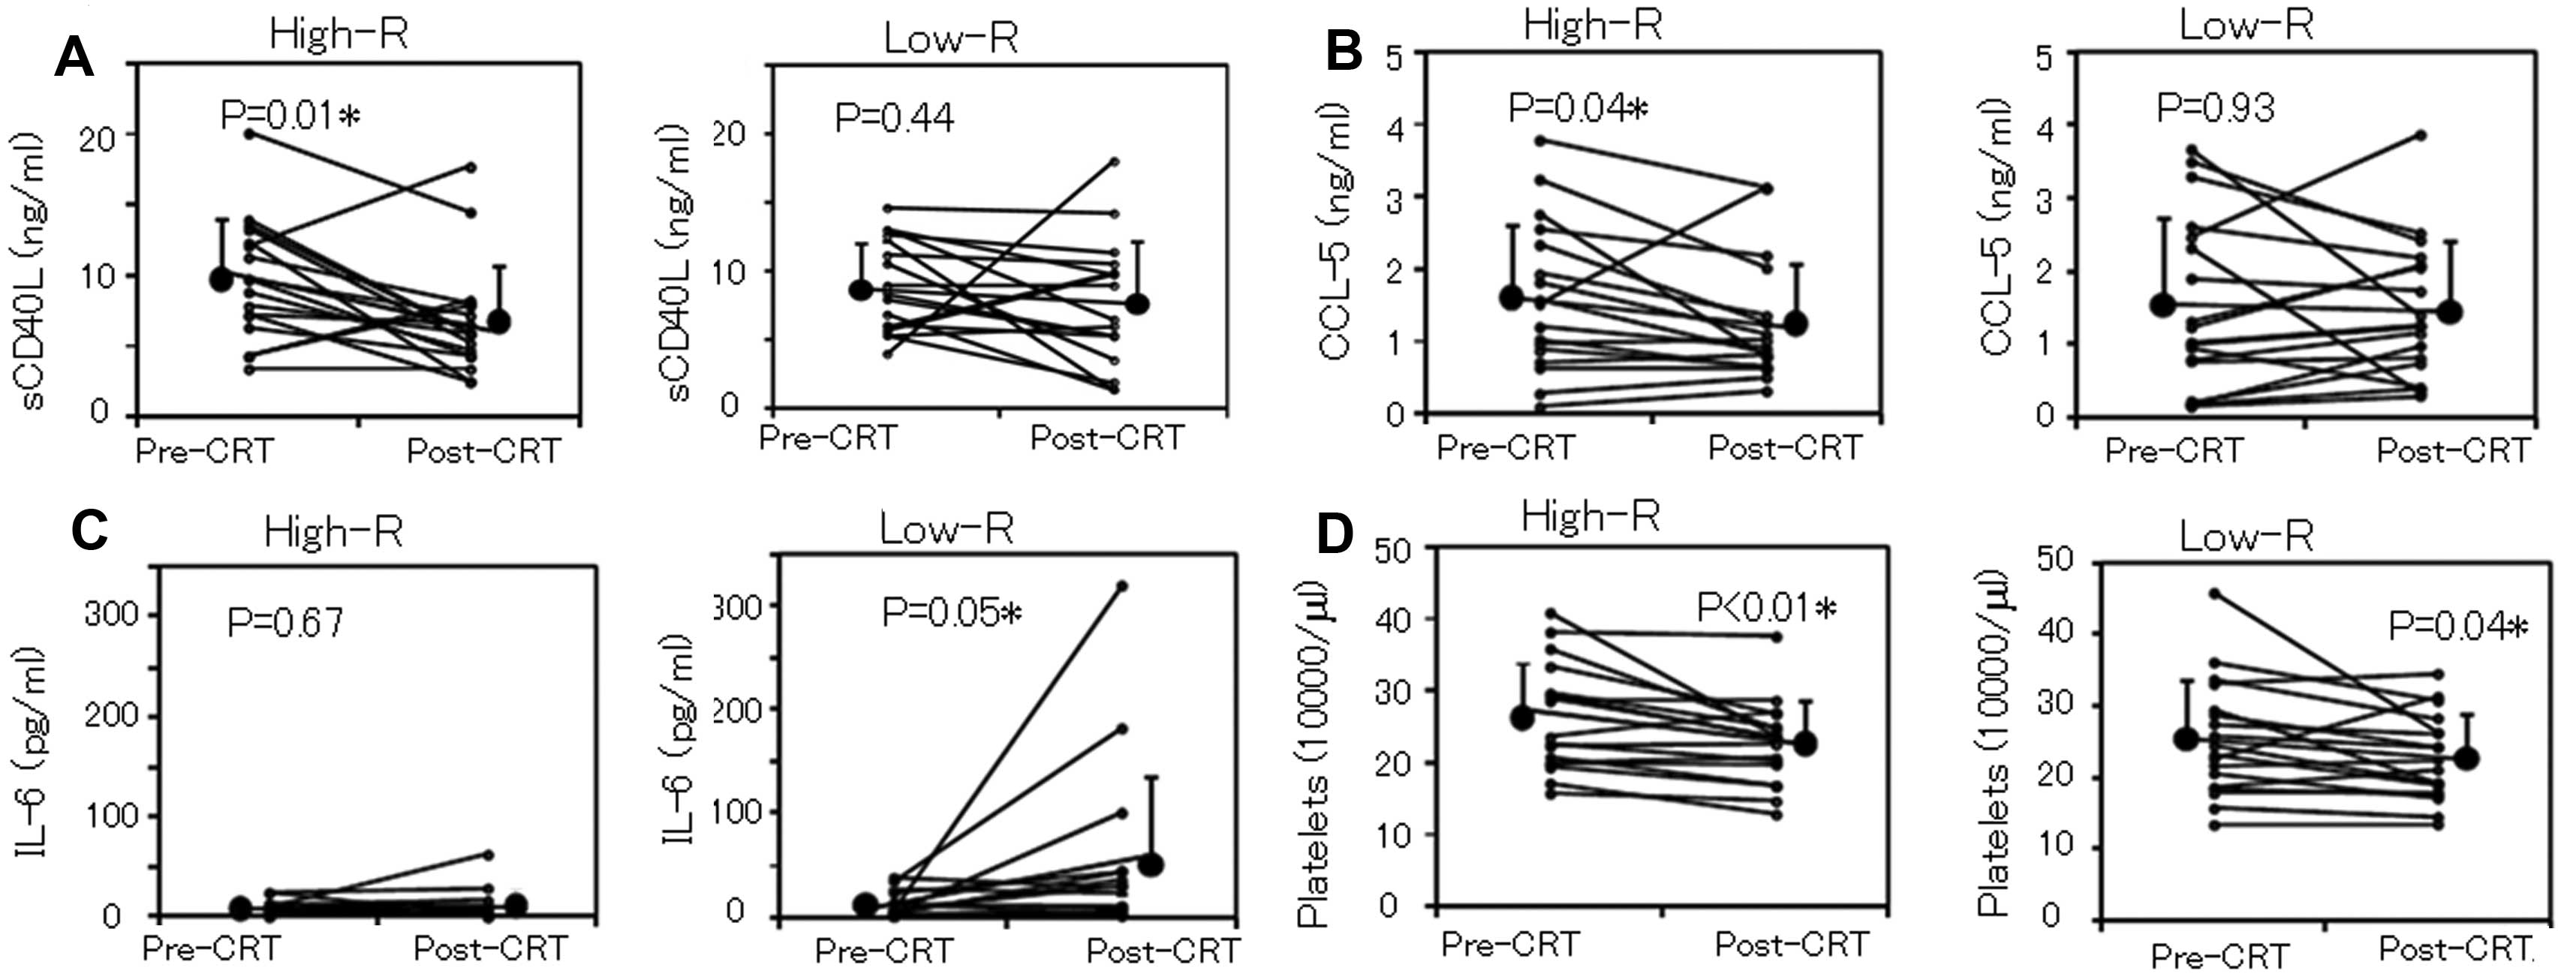
response to CRT (Table IV). Next,
we compared the pre- and post-CRT concentration of the plasma
cytokines in High-R and Low-R. The mean post-CRT levels of sCD40L
and CCL-5 were significantly lower compared to the pre-CRT ones in
the High-R, but not in the Low-R (Fig.
2). In addition, post-CRT platelet counts were significantly
decreased compared to the pre-CRT values in both High-R and Low-R,
while the difference was more evident in the High-R. By contrast,
the post-CRT level of IL-6 was significantly higher compared to the
pre-CRT one in the Low-R, but not in the High-R. No significant
differences were observed between the pre- and post-CRT
concentrations in samples of different pathological response to CRT
for the rest of the cytokines.
| Table IVCorrelations between the pathological
response and the cytokine levels. |
Table IV
Correlations between the pathological
response and the cytokine levels.
| Pre-CRT | Post-CRT |
|---|
|
|
|
|---|
| Cytokinesa | Low-R | High-R | P-value | Low-R | High-R | P-value |
|---|
| IFN-γ | 0.51±0.82 | 0.33±0.59 | 0.46 | 0.37±0.48 | 0.18±0.33 | 0.19 |
| IL-10 | 1.31±1.76 | 0.85±1.08 | 0.36 | 1.18±1.41 | 0.97±1.33 | 0.65 |
| IL-2 | 3.36±5.27 | 1.51±2.64 | 0.20 | 2.48±3.94 | 1.37±2.83 | 0.34 |
| IL-4 | 8.39±12.24 | 7.03±9.23 | 0.71 | 8.20±11.13 | 5.4±5.63 | 0.36 |
| IL-6 | 11.14±11.59 | 8.49±7.28 | 0.38 | 50.12±82.94 | 11.42±17.57 | 0.03b |
| MCP-1 | 38.38±24.50 | 33.42±19.81 | 0.51 | 37.63±25.88 | 32.97±35.30 | 0.67 |
| CCL-5 | 1.53±1.18 | 1.62±1.05 | 0.76 | 1.43±0.95 | 1.26±0.86 | 0.59 |
| sCD40L | 8.68±3.35 | 9.78±4.29 | 0.47 | 7.65±4.49 | 6.80±3.98 | 0.56 |
| TNF-α | 4.31±4.99 | 2.08±2.91 | 0.11 | 9.11±13.28 | 1.65±2.19 | 0.03b |
| TRAIL | 40.50±22.34 | 39.47±19.21 | 0.89 | 56.85±71.76 | 31.20±15.79 | 0.18 |
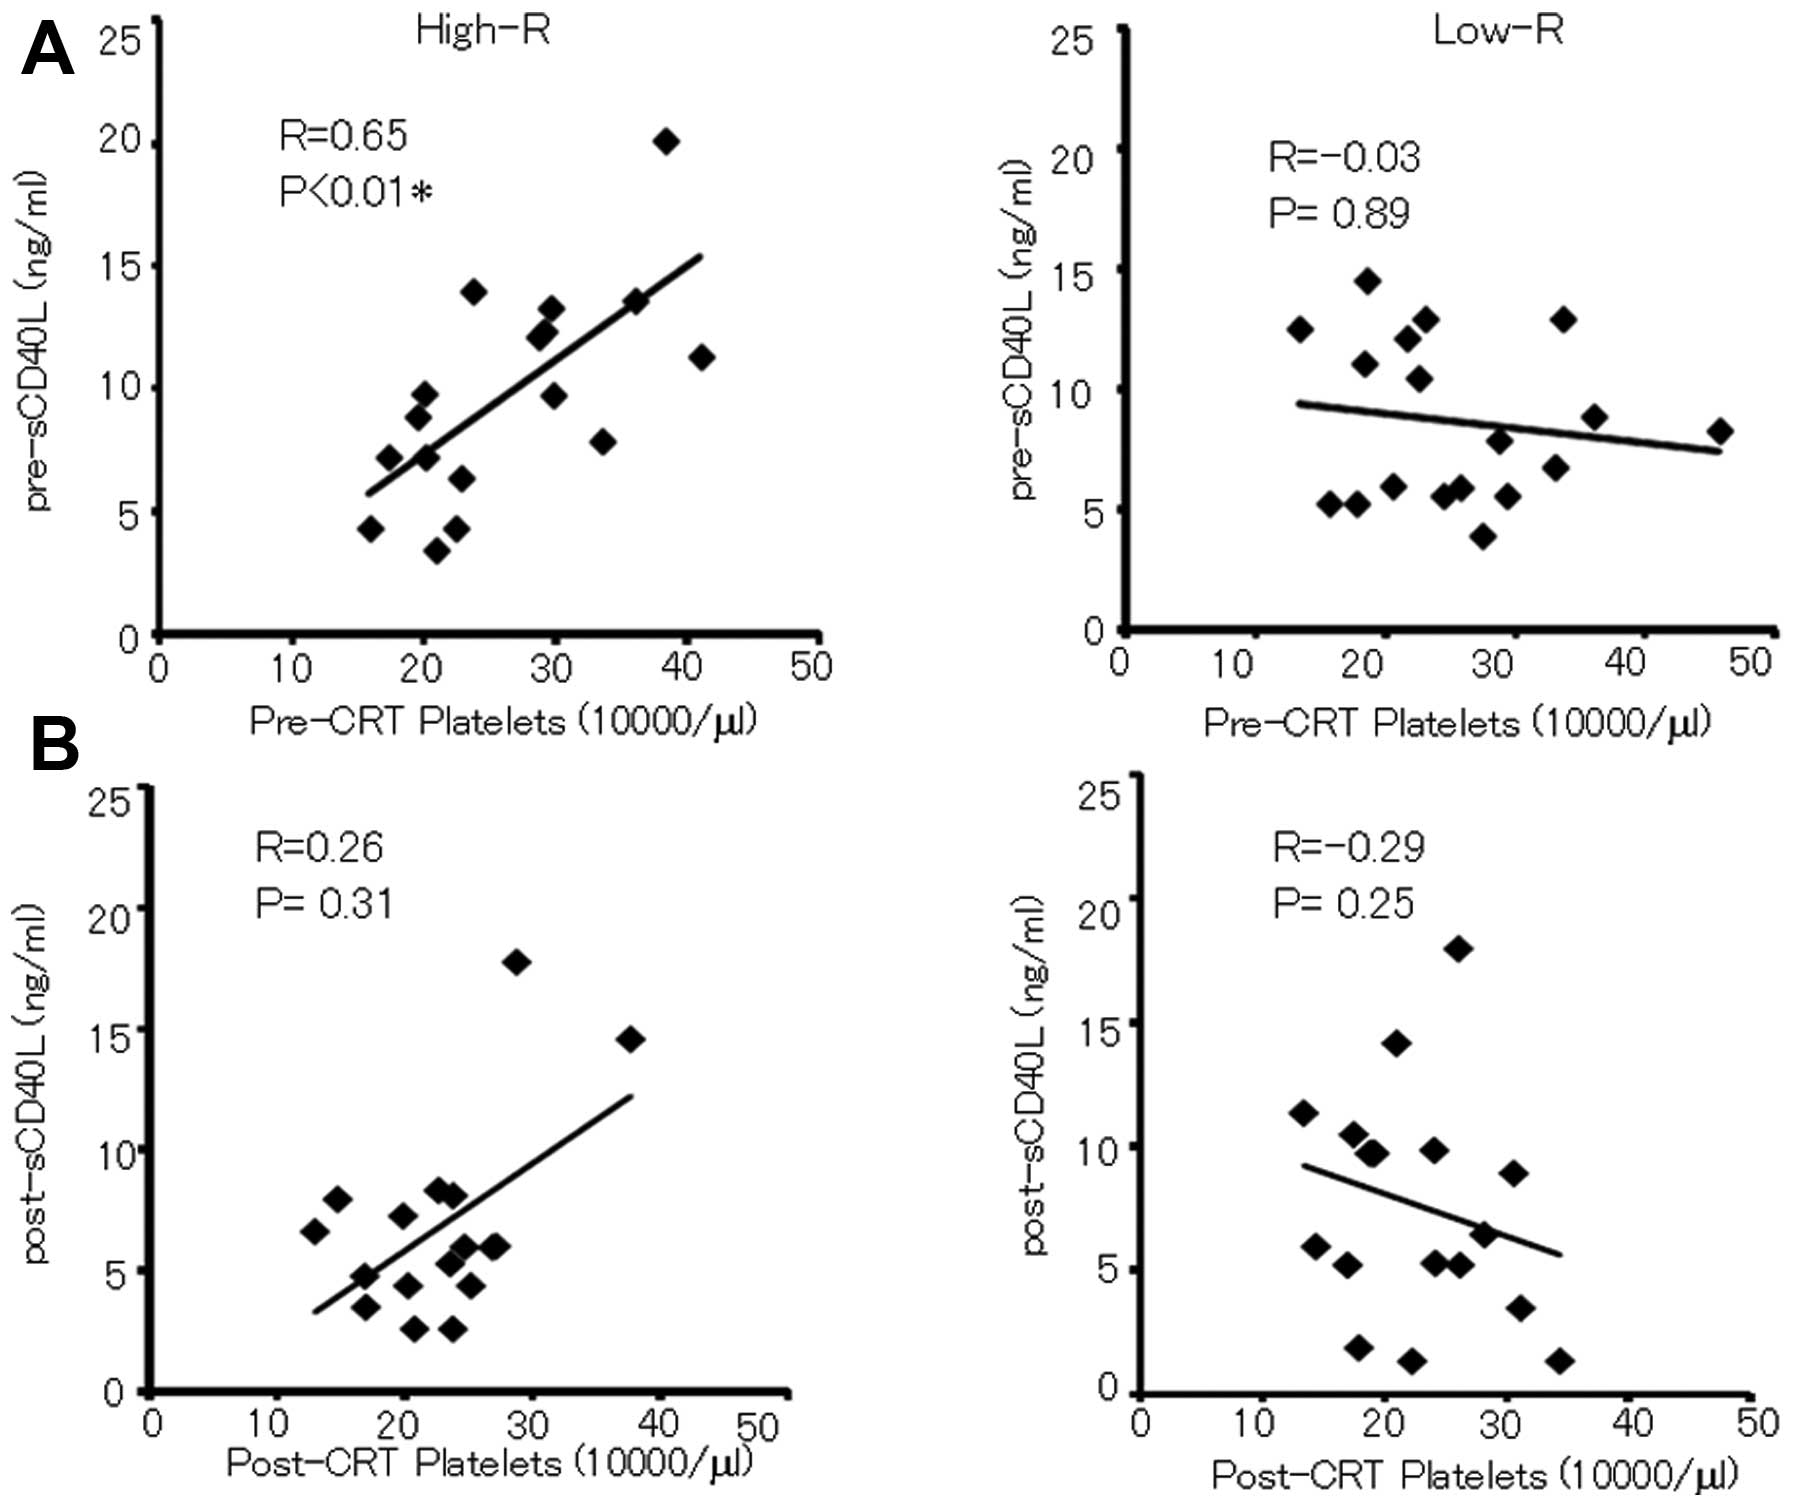
Since it is well-known that most sCD40L and CCL-5
are produced by platelets and T-lymphocytes, next, we analyzed the
correlation between platelet counts and the plasma levels of sCD40L
and CCL-5, pre- and post-CRT, according to the response to CRT.
Notably, we found that the pre-CRT sCD40L significantly correlated
with platelet counts only in pre-CRT samples of High-R, but not in
Low-R (Fig. 3A). No such
correlation was found between the post-CRT levels of CD40L and the
platelet counts in either group (Fig.
3B). In addition, no correlation was found between the plasma
levels of CCL-5 and platelet counts, either pre- or post-CRT, in
either High-R or Low-R. As expected, a tendency for a negative
correlation between pre-CRT sCD40L and CCL-5 levels was observed
only in the High-R (R=−0.36, P=0.15), but not in the Low-R
(R=0.02). Also, no correlation was observed between post-CRT levels
of sCD40L and CCL5 in either High-R or Low-R (data not shown).
Next, the involvement of the immune cells in the
response to therapy was evaluated in High-R and Low-R. The pre-CRT
T-lymphocyte counts in High-R were significantly higher than those
in Low-R (Table V), whereas in the
post CRT samples, no difference between Low-R and High-R was
observed. However, no correlation was found between CD3(+) T-cell
counts and sCD40L in either pre- or post-CRT, in either High-R or
Low-R. Moreover, there was no correlation between the pre-CRT CCL-5
level and CD3(+) T-cell counts, in either High-R or Low-R (data not
shown). The post-CRT CCL-5 level, however, showed a negative, but
not significant, correlation with CD3(+) T-cell counts in the
High-R (R=−0.37, P=0.14), whereas a positive, but not significant,
correlation was observed in the Low-R (R=0.33, P=0.18) (data not
shown).
| Table VCorrelations between the pathological
response and the leukocyte subsets. |
Table V
Correlations between the pathological
response and the leukocyte subsets.
| Pre-CRT | Post-CRT |
|---|
|
|
|
|---|
| Leukocyte
subseta | Low-R | High-R | P-value | Low-R | High-R | P-value |
|---|
| T-lymphocytes | 973±217 | 1197±419 | 0.05 | 555±230 | 609±405 | 0.63 |
| B-lymphocytes | 134±99 | 201±163 | 0.16 | 31±19 | 42±40 | 0.31 |
| NK cells | 260±243 | 317±229 | 0.49 | 199±135 | 191±151 | 0.86 |
| MDSCs | 1.32±1.35 | 2.11±2.64 | 0.31 | 3.51±5.72 | 3.18±7.43 | 0.91 |
To evaluate the hypothesis that sCD40L plays an
immunosuppressive role, we analyzed the percentage of MDSCs in
peripheral blood. No significant change in the percentage of MDSCs
was observed post-CRT (P=0.26), compared to pre-CRT, and also no
differences between Low-R and High-R were observed (pre-CRT,
P=0.31; post-CRT, P=0.91) (Table
V). In addition, no correlation between the percentage of MDSCs
and the concentration of sCD40L was found.
Discussion
It was previously believed that the antitumor
effects of CRT were almost completely dependent on the direct
injury of tumor cells by anticancer agents and/or irradiation, but
recently, it was confirmed that the immune system further
contributes to the antitumor effects of CRT (12).
Exposure to irradiation leads to an inflammatory
response that is highly heterogeneous, but only few reports have
analyzed the relevant mechanism, especially related to changes in
cytokines and inflammatory cells. Both the innate and the adaptive
immune responses are orchestrated by cytokines, which establish the
most efficient machinery for preventing cancer growth and
progression. By contrast, a number of cytokines might have
inhibitory effects on this machinery, leading to the promotion of
tumor growth (6,9–11).
To date, numerous studies have been conducted to
evaluate the prognostic factors of RC patients receiving CRT, but
only few reports have focused on the plasma cytokines, such as
IL-6, TGF-β, IL-10 and sCD40L, and the reported findings on their
correlation with the response to CRT have been ambiguous (4,13–15).
In prostate cancer patients receiving radiotherapy, increased
levels of IL-6, but not IL-2, IL-4, or TNF-α, 15 days following
radiotherapy (RT), were found to correlate with a marked decrease
in PSA level (16). Other
cytokines, such as IL-1 and TGF-β, have also been reported to be
affected by RT in prostate cancer patients. Therefore, it is
possible that levels of some cytokines in patient plasma might
correlate with the effects of CRT and, thus, may be useful for the
prediction of the response to therapy.
First, we analyzed the correlation between the
plasma levels of various cytokines and the clinicopathological
features of RC patients treated with CRT and surgery. We observed a
significant correlation between the pre-CRT plasma levels of sCD40L
and the depth of tumor invasion and venous invasion, with sCD40L
levels being significantly increased in cases of downsizing of the
primary tumor (ypT0-2) compared to locally advanced tumors (ypT3-4)
following CRT. Moreover, the pre-CRT sCD40L level was significantly
higher in cases without venous invasion compared to those with
venous invasion. In addition, the post-CRT level of sCD40L was
significantly higher in the group without lymphatic invasion,
compared to the group with lymphatic invasion. By contrast, the
post-CRT level of CCL-5 was significantly higher in locally
advanced tumors (ypT3-4) compared to cases of downsizing of the
primary tumor (ypT0-2), and also significantly higher in those
cases with venous invasion, compared to the cases without. Thus, it
appears that an increased level of CCL-5 following CRT is
associated with a poor response to therapy, while a higher pre-CRT
level of sCD40L is associated with downsizing of the primary
tumor.
Next, we analyzed the correlation of the plasma
levels of cytokines and the pathological response to therapy, and
found a significant decrease in the plasma levels of sCD40L in
post-CRT compared to pre-CRT samples, but when High-R and Low-R
groups were analyzed separately, a significant reduction in sCD40L
following CRT was observed only in High-R. By contrast, although
without statistical significance, the post-CRT level of IL-6 was
higher than the pre-CRT one. When changes in IL-6 were analyzed in
the High-R and Low-R groups separately, the significant increase
was observed in the Low-R, but not in the High-R. By contrast, a
significant decrease in the level of CCL-5 following CRT was
observed in the High-R, but not in the Low-R. The other cytokines
analyzed, namely IL-2, −4, −10, INF-γ, TNF-α, TRAIL, MCP-1 and
CCL-5 were not affected by CRT.
Since platelets and activated T-lymphocytes are
known to express surface CD40L and to generate a soluble fragment
of CD40L (17,18), we investigated whether platelet
counts were affected by CRT, and observed that platelets were
significantly reduced in both High-R and Low-R, but the difference
was more evident in the High-R. Similarly, a significant reduction
in the levels of sCD40L and CCL-5 following CRT was observed, but
only in the High-R. Thus, it seems that the significant reduction
in sCD40L and CCL-5 following CRT is associated with a favorable
response to therapy. It is possible that changes in these cytokines
merely reflect changes in the platelet counts. However, the
significant correlation between pre-CRT sCD40L and platelet counts
was observed only in High-R, and in this group, a negative
correlation between pre-CRT CCL-5 and platelet counts was found,
potentially leading to a negative correlation between pre-CRT
sCD40L and CCL-5. Thus, it may be speculated that, although both
cytokines are significantly reduced following CRT in High-R, they
have antagonistic effects in the response to CRT. Further
corroborating this hypothesis is our finding that the higher
pre-CRT level of sCD40L was associated with tumor downstaging
folllowing CRT and with absence of venous invasion, whereas higher
post-CRT CCL-5 was associated with locally more advanced tumors and
the presence of venous invasion.
In our previous study (Tada et al,
unpublished data), we demonstrated that, compared to pre-CRT, the
post-CRT numbers of T- and B-lymphocytes were significantly
decreased, and the patients with a favorable response (High-R) had
a higher number of pre-CRT T-lymphocytes than those with a poor
response (Low-R group) (P<0.01). In the present study however,
we were unable to demonstrate a clear association between the
investigated cytokines and the immune cells. Recently, in addition
to the antitumor immunity-inducing effect, the immunosuppressive
effect of the CD40-CD40L costimulator pathway, possibly via
stimulation of MDSCs, was reported (19,20).
More recently, tumor-infiltrating monocytic MDSCs have been shown
to secrete CCL-5, recruiting Tregs, which favor tumor growth in
mice (21). In non-small cell lung
cancer patients treated with EGFR-TKIs, low levels of CCL-5 at
diagnosis were reported to be significantly associated with
long-term survival (22). In our
series, however, we did not find any correlation between sCD40L in
plasma and the populations of MDSCs [CD33(+)HLA(−)DR(−)], either
pre- or post-CRT, in either High-R or Low-R. However, a tendency
for a negative correlation between post-CRT levels of CCL-5 and
CD3(+) T-cell counts was observed in the High-R, whereas a tendency
for a positive correlation was observed in the Low-R. Thus, it is
tempting to speculate that Tregs, characterized as
CD4(+)/CD25(+)/FoxP3(+), are involved in the poor response of
Low-R, possibly by recruiting Tregs. CD4(+) cells are part of
CD3(+) cells, which showed a tendency for a positive correlation
with CCL-5, and this cytokine is reported to be associated with
progression and metastasis (23–26)
and with poor response to therapy in various tumor types (27,28).
In addition, the negative correlation between CCL-5 and CD3(+)
T-cells in the High-R strengthens our hypothesis. Unfortunately, in
this study, we did not investigate Tregs, and this is the topic of
a future study.
The reason why post-CRT sCD40L levels are
significantly reduced in High-R is not known, but it is known that,
in addition to the immunomodulatory effects, the CD40 signaling
pathway also plays an important role in proliferation,
differentiation and apoptosis of cancer cells. Many tumor cells
also express CD40 (29–32), and evidence suggests that ligation
of CD40 might promote either cell proliferation or apoptosis,
depending on the intensity of CD40L signaling (33,34).
Although we did not investigate the expression of CD40 in cancer
cells, it can be speculated that sCD40L may induce antitumor
effects, either through binding to immune cells, stimulating an
antitumor immunity, or through the direct binding to cancer cells,
inducing their apoptotic cell death; in both situations, sCD40L
levels are reduced by consumption.
In addition, in our series, we found higher levels
of post-CRT IL-6 and TNF-α in the Low-R compared to the High-R,
which suggests that these cytokines might serve as indicators of a
poor response to CRT. Also, when comparing pre- and post-CRT levels
of these cytokines, a significant increase in post-CRT IL-6 was
observed in the Low-R, corroborating this hypothesis. IL-6 levels
were also reported to be associated with poor prognosis in various
types of cancer, including pancreatic, breast, ovarian and
esophageal (15,35), and increased levels of TNF-α have
been shown to correlate with poor prognosis in colorectal cancer
patients (36,37). IL-6 has been shown to be associated
with tumor stage, metastasis and survival of colorectal cancer
patients (13–15,35).
Furthermore, increased levels of serum IL-6 during CRT have been
reported, but no association with the response rate has been
demonstrated (4). In our series, 3
cases in the Low-R showed a significant elevation in IL-6 following
CRT, which resulted in a significant increase in the post-CRT
levels compared to the pre-CRT ones in this group of patients. On
the other hand, the IL-6 levels did not change following CRT in the
High-R. From these data, we hypothesize that IL-6, as well as
TNF-α, reflect the inflammatory damage caused by CRT, which might
impair antitumor immunity. Thus, IL-6 and TNF-α might be useful
markers of a poor response to CRT, but since only the post-CRT, but
not the pre-CRT levels, correlated with the response to treatment,
their use as predictive markers prior to therapy is uncertain.
In a recent report, we demonstrated that the pre-CRT
platelet counts correlated with the response of CRT and the local
recurrence-free survival in RC patients (38). When patients were divided into
thrombocytotic (defined as platelet count >36.5 ×
10,000/μl) and those with platelet counts within the normal
range, those with thrombocytosis had a poor response to CRT
(38). In the present series, only
two patients were thrombocytotic according to this classification,
and one case classified as High-R and the other as Low-R.
Interestingly, we observed that the platelet counts were
significantly affected by CRT in both High-R and Low-R, but the
difference was more evident in the High-R. This result might merely
reflect the association of thrombocytosis with a poor response to
CRT, but considering that platelets are the major source of both
sCD40L and CCL-5, it is highly probable that platelets play an
important role in the complex interaction between cytokines and the
immune system, by eliciting antitumor immunity. Considering all
these data, it is tempting to speculate that patients in a better
immunological condition prior to treatment, including higher blood
platelet counts, are able to induce more effective antitumor
immunity, and sCD40L might contribute to the antitumor effects,
whereas CCL-5 might inhibit it. Whether platelets and immune cells
preferentially produce either sCD40L or CCL-5 might determine the
fate of cancer cells.
In conclusion, our results suggest that the complex
interaction among the immune system, platelets and tumor cells,
mediated through various cytokines/chemokines, determines the
response of RC patients to CRT. The analysis of the immunological
condition of the patient prior to treatment, including immune cells
and platelets, might help predicting the response to treatment, and
the pre-/post-CRT measurement of sCD40L, CCL-5, TNF-α and IL-6 may
also be useful, particularly in deciding on the need of additional
therapy. Since the number of cases included in this study was
relatively small, a more large-scale prospective study will be
necessary to confirm the present findings, and to clarify this
complex association between the immune system, platelets and cancer
cells, cross-linked through various cytokines/chemokines. By
understanding the role of these molecules in regulating the
response to CRT, new approaches for the improvement of treatment
might be proposed.
Acknowledgements
The authors thank Ms. Mika Matsuhashi, Mr. Yutaka
Nagura and Ms. Junko Iino from the Department of Transfusion
Medicine (University of Tokyo) for their kind advice and technical
assistance.
References
|
1
|
Sauer R, Becker H, Hohenberger W, et al:
Preoperative versus postoperative chemoradiotherapy for rectal
cancer. N Eng J Med. 351:1731–1740. 2004. View Article : Google Scholar : PubMed/NCBI
|
|
2
|
Bosset JF, Collette L, Calais G, et al:
Chemotherapy with preoperative radiotherapy in rectal cancer. N Eng
J Med. 355:1114–1123. 2006. View Article : Google Scholar : PubMed/NCBI
|
|
3
|
Ortholan C, Francois E, Thomas O, et al:
Role of radiotherapy with surgery for T3 and resectable T4 rectal
cancer: evidence from randomized trials. Dis Colon Rectum.
49:302–310. 2006. View Article : Google Scholar : PubMed/NCBI
|
|
4
|
Debucquoy A, Goethals L, Geboes K, Roels
S, Mc Bride WH and Haustermans K: Molecular responses of rectal
cancer to preoperative chemoradiation. Radiother Oncol. 80:172–177.
2006. View Article : Google Scholar : PubMed/NCBI
|
|
5
|
Baier PK, Eggstein S, Wolff-Vorbeck G,
Baumgartner U and Hopt UT: Chemokines in human colorectal
carcinoma. Anticancer Res. 25:3581–3584. 2005.PubMed/NCBI
|
|
6
|
Dranoff G: Cytokines in cancer
pathogenesis and cancer therapy (Review). Nat Rev Cancer. 4:11–22.
2004. View
Article : Google Scholar
|
|
7
|
Okita R, Yamaguchi Y, Ohara M, et al:
Targeting of CD4+CD25high cells while
preserving CD4+CD25low cells with low-dose
chimeric anti-CD25 antibody in adoptive immunotherapy of cancer.
Int J Oncol. 34:563–572. 2009.
|
|
8
|
Ostrand-Rosenberg S: Myeloid-derived
suppressor cells: more mechanisms for inhibiting antitumor immunity
(Review). Cancer Immunol Immunother. 59:1593–1600. 2010. View Article : Google Scholar : PubMed/NCBI
|
|
9
|
McDonnell AM, Nowak AK and Lake RA:
Contribution of the immune system to the chemotherapeutic response.
Semin Immunopathol. 33:353–367. 2011. View Article : Google Scholar : PubMed/NCBI
|
|
10
|
Ong ZY, Gibson RJ, Bowen JM, et al:
Pro-inflammatory cytokines play a key role in the development of
radiotherapy-induced gastrointestinal mucositis. Radiat Oncol.
5:222010. View Article : Google Scholar : PubMed/NCBI
|
|
11
|
Schaue D, Kachikwu EL and McBride WH:
Cytokines in radiobiological responses: a review (Review). Radiat
Res. 178:505–523. 2012. View
Article : Google Scholar : PubMed/NCBI
|
|
12
|
Lin WW and Karin M: A cytokine-mediated
link between innate immunity, inflammation, and cancer. J Clin
Invest. 117:1175–1183. 2007. View
Article : Google Scholar : PubMed/NCBI
|
|
13
|
Lin CC, Liu CY, Chen MJ, et al: Profiles
of circulating endothelial cells and serum cytokines during
adjuvant chemoradiation in rectal cancer patients. Clin Transl
Oncol. 15:855–860. 2013. View Article : Google Scholar : PubMed/NCBI
|
|
14
|
Chung YC and Chang YF: Serum interleukin-6
levels reflect the disease status of colorectal cancer. J Surg
Oncol. 83:222–226. 2003. View Article : Google Scholar : PubMed/NCBI
|
|
15
|
Waldner MJ, Foersch S and Neurath MF:
Interleukin-6 - a key regulator of colorectal cancer development.
Int J Biol Sci. 8:1248–1253. 2012. View Article : Google Scholar : PubMed/NCBI
|
|
16
|
Lopes CO and Callera F: Three-dimensional
conformal radiotherapy in prostate cancer patients: rise in
interleukin 6 (IL-6) but not IL-2, IL-4, IL-5, tumor necrosis
factor-α, MIP-1-α, and LIF levels. Int J Radiat Oncol Biol Phys.
82:1385–1388. 2012.PubMed/NCBI
|
|
17
|
Andre P, Nannizzi-Alaimo L, Prasad SK and
Phillips DR: Platelet-derived CD40L: the switch-hitting player of
cardiovascular disease. Circulation. 106:896–899. 2002. View Article : Google Scholar : PubMed/NCBI
|
|
18
|
Aukrust P, Damas JK and Solum NO: Soluble
CD40 ligand and platelets: self-perpetuating pathogenic loop in
thrombosis and inflammation? J Am Coll Cardiol. 43:2326–2328. 2004.
View Article : Google Scholar : PubMed/NCBI
|
|
19
|
Schlom J, Jochems C, Gulley JL and Huang
J: The role of soluble CD40L in immunosuppression. Oncoimmunology.
2:e225462013. View Article : Google Scholar : PubMed/NCBI
|
|
20
|
Huang J, Jochems C, Talaie T, et al:
Elevated serum soluble CD40 ligand in cancer patients may play an
immunosuppressive role. Blood. 120:3030–3038. 2012. View Article : Google Scholar : PubMed/NCBI
|
|
21
|
Schlecker E, Stojanovic A, Eisen C, et al:
Tumor-infiltrating monocytic myeloid-derived suppressor cells
mediate CCR5-dependent recruitment of regulatory T cells favoring
tumor growth. J Immunol. 189:5602–5611. 2012. View Article : Google Scholar
|
|
22
|
Umekawa K, Kimura T, Kudoh S, et al:
Plasma RANTES, IL-10, and IL-8 levels in non-small-cell lung cancer
patients treated with EGFR-TKIs. BMC Res Notes. 6:1392013.
View Article : Google Scholar : PubMed/NCBI
|
|
23
|
Lin S, Wan S, Sun L, et al: Chemokine C-C
motif receptor 5 and C-C motif ligand 5 promote cancer cell
migration under hypoxia. Cancer Sci. 103:904–912. 2012. View Article : Google Scholar : PubMed/NCBI
|
|
24
|
Chuang JY, Yang WH, Chen HT, et al:
CCL5/CCR5 axis promotes the motility of human oral cancer cells. J
Cell Physiol. 220:418–426. 2009. View Article : Google Scholar : PubMed/NCBI
|
|
25
|
Lapteva N and Huang XF: CCL5 as an
adjuvant for cancer immunotherapy. Expert Opin Biol Ther.
10:725–733. 2010. View Article : Google Scholar : PubMed/NCBI
|
|
26
|
Zhang Y, Yao F, Yao X, et al: Role of CCL5
in invasion, proliferation and proportion of
CD44+/CD24− phenotype of MCF-7 cells and
correlation of CCL5 and CCR5 expression with breast cancer
progression. Oncol Rep. 21:1113–1121. 2009.PubMed/NCBI
|
|
27
|
Yi EH, Lee CS, Lee JK, et al: STAT3-RANTES
autocrine signaling is essential for tamoxifen resistance in human
breast cancer cells. Mol Cancer Res. 11:31–42. 2013. View Article : Google Scholar : PubMed/NCBI
|
|
28
|
Radziwon-Balicka A, Medina C, O'Driscoll
L, et al: Platelets increase survival of adenocarcinoma cells
challenged with anticancer drugs: mechanisms and implications for
chemoresistance. Br J Pharmacol. 167:787–804. 2012. View Article : Google Scholar : PubMed/NCBI
|
|
29
|
Li R, Chen WC, Pang XQ, Hua C, Li L and
Zhang XG: Expression of CD40 and CD40L in gastric cancer tissue and
its clinical significance. Int J Mol Sci. 10:3900–3917. 2009.
View Article : Google Scholar : PubMed/NCBI
|
|
30
|
Roselli M, Mineo TC, Basili S, et al:
Soluble CD40 ligand plasma levels in lung cancer. Clin Cancer Res.
10:610–614. 2004. View Article : Google Scholar : PubMed/NCBI
|
|
31
|
Pan W, Gong J, Yang C, et al: Peripheral
blood CD40-CD40L expression in human breast cancer. Ir J Med Sci.
Feb 28–2013.(Epub ahead of print).
|
|
32
|
Toutirais O, Gervais A, Cabillic F, et al:
Effects of CD40 binding on ovarian carcinoma cell growth and
cytokine production in vitro. Clin Exp Immunol. 149:372–377. 2007.
View Article : Google Scholar : PubMed/NCBI
|
|
33
|
Li R, Chen WC, Pang XQ, Tian WY and Zhang
XG: Influence of sCD40L on gastric cancer cell lines. Mol Biol Rep.
38:5459–5464. 2011. View Article : Google Scholar : PubMed/NCBI
|
|
34
|
Mathur RK, Awasthi A, Wadhone P,
Ramanamurthy B and Saha B: Reciprocal CD40 signals through p38MAPK
and ERK-1/2 induce counteracting immune responses. Nat Med.
10:540–544. 2004. View
Article : Google Scholar : PubMed/NCBI
|
|
35
|
Becker C, Fantini MC, Wirtz S, et al: IL-6
signaling promotes tumor growth in colorectal cancer. Cell Cycle.
4:217–220. 2005. View Article : Google Scholar : PubMed/NCBI
|
|
36
|
Ardestani S, Li B, Deskins DL, Wu H,
Massion PP and Young PP: Membrane versus soluble isoforms of TNF-α
exert opposing effects on tumor growth and survival of
tumor-associated myeloid cells. Cancer Res. 73:3938–3950.
2013.PubMed/NCBI
|
|
37
|
Ferroni P, Riondino S, Portarena I, et al:
Association between increased tumor necrosis factor alpha levels
and acquired activated protein C resistance in patients with
metastatic colorectal cancer. Int J Colorectal Dis. 27:1561–1567.
2012. View Article : Google Scholar
|
|
38
|
Kawai K, Kitayama J, Tsuno NH, Sunami E
and Watanabe T: Thrombocytosis before pre-operative
chemoradiotherapy predicts poor response and shorter local
recurrence-free survival in rectal cancer. Int J Colorectal Dis.
28:527–535. 2013. View Article : Google Scholar
|