Introduction
Osteosarcoma is the most common type of primary bone
cancer in humans (1). The standard
therapy regimen for high-grade osteosarcoma includes induction by
neoadjuvant chemotherapy followed by surgical resection (mostly
limb-sparing or rarely amputation), radiotherapy and adjuvant
chemotherapy (2). Most of these
neoplasms show a high-grade histopathology with the lung being the
most common distant metastatic site (3). Invasion and metastasis are complex
processes that involve cell-cell detachment, migration,
extravasation, proliferation and angiogenesis. When distant
metastases develop, the prognosis is poor. Proteins such as
vascular endothelial growth factor (VEGF), stem cell factor
receptor (c-kit) and platelet-derived growth factor (PDGF) have
been found to be involved in osteosarcoma progression and
metastasis formation (4–6). The serum concentration of VEGF was
found to be significantly correlated with the survival time of
humans with osteosarcoma (7). As a
consequence of these observations, tyrosine kinase inhibitors were
developed as potential anticancer drugs (8). Sorafenib (BAY 43-9906,
Nexavar®, Bayer-Onyx), an oral small-molecule
multikinase inhibitor, was developed by high-throughput screening
of massive libraries of synthetic compounds primarily as a RAF
(ras-activated factor) inhibitor blocking the RAF/MEK/ERK1/2
pathway. However, sorafenib was also shown to ‘hit’ several other
targets such as vascular endothelial growth factor receptors
(VEGFR-2 and 3), platelet derived growth factor receptor (PDGFR-β),
c-kit receptor and fms-like tyrosine kinase 3 (flt-3) (9) and to modulate the innate and adaptive
immune responses (10). For
example, sorafenib inhibits JAK/STAT signaling by stimulating
phosphatase SHP2 activity resulting in accelerated STAT3
dephosphorylation (11). Sorafenib
antitumor therapy has been shown to involve an miRNA-based
mechanism (12). Sorafenib can also
alter the expression of proteins involved in metastasis such as the
c-Fos proto-oncogene coded by the FOS gene (13), and combination therapy with an
inhibitor of the chemokine receptor CXCR4 was found to result in
enhanced antileukemic activity in vitro (14). In human osteosarcoma, sorafenib
treatment blocks growth, angiogenesis and metastatic potential.
Moreover, it dramatically reduced the tumor volume of osteosarcoma
xenografts and lung metastasis in SCID mice (15). An antiproliferative effect of
sorafenib in an osteosarcoma tumor cell line was shown to be due to
the induction of apoptosis in a dose-dependent range (15,16).
Here, we used DNA microarray expression analysis to
study the effect of the multikinase inhibitor sorafenib on human
osteosarcoma cells. Two key issues, identification of candidate
targets of the antiproliferative and metastasis-inhibiting effect,
and identification of putative therapeutic ‘side-effects’ using
pathway enrichment analysis were addressed in the transcriptome
profiling analysis. Three genes exhibiting altered RNA expression
on the microarray and known to be highly involved in cancer
progression were selected for qPCR validation and for protein
expression analysis using western blotting and
immunohistochemistry.
Materials and methods
Cell culture and treatment
Human osteosarcoma cells (ATCC CRL-1543™) were
cultured in Dulbecco’s modified Eagle’s medium (Sigma Chemicals,
Vienna, Austria) supplemented with 10% fetal calf serum, 1%
penicillin/streptomycin, 1% L-glutamine and 0.25% Fungizone (Gibco,
Paisley, UK). The cells were maintained in a humidified 5%
CO2 atmosphere at 37°C. For the sorafenib treatment,
experimental cells were passaged and seeded into 25-cm2
flasks. After 24 h, the medium was removed and replaced with
culture medium containing 4 μM sorafenib (Bayer, Vienna, Austria),
dissolved in distilled water. For the experiment, the cells were
incubated for 72 h with the sorafenib solution. Control cells were
incubated with culture medium alone. The experiment was performed
three times. After the incubation period, cells were washed in PBS
and scratched from the culture flasks with a plastic cell scraper,
pelleted and washed again in PBS. Further treatment was dependent
on the use of the cells (RNA, protein) and is described in the
respective section of Materials and methods.
DNA microarray analysis
Pelleted human osteosarcoma cells were washed twice
in PBS and RNA was extracted using the RNeasy Plus Mini kit
(Qiagen, Hilden, Germany) according to the manufacturer’s protocol.
Integrity of the RNA samples was controlled by capillary
electrophoresis on the Agilent 2100 Bioanalyzer using the RNA 6000
Nano kit (Agilent Technologies, Foster City, CA, USA). Samples with
an RNA integrity number (RIN) value of ≥9 were used for expression
profiling. Human Genome Survey Arrays v2.0 (Applied Biosystems,
Foster City, CA, USA) were used to determine the transcriptional
profiles of sorafenib-treated and control cells. DIG-UTP-labeled
cRNA was generated and linearly amplified from 2 μg total RNA using
the Applied Biosystems Chemiluminescent RT-IVT Labeling kit v2.0
according to the manufacturer’s protocol. Array hybridization,
chemiluminescence detection, image acquisition and analysis were
performed using Applied Biosystems Chemiluminescence Detection kit
and Applied Biosystems 1700 Chemiluminescence Microarray Analyzer
following the manufacturer’s instructions. Briefly, each microarray
was pre-hybridized in hybridization buffer with blocking reagent at
55°C for 1 h. A total of 18 μg DIG-labeled cRNA targets were
fragmented, mixed with internal control target and hybridized to
the pre-hybridized microarrays in a volume of 1.5 ml at 55°C for 16
h. After hybridization, the arrays were washed with hybridization
wash buffer and chemiluminescence rinse buffer. Enhanced
chemiluminescent signals were generated by incubating arrays with
alkaline phosphatase-conjugated anti-digoxigenin antibody followed
by incubation with chemiluminescence enhancing solution and a final
addition of chemiluminescence substrate. Four images were collected
for each microarray using the 1700 Chemiluminescent Microarray
Analyzer. Images were auto-gridded and the chemiluminescent signals
were quantified, corrected for background and spot and spatially
normalized. Expression values of <10 were set to 10. Data were
normalized to the 50th percentile (intra-array normalisation) and
each gene was normalized to the median expression (inter-array
normalisation). Data were pre-filtered based on the signal to noise
ratio of >3-fold determined for all samples of the respective
biological replicate group. Genes exhibiting normalized expression
levels between 0.667- and 1.334-fold in at least four biological
replicates (containing at least two replicates per group) were
considered invariant and were removed from the deregulated gene
list. The remaining data set was tested for differentially
expressed genes using analysis of variance (ANOVA; GeneSpring
Expression Analysis 7.3.1 tool; Agilent Technologies). Only
significantly deregulated genes (P<0.05 in the parametric Welch
t-test) were considered.
Gene set enrichment analysis
Significantly deregulated genes (n=522) were
annotated to gene symbols of NCBI using the Database for
Annotation, Visualization and Integrated Discovery (DAVID) v6.7
(17) and GeneMANIA (The GeneMANIA
prediction server: Biological Network Integration for Gene
Prioritisation and Predicting Gene Function) (18). The gene symbols were further
converted to Entrez Gene of NCBI and Ensembl Gene identities
employing the web-based conversion tool Clone/Gene ID Converter
(19). Gene set enrichment analysis
was performed by submitting all three identities in parallel to the
pathway analytical applications DAVID and WEB-based Gene SeT
AnaLysis Toolkit v2 (WebGestalt) (20) targeting the databases KEGG, Pathway
Commons and WikiPathways. Cross-hybridising probes were excluded
from the analysis. Genes that were not accepted by the latter
databases were indirectly assigned to a pathway using functional
association data of related genes with known gene ontology term
assignations contained in GeneMANIA. These association data include
protein and genetic interactions, pathways, co-expression,
co-localisation and protein domain similarity.
Transcript quantification by qPCR
Exon boundaries and intron sizes of target and
reference genes were determined using the mRNA-to-genomic alignment
program Spidey of NCBI. Exons separated by an intron of >750 bp
were targeted to design intron-flanking primers with Primer Express
version 2.0 (Applied Biosystems). Amplicons were tested for
secondary structure using the Mfold Web Server for Nucleic Acid
folding and hybridization prediction (21) using 50 mM Na+, 2 mM
Mg2+ and a temperature of 60°C as changes from default
settings. The potential for primer dimerisation was assessed on the
basis of the Gibbs free energy ΔG value calculated by the open
source program NetPrimer (NetPrimer Biosoft International, Palo
Alto, CA, USA). Primer/amplicon specificity was assessed by NCBI
Primer-BLAST. Primer details are listed in Table I. Pellets of osteosarcoma cells were
shock frozen and stored in liquid nitrogen until RNA isolation.
Frozen cell pellets were lysed in a monophasic solution of phenol
and guanidine thiocyanate (QIAzol lysis reagent; Qiagen) at 37°C
for 30 min applying continuous vortexing. Automated RNA
purification was performed on the QIAcube using the miRNeasy Mini
kit (Qiagen) followed by digestion with TURBO™ DNase (Life
Technologies, Vienna, Austria) to remove contaminating DNA. RNA
concentration was measured by UV spectrophotometry on the Hellma
TrayCell (Hellma, Müllheim/Baden, Germany) in combination with the
BioPhotometer 6131 (Eppendorf, Hamburg, Germany). Only samples with
a RIN value of >7 were used for qPCR quantification.
 | Table IOligonucleotides for qPCR. |
Table I
Oligonucleotides for qPCR.
| Gene | GenBank
identity | Oligonucleotide
sequence (5′ to 3′) |
|---|
| Genes of
interest |
| CXCR4,
transcript variant 1a | NM_001008540.1 | F:
GCAGAGGAGTTAGCCAAGATGT
R: CCCATCTTTTCCCATAGTGACTT
P: FAM-TTGAAACCCTCAGCGTCTCAGTGCC-BHQ1 |
| CXCR4,
transcript variant 2 | NM_003467.2 | F:
CAGCAGGTAGCAAAGTGACGC
R: CCCATTTCCTGGTGTAGTTATCT
P: FAM-CCTGAGTGCTCCAGTAGCCACCGC-BHQ1 |
| FOS | NM_005252.3 | F:
TGGCGTTGTGAAGACCATGAC
R: TATTCCTTTCCCTTCGGATTCTCCT
P: not applied |
| S100A4,
transcript variant 2 | NM_019554.2 | F:
TCAAGCTCAACAAGTCAGAACTAAAGG
R: GAAGTCCACCTCGTTGTCCC
P: not applied |
| Reference
genes |
| OAZ1 | NM_004152.2 | F:
GCACCATGCCGCTCCTAAG
R: CATCAGGAGCACCACCGAG
P: not applied |
|
RPL41b | NM_001035267.1,
NM_021104.1 | F:
AGAAAGATGAGGCAGAGGTCCA
R: AATAGTCCAGAATGTCACAGGTCCA
P: not applied |
cDNA primed with random RT primers was synthesized
for 120 min at 37°C using the High-Capacity reverse transcription
kit (Applied Biosystems). For each cDNA duplicate 1000 ng RNA was
reverse transcribed in a reaction volume of 20 μl. The 20 μl-qPCR
consisted of 80 mM Tris-HCl (pH 9.4), 20 mM
(NH4)2SO4, 0.02% w/v Tween-20, 3
mM MgCl2, 0.2 mM dNTPs, 200 nM of each primer, 0.4X
EvaGreen DNA-binding dye (Biotium, Inc., Hayward, CA, USA), 1 unit
of Hot FIREPol Taq DNA polymerase (Solis BioDyne, Tartu,
Estonia) and 2 μl of a 1:10 dilution of the cDNA. The qPCR was
conducted on the ABI PRISM 7900HT sequence detection system
(Applied Biosystems) using a thermal protocol which consisted of an
initial enzyme activation/denaturation step of 95°C for 15 min
followed by 45 amplification cycles (95°C for 15 sec, 59°C for 40
sec, 72°C for 20 sec) and melting curve analysis between 65 and
95°C. Amplicon specificity was evaluated based on the melting peak,
i.e. the maximum in the negative derivative of the fluorescence to
temperature (−dF/dT). Serial 8-fold dilutions of an
equimolar pool of sample cDNAs amplified in duplicate were used to
generate a standard curve. Reaction efficiencies (E) were
calculated from the slope(s) of the standard curve using the
formula E = 10−1/s − 1. Specificity of a qPCR signal was
concluded on the basis of a minus-RT control using a systematic
error threshold of 1%. Calculation of gene expression ratios and
evaluation of their statistical significance were performed with
the relative expression software tool (REST) using the Pair Wise
Fixed Reallocation Randomisation Test for statistical evaluation
(22). Target gene expression was
normalized with the reference genes OAZ1 (23,24)
and RPL41 or with OAZ1 alone (for transcript variants
1 and 2 of CXCR4). The geometric mean of both reference
genes was used in case of FOS und S100A4. RT-qPCR
data comply with the Minimum Information for Publication of
Quantitative Real-Time PCR Experiments (MIQE) guidelines (25).
Western blotting
Cell pellets were lysed in low salt extraction
buffer (10 mM Tris pH 7.5, 140 mM NaCl, 5 mM EDTA, 1 mM PMSF, 1 mM
DTT) and protein concentration was determined (20 μg protein)
according to the methods of Bradford (26). Appropriate amounts of samples were
subjected to SDS-gel electrophoresis under reducing conditions on
140×140×1.5 mm gradient gels in a Hoefer SE-600 electrophoresis
unit (Hoefer Scientific Instruments, San Francisco, CA, USA)
according to Laemmli (27). After
separation, protein bands were transferred onto appropriate
membranes (nitrocellulose or PVDF; both from GE Healthcare Life
Sciences, Munich, Germany) by semi-dry blotting in a Semi-Phor unit
(Hoefer Scientific Instruments). Membranes were blocked for 2–4 h
with 5% non-fat dry milk (Merck, Darmstadt, Germany) in TBS + 0.05%
Tween-20, and further incubated in diluted antibodies anti-S100A4
(Dako, Glostrup, Denmark), anti-c-Fos (Synaptic Systems GmbH,
Göttingen, Germany) and anti-CXCR4 (Abcam, Cambridge, UK or Santa
Cruz Biotechnology, Santa Cruz, CA, USA) in 1–5% milk overnight at
4–6°C followed by HRP-conjugate anti-rabbit IgG (0.1 μl
Ab/cm2; Sigma) for 2 h at room temperature. ECL or ECL
Prime (both from GE Healthcare Life Sciences) was used to detect
immunoreactive bands. Film was scanned on a Sharp JX-330 flatbed
scanner and evaluated with the software Quantity One version 2.7
(PDI Inc., Huntington Station, NY, USA). The overall protein
staining [fluorophore ruthenium(II)tris(bathophenanthroline
disulfonate)] pattern was used as a loading control and for
normalization. Human breast cancer cells (MDA-MB-231 and MCF-7)
were used as positive control for the CXCR experiments. Molecular
weight of proteins was predicted using the UniProtKB database
(http://www.uniprot.org/uniprot/).
Immunohistochemistry
Human osteosarcoma cells were cultured on sterile
glass coverslips and treated with sorafenib as described above.
After the treatment, cells were washed in PBS and fixed in 4%
buffered formaldehyde for 15 min, washed in distilled water and air
dried. For immunostaining, cells on coverslips were permeabilized
with 0.2% Triton X-100 in PBS, rehydrated and endogenous
peroxidases were eliminated by incubation in 0.06%
H2O2 for 15 min. After blocking with 1.5%
goat serum for 30 min, cells were incubated with primary polyclonal
antibodies anti-S100A4 (dilution 1:100 in PBS; Thermo Fisher
Scientific), anti-CXCR4 [dilution 1:100; Abcam (ab2090), Cambridge,
UK] and c-Fos (dilution 1:300; Synaptic Systems GmbH) for 2 h at
room temperature. For CXCR4-immunostaining antigen-retrieval by 2×
5-min heating in Tris-EDTA buffer pH 9.0, and for S100A4 and c-Fos
boiling of the sections for 4× 5 min in citrate buffer (0.1 M) pH
6.0 was necessary. As secondary antibody an anti-rabbit poly-HRP
antibody (BrightVision, Immunologic, Duiven, The Netherlands) was
used. The signal was developed with DAB (Sigma) as a chromogen.
Negative controls were incubated with PBS instead of the primary
antibody while all the other steps were performed identically.
Results
DNA microarray analysis of RNA
expression
The effect of the multikinase inhibitor sorafenib on
a human osteosarcoma cell line was evaluated by DNA microarray
analysis using three biological-technical replicates. In total,
1,847 genes were found to be differentially expressed between the
sorafenib-treated cells and control cells at a significance level
of P<0.05. At the threshold of >2-fold expression alteration,
297 and 232 genes were upregulated or downregulated by the
treatment, respectively (data not shown). Two hundred and
thirty-nine genes for which information on pathway/network
assignation was available were analysed for gene set enrichment
with the pathway analytical applications DAVID v6.7 and WebGestalt
v2. The network termed pathways in cancer delivered the highest
statistical support (Table II).
Two hundred and ninety genes for which a pathway could not be
assigned were analysed for enrichment using GeneMANIA. This
database identifies other genes that are related to a set of input
genes, using functional association data. GeneMANIA-based gene set
enrichment analysis identified the extracellular matrix network as
most affected (Table III).
| Table IIGene set enrichment analysis for
genes showing altered RNA expression after sorafenib treatment and
having a Gene Ontology term assignation. |
Table II
Gene set enrichment analysis for
genes showing altered RNA expression after sorafenib treatment and
having a Gene Ontology term assignation.
| Enriched
pathway/network | P-value | Pathway
database | Pathway analytical
application used |
|---|
| Pathways in
cancer | 3.98E-09 | KEGG | (20) |
| Proteogylcan
syndecan-mediated signaling events | 1.99E-08 | Pathway
Commons | (20) |
| ABC
transporters | 6.00E-07 | KEGG | (17) |
| Syndecan-4-mediated
signaling events | 1.04E-06 | Pathway
Commons | (20) |
| Complement and
coagulation cascades | 2.40E-06 | KEGG | (17) |
| Systemic lupus
erythematosus | 7.20E-06 | KEGG | (17) |
| Cytokine-cytokine
receptor interaction | 1.27E-05 | KEGG | (20) |
| MAPK signaling
pathway | 1.36E-05 | KEGG | (20) |
| Chemokine signaling
pathway | 4.90E-05 | KEGG | (17) |
| BMP receptor
signaling | 2.00E-04 | Pathway
Commons | (20) |
| Small cell lung
cancer | 2.00E-04 | KEGG | (20) |
| GnRH signaling
pathway | 5.40E-04 | KEGG | (17) |
| HIF-1-α
transcription factor network | 5.00E-04 | Pathway
Commons | (20) |
| Oocyte meiosis | 7.50E-04 | KEGG | (17) |
| Hypoxic and oxygen
homeostasis regulation of HIF-1-α | 1.90E-03 | Pathway
Commons | (20) |
| Myometrial
relaxation and contraction pathways | 2.30E-03 | WikiPathways | (20) |
| Wnt signaling
pathway | 2.50E-03 | KEGG | (20) |
| Leukocyte
transendothelial migration | 2.80E-03 | KEGG | (20) |
| TNF receptor
signaling pathway | 3.00E-03 | Pathway
Commons | (20) |
| Melanogenesis | 3.10E-03 | KEGG | (20) |
| Estrogen
signalling | 3.50E-03 | WikiPathways | (20) |
| NOD-like receptor
signaling pathway | 3.80E-03 | KEGG | (20) |
| Glypican
pathway | 4.00E-03 | Pathway
Commons | (20) |
| Extrinsic pathway
for apoptosis | 5.80E-03 | Pathway
Commons | (20) |
| Death receptor
signalling | 5.80E-03 | Pathway
Commons | (20) |
| Long-term
potentiation | 6.00E-03 | KEGG | (17) |
| Bladder cancer | 6.20E-03 | KEGG | (20) |
| Glypican 1
network | 6.40E-03 | Pathway
Commons | (20) |
| Focal adhesion | 6.50E-03 | WikiPathways | (20) |
| Cell adhesion
molecules (CAMs) | 6.90E-03 | KEGG | (20) |
|
Progesterone-mediated oocyte
maturation | 9.40E-03 | KEGG | (17) |
| Table IIIGeneMANIA-based gene set enrichment
analysis for genes showing altered RNA expression following
sorafenib treatment and not having a pathway assignation. |
Table III
GeneMANIA-based gene set enrichment
analysis for genes showing altered RNA expression following
sorafenib treatment and not having a pathway assignation.
| Gene Ontology
annotation | False discovery
rate | Coveragea |
|---|
| Extracellular
matrix | 2.77E-07 | 19/180 |
| Fibrillar
collagen | 3.62E-05 | 6/11 |
| Collagen | 9.25E-04 | 7/29 |
| Collagen fibril
organization | 1.88E-03 | 6/21 |
| Cellular response
to type I interferon | 2.49E-03 | 9/71 |
| Skin
development | 5.45E-03 | 5/16 |
| Proteinaceous
extracellular matrix | 5.45E-03 | 10/105 |
| Extracellular
matrix part | 5.45E-03 | 8/61 |
Three downregulated genes which are involved in
cancer progression and/or metastasis (FOS, S100A4 and
CXCR4) were selected for subsequent validation of RNA
expression by RT-qPCR. The v-Fos FBJ (Finkel Biskis-Jinkis) murine
osteosarcoma viral oncogene homolog (FOS) gene (0.1-fold
change) was selected due to the highest significance of
downregulation. The chemokine (C-X-C motif) receptor 4
(CXCR4) gene, and the S100 calcium binding protein A4
(S100A4) gene meeting the threshold of expression alteration
of >2-fold (0.35- and 0.49-fold downregulation, respectively)
were also included. The latter represented other downregulated
members of the S100 protein family (S100A3, S100A2,
S100A16 and S100A13; expression changes of 0.28- to
0.49-fold).
Validation of RNA expression using
qPCR
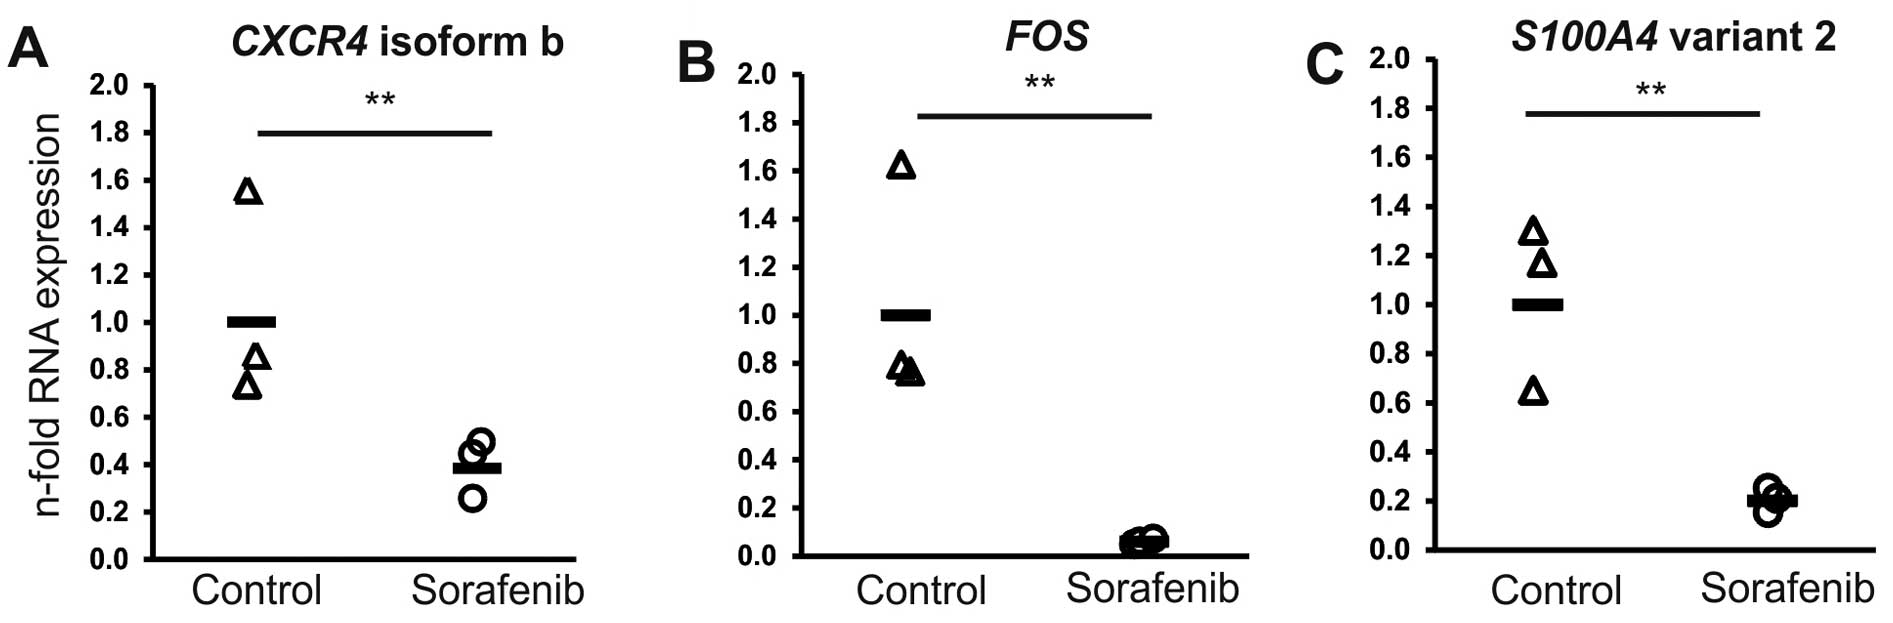
qPCR was used to verify the sorafenib-induced
expression changes measured by microarray analysis for the chosen
genes of interest. For all three genes (FOS, S100A4
and CXCR4) selected, alteration of expression and its
direction were confirmed (Fig. 1).
In detail, for FOS, S100A4 (transcript variant 2) and
CXCR4 (transcript variant 2; variant 1 not expressed; data
not shown) a reduction in expression of 0.06-, 0.23- and 0.36-fold
was determined, respectively.
Protein expression analysis
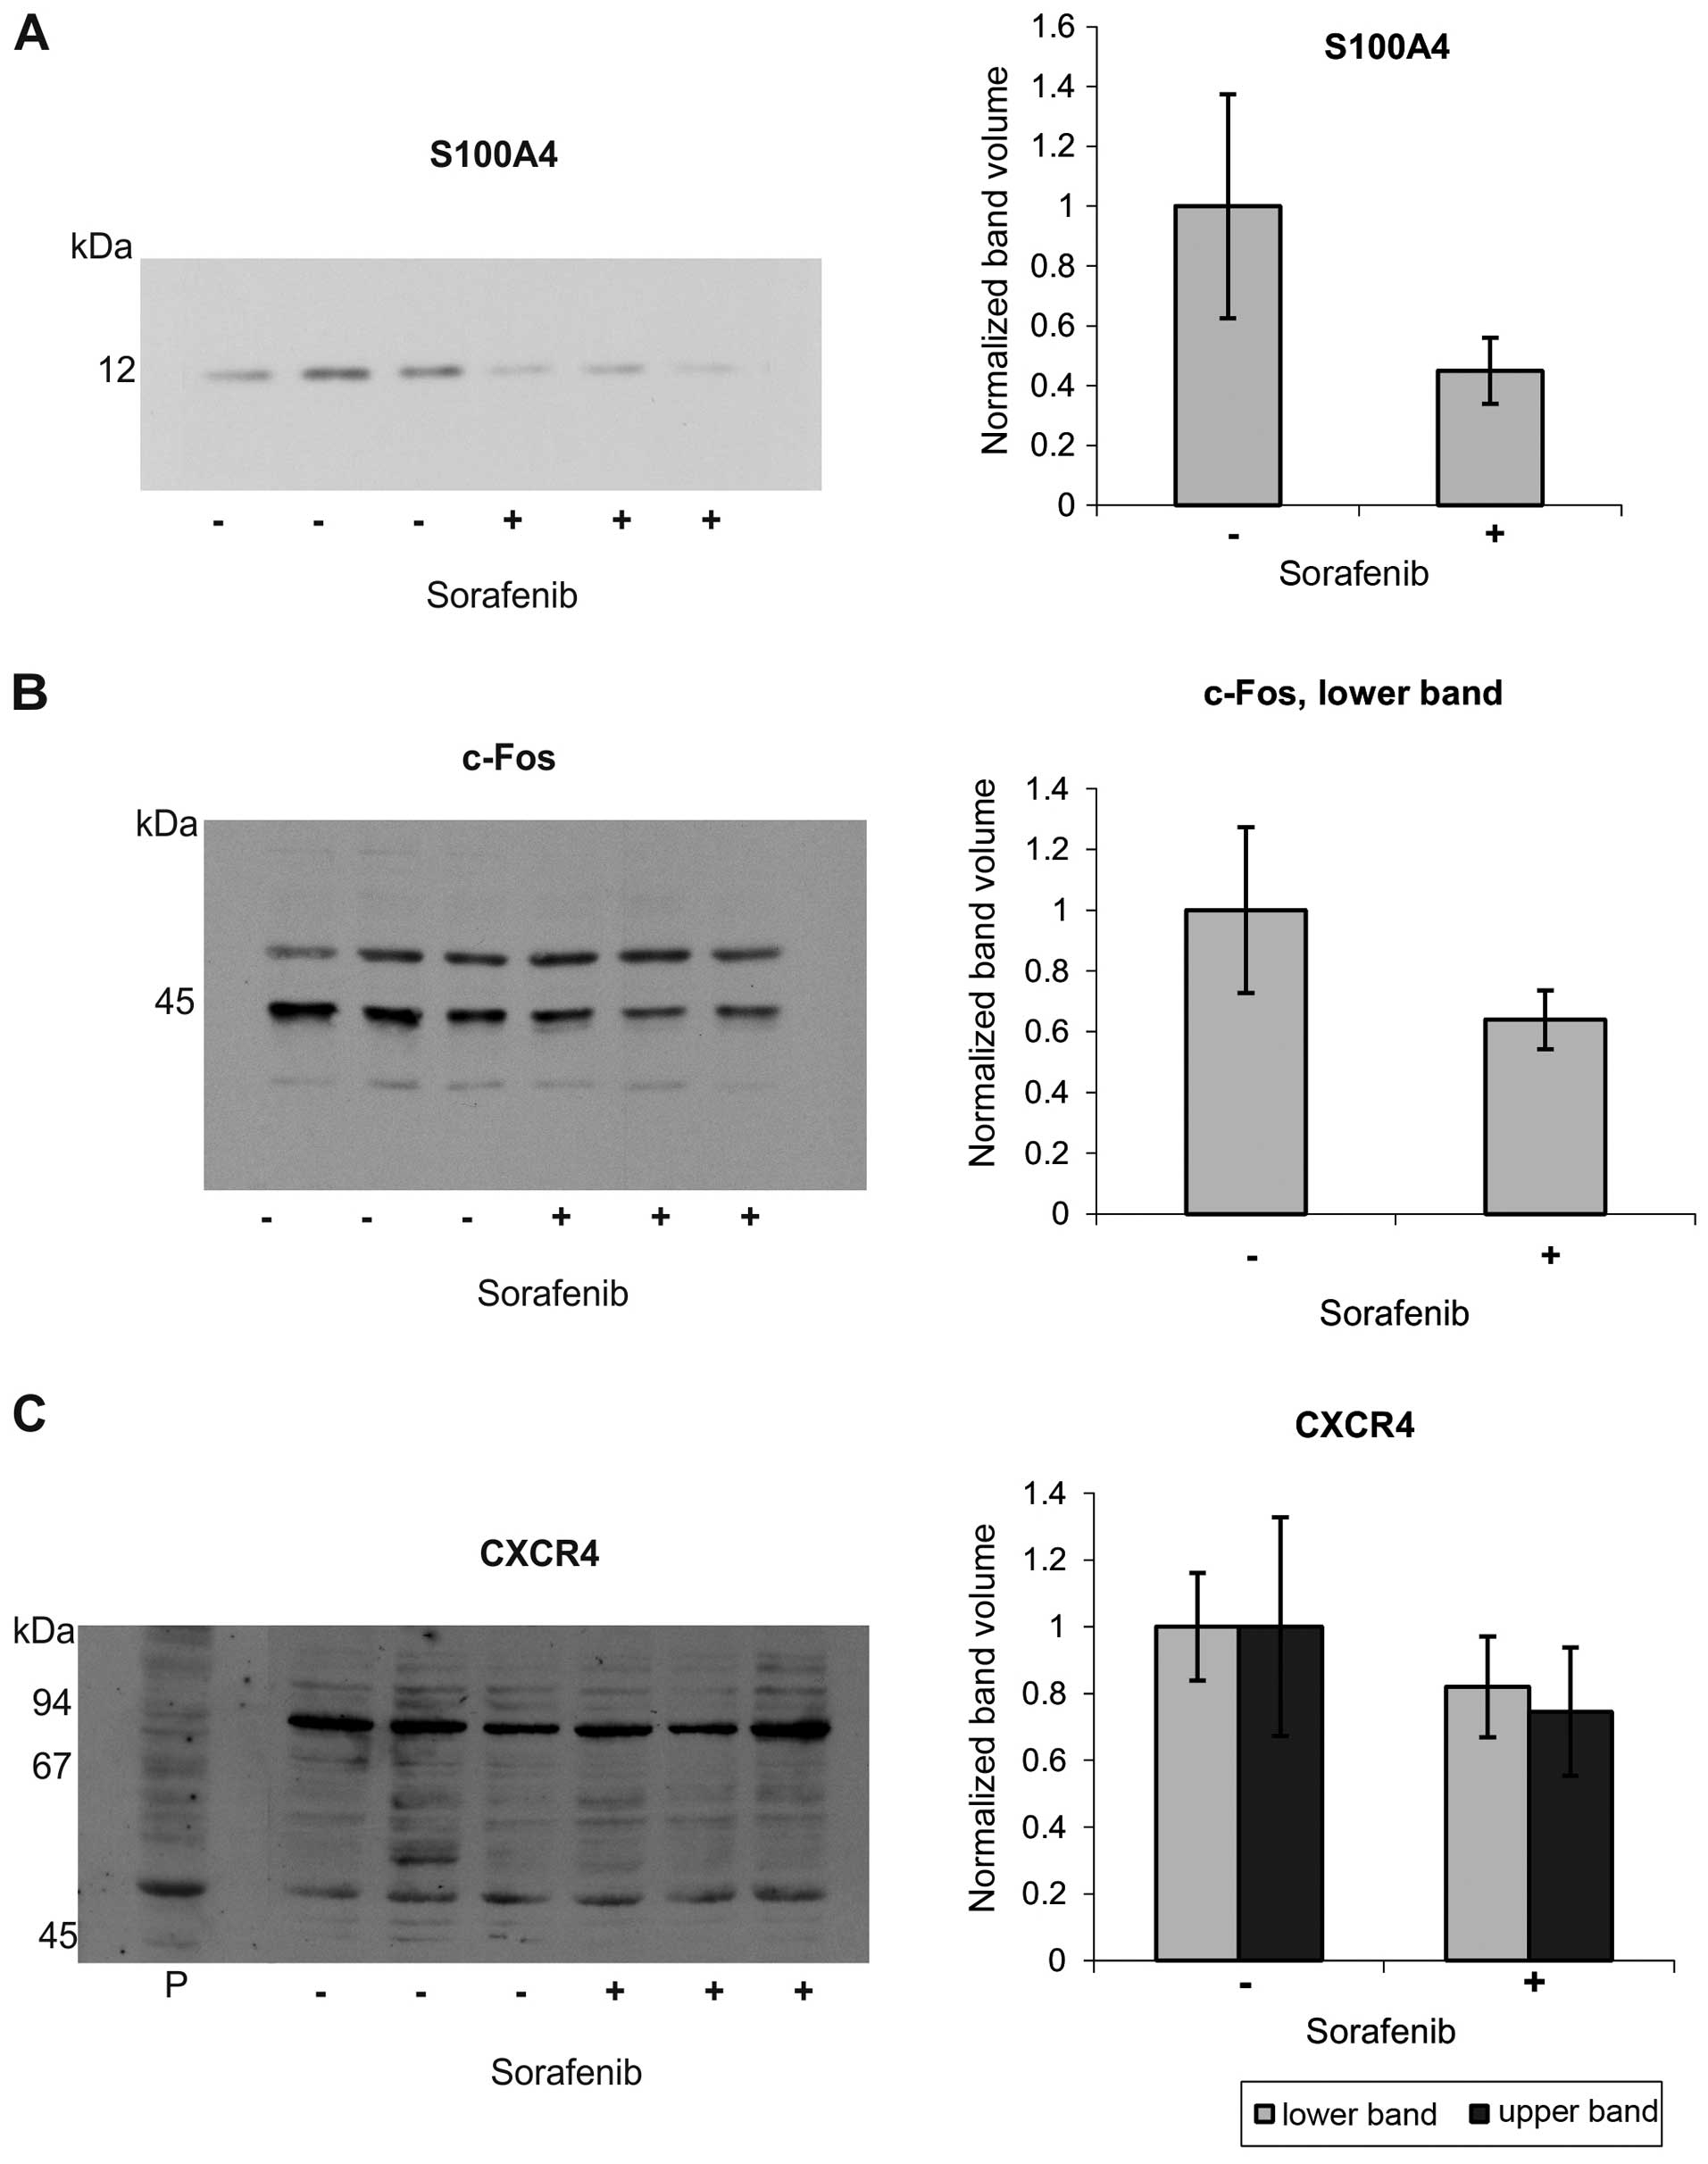
To elucidate protein expression changes of c-Fos,
S100A4 and CXCR4 induced by sorafenib, we applied western blotting
and immunohistochemical methods. We found a marked reduction in the
S100A4 band in the western blots in human osteosarcoma cells after
sorafenib treatment (Fig. 2A). The
antibody against c-Fos protein gave two prominent bands at ~43 and
50 kDa. Whereas the upper band was almost unaffected, the lower one
showed a moderate reduction in human osteosarcoma cells after
sorafenib treatment (Fig. 2B).
CXCR4 proved to be difficult to detect with the commercially
available antibodies tested. The antibody reactivities were low,
needing higher signal amplification (ECL Prime), and resulted in
multiple bands with a marked background staining for the Abcam
antibody. Based on the positive control, the band at 50 kDa was
assumed to correspond to monomeric CXCR4. This band was slightly
reduced in intensity after sorafenib treatment (Fig. 2C). The antibody from Santa Cruz
Biotechnology showed even higher background staining and only faint
bands, already in controls, and was, therefore, excluded (data not
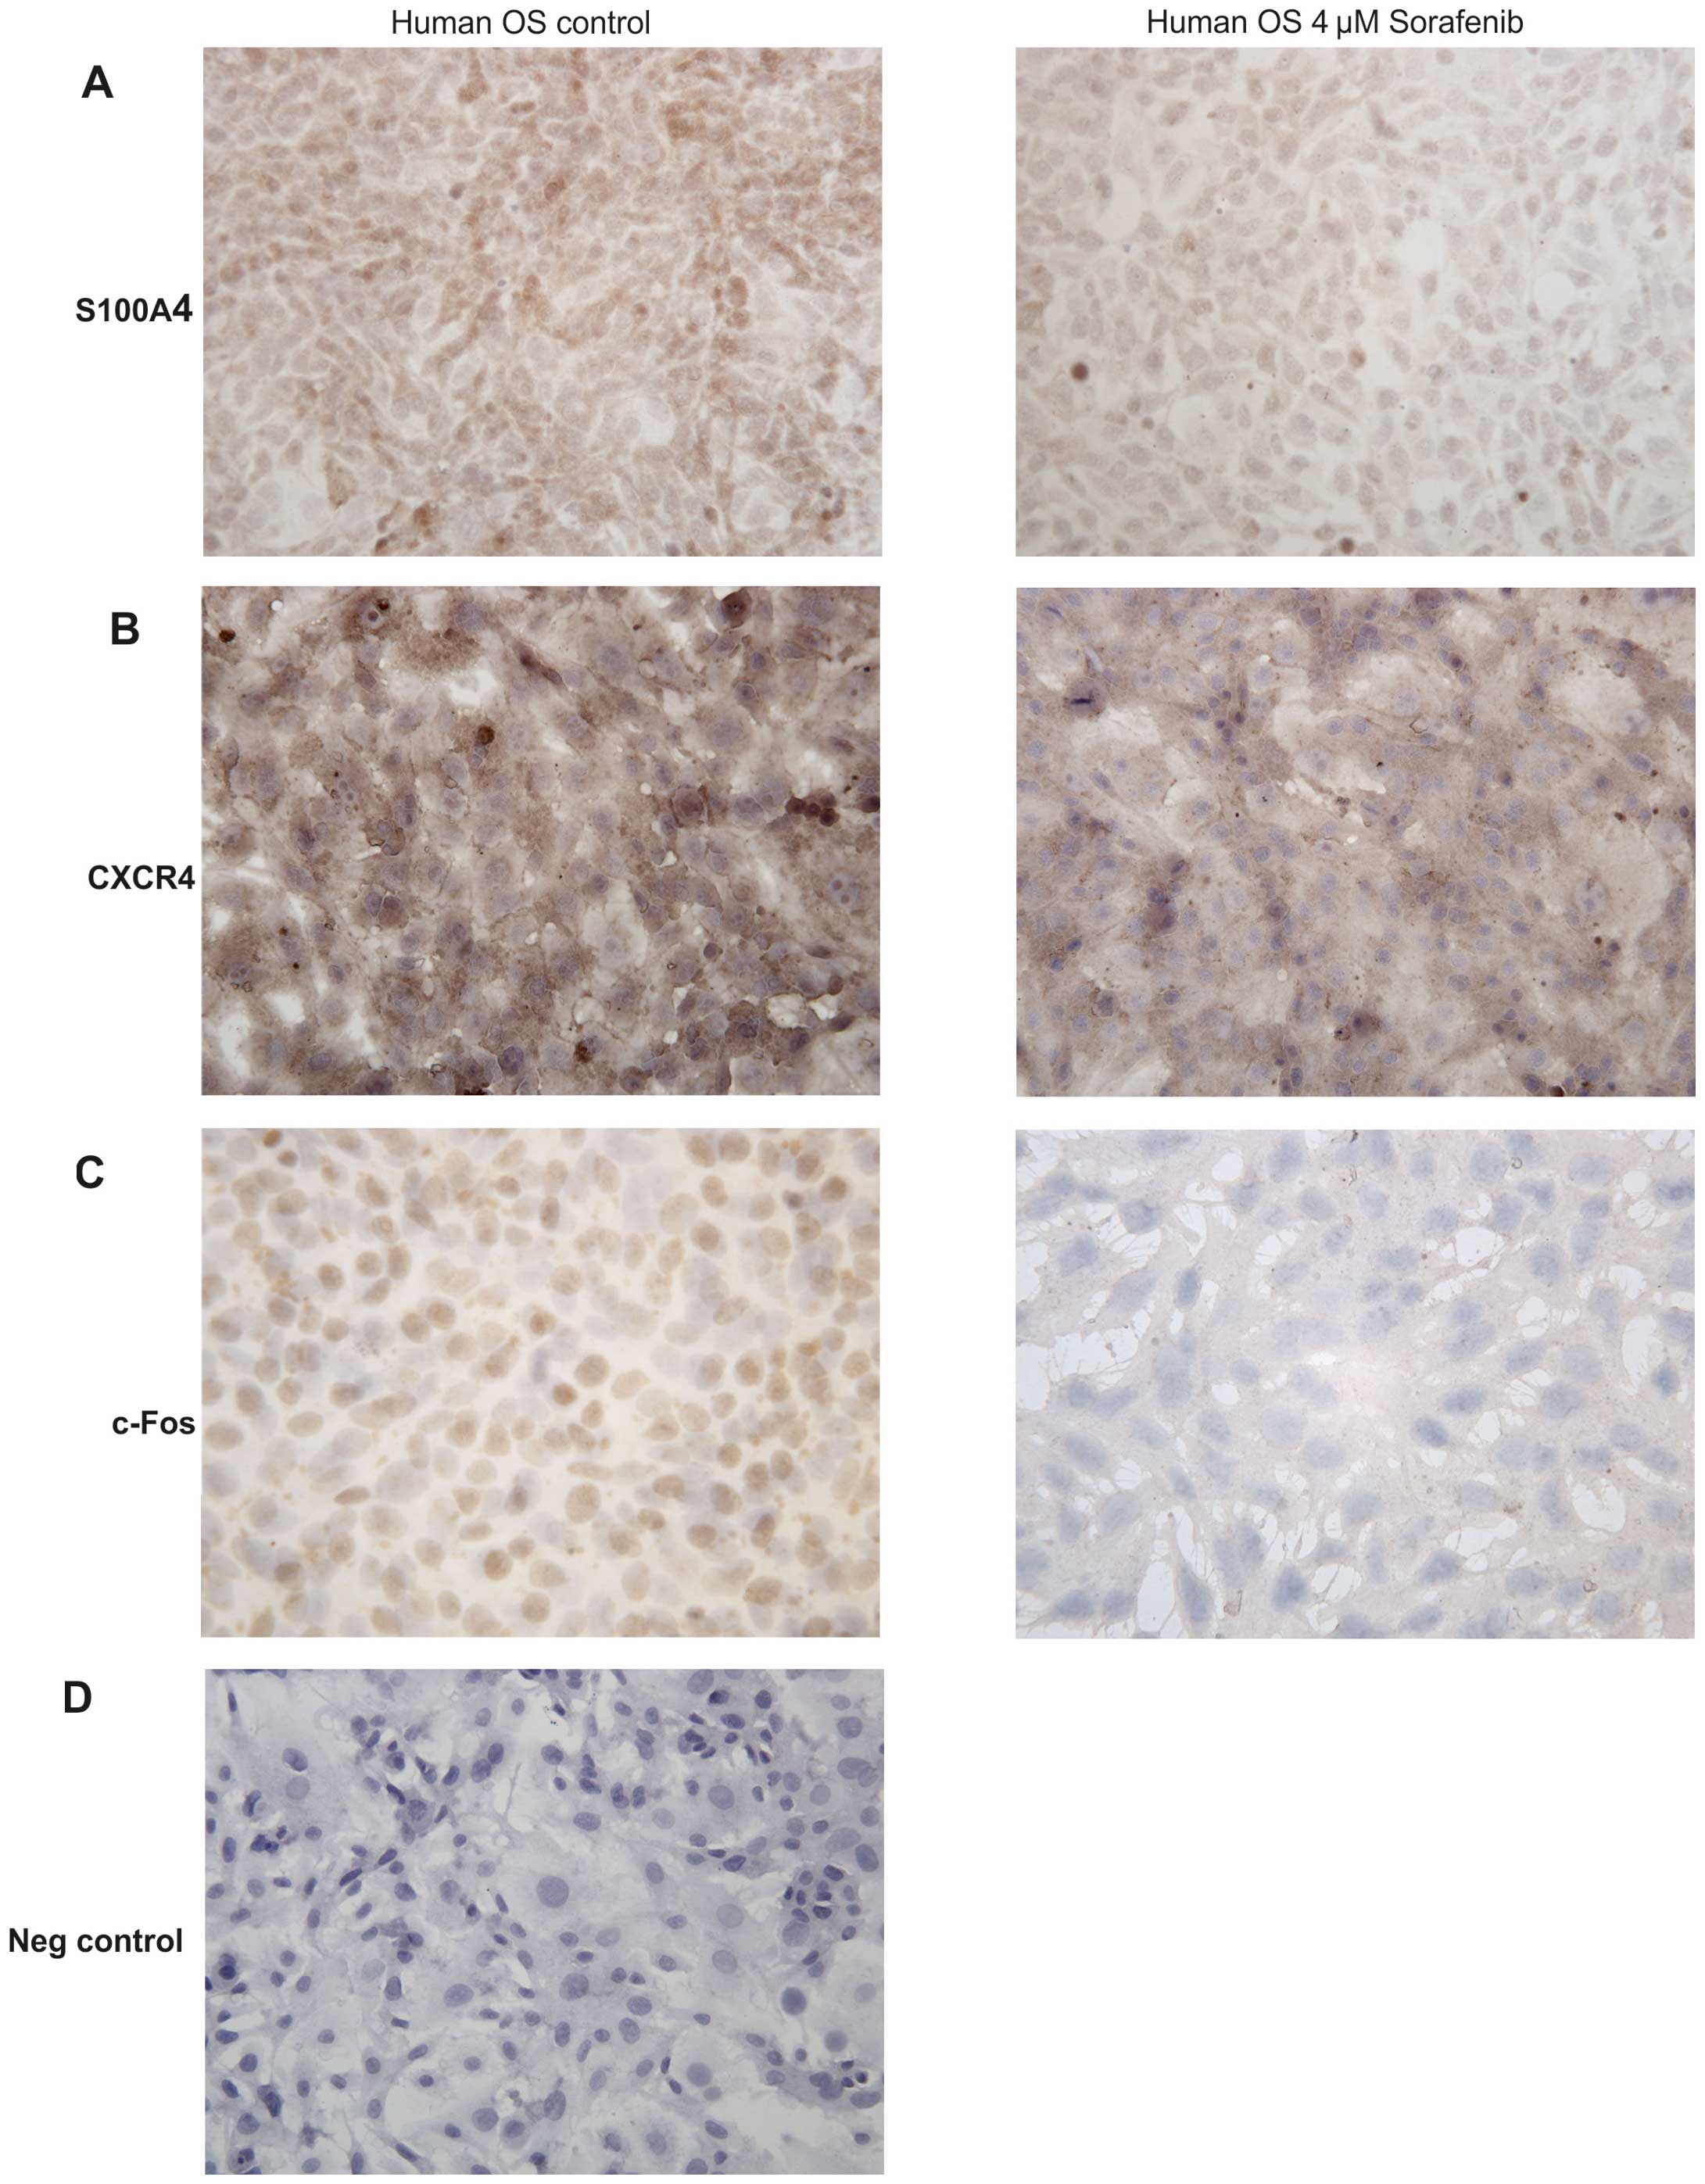
shown). In parallel, immunohistochemical staining for S100A4
(Fig. 3A) and c-Fos (Fig. 3C) revealed a considerably reduced
staining intensity between untreated and treated human osteosarcoma
cells supporting the western blot data. Whereas the S100A4 protein
was found in the cytoplasm of human osteosarcoma cells, c-Fos was
restricted to the nucleus. CXCR4 immunostaining was predominantly
noted in the cell membranes and the cytoplasm (Fig. 3B).
Discussion
Using DNA microarray expression analysis we showed
that sorafenib affects the transcription profile of a series of
genes in the human osteosarcoma cell line CRL-1543. From the set of
downregulated genes, S100A4, FOS and CXCR4,
playing a major role in tumor progression and metastasis were
studied in detail.
S100A4 expression
S100A4, alternatively termed metastasin, represents
a member of the family of calcium-binding proteins. S100A4 is a
calcium-binding protein and is localized in the nucleus, cytoplasm
and extracellular space and possesses a wide range of biological
functions such as regulation of angiogenesis, cell survival,
motility and invasion (28). S100A4
has no enzymatic activity and exerts its function mainly through
interaction with other proteins. It has been shown to interact with
a number of cytoskeleton-associated proteins including non-muscle
myosin, actin, non-muscle tropomyosin and tubulin. S100A4 was the
first protein of the S100 protein family shown to promote lung
metastases in a model system of breast cancer (29). S100A4 is a well-established marker
of metastatic disease, but the exact mechanisms responsible for the
metastasis-promoting effects of this calcium-binding protein are
less well defined (28). The basic
approach to cancer therapy is through the inhibition of cell
proliferation and disruption of the cell division machinery. S100A4
is capable of regulating cell cycle progression and influencing
cytoskeletal dynamics and remodelling of the extracellular matrix
and in this way affects invasion and metastasis (30). Inhibition of S100A4 results in a
decrease in cell growth (31), a
known effect of sorafenib on tumor cells in vitro (16). S100A4 influences angiogenesis and
vascular density (32). This is an
important finding since a strategy is being developed to employ
tyrosine kinase inhibitors specifically to target the process of
angiogenesis. Moreover, S100A4 downregulates the expression of the
angiogenesis-inhibitor thrombospondin (33). VEGF, a well-known factor of
angiogenesis stimulation, is a downstream target of S100A4
(30). S100A4 plays a key role in
the metastatic behavior of tumor cells; therefore, it is a
promising molecular target for cancer therapy (30). S100A4 expression was found to
occur in parallel with cancer metastasis (30), was the most significant predictor of
patient survival in a breast cancer study (34), and has a high prognostic
significance in several other tumors (35,36).
Highly malignant breast cancer cells were not able to metastasize
in an S100A4 knock-out mouse model (37). S100A4 is secreted by normal and
neoplastic cells in vitro and in vivo (28). It regulates
matrix-metalloproteinase-2 (MMP-2) activity in human osteosarcoma
cells (38) and acts as a potent
stimulator of angiogenesis (32).
Inhibition of S100A4 expression by RNA interference was found to
completely prevent metastasis formation in a mouse thyroid
carcinoma model (31) and reduced
invasiveness and proliferation of the human osteosarcoma cell line
MG-63 (39). S100A4 was found to be
expressed in >70% of clinical osteosarcoma samples and in the
osteosarcoma cell lines MG-63 and U-2OS, but not in benign
osteochondroma (39) supporting the
significance of S100A4 as a marker of malignancy.
Here, S100A4 was found to be expressed at the
RNA and protein levels. Transcript variant 2 of S100A4 as
detected by RT-qPCR (Fig. 1) has
been previously described (40).
However, the significance of the two S100A4 transcripts with
respect to gene activity in cancer progression remains unclear
(41). In conclusion, as S100A4 is
present in most osteosarcomas (39), we suggest that inhibition of the
S100A4 protein may be a promising approach to reduce the malignant
potential of osteosarcomas in patients.
FOS expression
c-Fos encoded by the FOS gene was initially
identified as an oncoprotein of the Finkel Biskis-Jinkis
osteosarcoma virus (42).
Heterodimers are formed by Fos family members with members of other
protein families such as JUN or ATF (activation transcription
factor) to compose the AP-1 (activator protein) proteins. Reports
on the action of AP-proteins in tumor formation and progression are
contradictory. On the one hand, tumor-suppressor activity of AP-1
transcription factors was found (43), on the other hand, they were
identified to play a major role in gene regulation during cell
invasion, proliferation and malignant transformation. Transgenic
mice overexpressing the c-Fos proto-oncogene develop osteosarcomas
(44). Therefore, a reduction in
FOS expression should lead to a decrease in the metastatic
potential of a tumor and was for this reason chosen as a gene of
interest.
The present study showed a decrease in FOS
mRNA expression in human osteosarcoma cells following sorafenib
treatment (Fig. 1). Evaluation of
protein expression by western blot analysis showed two bands, at
~43 and 50 kDa. The lower one was downregulated by sorafenib
treatment to approximately two-thirds compared to the controls
(Fig. 2) and is in accordance with
the theoretical molecular weight predicted for c-Fos (40.7 kDa;
UniProtKB, http://www.uniprot.org/uniprot/P01100, version 74 from
May 1, 2013). The band with the larger molecular weight could
belong to FosB, another member of the Fos family of nuclear
oncogenes. This family includes the highly homologous proteins
c-Fos, FosB, Fos-related antigen 1 (FRA1) and Fos-related antigen 2
(FRA2) (45). It seems likely that
their high homology is responsible for the cross-reactivity of the
c-Fos antibody used in the present study. Downregulation of c-Fos
by sorafenib is an important finding as Fos is overexpressed in the
majority of human osteosarcomas (45) with high expression levels of c-Fos
(47). Overexpression of c-Fos, a
transcription factor of the activator protein-1 (AP-1) family, is
involved in osteosarcoma formation in mice (44,48).
The AP-1 complex can form many different homodimers and
heterodimers that determine the genes that are regulated (43). c-Fos regulates the expression of
MMPs (49) that play a role in
tumor cell migration and therefore, in the process of metastasis.
AP-1 regulates the genes that are required for tumor metastasis
such as Ezrin, FasL and EGFR. In advanced tumors, c-Fos/AP-1
complexes were shown to induce the expression of genes that are
involved in angiogenesis and tumor invasiveness (43). Blocking c-Fos expression by small
interfering RNA (siRNA) in human colon carcinoma cells was found to
lead to a significant reduction in transforming growth factor β1
(TGFβ1) and as a consequence reduced tumor cell growth (50). Strong FOS expression is also
highly correlated with poor response to chemotherapy (51); therefore, it is an important
therapeutic and prognostic biomarker.
CXCR4 expression
CXCR4 has been reported to play a major role in the
metastatic process in osteosarcomas (52,53).
It was suggested to be a useful prognostic factor and a predictor
of metastatic development in osteosarcoma based on its correlation
with the metastatic behavior of osteosarcoma, and its common
expression in high-grade osteosarcoma samples at a level inversely
correlated to overall survival (53). Moreover, tumors expressing both
CXCR4 and VEGF were found to have worse overall survival rates
compared with the survival of patients with tumors that lacked one
of these factors (54).
Contradictory results were obtained for the role of CXCR4 in human
osteosarcoma in which CXCR4/CXCL12 was correlated with a better
long-term outcome and a lower prevalence of metastases (55). However, in an osteosarcoma mouse
model, inhibition of the CXCR4 site resulted in the elimination of
lung metastases (56), and
antagonists of CXCR4 such as neutralizing antibodies were also
markedly found to reduce metastasis (57,58).
Silencing of CXCR4 mRNA impaired invasion of breast cancer
cells in a Matrigel invasion assay and inhibited breast cancer
metastasis in an animal model (59)
underlining the importance of this factor in tumor malignancy.
These partly contradictory findings might be associated with the
manifold isoforms and variants of CXCR4 that occur.
Two splice variants of CXCR4 have been
described (http://www.uniprot.org/uniprot/P61073), and only one
of these was found to be expressed by qPCR in our model (Fig. 1). The diverging results obtained for
CXCR4 by expression analyses after mRNA and protein levels
(Figs. 1 and 2) could be due to a concomitant sorafenib
impairment of miRNA-mediated posttranscriptional regulation
(12). The size difference between
the two CXCR4 splice variants is <1 kDa and thus too
small to be detectable at the protein level by SDS-PAGE. In
addition, the antibodies tested in the present study gave multiple
bands with our samples. The presumptive CXCR4 band was confirmed by
comparison with a human breast cancer cell line and was slightly
decreased in intensity after sorafenib treatment. Moreover, other
studies report additional bands in the western blots of CXCR4,
which are attributed e.g. to dimerization, glycosylation,
ubiquitination or heterogeneity of the molecule (60–62).
This might explain the similar regulation of the second main
band.
Therapeutic perspectives
The reduction of the three molecular targets
following sorafenib treatment found in our in vitro study is
a positive signal for the application of this drug in osteosarcoma
disease, although cell culture might not reflect the in vivo
responsiveness and complexity and occurrence of possible
side-effects. A phase II clinical trial with sorafenib in relapsed
and unresectable osteosarcoma demonstrated clinical effects in the
form of partial responses, minor responses and stable diseases with
a median progression-free survival of 4 months and an overall
survival time of 7 months (63).
A detailed analysis of metastasis-associated factors
in different types of osteosarcoma can help to identify ubiquitous
targets for a more focused anticancer therapy. Molecules such as
receptors, ion channels and enzymes can be targeted by
chemical-library screening and natural-product chemistry, the
random search through millions of chemical compounds, or by
synthesis of a chemical entity that is tailored to fit its target,
i.e. structure-based drug design. Transition-state analogue design,
a more recent approach to drug design, by contrast, is limited to
enzyme targets. It mimics the normal reactant’s transition-state
geometry to facilitate tighter binding of a transition-state
analogue to its parent enzyme compared to the normal reactant
(64) preventing the normal
reactants from binding and resulting in enzyme inhibition. The
strength of binding of the analogue considerably reduces the
amounts of a drug needed to be delivered to the target enzyme. The
long-lasting effect of the analogue (65) would in theory minimize therapeutic
side-effects.
Acknowledgements
The authors thank Christian Gülly and Slave
Trajanoski for their support.
References
|
1
|
Kansara M and Thomas DM: Molecular
pathogenesis of osteosarcoma. DNA Cell Biol. 26:1–18. 2007.
View Article : Google Scholar
|
|
2
|
Ta HT, Dass CR, Choong PF and Dunstan DE:
Osteosarcoma treatment: state of the art. Cancer Metastasis Rev.
28:247–263. 2009. View Article : Google Scholar : PubMed/NCBI
|
|
3
|
Withrow SJ, Powers BE, Straw RC and
Wilkins RM: Comparative aspects of osteosarcoma. Dog versus man.
Clin Orthop Relat Res. 270:159–168. 1991.PubMed/NCBI
|
|
4
|
Kaya M, Wada T, Akatsuka T, Kawaguchi S,
Nagoya S, Shindoh M, Higashino F, Mezawa F, Okada F and Ishii S:
Vascular endothelial growth factor expression in untreated
osteosarcoma is predictive of pulmonary metastasis and poor
prognosis. Clin Cancer Res. 6:572–577. 2000.PubMed/NCBI
|
|
5
|
Smithey BE, Pappo AS and Hill DA: C-kit
expression in pediatric solid tumours: a comparative
immunohistochemical study. Am J Surg Pathol. 26:486–492. 2002.
View Article : Google Scholar : PubMed/NCBI
|
|
6
|
McGary EC, Weber K, Mills L, Doucet M,
Lewis V, Lev DC, Fidler IJ and Bar-Eli M: Inhibition of
platelet-derived growth factor-mediated proliferation of
osteosarcoma cells by the novel tyrosine kinase inhibitor STI571.
Clin Cancer Res. 8:3584–3591. 2002.PubMed/NCBI
|
|
7
|
Kaya M, Wada T, Nagoya S, Sasaki M,
Matsumura T and Yamashita T: The level of vascular endothelial
growth factor as a predictor of a poor prognosis in osteosarcoma. J
Bone Joint Surg Br. 91:784–788. 2009. View Article : Google Scholar : PubMed/NCBI
|
|
8
|
Steeghs N, Nortier JW and Gelderblom H:
Small molecule tyrosine kinase inhibitors in the treatment of solid
tumours: an update of recent developments. Ann Surg Oncol.
14:942–953. 2007. View Article : Google Scholar : PubMed/NCBI
|
|
9
|
Wilhelm SM, Carter C, Tang L, et al: BAY
43-9006 exhibits broad spectrum oral antitumour activity and
targets the RAF/MEK/ERK pathway and receptor tyrosine kinases
involved in tumour progression and angiogenesis. Cancer Res.
64:7099–7109. 2004. View Article : Google Scholar : PubMed/NCBI
|
|
10
|
Mulder SF, Jacobs JF, Olde Nordkamp MA, et
al: Cancer patients treated with sunitinib or sorafenib have
sufficient antibody and cellular immune responses to warrant
influenza vaccination. Clin Cancer Res. 17:4541–4549. 2011.
View Article : Google Scholar : PubMed/NCBI
|
|
11
|
Blechacz BR, Smoot RL, Bronk SF, Werneburg
NW, Sirica AE and Gores GJ: Sorafenib inhibits signal transducer
and activator of transcription-3 signaling in cholangiocarcinoma
cells by activating the phosphatase shatterproof 2. Hepatology.
50:1861–1870. 2009. View Article : Google Scholar : PubMed/NCBI
|
|
12
|
Zhou C, Liu J, Li Y, Liu L, Zhang X, Ma
CY, Hua SC, Yang M and Yuan Q: microRNA-1274a, a modulator of
sorafenib induced a disintegrin and metalloproteinase 9 (ADAM9)
down-regulation in hepatocellular carcinoma. FEBS Lett.
585:1828–1834. 2011. View Article : Google Scholar : PubMed/NCBI
|
|
13
|
Ramakrishnan V, Timm M, Haug JL, Kimlinger
TK, Wellik LE, Witzig TE, Rajkumar SV, Adjei AA and Kumar S:
Sorafenib, a dual Raf kinase/vascular endothelial growth factor
receptor inhibitor has significant anti-myeloma activity and
synergizes with common anti-myeloma drugs. Oncogene. 29:1190–1202.
2010. View Article : Google Scholar : PubMed/NCBI
|
|
14
|
Zeng Z, Shi YX, Samudio IJ, et al:
Targeting the leukemia microenvironment by CXCR4 inhibition
overcomes resistance to kinase inhibitors and chemotherapy in AML.
Blood. 113:6215–6224. 2009. View Article : Google Scholar : PubMed/NCBI
|
|
15
|
Pignochino Y, Grignani G, Cavalloni G, et
al: Sorafenib blocks tumour growth, angiogenesis and metastatic
potential in preclinical models of osteosarcoma through a mechanism
potentially involving the inhibition of ERK1/2, MCL-1 and ezrin
pathways. Mol Cancer. 8:1182009. View Article : Google Scholar
|
|
16
|
Wolfesberger B, Tonar Z, Gerner W,
Skalicky M, Heiduschka G, Egerbacher M, Thalhammer JG and Walter I:
The tyrosine kinase inhibitor sorafenib decreases cell number and
induces apoptosis in a canine osteosarcoma cell line. Res Vet Sci.
88:94–100. 2010. View Article : Google Scholar : PubMed/NCBI
|
|
17
|
Huang da W, Sherman BT and Lempicki RA:
Systematic and integrative analysis of large gene lists using DAVID
bioinformatics resources. Nat Protoc. 4:44–57. 2009.PubMed/NCBI
|
|
18
|
Warde-Farley D, Donaldson SL, Comes O, et
al: The GeneMANIA prediction server: biological network integration
for gene prioritization and predicting gene function. Nucleic Acids
Res. 38:W214–W220. 2010. View Article : Google Scholar : PubMed/NCBI
|
|
19
|
Alibes A, Yankilevich P, Canada A and
Diaz-Uriarte R: IDconverter and IDClight: conversion and annotation
of gene and protein IDs. BMC Bioinformatics. 8:92007. View Article : Google Scholar : PubMed/NCBI
|
|
20
|
Duncan D, Prodduturi N and Zhang B:
WebGestalt2: an updated and expanded version of the Web-based Gene
Set Analysis Toolkit. BMC Bioinformatics. 11:P102010. View Article : Google Scholar
|
|
21
|
Zuker M: Mfold web server for nucleic acid
folding and hybridization prediction. Nucleic Acids Res.
31:3406–3415. 2003. View Article : Google Scholar : PubMed/NCBI
|
|
22
|
Pfaffl MW, Horgan GW and Dempfle L:
Relative expression software tool (REST) for group-wise comparison
and statistical analysis of relative expression results in
real-time PCR. Nucleic Acids Res. 30:e362002. View Article : Google Scholar : PubMed/NCBI
|
|
23
|
de Jonge HJ, Fehrmann RS, de Bont ES,
Hofstra RM, Gerbens F, Kamps WA, de Vries EG, van der Zee AG, te
Meerman GJ and ter Elst A: Evidence based selection of housekeeping
genes. PLoS One. 2:e8982007.PubMed/NCBI
|
|
24
|
Kwon MJ, Oh E, Lee S, et al:
Identification of novel reference genes using multiplatform
expression data and their validation for quantitative gene
expression analysis. PLoS One. 4:e61622009. View Article : Google Scholar : PubMed/NCBI
|
|
25
|
Bustin SA, Benes V, Garson JA, et al: The
MIQE guidelines: Minimum Information for Publication of
Quantitative Real-time PCR experiments. Clin Chem. 55:611–622.
2009. View Article : Google Scholar : PubMed/NCBI
|
|
26
|
Bradford MM: A rapid and sensitive method
for the quantitation of microgram quantities of protein utilizing
the principle of protein-dye binding. Anal Biochem. 72:248–254.
1976. View Article : Google Scholar : PubMed/NCBI
|
|
27
|
Laemmli UK: Cleavage of structural
proteins during the assembly of the head of bacteriophage T4.
Nature. 227:680–685. 1970. View Article : Google Scholar : PubMed/NCBI
|
|
28
|
Boye K and Maelandsmo GM: S100A4 and
metastasis: a small actor playing many roles. Am J Pathol.
176:528–535. 2010. View Article : Google Scholar : PubMed/NCBI
|
|
29
|
Jenkinson SR, Barraclough R, West CR and
Rudland PS: S100A4 regulates cell motility and invasion in an in
vitro model for breast cancer metastasis. Br J Cancer.
90:253–262. 2004. View Article : Google Scholar : PubMed/NCBI
|
|
30
|
Sherbet GV: Metastasis promoter S100A4 is
a potentially valuable molecular target for cancer therapy. Cancer
Lett. 280:15–30. 2009. View Article : Google Scholar : PubMed/NCBI
|
|
31
|
Shi Y, Zou M, Collison K, Baitei EY,
Al-Makhalafi Z, Farid NR and Al-Mohanna FA: Ribonucleic acid
interference targeting S100A4 (Mts1) suppresses tumour growth and
metastasis of anaplastic thyroid carcinoma in a mouse model. J Clin
Endocrinol Metab. 91:2373–2379. 2006. View Article : Google Scholar : PubMed/NCBI
|
|
32
|
Ambartsumian N, Klingelhofer J, Grigorian
M, et al: The metastasis-associated Mts1(S100A4) protein could act
as an angiogenic factor. Oncogene. 20:4685–4695. 2001. View Article : Google Scholar : PubMed/NCBI
|
|
33
|
Schmidt-Hansen B, Klingelhofer J,
Grum-Schwensen B, Christensen A, Andresen S, Kruse C, Hansen T,
Ambartsumian N, Lukanidin E and Grigorian M: Functional
significance of metastasis-inducing S100A4(Mts1) in tumour-stroma
interplay. J Biol Chem. 279:24498–24504. 2004. View Article : Google Scholar : PubMed/NCBI
|
|
34
|
Rudland PS, Platt-Higgins A, Renshaw C,
West CR, Winstanley JH, Robertson L and Barraclough R: Prognostic
significance of the metastasis-inducing protein S100A4 (p9Ka) in
human breast cancer. Cancer Res. 60:1595–1603. 2000.PubMed/NCBI
|
|
35
|
Lee WY, Su WC, Lin PW, Guo HR, Chang TW
and Chen HH: Expression of S100A4 and Met: potential predictors for
metastasis and survival in early-stage breast cancer. Oncology.
66:429–438. 2004. View Article : Google Scholar : PubMed/NCBI
|
|
36
|
Wang YY, Ye ZY, Zhao ZS, Tao HQ and Chu
YQ: High-level expression of S100A4 correlates with lymph node
metastasis and poor prognosis in patients with gastric cancer. Ann
Surg Oncol. 17:89–97. 2010. View Article : Google Scholar : PubMed/NCBI
|
|
37
|
Grum-Schwensen B, Klingelhofer J, Berg CH,
El-Naaman C, Grigorian M, Lukanidin E and Ambartsumian N:
Suppression of tumour development and metastasis formation in mice
lacking the S100A4 (mts1) gene. Cancer Res. 65:3772–3780.
2005. View Article : Google Scholar : PubMed/NCBI
|
|
38
|
Mathisen B, Lindstad RI, Hansen J,
El-Gewely SA, Maelandsmo GM, Hovig E, Fodstad O, Loennechen T and
Winberg JO: S100A4 regulates membrane induced activation of matrix
metalloproteinase-2 in osteosarcoma cells. Clin Exp Metastasis.
20:701–711. 2003. View Article : Google Scholar : PubMed/NCBI
|
|
39
|
Ma X, Yang Y, Wang Y, An G and Lv G: Small
interfering RNA-directed knockdown of S100A4 decreases
proliferation and invasiveness of osteosarcoma cells. Cancer Lett.
299:171–181. 2010. View Article : Google Scholar : PubMed/NCBI
|
|
40
|
Ambartsumian N, Tarabykina S, Grigorian M,
Tulchinsky E, Hulgaard E, Georgiev G and Lukanidin E:
Characterization of two splice variants of metastasis-associated
human mts1 gene. Gene. 159:125–130. 1995. View Article : Google Scholar : PubMed/NCBI
|
|
41
|
Mazzucchelli L: Protein S100A4: too long
overlooked by pathologists? Am J Pathol. 160:7–13. 2002. View Article : Google Scholar : PubMed/NCBI
|
|
42
|
Durchdewald M, Angel P and Hess J: The
transcription factor Fos: a Janus-type regulator in health and
disease. Histol Histopathol. 24:1451–1461. 2009.PubMed/NCBI
|
|
43
|
Eferl R and Wagner EF: AP-1: a
double-edged sword in tumourigenesis. Nat Rev Cancer. 3:859–868.
2003. View Article : Google Scholar : PubMed/NCBI
|
|
44
|
Wang ZQ, Liang J, Schellander K, Wagner EF
and Grigoriadis AE: c-fos-induced osteosarcoma formation in
transgenic mice: cooperativity with c-jun and the role of
endogenous c-fos. Cancer Res. 55:6244–6251. 1995.
|
|
45
|
Dobrazanski P, Noguchi T, Kovary K, Rizzo
CA, Lazo PS and Bravo R: Both products of the fosB gene, FosB and
its short form, FosB/SF, are transcriptional activators in
fibroblasts. Mol Cell Biol. 11:5470–5478. 1991.PubMed/NCBI
|
|
46
|
Wu JX, Carpenter PM, Gresens C, Keh R,
Niman H, Morris JW and Mercola D: The proto oncogene c-fos is
over-expressed in the majority of human osteosarcomas. Oncogene.
5:989–1000. 1990.PubMed/NCBI
|
|
47
|
Franchi A, Calzolari A and Zampi G:
Immunohistochemical detection of c-fos and c-jun expression in
osseous and cartilaginous tumours of the skeleton. Virchows Arch.
432:515–519. 1998. View Article : Google Scholar : PubMed/NCBI
|
|
48
|
Ruther U, Komitowski D, Schubert FR and
Wagner EF: c-fos expression induces bone tumours in transgenic
mice. Oncogene. 4:861–865. 1989.PubMed/NCBI
|
|
49
|
Hu E, Mueller E, Oliviero S, Papaioannou
VE, Johnson R and Spiegelman BM: Targeted disruption of the c-fos
gene demonstrates c-fos-dependent and -independent pathways for
gene expression stimulated by growth factors or oncogenes. EMBO J.
13:3094–3103. 1994.PubMed/NCBI
|
|
50
|
Pandey MK, Liu G, Cooper TK and Mulder KM:
Knockdown of c-Fos suppresses the growth of human colon carcinoma
cells in athymic mice. Int J Cancer. 130:213–222. 2012. View Article : Google Scholar : PubMed/NCBI
|
|
51
|
Kakar S, Mihalov M, Chachlani NA, Ghosh L
and Johnstone H: Correlation of c-fos, p53, and PCNA expression
with treatment outcome in osteosarcoma. J Surg Oncol. 73:125–126.
2000. View Article : Google Scholar : PubMed/NCBI
|
|
52
|
Clark JC, Dass CR and Choong PF: A review
of clinical and molecular prognostic factors in osteosarcoma. J
Cancer Res Clin Oncol. 134:281–297. 2008. View Article : Google Scholar : PubMed/NCBI
|
|
53
|
Laverdiere C, Hoang BH, Yang R, Sowers R,
Qin J, Meyers PA, Huvos AG, Healey JH and Gorlick R: Messenger RNA
expression levels of CXCR4 correlate with metastatic behavior and
outcome in patients with osteosarcoma. Clin Cancer Res.
11:2561–2567. 2005. View Article : Google Scholar : PubMed/NCBI
|
|
54
|
Lin F, Zheng SE, Shen Z, Tang LN, Chen P,
Sun YJ, Zhao H and Yao Y: Relationships between levels of CXCR4 and
VEGF and blood-borne metastasis and survival in patients with
osteosarcoma. Med Oncol. 28:649–653. 2011. View Article : Google Scholar : PubMed/NCBI
|
|
55
|
Baumhoer D, Smida J, Zillmer S, Rosemann
M, Atkinson MJ, Nelson PJ, Jundt G, Luettichau IV and Nathrath M:
Strong expression of CXCL12 is associated with a favorable outcome
in osteosarcoma. Mod Pathol. 25:522–528. 2012. View Article : Google Scholar : PubMed/NCBI
|
|
56
|
Perissinotto E, Cavalloni G, Leone F, et
al: Involvement of chemokine receptor 4/stromal cell-derived factor
1 system during osteosarcoma tumour progression. Clin Cancer Res.
11:490–497. 2005.PubMed/NCBI
|
|
57
|
Liang Z, Wu T, Lou H, Yu X, Taichman RS,
Lau SK, Nie S, Umbreit J and Shim H: Inhibition of breast cancer
metastasis by selective synthetic polypeptide against CXCR4. Cancer
Res. 64:4302–4308. 2004. View Article : Google Scholar : PubMed/NCBI
|
|
58
|
Mori T, Doi R, Koizumi M, et al: CXCR4
antagonist inhibits stromal cell-derived factor 1-induced migration
and invasion of human pancreatic cancer. Mol Cancer Ther. 3:29–37.
2004. View Article : Google Scholar : PubMed/NCBI
|
|
59
|
Liang Z, Yoon Y, Votaw J, Goodman MM,
Williams L and Shim H: Silencing of CXCR4 blocks breast cancer
metastasis. Cancer Res. 65:967–971. 2005.PubMed/NCBI
|
|
60
|
Carlisle AJ, Lyttle CA, Carlisle RY and
Maris JM: CXCR4 expression heterogeneity in neuroblastoma cells due
to ligand-independent regulation. Mol Cancer. 8:1262009. View Article : Google Scholar : PubMed/NCBI
|
|
61
|
Lapham CK, Romantseva T, Petricoin E, King
LR, Manischewitz J, Zaitseva MB and Golding H: CXCR4 heterogeneity
in primary cells: possible role of ubiquitination. J Leukoc Biol.
72:1206–1214. 2002.PubMed/NCBI
|
|
62
|
Sloane AJ, Raso V, Dimitrov DS, et al:
Marked structural and functional heterogeneity in CXCR4: separation
of HIV-1 and SDF-1α responses. Immunol Cell Biol. 83:129–143.
2005.PubMed/NCBI
|
|
63
|
Grignani G, Palmerini E, Dileo P, et al: A
phase II trial of sorafenib in relapsed and unresectable high-grade
osteosarcoma after failure of standard multimodal therapy: an
Italian Sarcoma Group study. Ann Oncol. 23:508–516. 2012.
View Article : Google Scholar : PubMed/NCBI
|
|
64
|
Ho MC, Shi W, Rinaldo-Matthis A, Tyler PC,
Evans GB, Clinch K, Almo SC and Schramm VL: Four generations of
transition-state analogues for human purine nucleoside
phosphorylase. Proc Natl Acad Sci USA. 107:4805–4812. 2010.
View Article : Google Scholar : PubMed/NCBI
|
|
65
|
Lewandowicz A, Tyler PC, Evans GB,
Furneaux RH and Schramm VL: Achieving the ultimate physiological
goal in transition state analogue inhibitors for purine nucleoside
phosphorylase. J Biol Chem. 278:31465–31468. 2003. View Article : Google Scholar : PubMed/NCBI
|