Introduction
The recently discovered multidomain protein encoded
by the ZC3H12A gene, MCPIP1 (monocyte chemotactic
protein-1-induced protein 1), has so far been described as a new
transcription (1) and a new
differentiation factor (2), a
ribonuclease (3,4) and as a deubiquitinase (5). It has also been reported that MCPIP1
is essential in preventing immune disorders (3). Although MCPIP1 expression is
significantly increased in the presence of proinflammatory
mediators such as interleukin 1β (IL-1β), TNFα or LPS (6,4), the
protein is certainly a negative regulator of inflammation, as it
has already been shown that its activity reduces the expression of
some pro-inflammatory mediators (3,4,7). In
addition, the ribonuclease domain (PIN domain) of MCPIP1 is
involved in the control of mRNA stability of cytokines such as
IL-1β, IL-6 or IL-12p40 (3,4). Therefore, MCPIP1 level correlates with
the fast degradation of the IL-1β transcript as well as its own
transcript and the PIN domain is indispensable for this effect
(4). Moreover, it has been proved
that another enzymatic domain of MCPIP1, with deubiquitinase
activity, can remove ubiquitin moieties attached to TRAF2, TRAF3
and TRAF6 proteins, which results in negative regulation of c-Jun
N-terminal kinase (JNK) and NF-κB activity (5). Thus, MCPIP1 acts as a negative
regulator of IL-1-initiated inflammation at the
post-transcriptional level by degradation of IL-1β mRNA and at the
post-translational step, by deubiquitination of components of the
NF-κB signalling pathway (5,8). Most
recently, it has been shown that MCPIP1 exhibits broad-spectrum
antiviral effects through viral RNA binding and degradation
(9).
The role of MCPIP1 in cancer has not yet been fully
elucidated and, to date, there are few research reports published
on this topic. The correlation between proteasome-targeted cancer
therapy and the expression and toxicity of MCPIP1 was shown in
proteasome inhibitor MG-132-treated cancer cells (10). Additionally, a suppressor function
of MCPIP1 in the micro-RNA system in ovarian and prostate cancer
has been described (11)
corroborating the already well-known fact that microRNAs (miRNAs)
regulate the expression of many cancer-related genes through
posttranscriptional repression of their mRNAs (12). Moreover, one of the major inducers
of MCPIP1 synthesis, monocyte chemoattractant protein-1 (MCP-1), a
well-characterized chemokine synthesized in many normal and
malignant cells (13), has already
been identified as an active component of the tumor
microenvironment regulating angiogenesis and metastasis of breast,
pancreatic and ovarian cancer (14). Therefore, it seems that the MCPIP1
protein is subject to regulation in tumor cells and might affect
the cell metabolism.
Since our preliminary results showed low levels of
MCPIP1 mRNA in several human neuroblastoma cell lines, we analyzed
available microarray data for MCPIP1 RNA expression levels in human
primary neuroblastoma tumors and showed a lack of expression of the
MCPIP1 transcript in all primary tumors. We have also examined
microarray results in other childhood tumors of neuronal origin and
found that MCPIP1 expression was present in very few
medulloblastoma and high grade glioma tumors but was present in
~17% of ependymoma tumors. This indicates that MCPIP1 expression is
not universally absent in tumors of neuronal origin and may be a
subject for regulation in those tissues.
Therefore, we sought to investigate if an enforced
expression of the MCPIP1 gene in neuroblastoma cells might
direct those cancer cells to cell death.
In the present study, we showed that some human
neuroblastoma cell lines display low MCPIP1 gene expression
at the transcript and the protein level. Stable overexpression of
the MCPIP1 gene in human neuroblastoma BE(2)-C cells, using a plasmid vector,
revealed significantly decreased neuroblastoma cell viability and
proliferation potential. Additionally, we concluded that the
endoribonuclease activity of MCPIP1 is responsible for the observed
decrease in cell viability and proliferation.
Materials and methods
Expression microarray data analysis
For assessment of MCPIP1, MCP-1,
CCR2, IL-1R1, NF-κB1/NF-κB2 and
TRAF6 gene expression levels we re-analyzed raw data from a
set of 30 neuroblastoma tumors based on the Affymetrix U133 Plus
2.0 Array, which are deposited in the Gene Expression Omnibus
database as CEL files (GSE13136) (15). For assessment of MCPIP1
expression, additional microarray data were investigated from the
following tumors: medulloblastoma (GSE10327) (16), high grade gliomas (GSE 19578)
(17) and ependymoma (GSE 21687)
(18). Data were analyzed with
Affymetrix GCOS 1.1.1 software using global scaling to a target
signal of 500 and then imported into GeneSpring GX (Agilent
Technologies) for subsequent analysis. Expression data for each
probe was normalized with a ‘per chip normalization’ to the 50th
percentile of all values on the chip, and a ‘per gene
normalization’ to the median expression level of the gene across
all samples (set up to the value of 1.0). Absent calls for
Affymetrix probes representing particular genes were considered as
a lack of expression and present calls as presence of
expression.
Cell cultures
All cell lines used in the study were from ATCC
(Manassas, VA, USA), except for the HTLA230 cell line which was
from Dr Lizzia Raffaghello (Gaslini Scientific Institute, Genova,
Italy) (19). BE(2)-C cells were cultured in a 1:1 mixture
of MEM (Minimum Essential Medium Eagle; Sigma, M4655) supplemented
with 1% NEAA (non-essential amino acids; Sigma, M7145) and 1 mM
sodium pyruvate (Sigma, S8636), and F12 (Sigma, N6658) with 10%
fetal bovine serum (FBS; Gibco, 10270). HTLA230 and SH-SY5Y cells
were cultured in Dulbecco’s modified Eagle’s medium (DMEM; high
glucose; Sigma, D5796) with 10% FBS, 0.02 M HEPES (Sigma, H0887)
and 1% NEAA. IMR-32 cells were seeded into MEM supplemented with
10% FBS, 1% NEAA and 1 mM sodium pyruvate. For HepG2 cell culture,
cells were placed in DMEM (low glucose; Sigma, D6046) with 5% FBS.
All culture media were supplemented with 50 μg/ml gentamicin
(Sigma, G1272).
Stimulation with IL-1β
For stimulation, cells were seeded on 12-well plates
(for RNA extraction) or 6-well plates (for protein isolation),
serum-starved overnight and stimulated with 60 U/ml of IL-1β (human
recombinant IL-1β; PromoKine, C-61120) for several hours, as
indicated in the Results.
Genetic constructs
The coding sequences of the wild-type and mutant
forms of the MCPIP1 lacking the PIN domain were obtained by
two-step PCR as previously described (4). For construct amplification, competent
TOP10F’ Escherichia coli bacteria were transformed with the
appropriate construct and cultured overnight in LB medium with 50
μg/ml ampicillin (the resistance gene present in the pcDNA3
plasmid; Sigma, A0166). Plasmids were then isolated with Qiagen
Plasmid Purification Midi kit (Qiagen, 12145), according to the
manufacturer’s recommendations, and checked for quality by cutting
with restriction enzymes followed by electrophoresis in a 1%
agarose gel, visualized by ethidium bromide.
Transfection of human neuroblastoma cell
line
For stable overexpresion of MCPIP1, the human
neuroblastoma cell line BE(2)-C was
transfected with genetic constructs. For this purpose, cells were
seeded at a density of 30,000/cm2 in MEM/F12 medium.
After one day of culture, the cell medium was changed, and after
another 10 h, cells were transfected with one of the following
constructs inserted into the pcDNA3 plasmid: empty vector
(control), wild-type MCPIP1, MCPIP1 without PIN domain, abbreviated
as pcDNA3, MCPIP1wt, and MCPIP1ΔPIN, respectively.
Also, in each experiment, one sample was transfected
with green fluorescent protein (GFP) to control efficiency of
transfection with the plasmid vectors. For transfection, jetPEI
(PolyPlus-Transfection, cat. no. 101) was used according to the
manufacturer’s recommendations, with a jetPEI:DNA ratio of 3:1. The
medium containing the transfection mix was removed and replaced by
fresh medium 4 h after transfection. Transfection efficiency was at
the level of ~50–60%, as evaluated by fluorescent microscopy on the
sample with GFP.
After transfection, BE(2)-C cells were cultured in MEM/F12
supplemented with geneticin (Lab Empire, G418) at a concentration
of 800 μg/ml, which was added to the culture medium since day 3
after transfection. The medium containing G418 was refreshed every
2–3 days, until the cells formed a dense monolayer in the culture
flask. The expression of the construct was determined by western
blot analysis. Subsequently, a cell suspension of 25 cells/1 ml was
prepared, and 40 μl (containing one cell) were seeded into each
well of 96-well plates. Colonies derived from single cells were
gradually scaled up to 75-cm2 flasks. The clones were
named with one letter abbreviations depending on the construct (C,
control/pcDNA3; M, MCPIP1; P, no PIN domain). Beginning from the
first passage from the 96-well plates, the stable clones were
cultured in medium containing 2/3 of the initial amount of G418,
i.e. 533 μg/ml. Clones were cryo-preserved in duplicates, each
containing 1/3 of the amount of cells, and from the remaining 1/3
of the culture protein was isolated. The expression of MCPIP1 was
determined by western blot analysis.
RNA isolation
For RNA isolation from cell lines, cells were washed
twice with phosphate-buffered saline (PBS) and total RNA was
isolated using the modified Chomczynski-Sacchi method with GTC
(guanidinium thiocyanate) as described elsewhere (20). RNA concentration was measured with
an ND-1000 spectrophotometer (NanoDrop) and RNA integrity was
verified on a 1% denaturating agarose gel.
Real time RT-PCR
For the real-time PCR experiment, 1 μg of total RNA
was reverse-transcribed using oligo(dT) 15 Primer (Invitrogen;
18418-020) and M-MLV reverse transcriptase (Invitrogen; 28025-013).
Following synthesis, cDNA was diluted 5× and real-time PCR was
carried out using the Rotor-Gene 3000 (Corbett) system and KAPA
SYBR FAST qPCR Master Mix (Kapa Biosystems, KK4601). After an
initial denaturation step of 10 min at 95°C, conditions for 40
cycling steps were: 20 sec at 95°C, 20 sec at 62°C and 30 sec at
72°C. The fluorescence signal was measured after the extension step
at 72°C. At the end of the PCR cycling, a melting curve was
generated to verify the specificity of the PCR product. For the
normalization of each sample, the amount of eukaryotic translation
elongation factor 2 (eEF2) cDNA was measured. Primer sequences
were: for MCPIP1 F, 5′-GGAAGCAGCCGTG TCCCTAT-3′ and R,
5′-TCCAGGCTGCACTGCTCACT-3′; for EF2 F, 5′-GACATCACCAAGGGTGTGCAG-3′
and R, 5′-TCAGCACACTGGCATAGAGGC-3′. All samples were run in
triplicates.
Protein extract isolation
The cells (1×10⁶) were grown on 6-well
plates. Whole cell extracts were obtained according to the TRI
Reagent (Lab Empire, TR118) method, or using lysis buffer from the
Human Phospho-Kinase Array kit (R&D Systems, Abingdon, UK;
ARY003) according to the manufacturer’s protocol. The protein
content in cell extracts was measured using bicinchoninic acid
(21).
Immunoblotting
Protein lysates were resolved by denaturating
SDS-PAGE, and transferred onto a polyvinylidene difluoride membrane
(PVDF Hybond P Millipore, Billerica, MA, USA; IPVH20200).
Unspecific binding to the membrane was blocked by TBST solution
containing 10 mM Tris (pH 7.4), 150 mM NaCl, 0.05% Tween-20 and 5%
non-fat dry milk (or 2% BSA for GAPDH detection), and incubated
with the desired primary antibody at 4°C overnight. The antibody
against MCPIP1 was purchased from Sigma (SAB3500391) or Santa Cruz
Biotechnology (Santa Cruz, CA, USA), and their dilutions were 1:500
or 1:200, respectively. The antibody against GAPDH was purchased
from Sigma (G8795; dilution 1:40,000) and against MYCN was from
Santa Cruz Biotechnology (sc-791; 1:200). After three washing steps
with TBS-T, the membranes were treated with the appropriate
HRP-conjugated secondary antibody diluted in blocking buffer: goat
anti-rabbit IgG (Sigma-Aldrich, A0545, 1:20,000) or anti-mouse IgG
(Sigma-Aldrich, A-9044, 1:40,000) for 1 h at room temperature.
After three washing steps with TBS-T, the immunoreactive bands were
visualized by enhanced chemiluminescence method (Immobilon Western
Chemiluminescent HRP Substrate; Millipore, WBKLS0100) according to
the manufacturer’s protocol. The intensity of the immunoreactive
bands was determined by densitometric scanning to quantify
differences in protein levels (Quest Spot Cutter, Quantity One
Analysis Software; Bio-Rad). The signals from analyzed proteins
through samples were normalized using their signal of GAPDH. The
level of protein expression in control samples was set as 100%, all
other samples were normalized to this value.
Cell viability test
BE(2)-C cells
(5×10³) were cultured on 96-well plates with a
translucent bottom (Nunc, 165306). After 0 and 24 h, cellular ATP
content was measured in triplicates using Luminescence ATP
Detection Assay System (Perkin-Elmer; 6016947) according to the
manufacturer’s protocol (Perkin-Elmer, Waltham, MA, USA). The
signal was collected using Infinite M200 luminescence reader
(Tecan, Männedorf, Switzerland). Three independent experiments were
performed.
BrdU incorporation assay
BE(2)-C cells
(5×10³) were grown on 96-well plates for 24 h and were
then incubated with 5-bromo-2′-deoxyuridine (BrdU; Roche,
11647229001), a pyrimidine analogue, for 4 h. BrdU incorporation
into DNA was measured in triplicates using Cell Proliferation ELISA
according to the manufacturer’s instructions. Three independent
experiments were performed.
Statistical analysis
Statistical analysis was measured with the package
Statistica 10. Data were analyzed by one-way ANOVA, complemented
with the Tukey’s HSD post-hoc test to determine differences between
the groups. All results were significant at α=0.05
(*P<0.05, **P<0.01,
***P<0.001).
Results
Lack of MCPIP1 gene expression in primary
human neuroblastomas
DNA microarrays performed on RNA samples isolated
from 29 primary neuroblastomas revealed a lack of MCPIP1 expression
independent of stage of the disease and MYCN amplification
level (Table I), in contrast to the
one tested metastasis, which showed expression of MCPIP1 mRNA. For
comparison, MCPIP1 gene expression was present in 2/62
medulloblastomas, 1/53 high grade gliomas and 14/83 ependymomas.
Subsequently, transcripts of several genes known to be involved in
MCPIP1 regulation, including MCP-1 (CCL2), MCP-1 receptor (CCR2)
and IL-1β receptor (IL1R1), as well as NF-κB family members were
also evaluated on the same set of primary neuroblastoma tumors.
MYCN amplified stage 4 tumors expressed the lowest MCP-1
mRNA levels compared with both MYCN non-amplified stage 4
tumors, and low stage tumors (all MYCN non-amplified). These
differences were statistically significant (P=0.035 and P=0.040,
respectively) (Table II). However,
the difference in MCP-1 expression between stage 4 MYCN
non-amplified tumors and low stage tumors was not statistically
significant (P=0.800). Moreover, the majority of tumors (except for
low stage tumors), and cell lines, did not express the MCP-1
receptor, although a comparison between the expression level of the
receptor in stage 4 MYCN amplified tumors and low stage
tumors showed statistical significance (P=0.012) (Table II). The analysis of transcript
levels of different NF-κB family members suggested that upon IL-1β
stimulation, the classical (but not the alternative) signaling
pathway could be activated (Table
I), as NF-κB1 (the precursor of p50) and p65 (Rel A) but not
NF-κB2 (the precursor of p52) or Rel B were expressed (22). Notably, the initiation of MCP-1
expression depends on hetero- or homodimer formation of p65 and
c-Rel (23) and both transcripts
were expressed in tumor samples.
 | Table IMCPIP1, MCP1, CCR2, IL-1R, NF-κB
family and TRAF6 mRNA present calls in primary human neuroblastoma
tumors. |
Table I
MCPIP1, MCP1, CCR2, IL-1R, NF-κB
family and TRAF6 mRNA present calls in primary human neuroblastoma
tumors.
| Transcripts | Tumors |
|---|
| MCPIP1 | 0/29 |
| MCP-1 (CCL2) | 23/29 |
| CCR2 | 15/29 |
| IL-1R1/ILR2 | 22/29; 11/29 |
|
NF-κB1/NF-κB2a | 28/29; 0/29 |
| REL A/REL
B/c-Rel | 29/29; 8/29;
29/29 |
| TRAF6/TRAF6b | 29/29; 6/29 |
| Table IIMCP-1 mRNA expression levels at
different stages of primary human neuroblastoma tumors. |
Table II
MCP-1 mRNA expression levels at
different stages of primary human neuroblastoma tumors.
| Stage and
MYCN amplification status of neuroblastoma tumors | Mean MCP-1
expression level | Mean MCP-1 receptor
(CCR2) expression level |
|---|
| Stage 4 MYCN
amplified tumors | 0.523a (n=9) | 0.763b (n=9) |
| Stage 4 MYCN
non-amplified tumors | 1.520 (n=10) | 1.454 (n=10) |
| Low stages tumors
(all MYCN non-amplified) | 1.393 (n=10) | 1.512 (n=10) |
It should be taken into consideration that the
results of DNA microarray analysis give semi-quantitative
expression levels and thus need to be carefully examined using
quantitative real-time RT-PCR.
Endogenous MCPIP1 expression in human
neuroblastoma cell lines
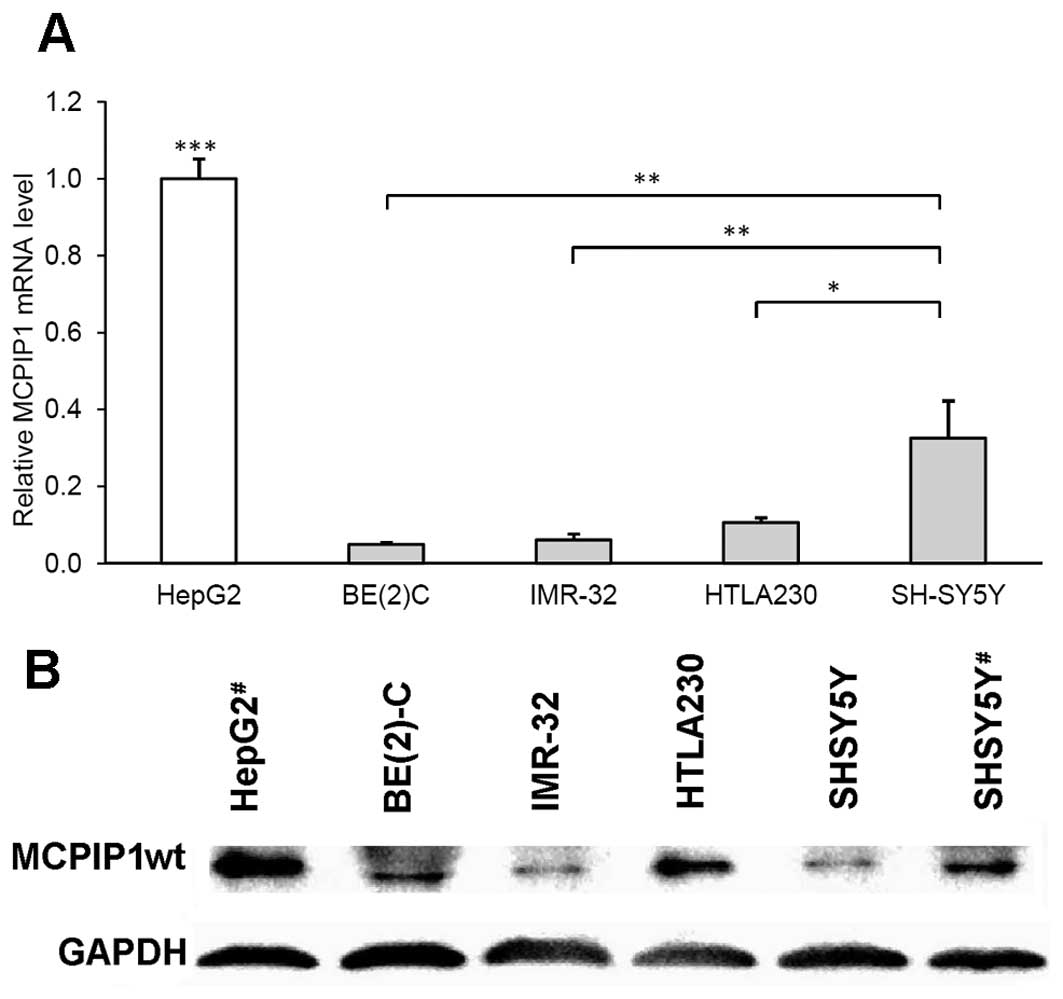
We included several human neuroblastoma cell lines
to measure the transcript level of MCPIP1. We showed that
BE(2)-C, IMR-32 and HTLA230 cell
lines, harboring amplifications of the MYCN oncogene
responsible for the most aggressive phenotype of the disease,
expressed a very small amount of MCPIP1 mRNA (Fig. 1A), while the SH-SY5Y neuroblastoma
cell line, with only a single copy of MYCN, expressed the
highest transcript level in the group of the tested neuroblastoma
cell lines. Nevertheless, the amounts of MCPIP1 mRNA found in
BE(2)-C, IMR-32 and HTLA230 human
neuroblastoma cell lines were at least 10-fold lower than in human
hepatoma HepG2 cells (Fig. 1A). It
was shown in another cancer cell line, HeLa (cervical), that MCPIP1
mRNA levels were comparable to the levels found in HepG2 cells,
while the pre-monocytary cell line U937 expressed much less of the
transcript (data not shown). According to expression microarray
analysis, other human neuroblastoma cell lines such as CHP134, NMB,
TR14, SKNFI and SKNSH do not express MCPIP1 mRNA (data not
shown).
MCPIP1 protein levels were evaluated by
immunoblotting (Fig. 1B) and
different protein amounts were found in samples isolated from the
human neuroblastoma cell lines BE(2)-C, IMR-32, HTLA230 and SH-SY5Y (Fig. 1B). Protein samples isolated from
HepG2 cells (stimulated with IL-1β) were used as a positive
control. Differences between MCPIP1 protein content in the cell
lines did not reflect exactly the corresponding mRNA levels, since
the tested cell lines may differ in MCPIP1 autocatalytic activity
against its own transcript.
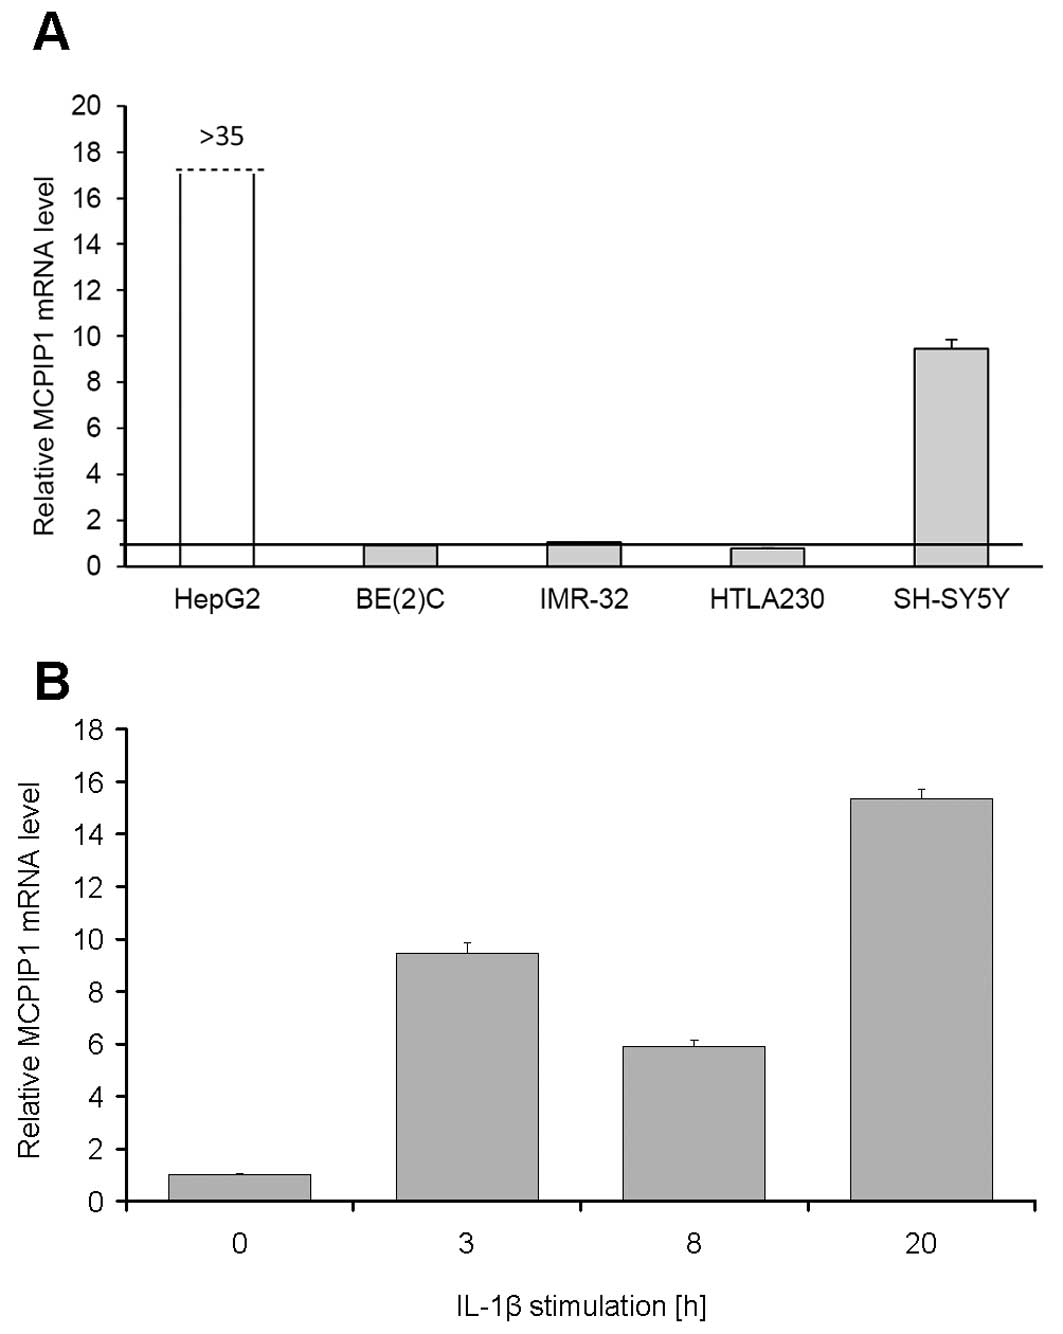
It has been shown that MCPIP1 expression can be
stimulated in HepG2 cells and macrophages by the pro-inflammatory
cytokine IL-1β (4,6,24). We
measured the effect of IL-1β on MCPIP1 expression in neuroblastoma
cell lines and found that only the MYCN non-amplified
SH-SY5Y human neuroblastoma cell line responded to IL-1β
stimulation, while in BE(2)-C,
IMR-32 and HTLA230 cell lines no changes in the MCPIP1 mRNA upon
IL-1β addition were detected (Fig.
2A). A high MCPIP1 mRNA expression level was found in HepG2
cells stimulated with IL-1β (Fig.
2A). As SH-SY5Y cells were the only neuroblastoma cells
responding to IL-1β stimulation, we measured time-dependent changes
in MCPIP1 mRNA content in this cell line (Fig. 2B) and showed that MCPIP1 mRNA
increased significantly by 20 h of stimulation.
For the IMR-32 cell line and five other human
neuroblastoma cell lines (CHP134, NMB, TR14, SKNFI and SKNSH),
expression microarray analysis revealed a lack of IL-1β receptor
expression (data not shown); therefore this fact, and other yet
unknown defects in the IL-1β signaling pathway, could be an
explanation of the unresponsiveness of the cell lines to
stimulation with this cytokine.
Transfection of human neuroblastoma cell
line BE(2)-C with genetic
constructs encoding the wild-type and mutant form of MCPIP1 leads
to stable gene expression
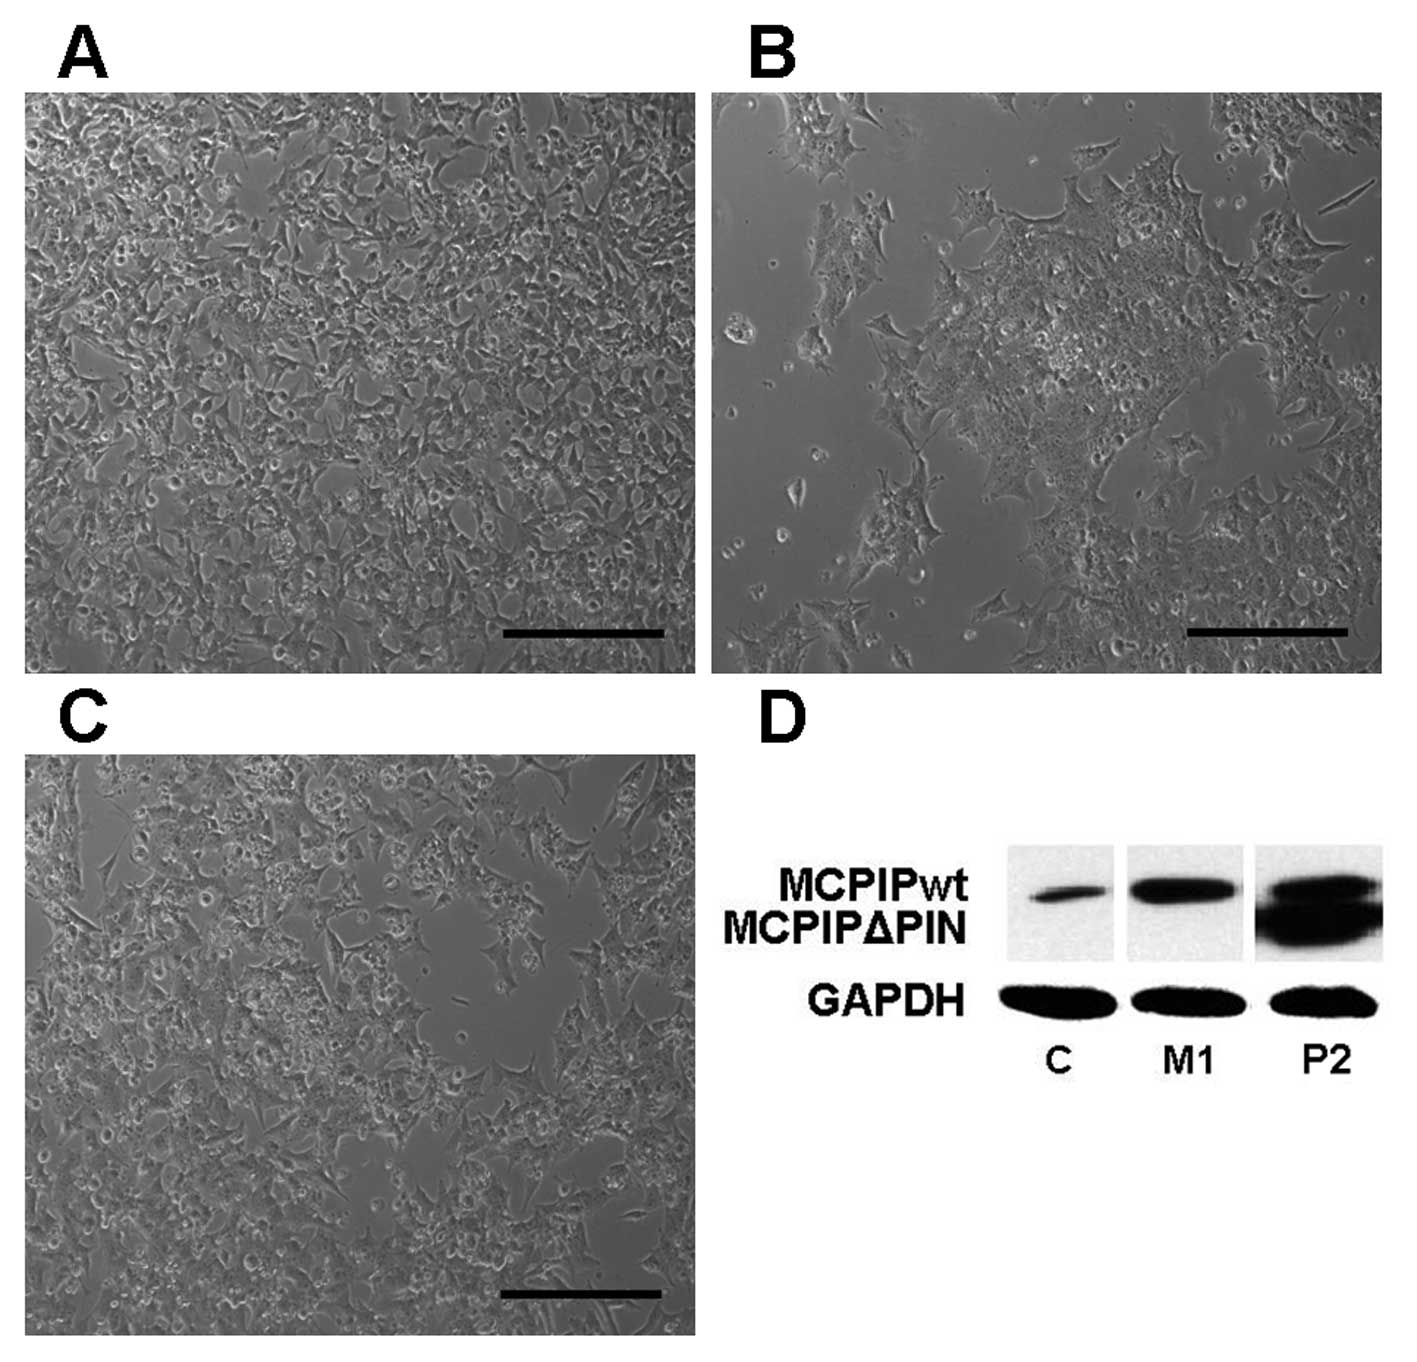
Stable expression of MCPIP1 gene-bearing constructs
(plasmids) was achieved in the BE(2)-C cell line and several clones with
higher and lower MCPIP1wt or MCPIP1ΔPIN expression levels were
isolated and characterized. Microscopic examination of the MCPIP1wt
clones revealed clearly visible changes in their growth morphology,
i.e. their inability to spread and attach to plastic surfaces, when
compared to the control clones, and in their growth rate (Fig. 3A–C). Instead, the MCPIP1wt
overexpressing clones adopted a spherical shape, and formed
conglomerates; moreover, their growth rate was delayed when
compared to the control clones. The morphology of the mutant
MCPIP1ΔPIN clones was more similar to the morphology of the control
clones. Although the clones with high mutant form expression
adopted a slightly more spherical shape, their growth rate was
comparable with the growth rate of the control clones. Protein
expression levels in the wild-type MCPIP1 and the mutant MCPIP1ΔPIN
clones are presented in Fig. 3D. It
can be concluded that overexpression of the wild-type MCPIP1
containing an intact RNase domain is detrimental to neuroblastoma
cells.
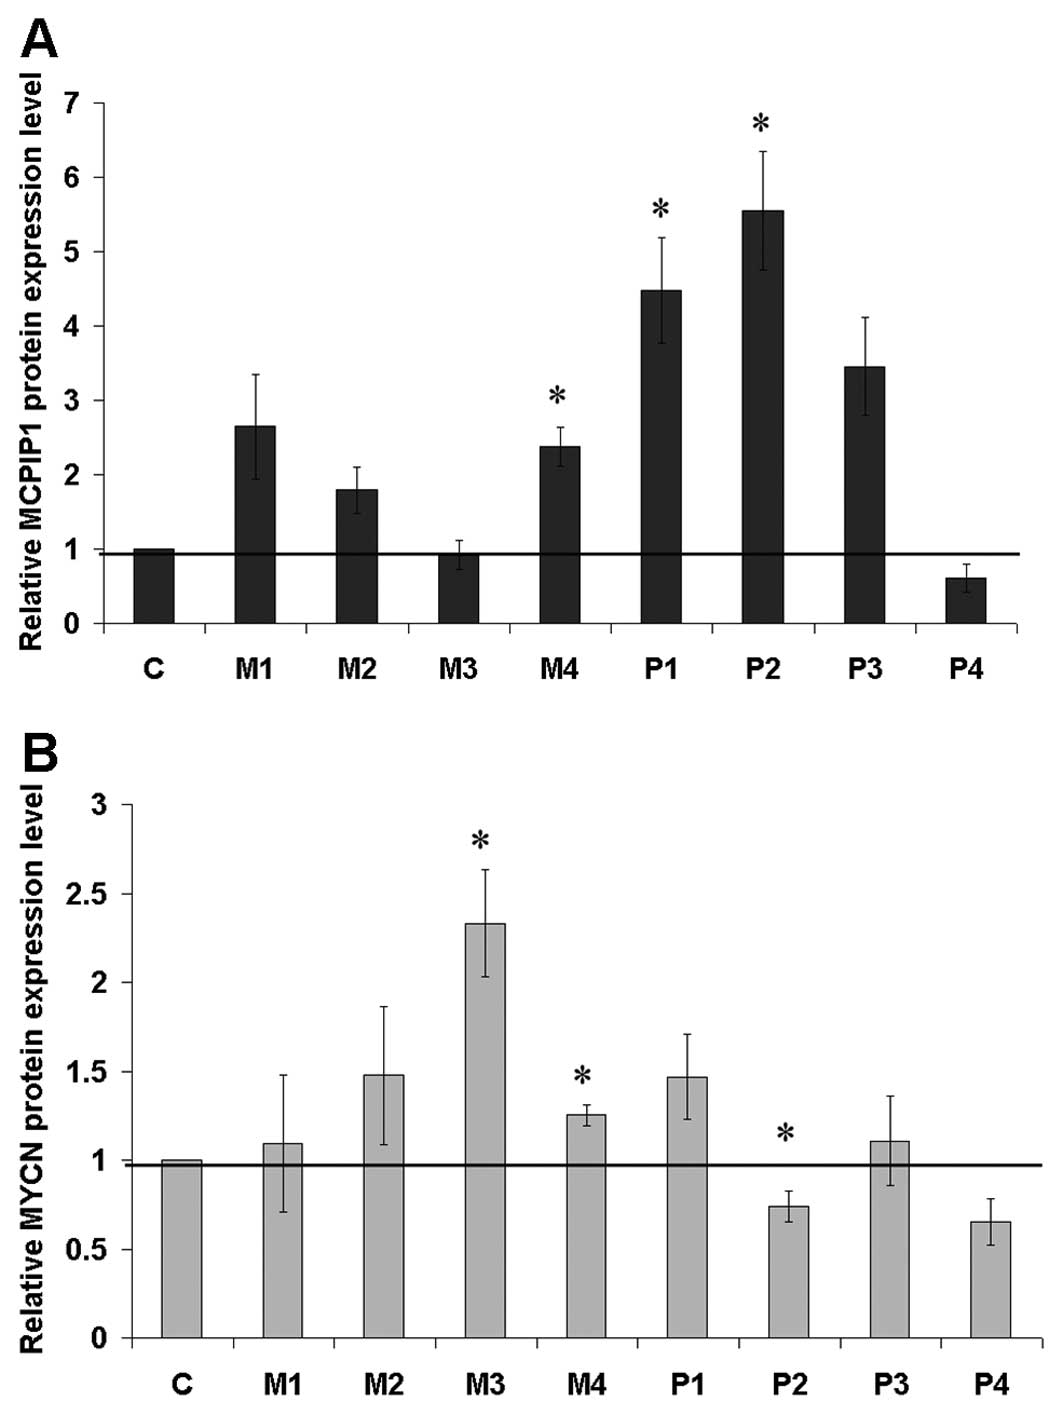
Relative protein expression levels of the wild-type
MCPIP1 and the mutant MCPIP1ΔPIN in chosen cell clones are
presented in Fig. 4A. In the same
set of clones, the MYCN oncogene content (Fig. 4B) was analyzed and revealed a
reverse correlation between MCPIP1wt expression level and MYCN
protein content as the highest MYCN levels were identified in the
clones with the lowest MCPIP1wt (e.g. clone M3). Moreover, the lack
of RNase activity, exhibited in the MCPIP1ΔPIN clones, correlated
with the highest decrease in MYCN content (clone P4). Although the
present study was limited to several stably transfected clones, we
showed a trend relating MCPIP1 protein level to MYCN protein
content. Further investigation should confirm if MCPIP1 is directly
involved in the observed decrease of the MYCN expression level
regulating the turnover of mRNA coding for MYCN.
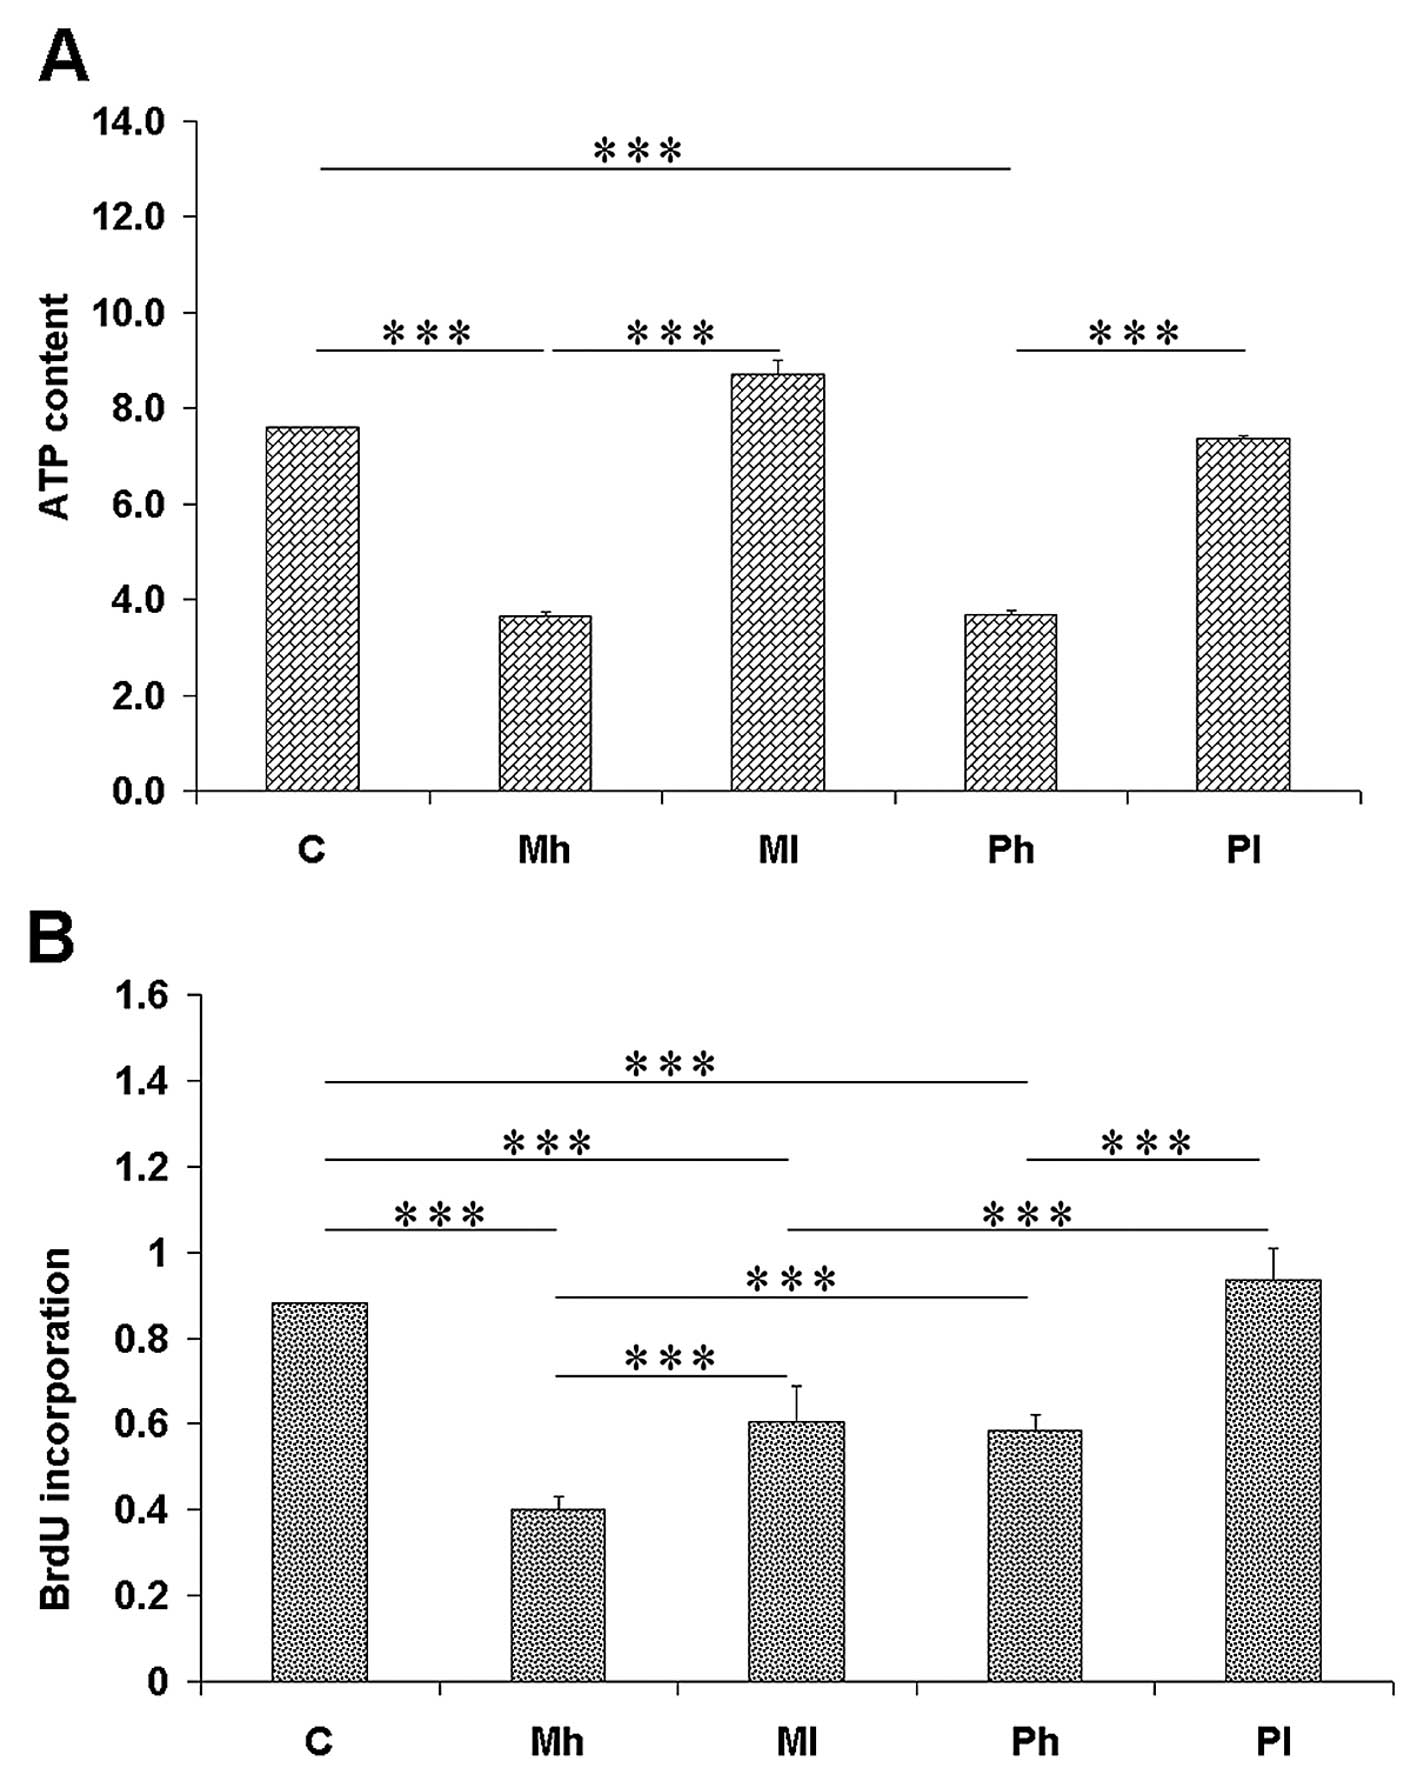
Effect of MCPIP1 overexpression on
neuroblastoma cell viability and proliferation potential
In order to investigate whether the PIN domain of
MCPIP1 is responsible for changes in cell viability and
proliferation, we checked the ATP content and BrdU incorporation in
the BE(2)-C clones stably
transfected with a genetic construct encoding either wild-type
MCPIP1, or the mutant form of MCPIP1 devoid of the PIN domain, or
an empty vector. A significant decrease in the cellular ATP content
was found in the cell clones transfected with MCPIP1wt, especially
those with a high MCPIP1wt protein level (Fig. 5A). The ATP content was comparable in
the cell clones expressing the mutant MCPIP1 form and the wild-type
MCPIP1, either in the clones expressing higher, or lower amounts of
the wild-type and mutant MCPIP1 forms.
BrdU incorporation into DNA, being a measure of
proliferation potential of cells, was performed, and it was
observed that the MCPIP1wt-expressing clones presented lower BrdU
incorporation than the mutant MCPIP1-expressing cells (Fig. 5B). Again, as in the case of ATP
measurement, the decrease in BrdU incorporation was higher in the
cell clones expressing high MCPIP1wt levels than in the clones with
low MCPIP1wt content. BrdU incorporation was higher in the cell
clones expressing the mutant form compared with the tymidine
analogue incorporation found in the MCPIP1wt-expressing clones.
Thus, proliferation potential is better preserved in the clones
expressing the mutant form, suggesting that the PIN domain of the
MCPIP1 protein is important for the inhibition of proliferation of
neuroblastoma cells.
Discussion
Neuroblastoma is the most common extracranial solid
tumor of childhood of neural crest origin. The disease is
characterized by diverse behavior ranging from rapid progression to
spontaneous regression. On the one hand, the disease can be
eradicated in >90% of infants with localized tumors or it may
even undergo spontaneous remission. On the other hand, in older
children, >1.5 years of age, the prognosis is far worse and the
majority of patients with disseminated disease is expected to
relapse within 3 years (25). The
main reason of the low cure rate of children with high risk
neuroblastoma is resistance of cancer cells to treatment. Attempts
to improve the outcome of advanced neuroblastoma have so far
focused mainly on intensification of the induction and
consolidation phases of chemo-radiotherapy, with or without stem
cell rescue (26). However, there
is a great need for extensive investigation of the molecular
mechanisms that may reveal new therapeutic targets (27).
The low expression level of the MCPIP1 protein seems
to be important for cell function and survival in general (10). Therefore, it was expected that human
neuroblastoma tumors and cell lines express little or no of the
MCPIP1 mRNA. Low MCPIP1 gene expression in neuroblastoma
could be explained not only by low responsiveness to IL-1β
stimulation due to the prevailing absence of the IL-1 receptor and
NF-κB family members (Fig. 2 and
Table I), but also by low
expression of MCP-1, one of the main MCPIP1 inducers, and its
receptor, CCR2 (Table I). Our
results confirm the finding by Metelitsa et al (28) that neuroblastoma tumors with genomic
amplification and high expression of the MYCN oncogene had low
expression of MCP-1. Another study showed that MCP-1 expression in
neuroblastoma has been directly repressed by the MYCN oncogene
(29). Thus, MCP-1 expression by
neuroblastoma tumors is negatively associated with MYCN gene
amplification. It is possible that at least lack of an autocrine
branch of stimulation of the MCPIP1 gene through MCP-1 might
be an explanation for low MCPIP1 expression, especially in
MYCN amplified tumors. Based on the expression patterns of
MCPIP1 and MYCN in BE(2)-C cells
(Fig. 4), we may conclude that
MCPIP1 expression inversely correlates with MYCN transcript
content.
The neuroblastoma tumor is not the only cancer
characterized by low MCPIP1 expression. Our recent unpublished
results revealed that in the group of over 50 clear cell renal
carcinoma (ccRCC) tumors significantly lower amounts of MCPIP1 at
mRNA and protein level were found compared with normal tissue. It
has also recently been shown that MCPIP1 undergoes proteasomal
degradation following stimulation with IL-1β (30) and addition of proteasome inhibitors
resulted in a sustained elevated MCPIP1 content very likely
contributing to the toxic effect of proteasome inhibition by MG-132
in HeLa and HepG2 cells (10).
Gene expression can be affected at a specific mRNA
stability level by low molecular weight RNAs such as short
interfering RNA (siRNA) or microRNA (miRNA). The role of microRNAs
in neuroblastoma was partially elucidated (31). Recent results reported by Suzuki
et al (11) indicated that
MCPIP1 can affect miR143 and miR155 expression levels. As both
miRNAs were shown to regulate cancer cell glycolysis as well as
cell invasion and migration in breast and colorectal cancer
(32), it is very likely that
overexpresion of MCPIP1 in neuroblastoma will affect relevant
miRNAs and thus lead to deregulation of tumor cell metabolism.
The various PIN domains (PilT N-terminus domain)
typical for bacterial proteins with RNase properties, also
identified in eukaryotes, have a highly conserved structure with
5′-3′ exonuclease activity (33).
It has been found that MCPIP1 exhibits RNase activity and regulates
the stability of IL-6 and IL12p40 mRNA (3). The PIN domain of MCPIP1 has been
determined by Mizgalska et al (4) and its direct involvement in IL-1β and
MCPIP1 mRNA degradation is independent of the presence of ARE
(AU-rich elements) in the 3′UTR. The present study on human
neuroblastoma cell clones with differential MCPIP1 gene expression
indicates that the PIN domain of MCPIP1 might be responsible for an
increased antiproliferative and cytotoxic effect of the protein on
human neuroblastoma cells (Fig.
5).
As previous studies documented a regulatory role of
MCPIP1 in inflammation through its RNase activity and NF-κB
inhibitory properties, our study indicates that enforced expression
of MCPIP1 may contribute to human neuroblastoma cell death. Further
studies are necessary to clarify the biological role of the
ribonuclease activity of MCPIP1 in neuroblastoma. Collectively,
this may lead to the development of a novel therapeutic approach
based on MCPIP1 protein overexpression and elucidation of
anti-inflammatory function of MCPIP1 in immunological processes
taking place in the tumor microenvironment.
Acknowledgements
The present study was supported by the EC’s project
MTKD-2006-042586 (ACUP), 63/6 PR UE/2007/7 from the Polish Ministry
of Science and Higher Education and NCN-2011/03/B/NZ1/00024 from
the Polish National Science Center. We thank Dr Vito Pistoia
(Gaslini Scientific Institute, Genova, Italy) for his helpful
comments.
References
|
1
|
Zhou L, Azfer A, Niu J, Graham S,
Choudhury M, Adamski FM, Younce C, Binkley PF and Kolattukudy PE:
Monocyte chemoattractant protein-1 induces a novel transcription
factor that causes cardiac myocyte apoptosis and ventricular
dysfunction. Circ Res. 98:1177–1185. 2006. View Article : Google Scholar
|
|
2
|
Vrotsos EG, Kalattukudy PE and Sugaya K:
MCP-1 involvement in glial differentiation of neuroprogenitor cells
through APP signaling. Brain Res Bull. 79:97–103. 2009. View Article : Google Scholar : PubMed/NCBI
|
|
3
|
Matsushita K, Takeuchi O, Standley DM,
Kumagai Y, Kawagoe T, Miyake T, Satoh T, Kato H, Tsujimura T,
Nakamura H and Akira S: Zc3h12a is an RNase essential for
controlling immune responses by regulating mRNA decay. Nature.
458:1185–1190. 2009. View Article : Google Scholar : PubMed/NCBI
|
|
4
|
Mizgalska D, Wegrzyn P, Murzyn K, Kasza A,
Koj A and Jura J, Jarząb B and Jura J: Interleukin-1-inducible
MCPIP protein has structural and functional properties of RNase
participating in degradation of IL-1β mRNA. FEBS J. 276:7386–7399.
2009.PubMed/NCBI
|
|
5
|
Liang J, Saad Y, Lei T, Wang J, Qi D, Yang
Q, Kolattukudy PE and Fu M: MCP-induced protein 1 deubiquitinates
TRAF proteins and negatively regulates JNK and NF-κB signaling. J
Exp Med. 207:2959–2973. 2010.PubMed/NCBI
|
|
6
|
Jura J, Węgrzyn P, Korostyński M, Guzik K,
Oczko-Wojciechowska M, Jarząb M, Kowalska M, Piechota M, Przewłocki
R and Koj A: Identification of interleukin-1 and
interleukin-6-responsive genes in human monocyte-derived
macrophages using microarrays. Biochim Biophys Acta. 1799:383–389.
2008. View Article : Google Scholar : PubMed/NCBI
|
|
7
|
Liang J, Wang J, Azfer A, Song W, Tromp G,
Kolattukudy PE and Fu M: A novel CCCH-zinc finger protein family
regulates proinflammatory activation of macrophages. J Biol Chem.
283:6337–6346. 2008. View Article : Google Scholar : PubMed/NCBI
|
|
8
|
Jura J, Skalniak Ł and Koj A:
Monocyte-chemotactic protein-1-induced protein-1 (MCPIP1) is a
novel multifunctional modulator of inflammatory reactions. Biochim
Biophys Acta. 1823:1905–1913. 2012. View Article : Google Scholar : PubMed/NCBI
|
|
9
|
Lin RJ, Chien HL, Lin SY, Chang BL, Yu HP,
Tang WC and Lin YL: MCPIP1 ribonuclease exhibits broad-spectrum
antiviral effects through viral RNA binding and degradation.
Nucleic Acids Res. 41:3314–3326. 2013. View Article : Google Scholar : PubMed/NCBI
|
|
10
|
Skalniak L, Koj A and Jura J: Proteasome
inhibitor MG-132 induces MCPIP1 expression. FEBS J. 280:2665–2674.
2013. View Article : Google Scholar : PubMed/NCBI
|
|
11
|
Suzuki HI, Arase M, Matsuyama H, Choi YL,
Ueno T, Mano H, Sugimoto K and Miyazono K: MCPIP1 ribonuclease
antagonizes dicer and terminates microRNA biogenesis through
precursor microRNA degradation. Mol Cell. 44:424–436. 2011.
View Article : Google Scholar
|
|
12
|
Garzon R, Calin GA and Croce CM: MicroRNAs
in cancer. Annu Rev Med. 60:167–170. 2009. View Article : Google Scholar
|
|
13
|
Deshmane SL, Kremlev S, Amini S and Sawaya
BE: Monocyte chemoattractant protein-1 (MCP-1): an overview. J
Interferon Cytokine Res. 29:313–326. 2009. View Article : Google Scholar : PubMed/NCBI
|
|
14
|
Muramatsu T and Muramatsu H:
Glycosaminoglycan-binding cytokines as tumor markers. Proteomics.
8:3350–3359. 2008. View Article : Google Scholar : PubMed/NCBI
|
|
15
|
Łastowska M, Viprey V, Santibanez-Koref M,
Wappler I, Peters H, Cullinane C, Roberts P, Hall AG, Tweddle DA,
Pearson ADJ, Lewis I, Burchill SA and Jackson MS: Identification of
candidate genes involved in neuroblastoma progression by combining
genomic and expression microarrays with survival data. Oncogene.
26:7432–7444. 2007.PubMed/NCBI
|
|
16
|
Kool M, Koster J, Bunt J, Hasselt NE,
Lakeman A, van Sluis P, Troost D, Meeteren NS, Caron HN, Cloos J,
Mrsić A, Ylstra B, Grajkowska W, Hartmann W, Pietsch T, Ellison D,
Clifford SC and Versteeg R: Integrated genomics identifies five
medulloblastoma subtypes with distinct genetic profiles, pathway
signatures and clinicopathological features. PLoS One. 3:e30882008.
View Article : Google Scholar : PubMed/NCBI
|
|
17
|
Paugh BS, Qu C, Jones C, Liu Z,
Adamowicz-Brice M, Zhang J, Bax DA, Coyle B, Barrow J, Hargrave D,
Lowe J, Gajjar A, Zhao W, Broniscer A, Ellison DW, Grundy RG and
Baker SJ: Integrated molecular genetic profiling of pediatric
high-grade gliomas reveals key differences with the adult disease.
J Clin Oncol. 28:3061–3068. 2010. View Article : Google Scholar : PubMed/NCBI
|
|
18
|
Johnson RA, Wright KD, Poppleton H,
Mohankumar KM, Finkelstein D, Pounds SB, Rand V, Leary SE, White E,
Eden C, Hogg T, Northcott P, Mack S, Neale G, Wang YD, Coyle B,
Atkinson J, DeWire M, Kranenburg TA, Gillespie Y, Allen JC,
Merchant T, Boop FA, Sanford RA, Gajjar A, Ellison DW, Taylor MD,
Grundy RG and Gilbertson RJ: Cross-species genomics matches driver
mutations and cell compartments to model ependymoma. Nature.
466:632–636. 2010. View Article : Google Scholar : PubMed/NCBI
|
|
19
|
Bogenmann E: A metastatic neuroblastoma
model in SCID mice. Int J Cancer. 67:379–385. 1996. View Article : Google Scholar : PubMed/NCBI
|
|
20
|
Gauthier ER, Madison SD and Michel RN:
Rapid RNA isolation without the use of commercial kits: application
to small tissue samples. Eur J Physiol. 433:664–668. 1997.
View Article : Google Scholar : PubMed/NCBI
|
|
21
|
Smith PK: Measurement of protein using
bicinchoninic acid. Anal Biochem. 150:76–85. 1985. View Article : Google Scholar
|
|
22
|
Pomerantz JL and Baltimore D: Two pathways
to NF-κB. Mol Cell. 10:693–695. 2002.
|
|
23
|
Ueda A, Ishigatsubo Y, Okubo T and
Yoshimura T: Transcriptional regulation of the human monocyte
chemoattractant protein-1 gene. Cooperation of two NF-κB sites and
NF-κB/Rel subunit specificity. J Biol Chem. 272:31092–31099.
1997.PubMed/NCBI
|
|
24
|
Skalniak L, Mizgalska D, Zarebski A,
Wyrzykowska P, Koj A and Jura J: Regulatory feedback loop between
NF-κB and MCP-1-induced protein 1 RNase. FEBS J. 276:5892–5905.
2009.
|
|
25
|
Brodeur GM: Neuroblastoma: biological
insights into a clinical enigma. Nat Rev Cancer. 3:203–216. 2003.
View Article : Google Scholar : PubMed/NCBI
|
|
26
|
Maris JM, Hogarty MD, Bagatell R and Cohn
SL: Neuroblastoma. Lancet. 369:2106–2120. 2007. View Article : Google Scholar : PubMed/NCBI
|
|
27
|
Ora I and Eggert A: Progress in treatment
and risk stratification of neuroblastoma: Impact on future clinical
and basic research. Semin Cancer Biol. 21:217–228. 2011. View Article : Google Scholar : PubMed/NCBI
|
|
28
|
Metelitsa LS, Wu HW, Wang H, Yang Y, Warsi
Z, Asgharzadeh S, Groshen S, Wilson SB and Seeger RC: Natural
killer T cells infiltrate neuroblastomas expressing the chemokine
CCL2. J Exp Med. 199:1213–1221. 2004. View Article : Google Scholar : PubMed/NCBI
|
|
29
|
Song L, Ara T, Wu HW, Woo CW, Reynolds CP,
Seeger RC, DeClerck YA, Thiele CJ, Sposto R and Metelitsa LS:
Oncogene MYCN regulates localization of NKT cells to the site of
disease in neuroblastoma. J Clin Invest. 117:2702–2712. 2007.
View Article : Google Scholar : PubMed/NCBI
|
|
30
|
Iwasaki H, Takeuchi O, Teraguchi S,
Matsushita K, Uehata T, Kuniyoshi K, Satoh T, Saitoh T, Matsuhita
M, Standley DM and Akira S: The IκB kinase complex regulates the
stability of cytokine-encoding mRNA induced by TLR-IL-1R by
controlling degradation of regnase-1. Nat Immunol. 12:1167–1175.
2011.
|
|
31
|
Chen Y and Stallings RL: Differential
patterns of microRNA expression in neuroblastoma are correlated
with prognosis, differentiation and apoptosis. Cancer Res.
67:976–983. 2007. View Article : Google Scholar : PubMed/NCBI
|
|
32
|
Xu J, Fu S, Peng W and Rao Z:
MCP-1-induced protein-1, an immune regulator. Protein Cell.
3:903–910. 2012. View Article : Google Scholar : PubMed/NCBI
|
|
33
|
Clissold PM and Ponting CP: PIN domain in
nonsense-mediated mRNA decay and RNAi. Curr Biol. 10:R888–R890.
2000. View Article : Google Scholar : PubMed/NCBI
|