Introduction
Rabdosia rubescens (Hemsl.) Hara (Dong Ling
Cao in Chinese) is a medicinal herb and has long been used for the
treatment of hepatoma in China (1).
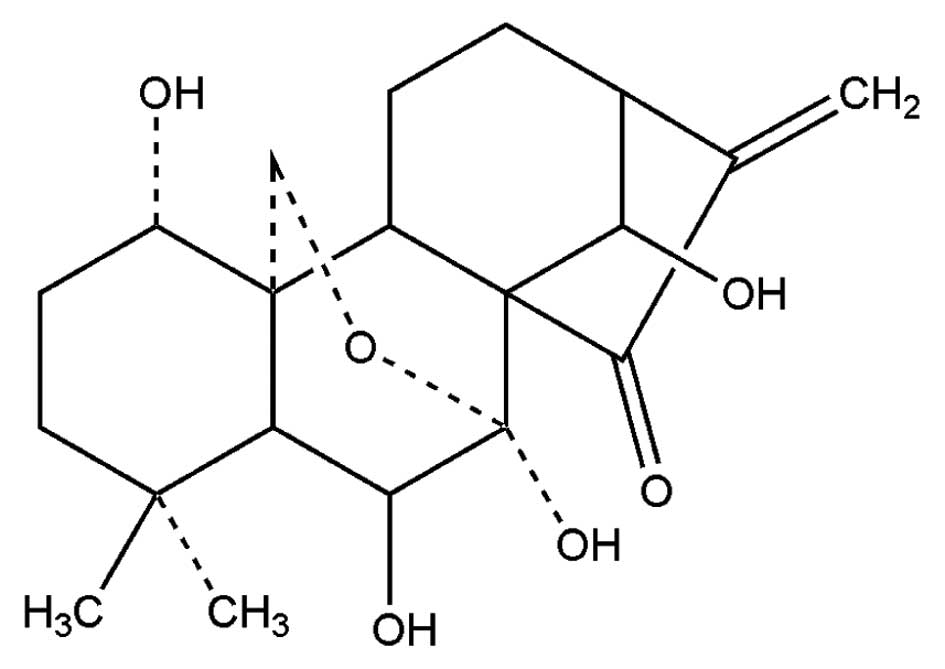
Oridonin (Fig. 1) is the main
active constituent of R. Rubescens. Although laboratory and
clinical data have confirmed the inhibitory activities of oridonin
in hepatocellular carcinoma (2–5), the
molecular mechanisms of action of oridonin have not been fully
elucidated. In the present study, we found that expression levels
of a number of oxidative stress markers were upregulated in
oridonin-treated HepG2 cells using a proteomic approach.
Oxidative stress is a disturbance in the
oxidant-antioxidant balance leading to potential cellular damage.
The imbalance can result from a lack of antioxidant capacity caused
by disturbances in production and distribution, or by an
overabundance of reactive oxygen species (ROS) from other factors.
ROS are potential carcinogens due to their roles in mutagenesis,
tumor promotion and progression (6). It is commonly accepted that cancer
cells have an increased ROS steady state level and are likely to be
more vulnerable to damage by further ROS insults induced by
exogenous agents. Thus, manipulating ROS levels by redox modulation
could be a way to selectively kill cancer cells without causing
significant toxicity to normal cells (7). A unique anticancer strategy termed
‘oxidation therapy’ has been developed by inducing cytotoxic
oxystress for cancer treatment. Many antitumor agents, such as
vinblastine, cisplatin, mitomycin C, doxorubicin, camptothecin,
inostamycin, neocarzinostatin exhibit antitumor activity via
ROS-dependent activation of apoptotic cell death (8,9). To
explore the role of oxidative stress in the anticancer activities
of oridonin in HepG2 cells, we further performed functional
analysis. Results showed that ROS production was responsible for
oridonin-induced HepG2 cell death.
Materials and methods
Reagents
Oridonin was purchased from Shanghai Shamrock Imp.
& Exp. Trading Co., Ltd. (Shanghai, China). Its purity was
determined to be 97% by HPLC. Immobilized pH gradient (IPG) strips,
dithiothreitol (DTT), the 2D Clean-Up Kit and the 2D Quant Kit were
obtained from GE Healthcare. MTT
[3-(4,5-dimethylthiazol-2-yl)-2,5-diphenyltetrazolium bromide] was
from USB Corporation. Trypsin was from Promega Corporation
(Madison, WI, USA). Silver nitrate, Rhodamine 123 and
4,6-diamidino-2-phenylindole (DAPI) were from Sigma-Aldrich
Biotechnology. Power SYBR-Green PCR Master Mixture was obtained
from Applied Biosystems. Protease inhibitor cocktail, phosphatase
inhibitor cocktail and FuGENE HD transfection reagent were from
Roche Bioscience. The mitochondria isolation kit was from Beijing
Applygen Technologies Inc. Bio-Rad protein assay was from Bio-Rad
Laboratories, Inc. Iodoacetamide (IAA), nitrocellulose membranes
and ECL detection reagents were purchased from Amersham
Biosciences. p-JNK (Thr183/Tyr185), p-p38 (Thr180/Tyr182), p-p53
(Ser15), cytochrome c and cleaved caspase-3 antibodies were
from Cell Signaling Technology. Hsp70, Bcl-2, caspase-3, caspase-9,
β-actin and anti-rabbit IgG antibodies (horseradish
peroxidase-conjugated) as well as the Hsp70 shRNA and control shRNA
were from Santa Cruz Biotechnology (Santa Cruz, CA, USA). The
SuperScript II reverse transcription kit, TRIzol reagent,
CM-H2DCFDA and the anti-mouse IgG antibody (horseradish
peroxidase conjugated) were obtained from Invitrogen
Biotechnology.
Cell culture
HepG2 cells (ATCC, Manassas, VA, USA), grown in
Dulbecco’s modified Eagle’s medium (DMEM; Gibco, Carlsbad CA, USA)
supplemented with 10% fetal bovine serum (FBS; Gibco) and 1%
penicillin/streptomycin (P/S, Gibco) were cultured at 37°C in an
atmosphere containing 5% CO2.
Determination of cell viability
Cell viability was assessed by the MTT assay. HepG2
cells (5.0×10³/well) were seeded and grown in 96-well
plates for 24 h and then treated with various concentrations of
oridonin. Control cells were treated with 0.1% DMSO. After a 24-h
incubation, 10 μl of 5 mg/ml MTT solution was added to each well,
and the plates were incubated at 37°C for 4 h. Following medium
removal, 100 μl of DMSO was added to each well and the plates were
gently shaken for 5 min. Optical absorbance was determined at 570
nm with a microplate spectrophotometer (BD Biosciences, Franklin
Lakes, NJ, USA). The absorbance obtained by vehicle-treated cells
was considered to represent 100% cell survival. Each treatment was
performed in triplicate and each experiment was repeated six
times.
Fluorescence microscopic analysis of
apoptosis
Apoptotic morphological alterations were monitored
in DAPI-stained cells. Cells (40×104) were grown for 24
h on coverslips in 35-mm dishes in the presence or absence of 40 μM
oridonin. Coverslips were carefully washed with PBS, fixed with 4%
paraformaldehyde for 10 min and incubated with 10 μg/ml DAPI for 10
min. Cells were washed with PBS and observed under a fluorescence
microscope (Nikon, Tokyo, Japan).
Proteomic sample preparation and
2-DE
Cells were seeded in 100-mm culture dishes at
1.5×10⁶ cells/dish, incubated overnight and then treated
with 40 μM oridonin for 24 h. Cells were harvested by
trypsinization, washed three times with isotonic buffer (10 mM
Tris, 250 mM sucrose, pH 7.2) and lysed in a lysis buffer (8 M
urea, 4% CHAPS, 40 mM DTT and 0.5% IPG buffer pH 3.0–10.0 NL) by
gentle shaking for 60 min on ice. Extracts were centrifuged at
25,000 × g for 60 min at 4°C. Supernatants were purified with the
2D Clean-Up Kit following the manufacturer’s instructions. The
protein concentration of each purified sample was determined using
the 2D Quant Kit, and protein samples were stored in aliquots at
−80°C until further analysis.
First-dimension separation was performed using 13-cm
IPG strips (pH 3.0–10.0 NL). Samples were diluted in rehydration
solution containing 8 M urea, 2% CHAPS, 0.5% IPG buffer, 0.002%
bromophenol blue and 0.28% DTT to reach a final protein load of 100
μg (in 250 μl) per strip. IPG strips were actively rehydrated at 30
V for 12 h, focused at 500 V for 2.5 h, 1,000 V for 0.5 h, and then
the voltage was increased to 8,000 V gradually over the next 3 h
and maintained at 8,000 V for 40,000 Vh. Prior to the
second-dimension separation, IPG strips were equilibrated in
equilibration buffer (6 M urea, 75 mM Tris-HCl pH 8.8, 29.3%
glycerol, 2% SDS) containing 1% (w/v) DTT for 15 min and then in
the same equilibration buffer containing 2.5% IAA for a further 15
min. The second-dimension separation was carried out on 10%
SDS-PAGE (20 mA/gel, 10 min; 25 mA/gel, 260 min).
Silver staining and image analysis
Protein spots were visualized by silver staining.
Gels were fixed overnight in fixing solution (40% v/v methanol and
10% v/v acetic acid) and then treated for 30 min with sensitizing
solution (30% ethanol, 4.05% w/v sodium acetate and 0.2% sodium
thiosulfate). Each gel was washed three times with Milli-Q water
for 5 min each, stained for 40 min in 0.1% silver nitrate solution
and then developed by incubation with a developing solution (2.5%
w/v sodium carbonate and 0.02% formaldehyde) until protein spots
appeared. The developing reaction was terminated by putting gels in
the stopping solution (1.46% w/v EDTA, disodium salt) for 10 min,
and finally gels were washed three times with Milli-Q water for 5
min each.
The stained gels were scanned with a LabScan 6.0
software installed image scanner (GE Healthcare, Pittsburgh, PA,
USA), and data were analyzed using the ImageMaster 2D Platinum 6.0
software (GE Healthcare). The intensity volume of each spot was
processed by background subtraction and total spot volume
normalization, and the resulting spot volume percentage was used
for comparison. Only those significantly (Student’s t-test;
P<0.05) and consistently upregulated or downregulated spots
(>2 fold) or spots which appeared or disappeared after treatment
in three independent experiments were selected for in-gel digestion
and MALDI-TOF-MS/MS analysis.
In-gel digestion and MALDI-TOF-MS/MS
analysis
Protein spots were excised from gels, and each
sample was transferred to a 1.5-ml Eppendorf tube and de-stained in
a freshly prepared de-staining solution (15 mM potassium
ferricyanate and 50 mM sodium thiosulfate) until the brownish color
disappeared. Each de-stained sample was washed in 10 mM ammonium
bicarbonate (NH4HCO3) for 5 min, 10 mM
NH4HCO3 containing 10 mM DTT for 15 min at
56°C, 10 mM NH4HCO3 containing 55 mM IAA for
20 min at room temperature in the dark, and 10 mM
NH4HCO3 containing 50% ACN for 15 min. After
drying in a Vacufuge concentrator (Eppendorf, Hamburg, Germany),
each sample was incubated at 37°C overnight in 5 μl of 5 μg/ml
Trypsin Gold solution. The supernatant was collected and the gel
was further extracted with 1% formic acid. The extracts were
combined and dried in a Vacufuge concentrator and resuspended in
formic acid for MS analysis. The mass spectra were obtained using
the Bruker Autoflex III MALDI-TOF/TOF mass spectrometer (Bruker
Daltonics, Billerica, MA, USA). Protein identification was
performed automatically by searching the Swiss-Prot 55.3 database
using the Mascot 2.04 search engine (Matrix Science, Ltd., London,
UK). Database searches were carried out using the following
parameters: type of search, MS/MS ion search; enzyme, trypsin; and
allowance of one missed cleavage. Carbamidomethylation was selected
as a fixed modification and oxidation of methionine was allowed to
be variable. The peptide and fragment mass tolerance were set at 50
ppm and 0.5 Da, respectively. The instrument was selected as
MALDI-TOF-TOF. Proteins with probability-based MOWSE scores
(P<0.05) were considered to be positively identified.
Western blot analysis
Cells were collected and proteins were extracted
with RIPA lysis buffer [50 mM Tris-Cl, 1% v/v NP-40, 0.35% w/v
sodium deoxycholate, 150 mM NaCl, 1 mM EDTA, 1 mM EGTA, pH 7.4, 1
mM phenylmethylsulfonyl fluoride (PMSF), 1 mM NaF, 1 mM
Na3VO4] containing a protease inhibitor
cocktail and phosphatase inhibitor cocktail. Mitochondrial and
cytoplasmic extracts were prepared with a mitochondria isolation
kit following the manufacturer’s instructions. The protein
concentration was determined using the Bio-Rad protein assay.
Individual protein samples (20–50 μg) were separated by SDS-PAGE
and then electrotransferred onto nitrocellulose membranes. The
membranes were blocked for 30 min with 3% skim milk in TBST buffer
composed of 50 mM Tris (pH 7.6), 150 mM NaCl and 0.1% Tween-20 and
incubated with primary antibodies overnight at 4°C followed by
incubation with horseradish peroxidase-conjugated secondary
antibodies. Protein signals were visualized by ECL detection
reagents according to the manufacturer’s instructions.
qPCR
Cells were treated with 40 μM oridonin for the
indicated durations, and total RNA was isolated using TRIzol
reagent according to the manufacturer’s protocol. Five micrograms
of RNA was used for reverse transcription by oligo-dT using the
SuperScript II reverse transcription kit. The qPCR primers were
designed as follows: Hsp70-1 (sense 5′-caga acaagcgag ccgtgagg-3′
and antisense 5′-tcgtgaatctgggccttg tcc-3′), Hop (sense
5′-tgtaaggaggcggcagacgg-3′ and antisense 5′-taaggc
gcatggctgggtca-3′). To normalize the amounts of RNA in samples, a
PCR reaction was also performed with primers of β-actin (sense
5′-gactacctcatgaagatc-3′ and antisense 5′-gatccacatctgctggaa-3′).
qPCR was performed in a total volume of 20 μl, with 1X Power
SYBR-Green PCR Master Mixture in the 7500 Fast Real-time PCR system
(Applied Biosystems, Foster City, CA, USA). All samples were run in
triplicate. The cycling parameters for qPCR reaction included 40
cycles of 95°C for 15 sec and 60°C for 60 sec. The amplification of
specific transcripts was confirmed by melting curve profiles
generated at the end of the PCR program. Cycle threshold (Ct)
values were normalized to β-actin, and comparative quantification
of the target gene was carried out using the ΔΔCT method.
Transient transfection of Hsp70
shRNA
Transient HSPA1 gene silencing was attained by
transfection of Hsp70 shRNA into HepG2 cells using FuGENE HD
transfection reagent according to the manufacturer’s instruction.
HepG2 cells were grown in 6-well plates overnight to achieve
>80% confluency at the time of transfection and then were
transfected with 4 μg of Hsp70 shRNA or control shRNA and 6 μl
FuGENE HD transfection reagent. The transfection reagents/shRNA
complex was diluted with DMEM (FBS and antibiotic-free) to a total
transfection volume of 2 ml and incubation was carried out for 6 h
at 37°C until the medium was discarded and replaced with growth
medium (DMEM with 10% FBS). Cells were incubated at 37°C for a
further 30 h and then subjected to 40 μM oridonin treatment for 12
h. The cells were then collected for verification of protein
expression by western blotting. Cell viability was determined by
MTT assay.
Measurement of intracellular ROS
production
The dye, CM-H2DCFDA, which becomes
fluorescent after cellular oxidation, was used for ROS detection.
HepG2 cells were treated with 40 μM oridonin in the absence or
presence of 2.5 mM NAC, an ROS scavenger. After 24 h, cells were
harvested and washed with PBS. The washed cells were resuspended in
PBS containing 10 μM CM-H2DCFDA and incubated at 37°C in
the dark for 30 min. The levels of ROS were then determined by flow
cytometry.
Observation of mitochondrial membrane
potential (MMP)
MMP was determined by the fluorescent dye Rhodamine
123. After incubation with 40 μM oridonin for 6 h, cells were
collected, resuspended in l μM Rhodamine 123 and stained at 37°C
for 15 min. The fluorescence intensity of the cells was analyzed by
flow cytometry.
Data analysis
All results are expressed as the mean ± SEM, and
statistical analyses were performed using the Student’s t-test.
Results
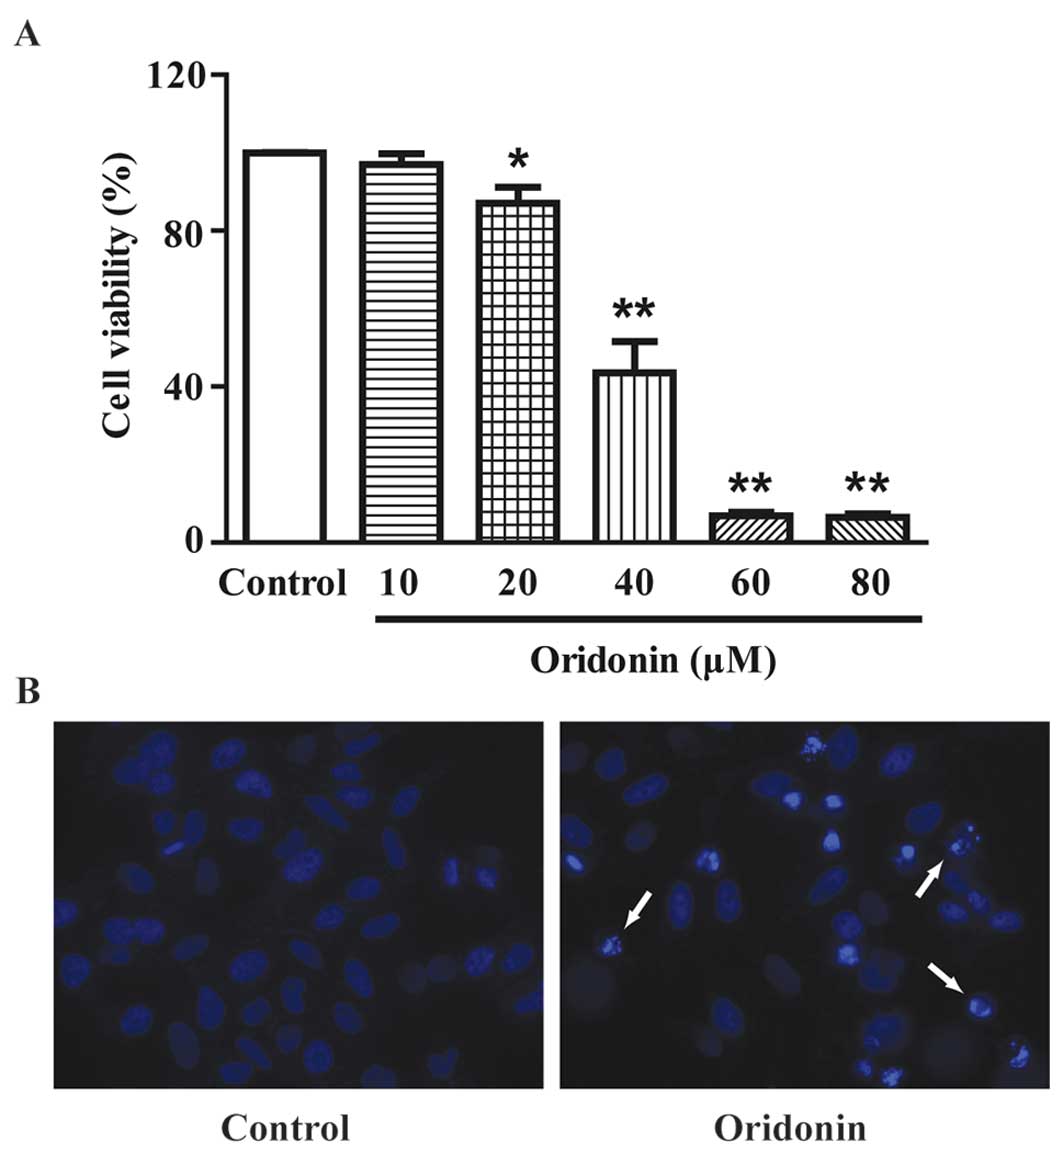
Oridonin inhibits cell proliferation and
induces apoptosis in HepG2 cells
MTT assay showed that treatment with oridonin for 24
h resulted in a marked decrease in cell viability in a
dose-dependent manner (Fig. 2A).
The IC50 value was determined as 37.90 μM for the 24-h
treatment from a dose-response curve with GraphPad Prism 5.0
software (GraphPad Software, San Diego, CA, USA). In the subsequent
assays, 40 μM oridonin was used. DAPI staining showed that a 24-h
treatment of 40 μM oridonin induced the apoptosis of HepG2 cells.
Typical apoptotic nuclear alterations (chromatin condensation,
nuclear fragmentation, appearance of apoptotic bodies) were
observed in the oridonin-treated cells (Fig. 2B).
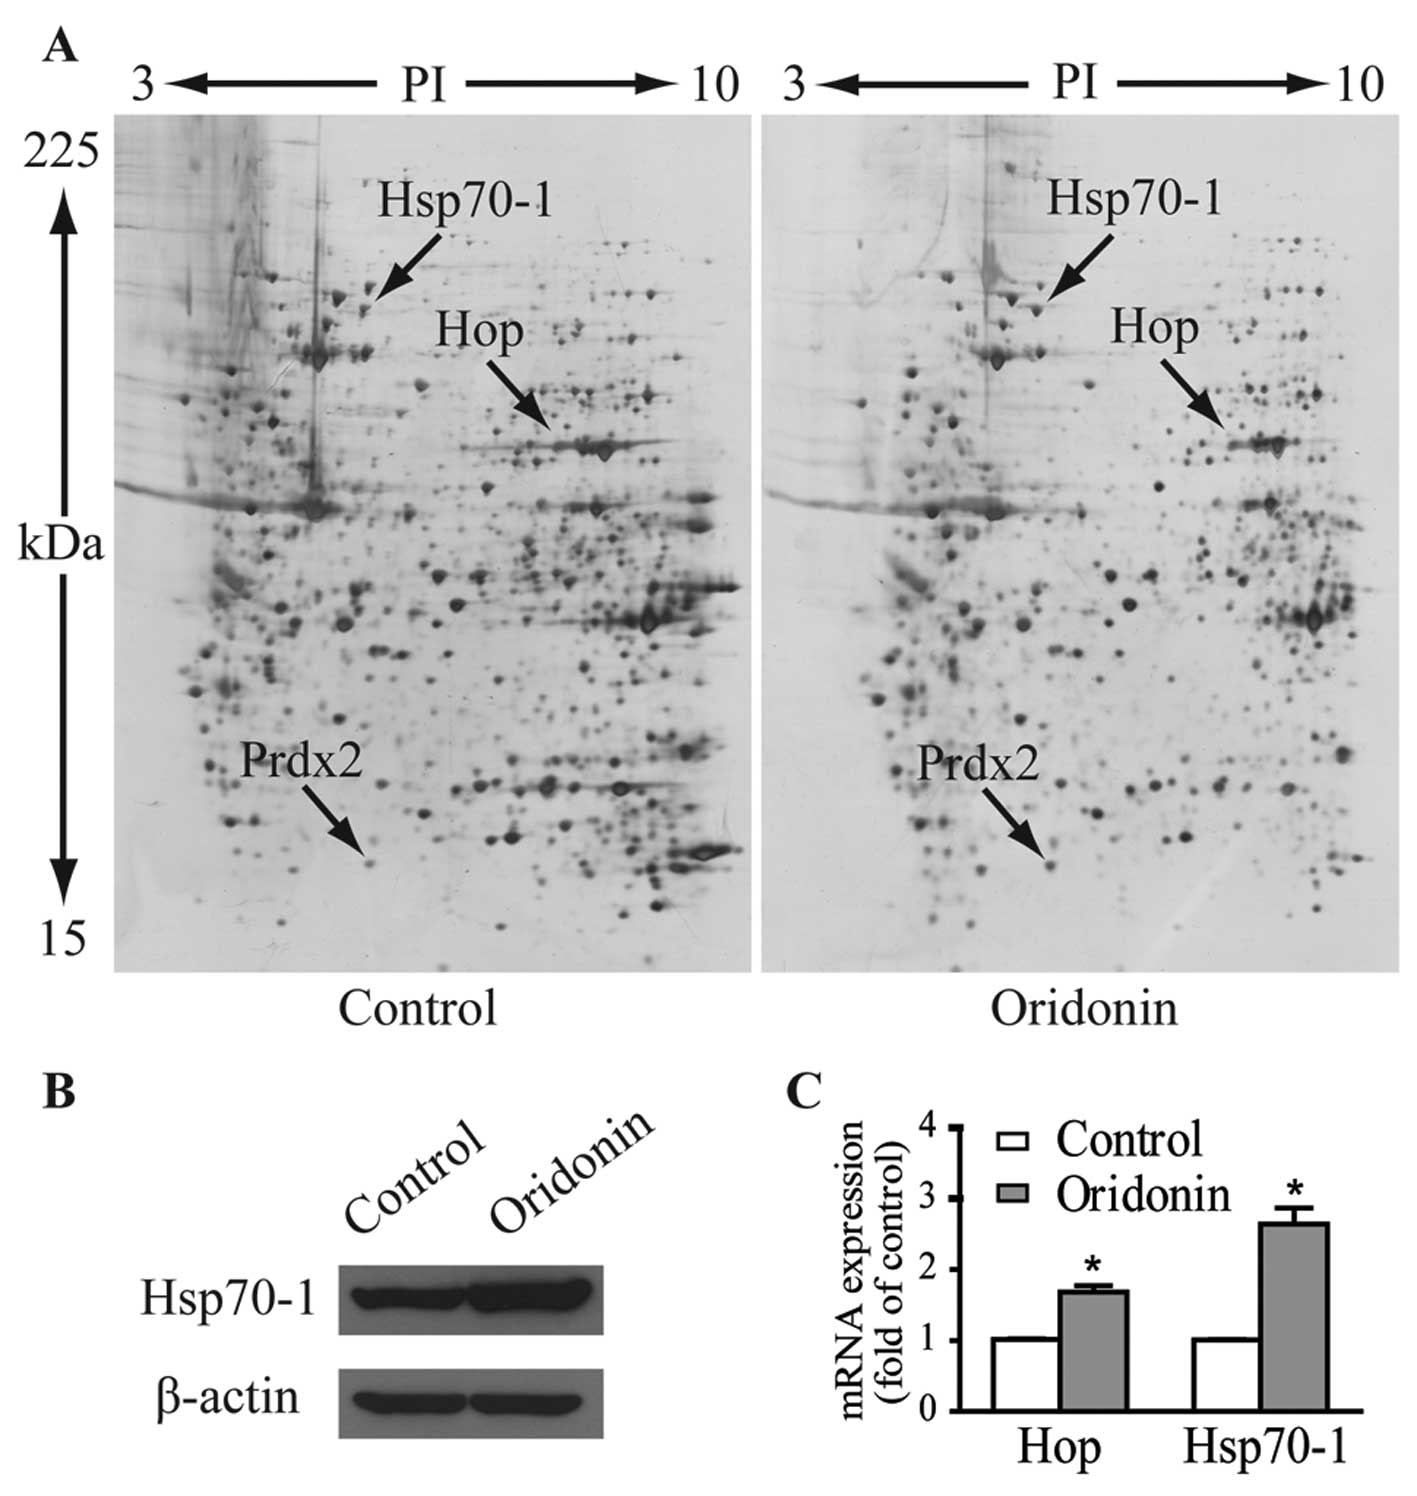
Differentially expressed proteins in the
oridonin-treated HepG2 cells
In an attempt to identify molecular changes
following oridonin treatment, we monitored differential protein
expression in the HepG2 cells treated with 40 μM oridonin or
vehicle for 24 h using 2-DE-based proteomics. To ascertain
reproducibility of results, 2-DE was performed three times for each
protein sample, and each treatment was repeated three times.
Fig. 3A shows the representative
gel images. Proteins within the range of 15–225 kDa and with
isoelectric point (pI) between 3 to 10 were well separated. Over
1,000 spots were detected on each gel. Three protein spots of
interest with fold-changes >2 in terms of volume intensity in
both triplicate gels and three independent experiments were cut
from the gels and analyzed by MALDI-TOF-MS/MS after trypsin
digestion. As listed in Table I,
these upregulated spots were identified as heat shock 70-kDa
protein 1 (Hsp70-1, gene name HSPA1), Hsc70/Hsp90-organizing
protein (Hop/Sti1, gene name STIP1) and peroxiredoxin-2
(Prdx2, gene name PRDX2).
 | Table ISummary of differentially expressed
proteins in the oridonin-treated HepG2 cells. |
Table I
Summary of differentially expressed
proteins in the oridonin-treated HepG2 cells.
| Protein names | MW | pI | MS/MS scores | Fold-changea |
|---|
| Heat shock 70-kDa
protein 1 | 70,294 | 5.48 | 212 | +2.08 |
|
Hsc70/Hsp90-organizing protein | 63,227 | 6.40 | 88 | +b |
|
Peroxiredoxin-2 | 22,049 | 5.66 | 192 | +2.45 |
The protein expression level of Hsp70-1 in response
to 40 μM oridonin treatment was verified by western blotting
(Fig. 3B). Expression levels of
mRNA as determined by qPCR for Hsp70-1 and Hop were 2.64- and
1.68-fold higher than these levels in the control cells (Fig. 3C), which are comparable to their
protein expression patterns.
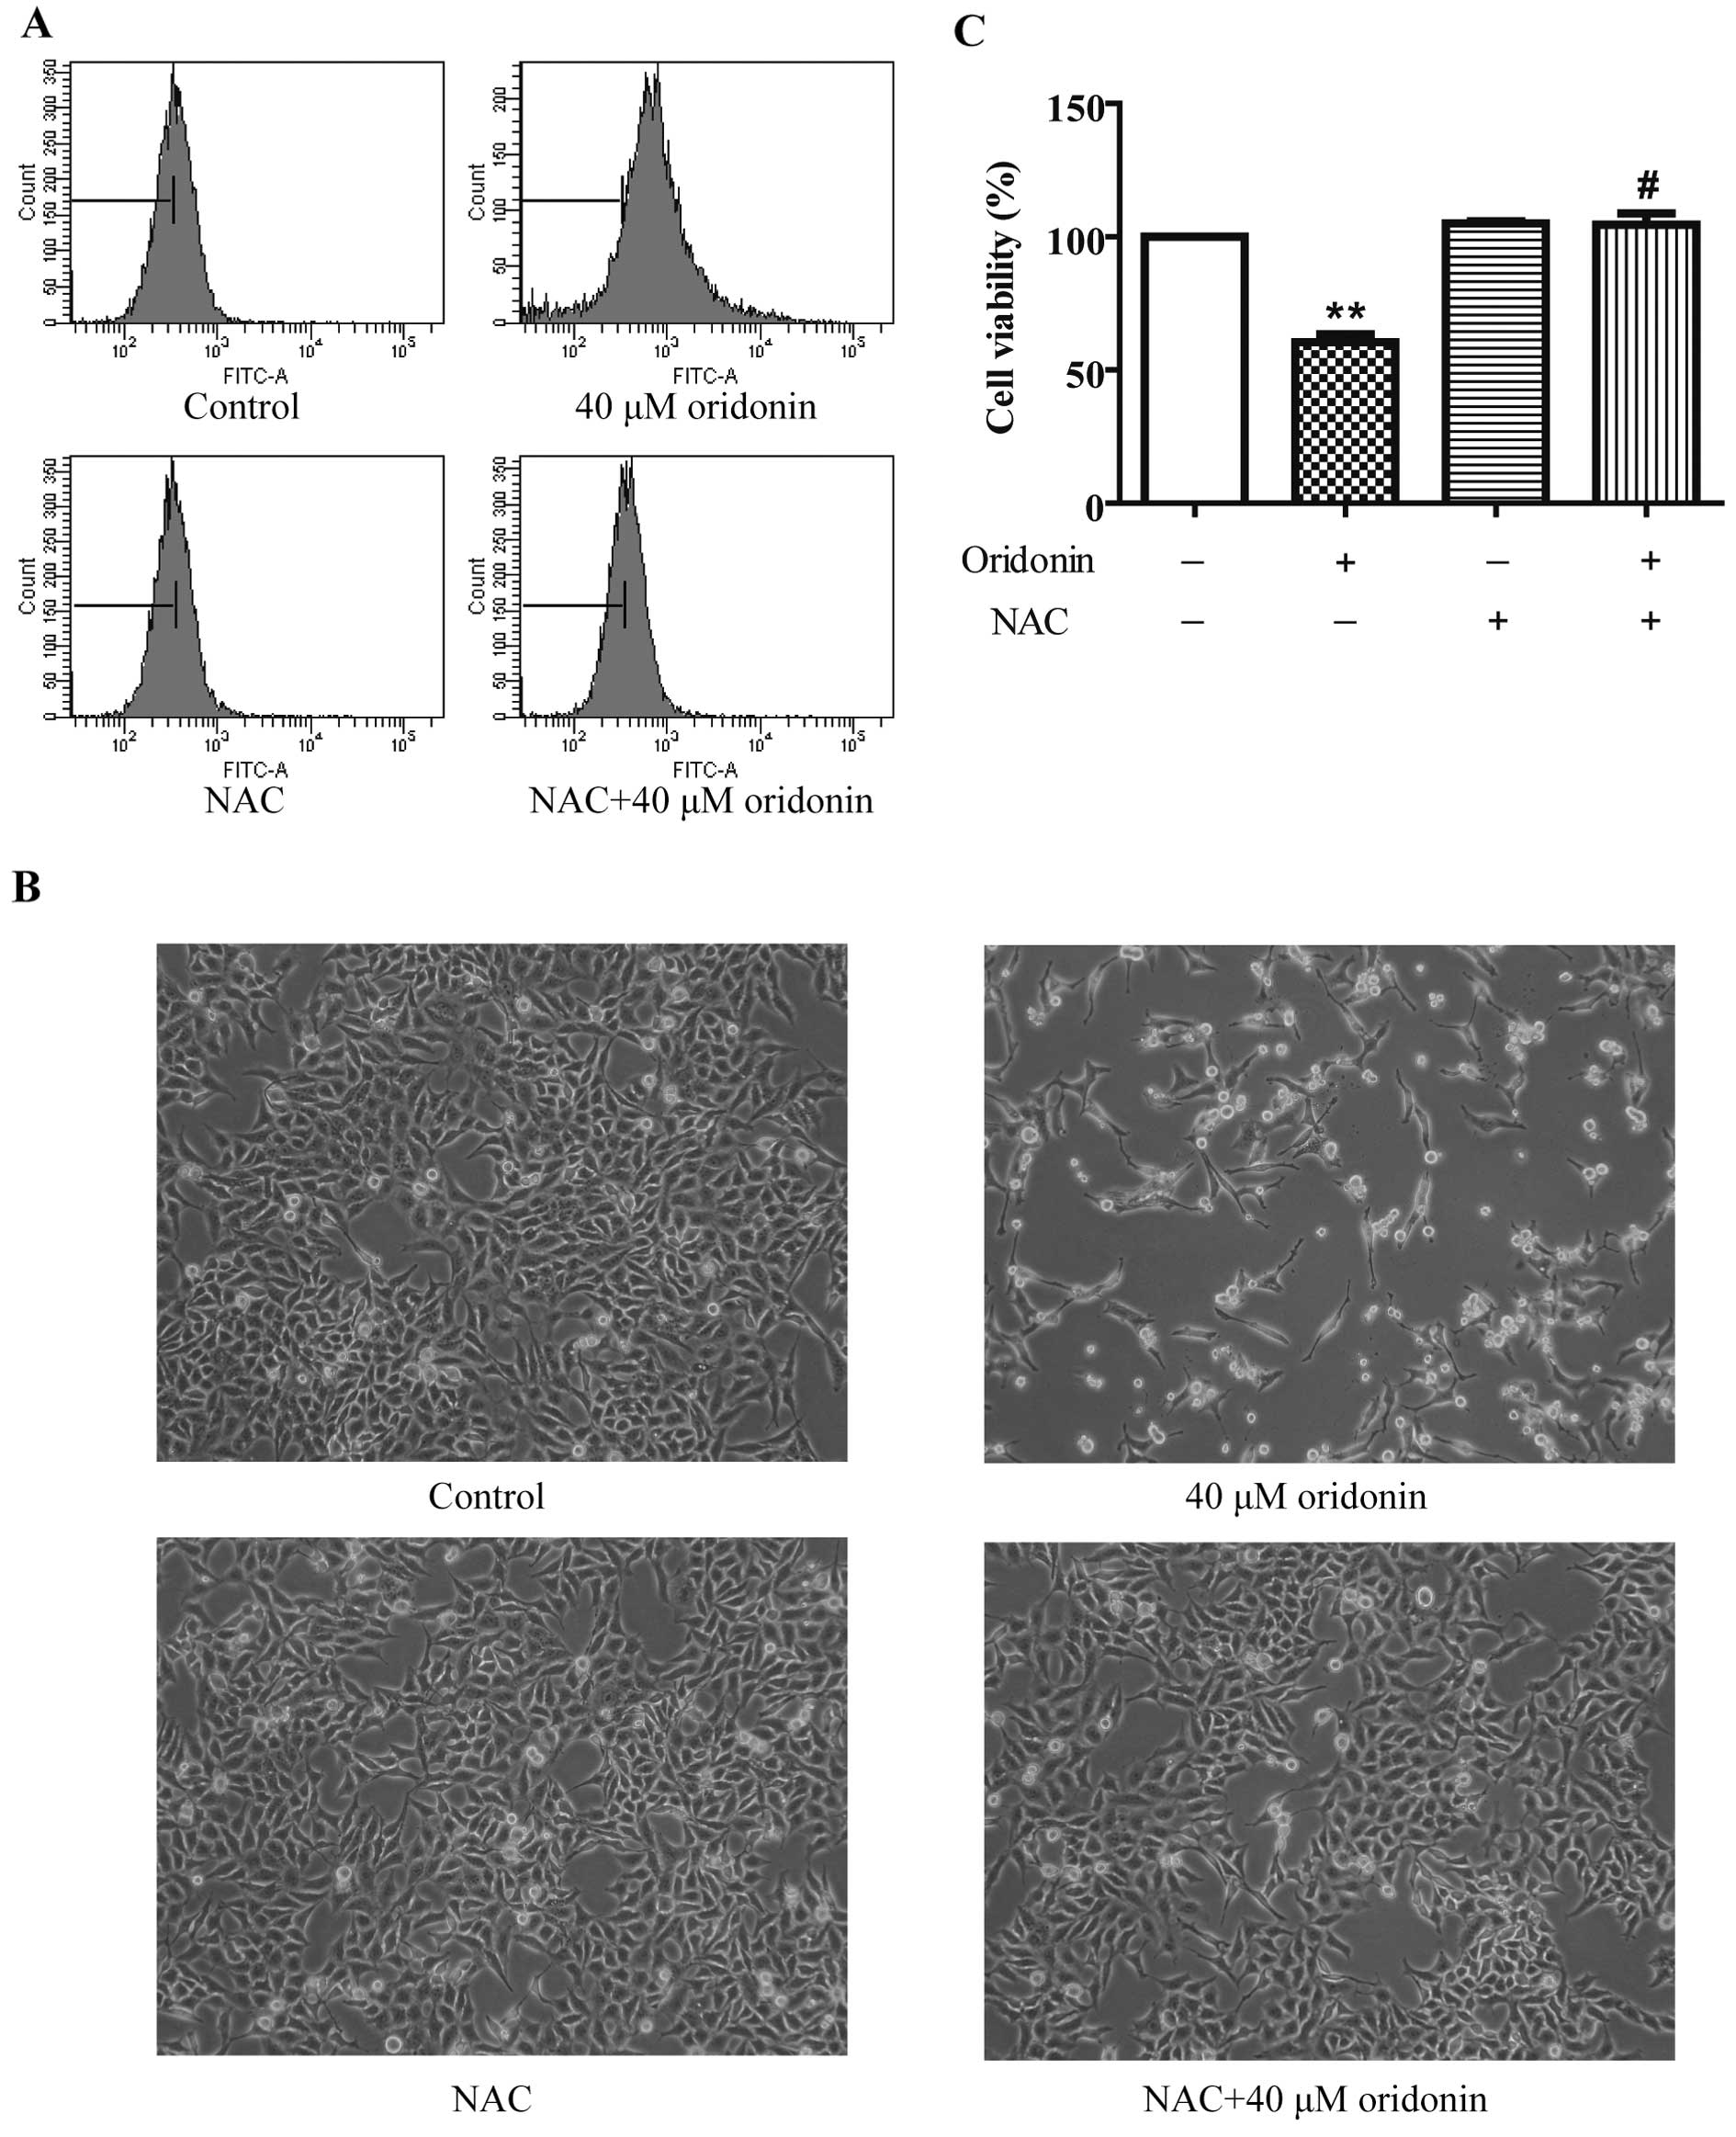
Oridonin-induced ROS production is
responsible for cell death in HepG2 cells
Hsp70 acts as a stress sensor and its expression is
induced by a variety of stimuli that give rise to cellular
oxidation (10). Hop is an
extensively studied co-chaperone that not only directly binds to
Hsp70 and Hsp90, but also modulates the activities of these
chaperones. Overexpression of the Hop gene at the earliest time
during stress may be required to mediate the stress response of the
inducible Hsp70 (11). Prdx2
belongs to the 2-Cys subgroup of peroxiredoxins (Prdxs). Prdxs are
a family of antioxidative proteins and in mammals the family
consists of six members (12,13).
They have been reported to be increased in stressed cells induced
by oxidants such as H2O2 (14–16) or
ionizing radiation (17). Taken
together, the overexpression of Hsp70-1, Hop and Prdx2 indicates
that oridonin induces oxidative stress.
To investigate whether oridonin induces oxidative
stress in HepG2 cells, the intracellular ROS level was measured by
detecting the fluorescent intensity of ROS-specific probe
CM-H2DCFDA after a 40 μM oridonin treatment. As shown in
Fig. 4A, the ROS level increased at
24 h, and 2.5 mM of the ROS scavenger NAC markedly decreased ROS
production in the oridonin-treated HepG2 cells. To explore whether
ROS act as a protective factor in the oridonin-treated HepG2 cells,
cells were co-incubated with 2.5 mM NAC and 40 μM oridonin for 24
h. NAC completely inhibited oridonin-induced cell death (Fig. 4B). Cell viability was 104.50±4.31%
in the NAC and oridonin-treated cells vs. 60.49±2.89% in the
oridonin-treated cells (Fig. 4C).
These results suggest that ROS generation plays a role in the
antiproliferative activity of oridonin in HepG2 cells.
Oridonin-induced ROS generation results
in apoptosis through the activation of JNK and p38 pathways
Oxidative stress resulting from excessive production
of ROS triggers apoptotic cell death through p38 and JNK pathways
(18). JNK and p38 function as
upstream kinases of p53 phosphorylation and subsequently stabilize
and activate p53 transcriptional activity, leading to diverse
cellular responses, such as apoptosis (19). Bcl-2 and caspase families are
required to mediate p53-dependent apoptosis (20).
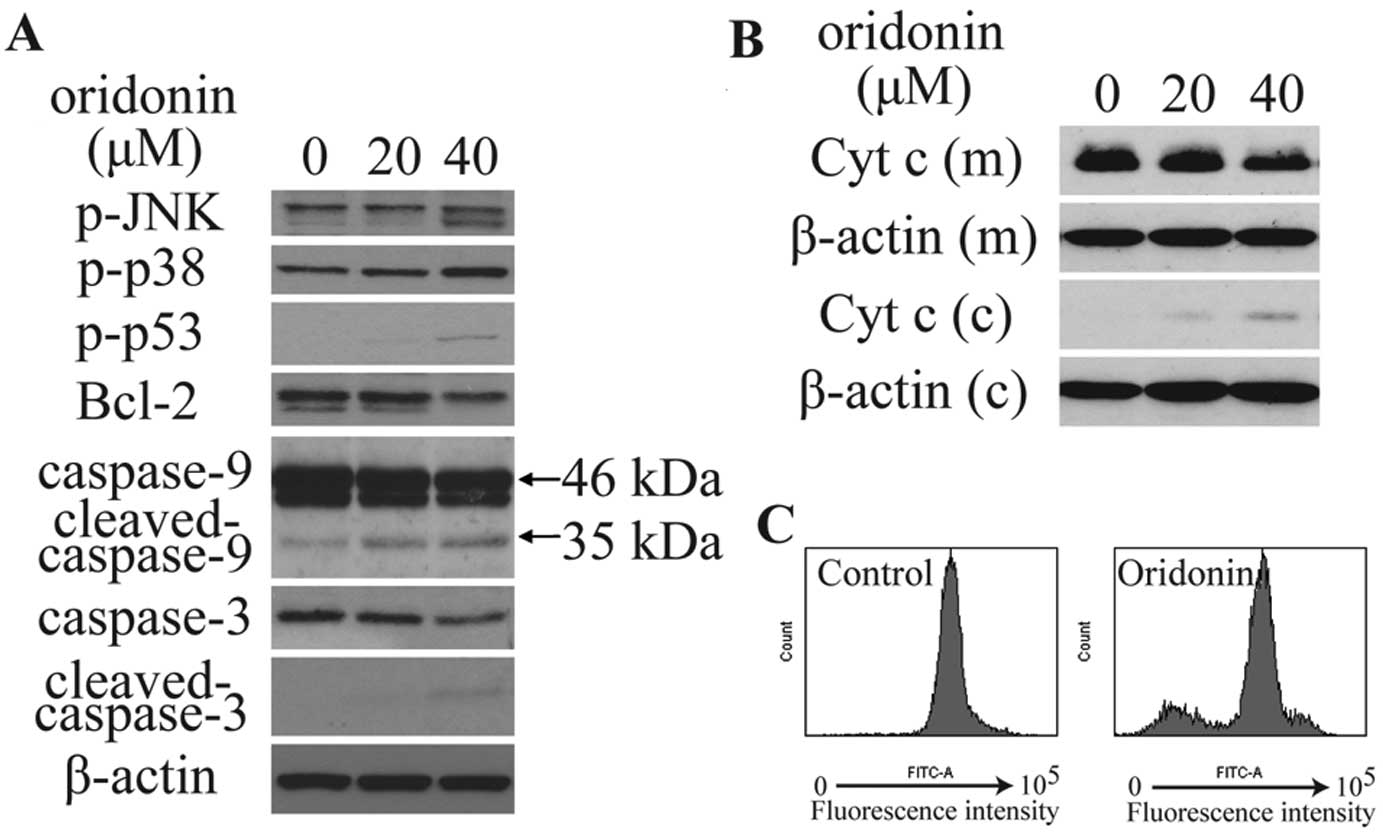
To determine whether p38 and JNK pathways are
involved in the anticancer effects of oridonin in HepG2 cells,
immunoblotting was conducted. As shown in Fig. 5A and B, oridonin treatment
significantly increased phosphorylated p38 (p-p38), p-JNK and
p-p53, and decreased the expression of Bcl-2, mitochondrial
cytochrome c, caspase-9 (46 kDa) and caspase-3, increased
the expression of cytoplasmic cytochrome c, as well as
activated the cleavage of caspase-9 (35 kDa) and caspase-3. The
integrity of the mitochondrial membranes was examined by flow
cytometry in Rhodamine 123-stained cells. Results showed that
treatment with 40 μM oridonin for 6 h significantly decreased
Rhodamine 123 fluorescence intensity (Fig. 5C). This observation suggests that
oridonin treatment decreased MMP in HepG2 cells.
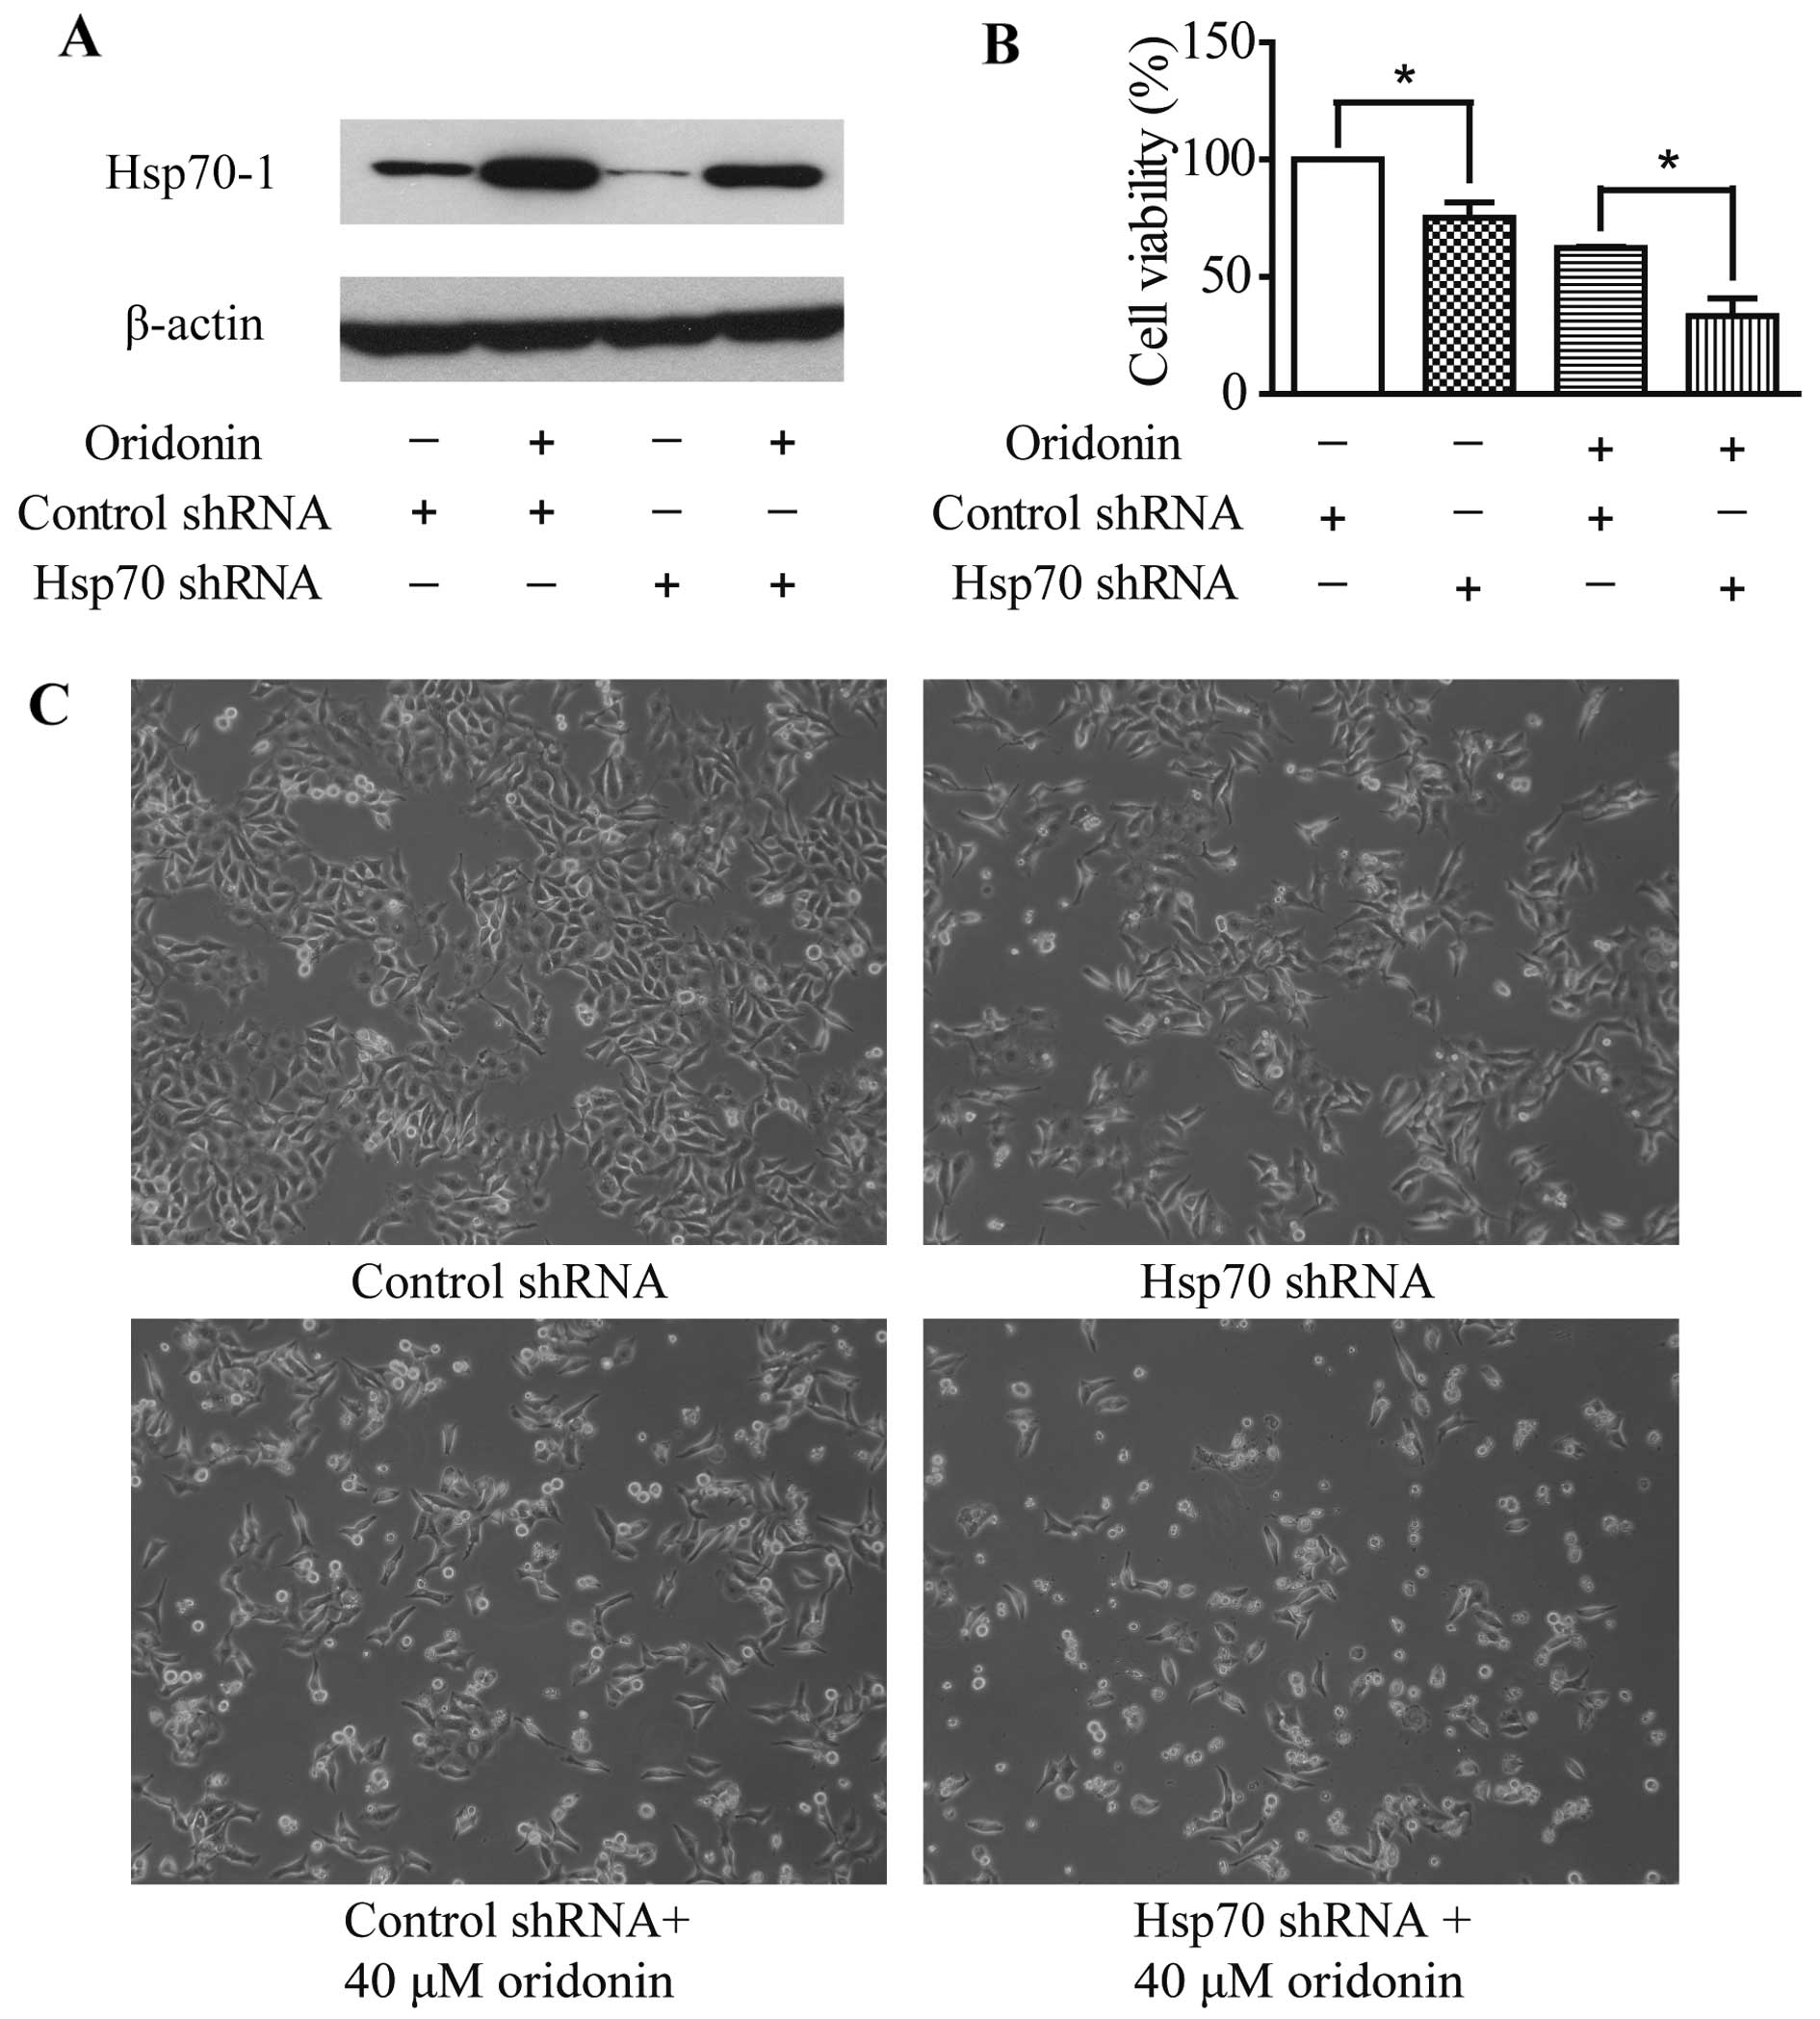
Hsp70-1 knockdown increases the
antiproliferative effect of oridonin
To investigate the involvement of Hsp70-1 in the
apoptotic effect of oridonin, HepG2 cells were transfected with
Hsp70 shRNA. Control cells were transfected with the control shRNA
plasmid. Oridonin treatment caused Hsp70-1 induction and transient
transfection of Hsp70-specific shRNA suppressed Hsp70-1 expression
with or without 12-h oridonin treatment (Fig. 6A). Moreover, Hsp70 shRNA
transfection, oridonin treatment or the combination of the two
treatments significantly reduced cell viability (Fig. 6B and C) when compared with the
control cells. These data confirm that Hsp70-1 protects HepG2 cells
against cell death. Furthermore, Hsp70-1 knockdown led to the
increased sensitivity of HepG2 cells to oridonin cytotoxicity,
which suggests that Hsp70-1 acts as a protective factor against
oridonin-induced oxidative stress in HepG2 cells.
Discussion
Oridonin, one of the main bioactive ent-kaurane
diterpenoids of R. rubescens, possesses anticancer
activities. Oridonin can induce G2/M arrest and apoptosis in human
hepatocellular carcinoma cells (21,22).
Multiple mechanisms such as inhibition of telomerase, regulation of
MAPK signaling pathways and induction of endoplasmic reticulum
stress have been implicated in the anticancer activity of oridonin
(4,21,23,24).
In the present study, using a 2-DE-based proteomic approach, we
found that the expression levels of oxidative stress markers Prdx2,
Hsp70-1 and Hop were altered following oridonin treatment.
Free radicals and reactive molecules containing
oxygen such as singlet oxygen, superoxides, peroxides are known as
ROS and can cause oxidative stress in cells (18). It has been suggested that oxidative
stress in response to a low concentration of ROS may be essential
to cellular signaling and proliferation. However, excessive
production of ROS may damage various intracellular molecules,
leading to severe oxidative stress accompanied by loss of cell
function and possibly apoptosis (25). Many studies have shown that
apoptosis is closely associated with excessive production of ROS
(26–28). Since our proteomic analysis
identified several proteins related to oxidative stress, we
investigated whether oxidative stress occurs in oridonin-treated
HepG2 cells and explored the role of oxidative stress in the
anticancer activities of oridonin in HepG2 cells. We detected the
level of reactive oxygen species (ROS) following oridonin treatment
for 24 h and found that oridonin promoted ROS generation, and ROS
scavenger N-acetylcysteine (NAC) completely inhibited ROS
production and restored cell viability, suggesting that ROS
generation contributed to oridonin-induced HepG2 cell death.
Although a low dose of oridonin (1.4 μM) is reported to decrease
ROS formation and improve cell survival after arsenic treatment
(29), therapeutic doses of
oridonin are shown to selectively induce apoptosis in various cells
through sustained oxidative stress (30–33).
Among many signaling pathways known to be redox
sensitive, the MAPK pathway has been well studied. A relative high
concentration of ROS may induce activation of JNK and p38 MAPK
pathways and contribute to apoptosis (25,34).
MAPKs have been shown to phosphorylate p53 at various residues in
response to different stressful stimuli, and such phosphorylation
can initiate p53 activation and lead to p53-dependent apoptosis
(19). Activation of p53 suppresses
the expression of anti-apoptotic Bcl-2 protein which prevents the
release of mitochondrial cytochrome c. Through inhibition of
Bcl-2, p53 promotes the release of cytochrome c from the
mitochondrial intermembrane space into the cytoplasm (20). Cytochrome c release is
frequently coincident with a disruption of the mitochondrial
membrane potential (MMP). Released cytochrome c forms an
apoptosome complex with caspase-9 and adaptor protein Apaf-1.
Caspase-9 is activated following recruitment into the apoptosome
and then cleaves and activates effector caspases, such as caspase-3
(35). The cleavage of substrates
of caspase-3 significantly alters the cell physiology toward
apoptosis (20). We next
investigated the involvement of these molecules in oridonin-induced
apoptosis by immunoblotting. In oridonin-treated cells, increased
expression of p-p38 and p-JNK was accompanied by the upregulation
of phosphorylated p53 at serine 5. The activation of p53 decreased
the expression of Bcl-2, which triggered mitochondrial cytochrome
c release, thus suppressing MMP and activating caspase
cascades in HepG2 cells. In agreement with our observations,
activation of p38 was reported to be dependent on ROS generation,
and p38 and p53 inhibitors have been reported to significantly
reduce oridonin-induced apoptosis in HepG2 cells (32).
Abnormal changes in the cellular redox status cause
chaperone induction. Chaperones may act as protective factors
against cytoplasmic oxidative stress (10). Since upregulation of oxidative
stress marker Hsp70-1 was associated with oridonin treatment in
HepG2 cells, we investigated the role of Hsp70-1 in the
antiproliferative effect of oridonin by Hsp70-1 shRNA plasmid
transfection. Hsp70-1 knockdown enhanced the sensitivity of HepG2
cells to oridonin-induced cell death. These findings suggest that
Hsp70-1 acts as a protective factor against oridonin-induced
oxidative stress in HepG2 cells, and also demonstrates the
induction of oxidative stress by oridonin.
Collectively, proteomic analysis revealed that
oxidative stress markers Prdx2, Hsp70-1 and Sti1 are involved in
the anticancer effects of oridonin. Oxidative stress pathways are
activated in oridonin-treated HepG2 cells. Hsp70-1 acts as a
protective factor against oxidative stress in HepG2 cells. These
results shed new light on the anti-hepatoma mechanisms of oridonin.
Further research is needed to explore the mechanisms by which ROS
mediate the apoptotic activity of oridonin.
Acknowledgements
The present study was supported by a grant
(HKBU262512) from the Research Grant Council of Hong Kong and
National Natural Science Foundation of China (grant no. 81303292
and 31300737).
References
|
1
|
Gao X, Liu SZ, Liu QL, Liu YY, Zeng DL and
Deng MD: Clinical study on anti-cancer effects of Rabdosia
rubescens. Chin J Cancer. 3:201–202. 1984.
|
|
2
|
Zhang JF, Chen GH, Lu MQ and Liu JJ:
Antiproliferation effects of oridonin on hepatocellular carcinoma
BEL-7402 cells and its mechanism. Chin Traditional Patent Med.
28:1325–1329. 2006.
|
|
3
|
Huang J, Wei XY, Sun BH, Wu LJ and Ikejima
T: Oridonin induced HepG2 cell death partially through TNFα signal
pathway. Modern Chin Med. 12:28–32. 2010.
|
|
4
|
Cai DT, Jin H, Xiong QX, et al: ER stress
and ASK1-JNK activation contribute to oridonin-induced apoptosis
and growth inhibition in cultured human hepatoblastoma HuH-6 cells.
Mol Cell Biochem. 379:161–169. 2013. View Article : Google Scholar : PubMed/NCBI
|
|
5
|
Wang RL: Therapeutic effects of Isodon
rubescens and oridonin preparations in 31 patients with primary
carcinoma of the liver. Ai Zheng. 3:501984.
|
|
6
|
Ha HL, Shin HJ, Feitelson MA and Yu DY:
Oxidative stress and antioxidants in hepatic pathogenesis. World J
Gastroenterol. 16:6035–6043. 2010. View Article : Google Scholar : PubMed/NCBI
|
|
7
|
Morales-González JA: Oxidative Stress and
Chronic Degenerative Diseases - A Role for Antioxidants. InTech.
http://dx.doi.org/10.5772/45722.
View Article : Google Scholar
|
|
8
|
Fang J, Nakamura H and Iyer AK:
Tumor-targeted induction of oxystress for cancer therapy. J Drug
Target. 15:475–486. 2007. View Article : Google Scholar : PubMed/NCBI
|
|
9
|
Trachootham D, Alexandre J and Huang P:
Targeting cancer cells by ROS-mediated mechanisms: a radical
therapeutic approach? Nat Rev Drug Discov. 8:579–591. 2009.
View Article : Google Scholar : PubMed/NCBI
|
|
10
|
Papp E, Nardai G, Soti C and Csermely P:
Molecular chaperones, stress proteins and redox homeostasis.
Biofactors. 17:249–257. 2003. View Article : Google Scholar : PubMed/NCBI
|
|
11
|
Odunuga OO, Longshaw VM and Blatch GL:
Hop: more than an Hsp70/Hsp90 adaptor protein. Bioessays.
26:1058–1068. 2004. View Article : Google Scholar : PubMed/NCBI
|
|
12
|
Kang SW, Chae HZ, Seo MS, Kim K, Baines IC
and Rhee SG: Mammalian peroxiredoxin isoforms can reduce hydrogen
peroxide generated in response to growth factors and tumor necrosis
factor-α. J Biol Chem. 273:6297–6302. 1998.PubMed/NCBI
|
|
13
|
Kim H, Lee TH, Park ES, et al: Role of
peroxiredoxins in regulating intracellular hydrogen peroxide and
hydrogen peroxide-induced apoptosis in thyroid cells. J Biol Chem.
275:18266–18270. 2000. View Article : Google Scholar : PubMed/NCBI
|
|
14
|
Fratelli M, Demol H, Puype M, et al:
Identification by redox proteomics of glutathionylated proteins in
oxidatively stressed human T lymphocytes. Proc Natl Acad Sci USA.
99:3505–3510. 2002. View Article : Google Scholar : PubMed/NCBI
|
|
15
|
Paron I, D’Elia A, D’Ambrosio C, et al: A
proteomic approach to identify early molecular targets of oxidative
stress in human epithelial lens cells. Biochem J. 378:929–937.
2004. View Article : Google Scholar : PubMed/NCBI
|
|
16
|
Cesaratto L, Vascotto C, D’Ambrosio C, et
al: Overoxidation of peroxiredoxins as an immediate and sensitive
marker of oxidative stress in HepG2 cells and its application to
the redox effects induced by ischemia/reperfusion in human liver.
Free Radic Res. 39:255–268. 2005. View Article : Google Scholar : PubMed/NCBI
|
|
17
|
Wang T, Tamae D, LeBon T, Shively JE, Yen
Y and Li JJ: The role of peroxiredoxin II in radiation-resistant
MCF-7 breast cancer cells. Cancer Res. 65:10338–10346. 2005.
View Article : Google Scholar : PubMed/NCBI
|
|
18
|
Pan JS, Hong MZ and Ren JL: Reactive
oxygen species: a double-edged sword in oncogenesis. World J
Gastroenterol. 15:1702–1707. 2009. View Article : Google Scholar : PubMed/NCBI
|
|
19
|
Wu GS: The functional interactions between
the p53 and MAPK signaling pathways. Cancer Biol Ther. 3:156–161.
2004. View Article : Google Scholar : PubMed/NCBI
|
|
20
|
Shen Y and White E: p53-dependent
apoptosis pathways. Adv Cancer Res. 82:55–84. 2001. View Article : Google Scholar
|
|
21
|
Wang H, Ye Y, Chui JH, et al: Oridonin
induces G2/M cell cycle arrest and apoptosis through MAPK and p53
signaling pathways in HepG2 cells. Oncol Rep. 24:647–651.
2010.PubMed/NCBI
|
|
22
|
Zhang JF, Liu JJ, Liu PQ, Lin DJ, Li XD
and Chen GH: Oridonin inhibits cell growth by induction of
apoptosis on human hepatocelluar carcinoma BEL-7402 cells. Hepatol
Res. 35:104–110. 2006. View Article : Google Scholar : PubMed/NCBI
|
|
23
|
Wang H, Ye Y, Chu JH, Zhu GY, Fong WF and
Yu ZL: Proteomic and functional analyses reveal the potential
involvement of endoplasmic reticulum stress and α-CP1 in the
anticancer activities of oridonin in HepG2 cells. Integr Cancer
Ther. 10:160–167. 2010.PubMed/NCBI
|
|
24
|
Zhang JF, Chen GH, Lu MQ, Li H, Cai CJ and
Yang Y: Change of Bcl-2 expression and telomerase during apoptosis
induced by oridonin on human hepatocelluar carcinoma cells.
Zhongguo Zhong Yao Za Zhi. 31:1811–1814. 2006.(In Chinese).
|
|
25
|
Yoon SO, Yun CH and Chung AS: Dose effect
of oxidative stress on signal transduction in aging. Mech Ageing
Dev. 123:1597–1604. 2002. View Article : Google Scholar : PubMed/NCBI
|
|
26
|
Liu J, Shen HM and Ong CN: Role of
intracellular thiol depletion, mitochondrial dysfunction and
reactive oxygen species in Salvia
miltiorrhiza-induced apoptosis in human hepatoma HepG2 cells.
Life Sci. 69:1833–1850. 2001. View Article : Google Scholar : PubMed/NCBI
|
|
27
|
Datta K, Babbar P, Srivastava T, Sinha S
and Chattopadhyay P: p53 dependent apoptosis in glioma cell lines
in response to hydrogen peroxide induced oxidative stress. Int J
Biochem Cell Biol. 34:148–157. 2002. View Article : Google Scholar : PubMed/NCBI
|
|
28
|
Haruna S, Kuroi R, Kajiwara K, et al:
Induction of apoptosis in HL-60 cells by photochemically generated
hydroxyl radicals. Bioorg Med Chem Lett. 12:675–676. 2002.
View Article : Google Scholar : PubMed/NCBI
|
|
29
|
Du Y, Villeneuve NF, Wang XJ, et al:
Oridonin confers protection against arsenic-induced toxicity
through activation of the Nrf2-mediated defensive response. Environ
Health Perspect. 116:1154–1161. 2008. View Article : Google Scholar : PubMed/NCBI
|
|
30
|
Zang L, He H, Xu Q, et al: Reactive oxygen
species H2O2 and radical •OH, but not
O2• − promote oridonin-induced phagocytosis of apoptotic
cells by human histocytic lymphoma U937 cells. Int Immunopharmacol.
15:414–423. 2013.
|
|
31
|
Cheng Y, Qiu F, Ye YC, et al: Autophagy
inhibits reactive oxygen species-mediated apoptosis via activating
p38-nuclear factor-kappa B survival pathways in oridonin-treated
murine fibrosarcoma L929 cells. FEBS J. 276:1291–1306. 2009.
View Article : Google Scholar
|
|
32
|
Huang J, Wu L, Tashiro S, Onodera S and
Ikejima T: Reactive oxygen species mediate oridonin-induced HepG2
apoptosis through p53, MAPK, and mitochondrial signaling pathways.
J Pharmacol Sci. 107:370–379. 2008. View Article : Google Scholar : PubMed/NCBI
|
|
33
|
Yu Y, Fan SM, Song JK, Tashiro S, Onodera
S and Ikejima T: Hydroxyl radical (•OH) played a pivotal role in
oridonin-induced apoptosis and autophagy in human epidermoid
carcinoma A431 cells. Biol Pharm Bull. 35:2148–2159. 2012.
|
|
34
|
McCubrey JA, Lahair MM and Franklin RA:
Reactive oxygen species-induced activation of the MAP kinase
signaling pathways. Antioxid Redox Signal. 8:1775–1789. 2006.
View Article : Google Scholar : PubMed/NCBI
|
|
35
|
Schuler M and Green DR: Mechanisms of
p53-dependent apoptosis. Biochem Soc Trans. 29:684–688. 2001.
View Article : Google Scholar : PubMed/NCBI
|