Introduction
The cause of death for ~90% of cancer patients is
the metastatic spread of cancer cells from the primary tumour and
the subsequent development of secondary tumours within heterologous
tissues and organs (1). Patients
presenting with symptoms related to localized primary disease
subsequently receive a range of treatments to eradicate the tumour
including surgery, radiation and chemotherapy. Yet, numerous
patients return post-therapy with a developed metastatic lesion at
a secondary site. This suggests that the dissemination of tumours
involving the migration and penetration of tissue barriers by
metastatic cells probably occurs prior to a patient presenting with
the primary tumour. Tissue invasion and metastasis is regarded as
one of the key ‘acquired capabilities or hallmarks’ of malignant
cancer cells proposed by Hanahan and Weinberg (2), and research into the underlying
mechanisms of invasion and metastasis has been a major focus in
biology.
Many tumour cells with high invasive or metastatic
potential possess the ability to form structures known as
invadopodia, via the involvement of numerous adaptor, signalling,
adhesion and proteolytic proteins (3–14). The
proteolytic function of invadopodia is reliant on the cooperative
interactions of the underlying network of these proteins and their
environment. Therefore, as the role of invadopodia in cancer
invasion and metastasis continues to grow, so does the
justification for targeting the regulators of invadopodia in the
treatment of malignant cancers.
A number of studies have shown that the actin
filament-binding protein cortactin (which is encoded by the EMS1
oncogene on chromosome 11q13) promotes actin polymerization and
branching in invadopodium formation (7,15). It
is a key regulatory component of invadopodia and has been shown to
be overexpressed in a number of breast carcinomas and head and neck
cancers that are correlated with tumour invasiveness and poor
prognosis (16). Overexpression of
cortactin in breast carcinoma cells also results in an increased
number of metastases to bone which is regulated by three
phosphorylation sites in cortactin (17). Another actin-associated protein, WIP
(WASP-interacting protein) shown to be essential for invadopodium
formation (18), has also been
observed to have a potential role in cancer cell invasion and
metastasis (19). Analyses were
carried out on microarray data sets concerning the expression of
WIPF1 as a prognostic signature in colorectal breast cancer and
glioma patients with a strong correlation observed between low WIP
expression and improved prognosis in these patients. This
identifies the evolving relevance of invadopodia in tumour cell
dissemination and subsequent cancer mortality.
The epidermal growth factor receptor (EGFR) has also
been linked to invadopodium induction as epidermal growth factor
(EGF) stimulation was found to boost invadopodium formation and
subsequent matrix degradation in mammary carcinoma cells, whereas
suppression of receptor activity with the specific inhibitor,
AG1478, abolished invadopodium formation (18). N-WASP, a protein linked to Src
signalling and invadopodium formation, through its interaction with
WIP was also observed to be critical to the establishment of
invadopodia through this pathway. The involvement of EGF as one of
the drivers of invadopodia is highly significant as EGFR
overexpression and mutations occur in many types of cancers
(20–22). Tks5 (tyrosine kinase substrate with
5 SH3 domains) is a scaffold protein and a substrate of the
tyrosine kinase Src (23), which
has been shown to be required for the organization of invadopodia
in tumour cells (24). A study by
Fekete et al demonstrated that Tks5 is a novel component of
the EGF signalling pathway as EGF treatment of cells results in a
sustained level of Tks5 phosphorylation and translocation to the
plasma membrane (25).
The Tks5 adaptor protein has been shown to be
critical for invadopodium formation and function (3,24,26–28).
We previously observed that the Src-mediated phosphorylation of
Tks5 at tyrosine Y557 promotes its association with the SH3-SH2
domain proteins, Nck1 and Nck2, which in turn drives local actin
dynamics and promotes invadopodium formation in B16F10 melanoma
cells (24). Recently, an essential
role for a Src-Tks5 signalling pathway involving Tks5 tyrosine
phosphorylation was also uncovered in the migration of neural
crest-derived cells during zebrafish embryogenesis supporting the
notion that developmental cell migration might provide default
mechanisms that may also drive invasion and metastasis (29).
Tks5 expression has been previously detected in
paraffin-embedded human specimens of breast cancer and melanoma
tissues using only a qualitative immunohistochemical approach
(28). In addition, we demonstrated
a prognostic relevance for Tks5 expression in a pilot study
involving glial-derived brain tumours (30). This emerging role of Tks5 as a
possible prognostic marker in cancer led us to undertake a
quantitative analysis of Tks5 expression in tissue microarray (TMA)
cores of breast, colon, lung and prostate tumour and normal tissues
in the present study. We also carried out an extensive mRNA
analysis using the Oncomine cancer gene microarray databases to
further provide evidence that Tks5 is selectively upregulated in a
number of human cancers and that this expression is highly
important both in the metastatic potential of tumours and
ultimately, in patient survival.
Materials and methods
Cell line and culture
Cell culture media and the supplements
penicillin/streptomycin and L-glutamine were purchased from Gibco
(Invitrogen, USA). Foetal calf serum (FCS) was purchased from
Bovogen Biologicals (Australia). The matrix metalloproteinase (MMP)
inhibitor GM6001 was obtained from Merck Millipore (USA). The
following antibodies: p-Src (Tyr416; CST2101) and GAPDH (14C10;
CST2118) were from Cell Signalling Technology (USA), while Tks5
(FISH; M-300; sc-30122) and MMP-2 (H-76; sc-10736) were from Santa
Cruz Biotechnology (USA) and β-tubulin (G7121) was from Promega
(USA). All general reagents were purchased from Sigma-Aldrich (USA)
or Invitrogen (USA). The murine melanoma B16F10 cell line was a
gift from Professor David Ashley (Royal Children’s Hospital,
Parkville, Australia). The cell line was maintained in Dulbecco’s
modified Eagle’s medium (DMEM) supplemented with FCS (10% v/v),
penicillin (100 U/ml), streptomycin (100 μg/ml) and 2 mM
L-glutamine. It was maintained at 37°C with 10% CO2.
B16F10 stable cell line generation
The pBI expression vector which contains two
(bi-directional) CMV promoters under the control of a tetracycline
(doxycycline) responsive element (TRE) was chosen to generate the
panel of B16F10 doxycycline inducible cell lines. B16F10 cells were
co-transfected with pBI constructs along with a plasmid encoding
the tetracycline repressor under the control of a constitutive
promoter and also containing the puromycin resistance gene to
enable selection. Under uninduced conditions, the tet repressor
protein remains bound to the TRE and represses transcription of the
gene of interest. Addition of doxycycline to cells results in
binding of doxycycline to the tet repressor and its dissociation
from the TRE. This in turn activates transcription of the gene of
interest. DNA constructs encoding full length Tks5 or Src were
generated by PCR as previously described (23) and inserted into the pBI
Bidirectional Tet vector (Clontech, USA) which was kindly provided
by Zhu et al (31). B16F10
cells were transfected with a total of 1 μg DNA using Effectene
(Qiagen, Australia) and stable transfectants were selected using 5
μg/ml puromycin for up to 4 weeks.
SDS page and immunoblot analysis
The B16F10 cells were lysed with lysis buffer and
clarified by centrifugation (13,000 × g for 25 min at 4°C). Whole
cell lysate (20 μg) was separated by SDS-PAGE on NuPAGE 4–12%
Bis-Tris pre-cast gels (Invitrogen), transferred onto PVD F
membranes (Millipore). For detection of the antigen, the membranes
were incubated with the indicated antibodies on an orbital shaker
for 1–2 h at room temperature or overnight at 4°C. The signal was
then visualized using the ECL chemilluminescence detection kit (GE
Healthcare, Australia) following incubation with appropriate
secondary HRP antibodies.
Gelatin zymography
B16F10 cells were assayed for the presence of MMP-2
and MMP-9 by gelatin zymography using 10% gelatin-substrate
zymography NuPAGE pre-cast gels (Invitrogen, Australia). Briefly,
20 μl of non-heated serum-free culture medium samples was mixed
with Novex® Tris-Glycine SDS sample buffer (Invitrogen)
and electrophoresed at 125 V for 90 min. The gels were subsequently
renaturated and developed before being stained with Coomassie blue
(Novex) to reveal the positions of active gelatinases (clear bands)
against the undigested stained gelatin substrate in the gel. The
molecular size of the gelatinases was determined using molecular
weight markers (Bio-Rad).
Matrigel invasion assay
The calcein AM assay and the BD BioCoat™ Tumor
Invasion System (Becton-Dickinson) were utilized to quantify the
ability of the pooled B16F10 inducible cell lines to invade through
a Matrigel matrix. All cell lines were induced with doxycycline
hyclate (2 μg/ml) overnight prior to transfection with the control
or Tks5 siRNA duplexes (Santa Cruz). The siRNA is a pool of
proprietary 3 target-specific 19–25 nucleotide siRNAs that were
transfected with the non-liposomal lipid reagent, Effectene, as
directed by the manufacturer. Forty-eight hours post transfection,
cells were trypsinized, the cell suspension density was determined
and 5×10⁴ cells were seeded per well within the inner
chamber in serum-free DMEM in a volume of 500 μl with or without 10
μM GM6001. A 750 μl volume of DMEM with 10% FCS was added to the
bottom chamber via the sample port as a chemoattractant for the
cells. The cells were then incubated at 37°C, in 10% CO2
for 24 h. The medium was then removed from the inner chamber, and
the inserts were transferred to a FluoroBlok 24-well plate
containing 500 μl/well of 4 μg/ml calcein AM and incubated at 37°C
for 1 h as per the manufacturer’s protocol. The levels of
fluorescent calcein were then measured fluorimetrically at 520
nm.
Preparation of pooled B16F10 inducible
cell block
Aliquots of the pooled B16F10 inducible clones were
thawed and left in culture medium for 24 h before being induced
with doxycycline (2 μg/ml) overnight. The cells were then
trypsinized and gently pelleted at 1,200 rpm. The centrifuge tube
was then cut open and the pellet carefully transferred with a flat
blade spatula to a mould of 2% low gelling agarose (Sigma Aldrich)
that was previously cooled to 37°C. The blocks were fixed in
neutral buffered formalin overnight and then embedded in paraffin.
Sections (5 μm) were cut and mounted on SuperFrost Plus slides
(Menzel).
Antigen retrieval procedure - Tks5
immunohistochemistry
The antigen retrieval procedure outlined below was
utilized for the pooled B16F10 inducible cell block sections (as
control specimens) and the human cancer tissue microarray (Chemicon
Select Tissue Array, TMA2004; Millipore). The TMA2004 microarray
consists of 2-mm cores with cancer and normal tissues from breast,
colon, lung and prostate cancer patients. The slides were placed in
a 60°C oven for 1 h prior to dewaxing and subsequent rehydration.
Antigen retrieval was then carried out in a Biocare Decloaking
Chamber Plus (Biocare) for 10 min in a citrate buffer (pH 6.0)
(Invitrogen). The slides were washed and quenched for endogenous
peroxidase activity. Following incubation in a blocking buffer
(Vectastain Elite ABC kit; Vector Laboratories), they were then
incubated with a Tks5 antibody [1:50 dilution; Santa Cruz, FISH
(M-20)] at 4°C overnight. Primary antibodies were detected using a
biotinylated secondary antibody (Vectastain Elite ABC kit) and
developed with the DAB peroxidase substrate kit (both from Vector
Laboratories). The slides were then counterstained with
haematoxylin before being mounted with DPX (Sigma-Aldrich).
Image acquisition and evaluation of Tks5
expression
Brightfield images were captured on a Leica DM750
microscope coupled to a Leica ICC50HD camera (Leica Microsystems)
with a 10 and 40X objective using the Leica Application Suite
software (version 3.8.0). The tissue microarray slides were
reviewed and scored independently by two pathologists blinded to
the information supplied with the slides. The final score (total
IHC score) was determined by combining the proportion of positively
stained cells and the intensity of staining (Total IHC score =
tumour cell proportion × staining intensity). Tumour cell
proportion was scored as follows: 1 (≤ 25% positive cells); 2
(26–50% positive cells); 3 (≥50% positive cells). Staining
intensity was graded according to the following criteria: 0 (no
staining); 1 (weak staining); 2 (moderate staining) and 3 (strong
staining). Using this method of assessment, we evaluated the levels
of Tks5 expression in the tissue microarray cores.
Oncomine data mining
Oncomine 4.4.4.3 (www.oncomine.org,
Compendia Bioscience™, Ann Arbor, MI, USA, part of Life
Technologies) was utilized for the analysis of Tks5 gene
expression. Oncomine is an online tool that contains 715 mRNA and
copy number expression datasets from 86,733 cancer and normal
tissue samples. These datasets are compiled from publicly available
cancer microarray data which is then processed using the same
criteria before being made available (31). We used the Oncomine compendium to
perform differential expression analyses on Tks5 mRNA expression
levels in cancer tissues versus their normal tissue counterparts. A
total of 135 datasets examining mRNA expression differences were
listed in the compendium comparing the two tissue types, which is
subjected to t-statistics with false discovery rates as a corrected
measure of significance (32). We
then exposed each study dataset to threshold criteria for inclusion
in the Tks5 mRNA expression analysis. The threshold criteria that
were initially utilized for this study were a p-value <0.05 and
an mRNA expression fold-change >2. The fold-change is classified
as a change in the mRNA expression level in the cancer tissue
compared to the normal expression level for that tissue
specifically for your gene of interest. Based on the threshold
criteria, Oncomine will then assign a gene rank percentile for all
genes studied within a dataset. This figure is the percentage
ranking of your gene of interest based on the p-value relative to
the p-values of all the other genes within the same dataset.
However, datasets with fold-changes <2 were also further
examined as significant differences as designated by the p-values
in Tks5 expression were observed. Initially Tks5 expression was
examined across a range of cancer types before undertaking analyses
examining the relationship between Tks5 expression, survival, time
to metastatic events and expression differences between primary and
metastatic tissues. The gene expression data generated through
Oncomine is log transformed and standard deviation normalized to
one per array studied.
Statistical analysis
All of the data were analyzed with GraphPad Prism
(GraphPad Software, Inc., La Jolla, CA, USA). Results are expressed
as means ± SEM. Comparisons between two groups were assessed by
Student’s t-test. Differences between groups were considered
significant at p<0.05. All experiments were performed at least
twice to confirm reproducibility.
Results
Doxycycline-induced Tks5 overexpression
in B16F10 cells
We previously showed a functional link between Src
and Tks5 cooperation in the invadopodial regulation of ECM
degradation (24). Several MMPs and
serine proteinases have been found in association with invadopodia
and are thought to contribute to the ECM proteolytic activities of
invasive tumour cells including the membrane tethered MT1-MMP and
the secreted gelatinases MMP-2 and MMP-9 (5,6,11,14,33,34).
In order to investigate the consequences of Tks5 and Src on MMP
activity, a panel of B16F10 cell lines was generated to inducibly
overexpress Tks5 alone, Src alone or Src and Tks5 in combination.
It was envisaged that stable inducible cells would provide a more
valid and powerful tool for examining the effects of Tks5 than
transiently overexpressing cells. In particular, i) all cells
within a population should express the protein of interest and
thereby enable relatively small differences between populations of
cells to be detected, ii) inducible expression would provide a
means of maintaining overexpression for longer periods amenable to
long term assays and iii) the inducible system also provides for a
negative control group (uninduced cells) that are of the same
genotype as the treated cells. Between 20–25 clones corresponding
to each group, B16F10 control (empty vector control), B16F10-Src,
B16F10-Tks5 and B16F10-Src/Tk5 were selected in puromycin. The
cells were then cultured in the presence or absence of doxycycline
and further screened for the induction of Src or Tks5 expression
(data not shown). Ten independent clones that stably expressed
similar levels of Src or Tks5 in response to doxycycline treatment
were selected and re-analyzed. They were then pooled in equal
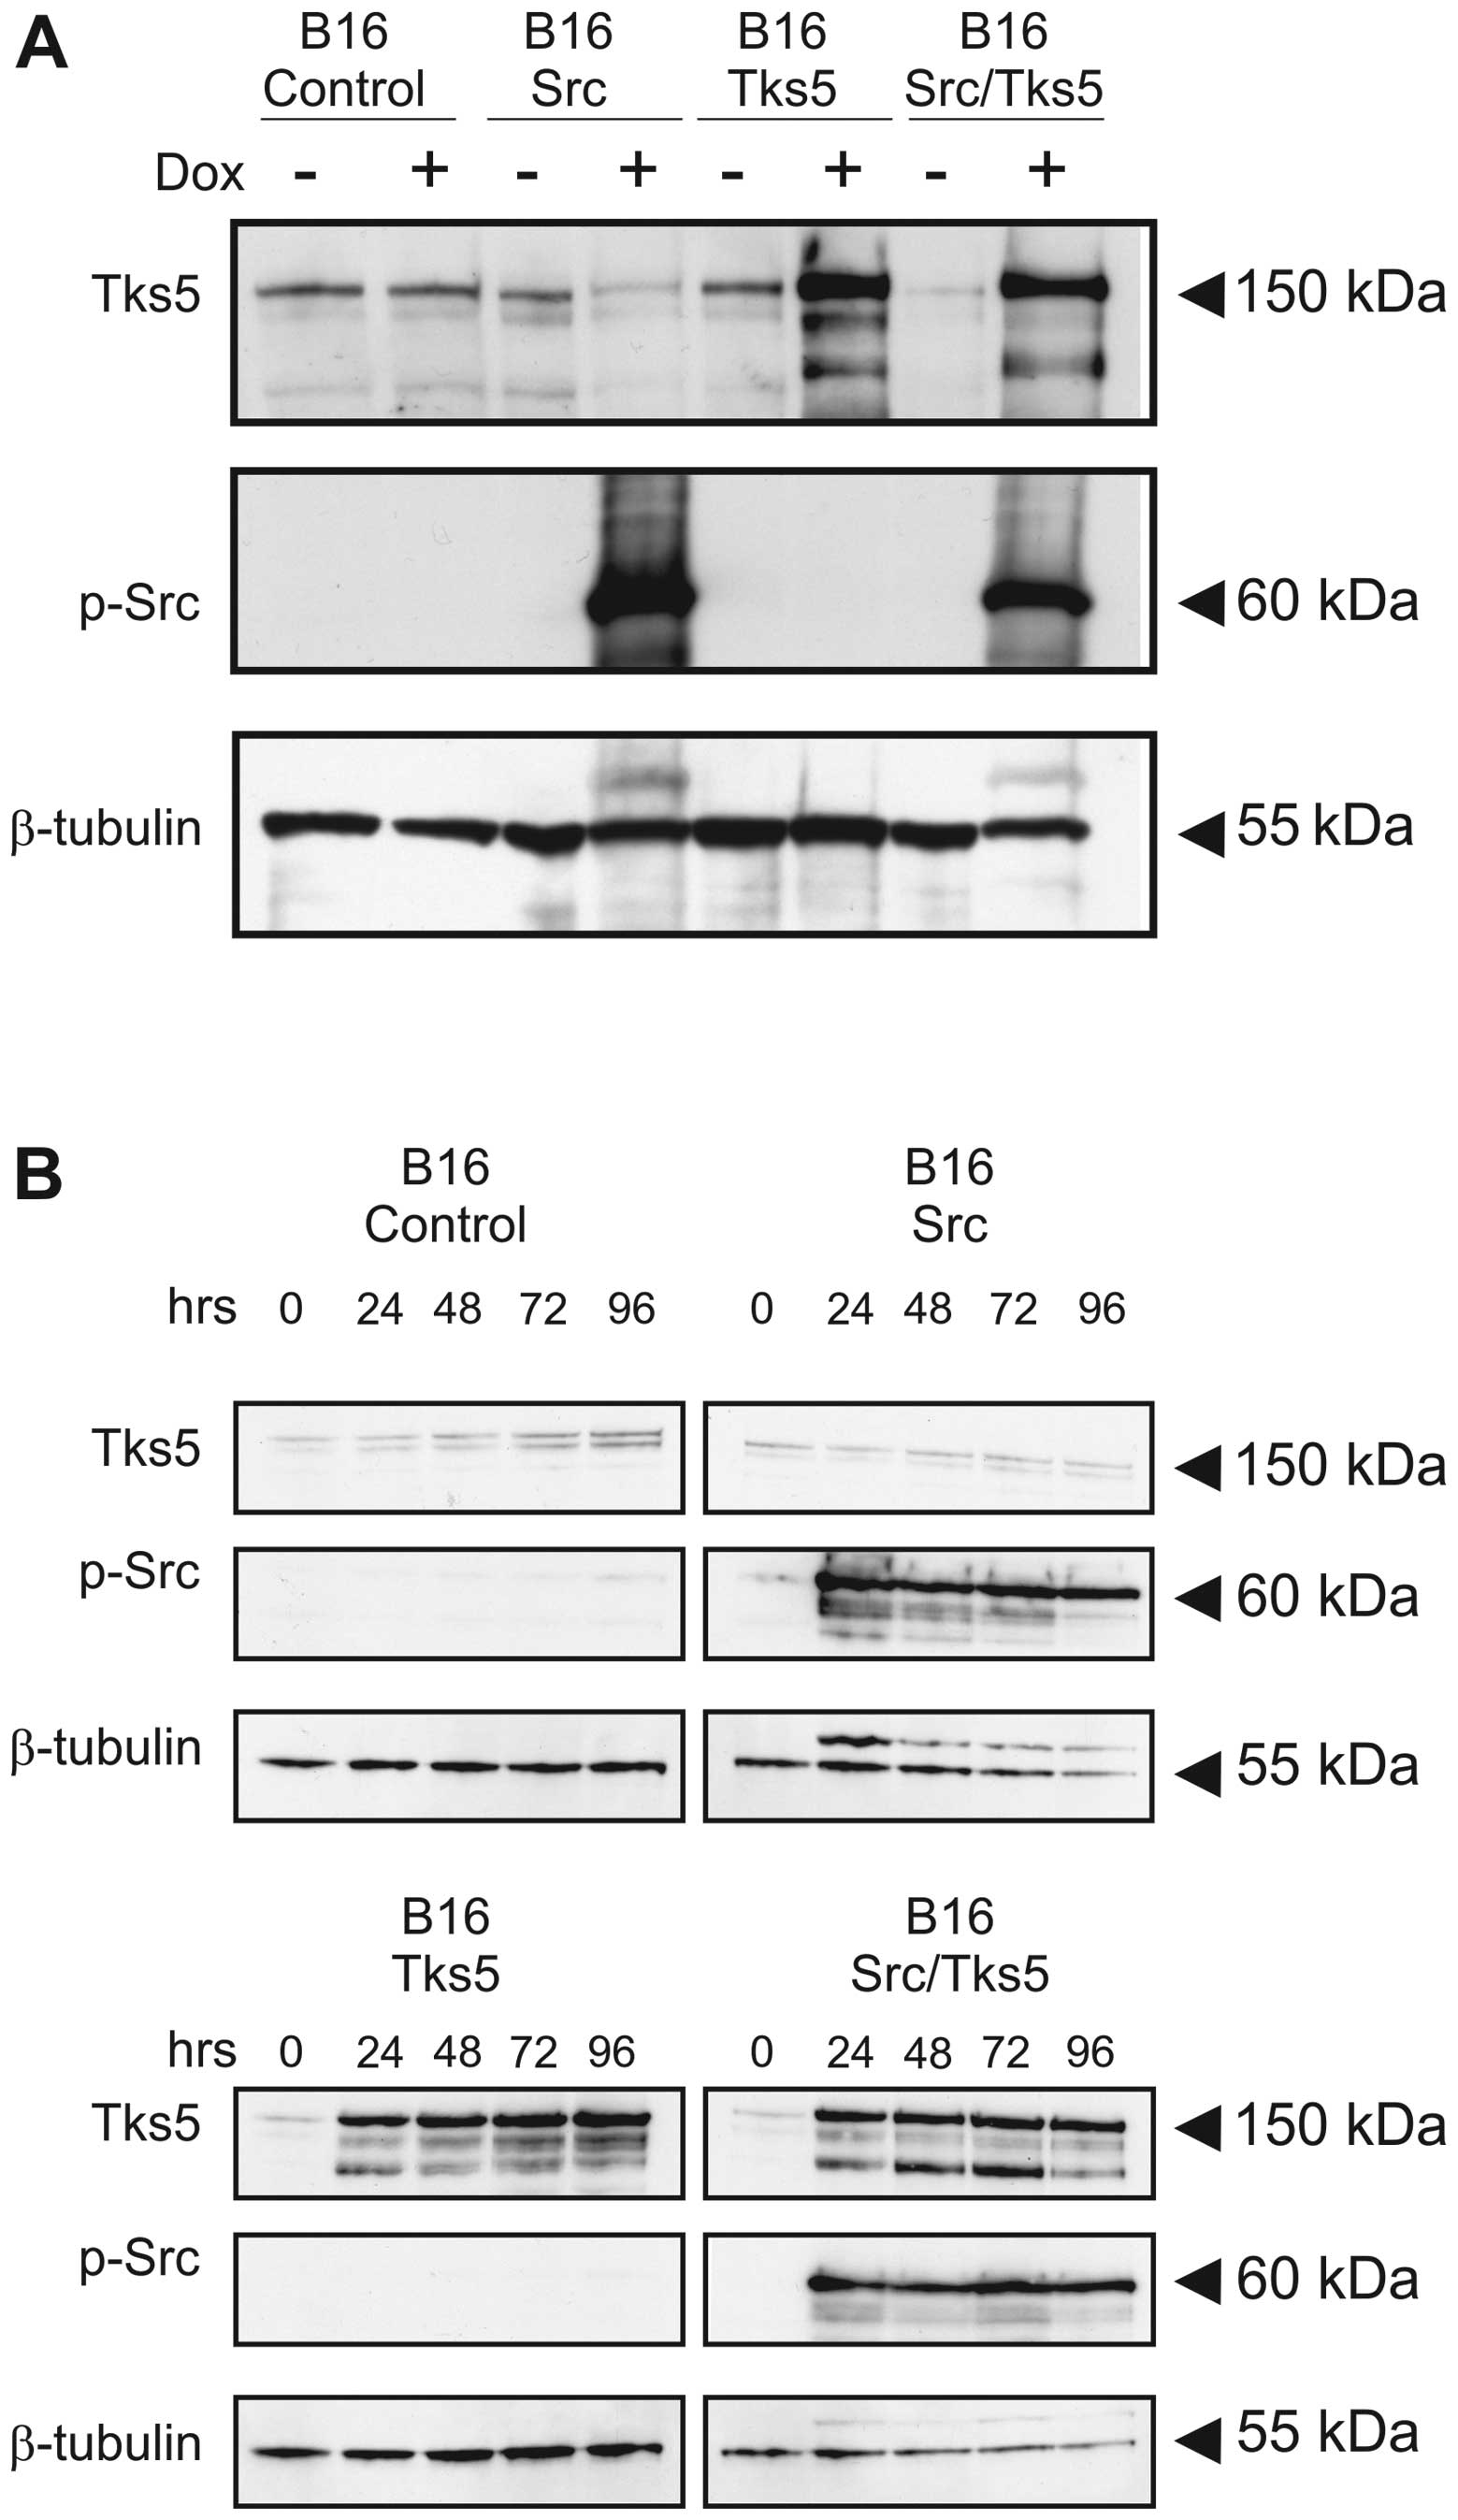
numbers in order to minimize clonal variation effects. Doxycycline
induced Src or Tks5 expression in the pooled cells is shown in
Fig. 1A. Time-course experiments
were performed to determine whether Src or Tks5 expression could be
maintained at elevated levels for extended periods in response to
doxycycline (Fig. 1B). Cells were
treated with doxycycline for the indicated times and as determined
by immunoblot analysis, Tks5 expression was induced at 24 h and
maintained at similar levels for the 96 h duration of the
experiment.
Induction of Src/Tks5 overexpression in
B16F10 pooled inducibles enhances MMP-2 secretion and
activation
To further address the consequences of Src and Tks5
overexpression on MMP regulation, we initially incubated the B16F10
pooled cells (B16-control, B16-Src, B16-Tks5 and B16-Src/Tks5)
overnight in increasing concentrations of doxycycline (0–2.5
μg/ml). Cell monolayers were then washed with PBS to remove serum
and incubated for a further 48 h in serum-free Opti-MEM®
medium. The medium was harvested, concentrated and analysed for
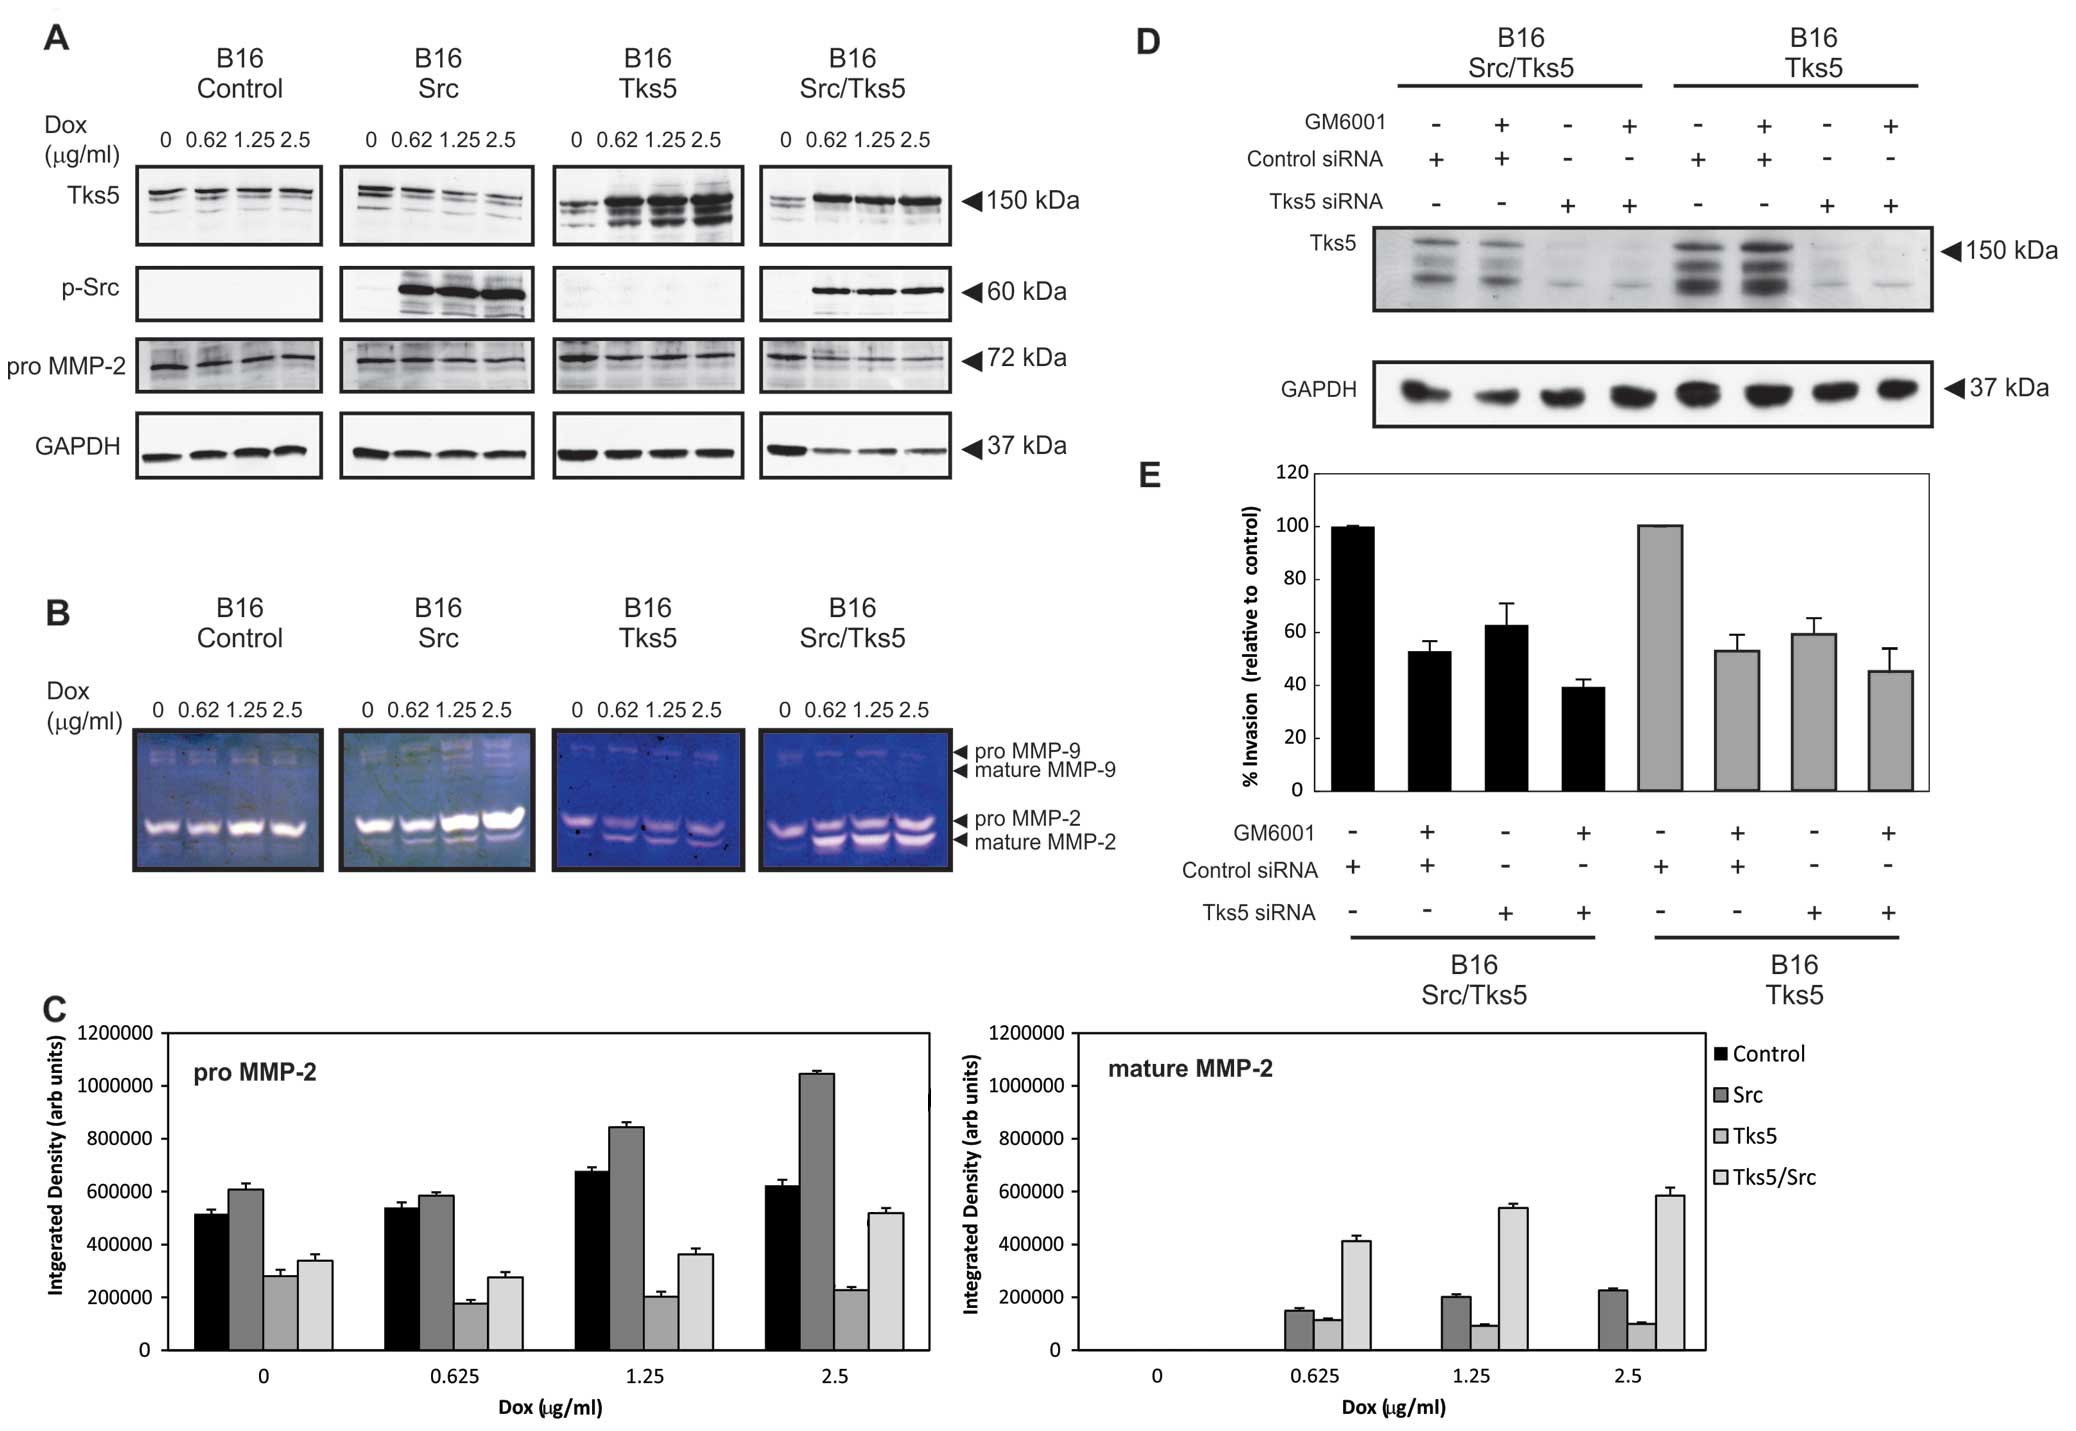
MMP-2 and MMP-9 activity by gelatin zymography (Fig. 2B). In addition to zymography,
samples of cell lysates were also prepared and analysed by
immunoblotting in order to confirm induction of Src and Tks5 and
also to examine cellular levels of MMP-2 expression. The technique
of gelatin zymography identifies gelatinolytic activity in
biological samples electrophoresed under non-reducing conditions in
SDS gels impregnated with gelatin. It is a useful tool for the
detection of the MMP-2 and MMP-9 gelatinases. Removal of the SDS
from the gel in a Triton X-100 buffer promotes renaturation of the
MMP enzymes, which in turn can degrade the gelatin leaving a
cleared zone which can be detected after Coomassie staining of the
undigested gelatin in the gel.
The predominant secreted MMP in the B16F10 cells was
found to be MMP-2 (Fig. 2B). The
molecular weight of the inactive and mature forms of the MMP-2
zymogen is 68 and 62 kDa respectively (35,36).
The levels of the mature form of MMP-2 were enhanced when B16-Src,
B16-Tks5 and B16-Src/Tks5 cells were treated with doxycycline, but
most prominently in the B16-Src/Tks5 cells. Densitometric analysis
of MMP activity is shown in Fig.
2C. A significant difference (p<0.01) in the activated or
mature form of MMP-2 was evident in the B16-Tks5/Src cells compared
to the B16-control, Src and Tks5 cells, suggesting increased
activation of MMP-2 when Tks5 and Src are overexpressed. A
significant increase (p<0.05) in pro-MMP-2 secretion was
observed primarily in the Src overexpressing cells. MMP-9 activity
(92 kDa) was also detectable but appeared to be at much lower
levels compared to MMP-2 in these cells. The overall levels of the
inactive MMP-2 zymogen were increased in the culture medium of the
B16-Src cells indicating that Src overexpression (Fig. 2A) led to an increase in MMP-2
secretion. In the B16-Src and B16-Tks5 cells, there was an increase
in the mature MMP-2 zymogen implying that the induced
overexpression of Src or Tks5 promoted MMP-2 processing.
Interestingly, the simultaneous overexpression of Src and Tks5
resulted in an apparent additive effect of MMP-2 processing. We
previously showed that Tks5 via an Src-Tks5-Nck signalling pathway
is important in the formation and activity of invadopodia in B16F10
melanoma cells (24).
Tks5 is required for protease-dependent
invasion
The data in Fig. 2A and
B suggest that Tks5 overexpression promotes at least in part
matrix degradation through the increased secretion and activation
of MMP-2. This prompted an assessment of the contribution of matrix
metalloproteases to the Tks5-dependent invasion of B16F10 cells
through Matrigel. B16-Tks5 and B16-Src/Tks5 pooled cells were
treated with the MMP inhibitor, GM6001, and their invasive capacity
was compared to untreated cells using a Matrigel invasion system
(Fig. 2E). GM6001 is a broad
spectrum inhibitor of MMP-1, MMP-2, MMP-3, MMP-7, MMP-8, MMP-9,
MMP-12, MMP-14 and MMP-26, with MMP-2 possessing the lowest
IC50 value at 0.4 nM. The invasive capacity of the
B16-Tks5 and B16-Src/Tks5 pooled cells transfected with the control
siRNA duplex was reduced upon treatment with GM6001. A similar
reduction in invasive capacity was also observed for both groups
when the cells were transfected with the Tks5 siRNA duplex alone.
There was a further reduction in invasion when cells were
transfected with the Tks5 siRNA duplex and treated with GM6001
suggesting that Tks5 is required for the proteolytically driven
invasion of Matrigel by B16F10 cells.
Tks5 is overexpressed in human
cancer
To optimize conditions for immunohistochemical
detection of Tks5 expression in formalin-fixed paraffin-embedded
human tissue samples, ‘mock’ tissue blocks were prepared from
B16F10 pooled cell lines where overexpression of Tks5 could be
induced by treatment of cells with doxycycline. To emulate tissue
that is formalin-fixed and paraffin-embedded, cells were pelleted,
fixed and embedded in paraffin, then subjected to sectioning at 5
μm before antigen retrieval with citrate buffer (pH 6.0) and
probing with the Tks5 antibody. The cell lines that were analysed
in this fashion were B16-control, B16-Src, B16-Tks5 and
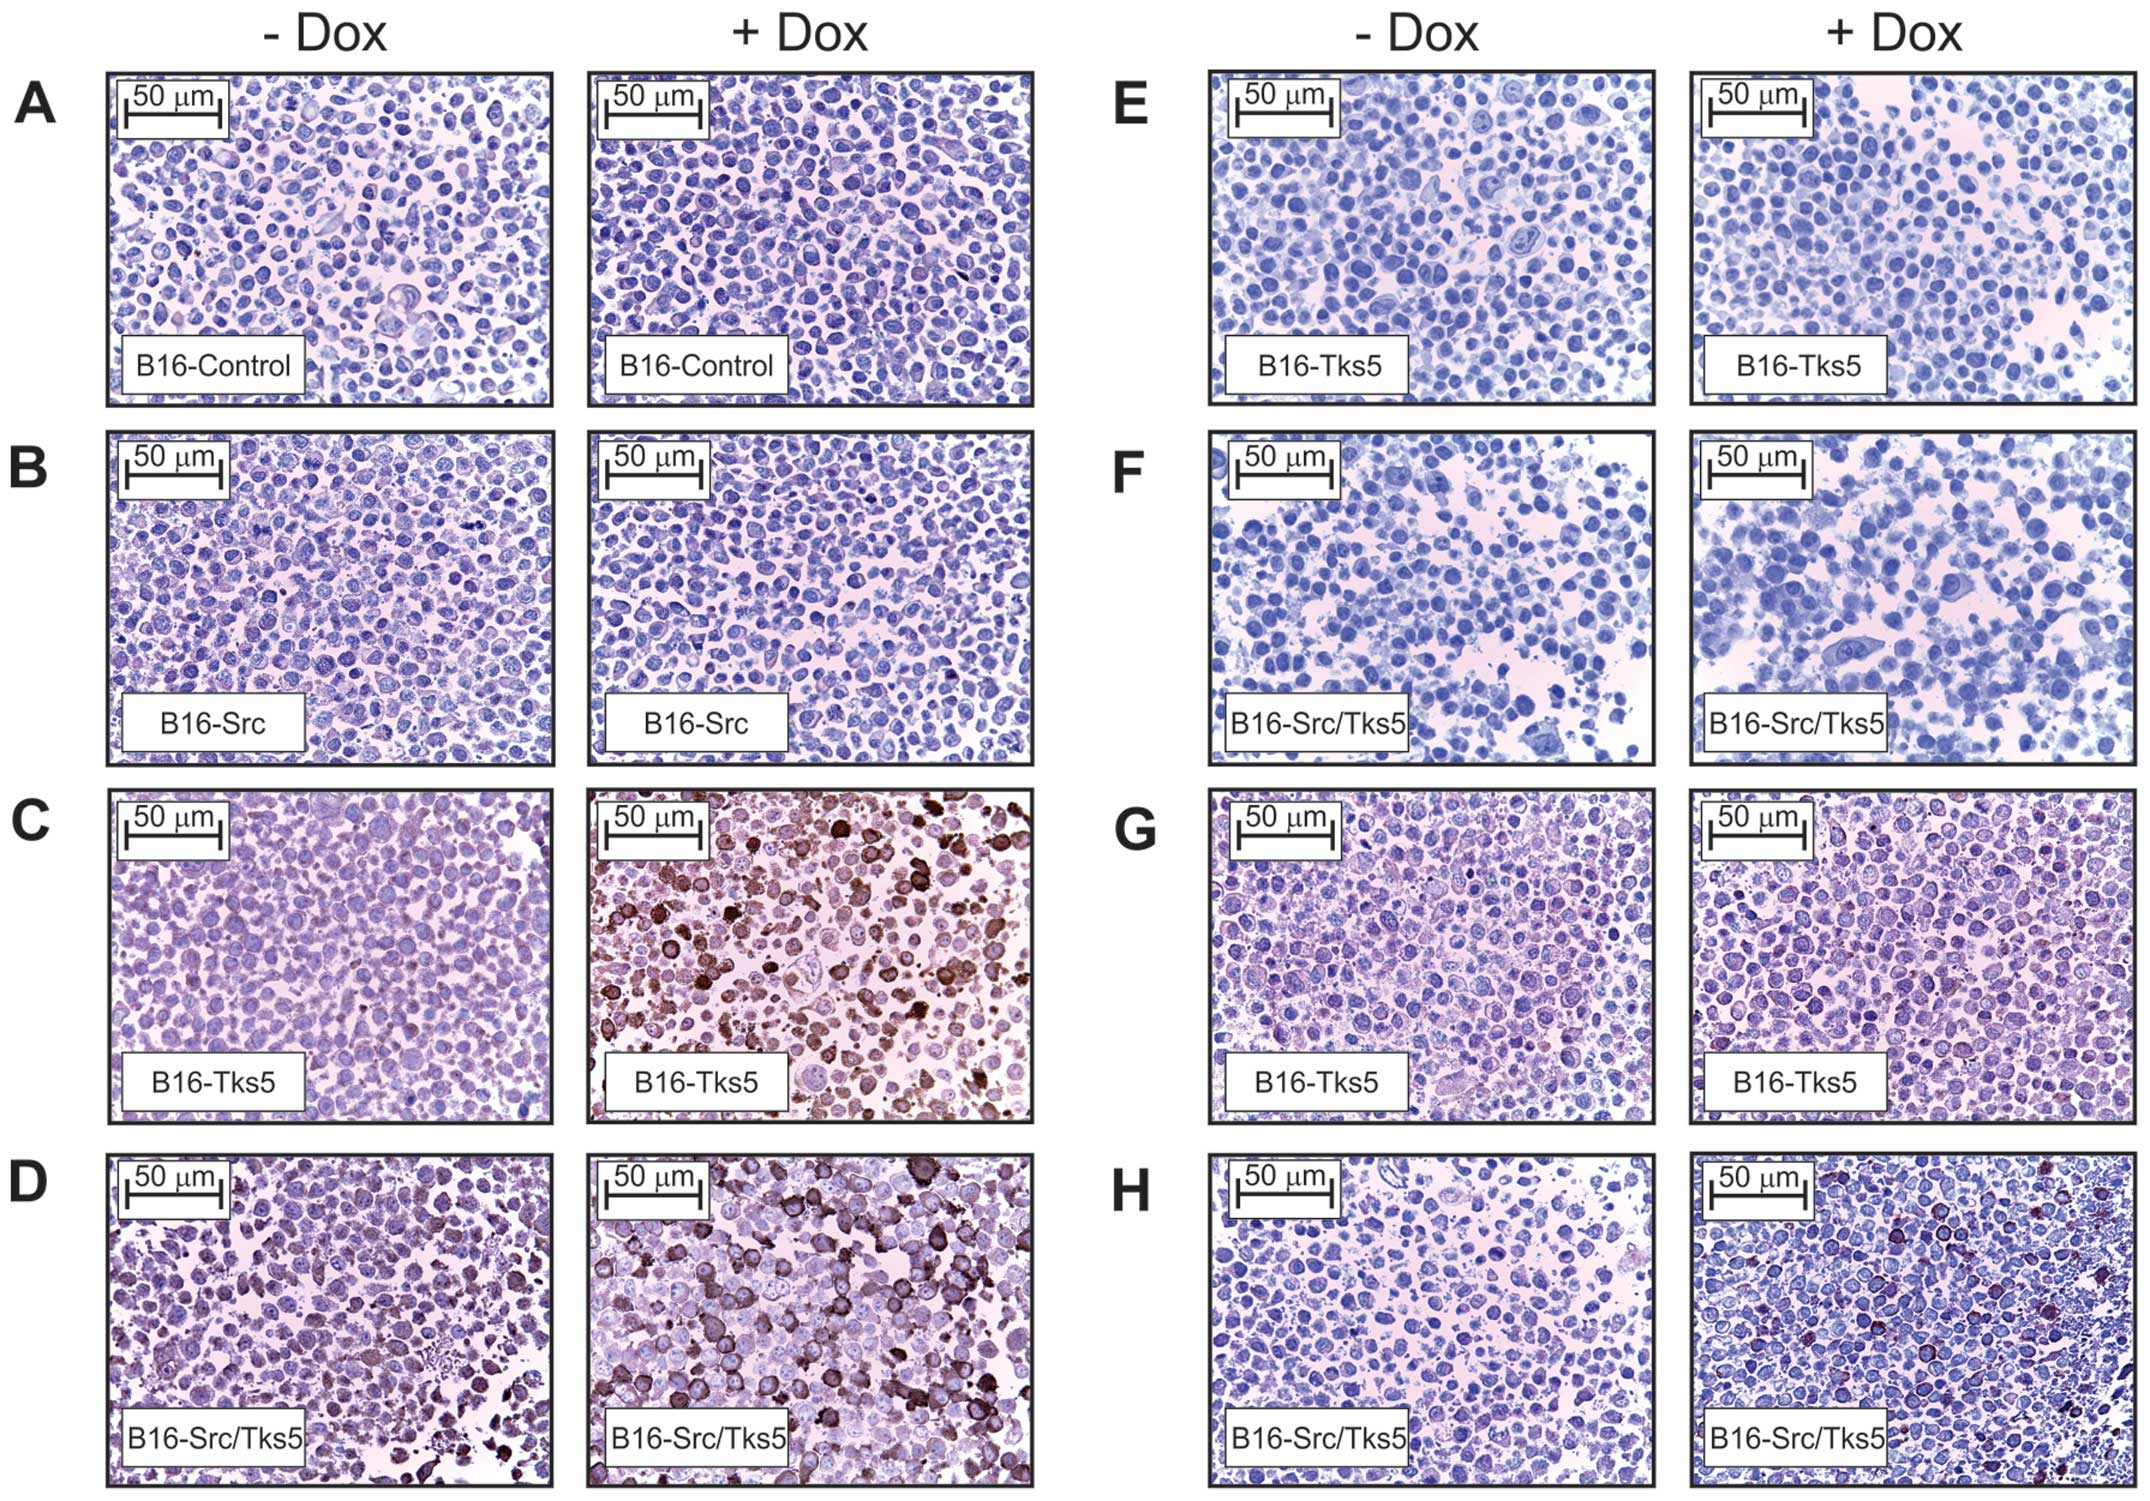
B16-Src/Tks5. Fig. 3A–H shows that
the doxycycline-induced expression of Tks5 was clearly detected
when antigen retrieval was utilized (C and D) relative to the
endogenous Tks5 levels in the B16-control (A and B) and also
compared to the overnight incubation of the Tks5 antibody without
antigen retrieval (G and H). No staining was observed in Tks5 (E)
or Tks5/Src (F) overexpressing cells subjected to antigen retrieval
without the Tks5 antibody present in the antibody diluent.
The optimized protocol incorporating antigen
retrieval was then used to examine the relative expression of Tks5
in a human cancer tissue microarray containing specimens of breast,
colon, lung and prostate tumours. Overall, the array consisted of
56 tissue cores comprised of 16 normal (two different cases for
each normal sample and two cores from each case) and 40 tumour
unmatched samples (five different cases for each cancer and two
cores from each case). According to the manufacturer data sheet
supplied with the tissue microarray, tissue identification and
diagnosis were performed by certified pathologists and no further
staging or clinical information was supplied. The tissue microarray
was stained for Tks5 expression and was found to be relatively low
in all of the normal tissues analysed as indicated by the results
in Fig. 4. Remarkably, by
comparison, all tissue cores from tumour samples showed increased
Tks5 expression albeit to varying degrees as assessed independently
and enumerated in the ‘mean total IHC score’ (Fig. 4E–H).
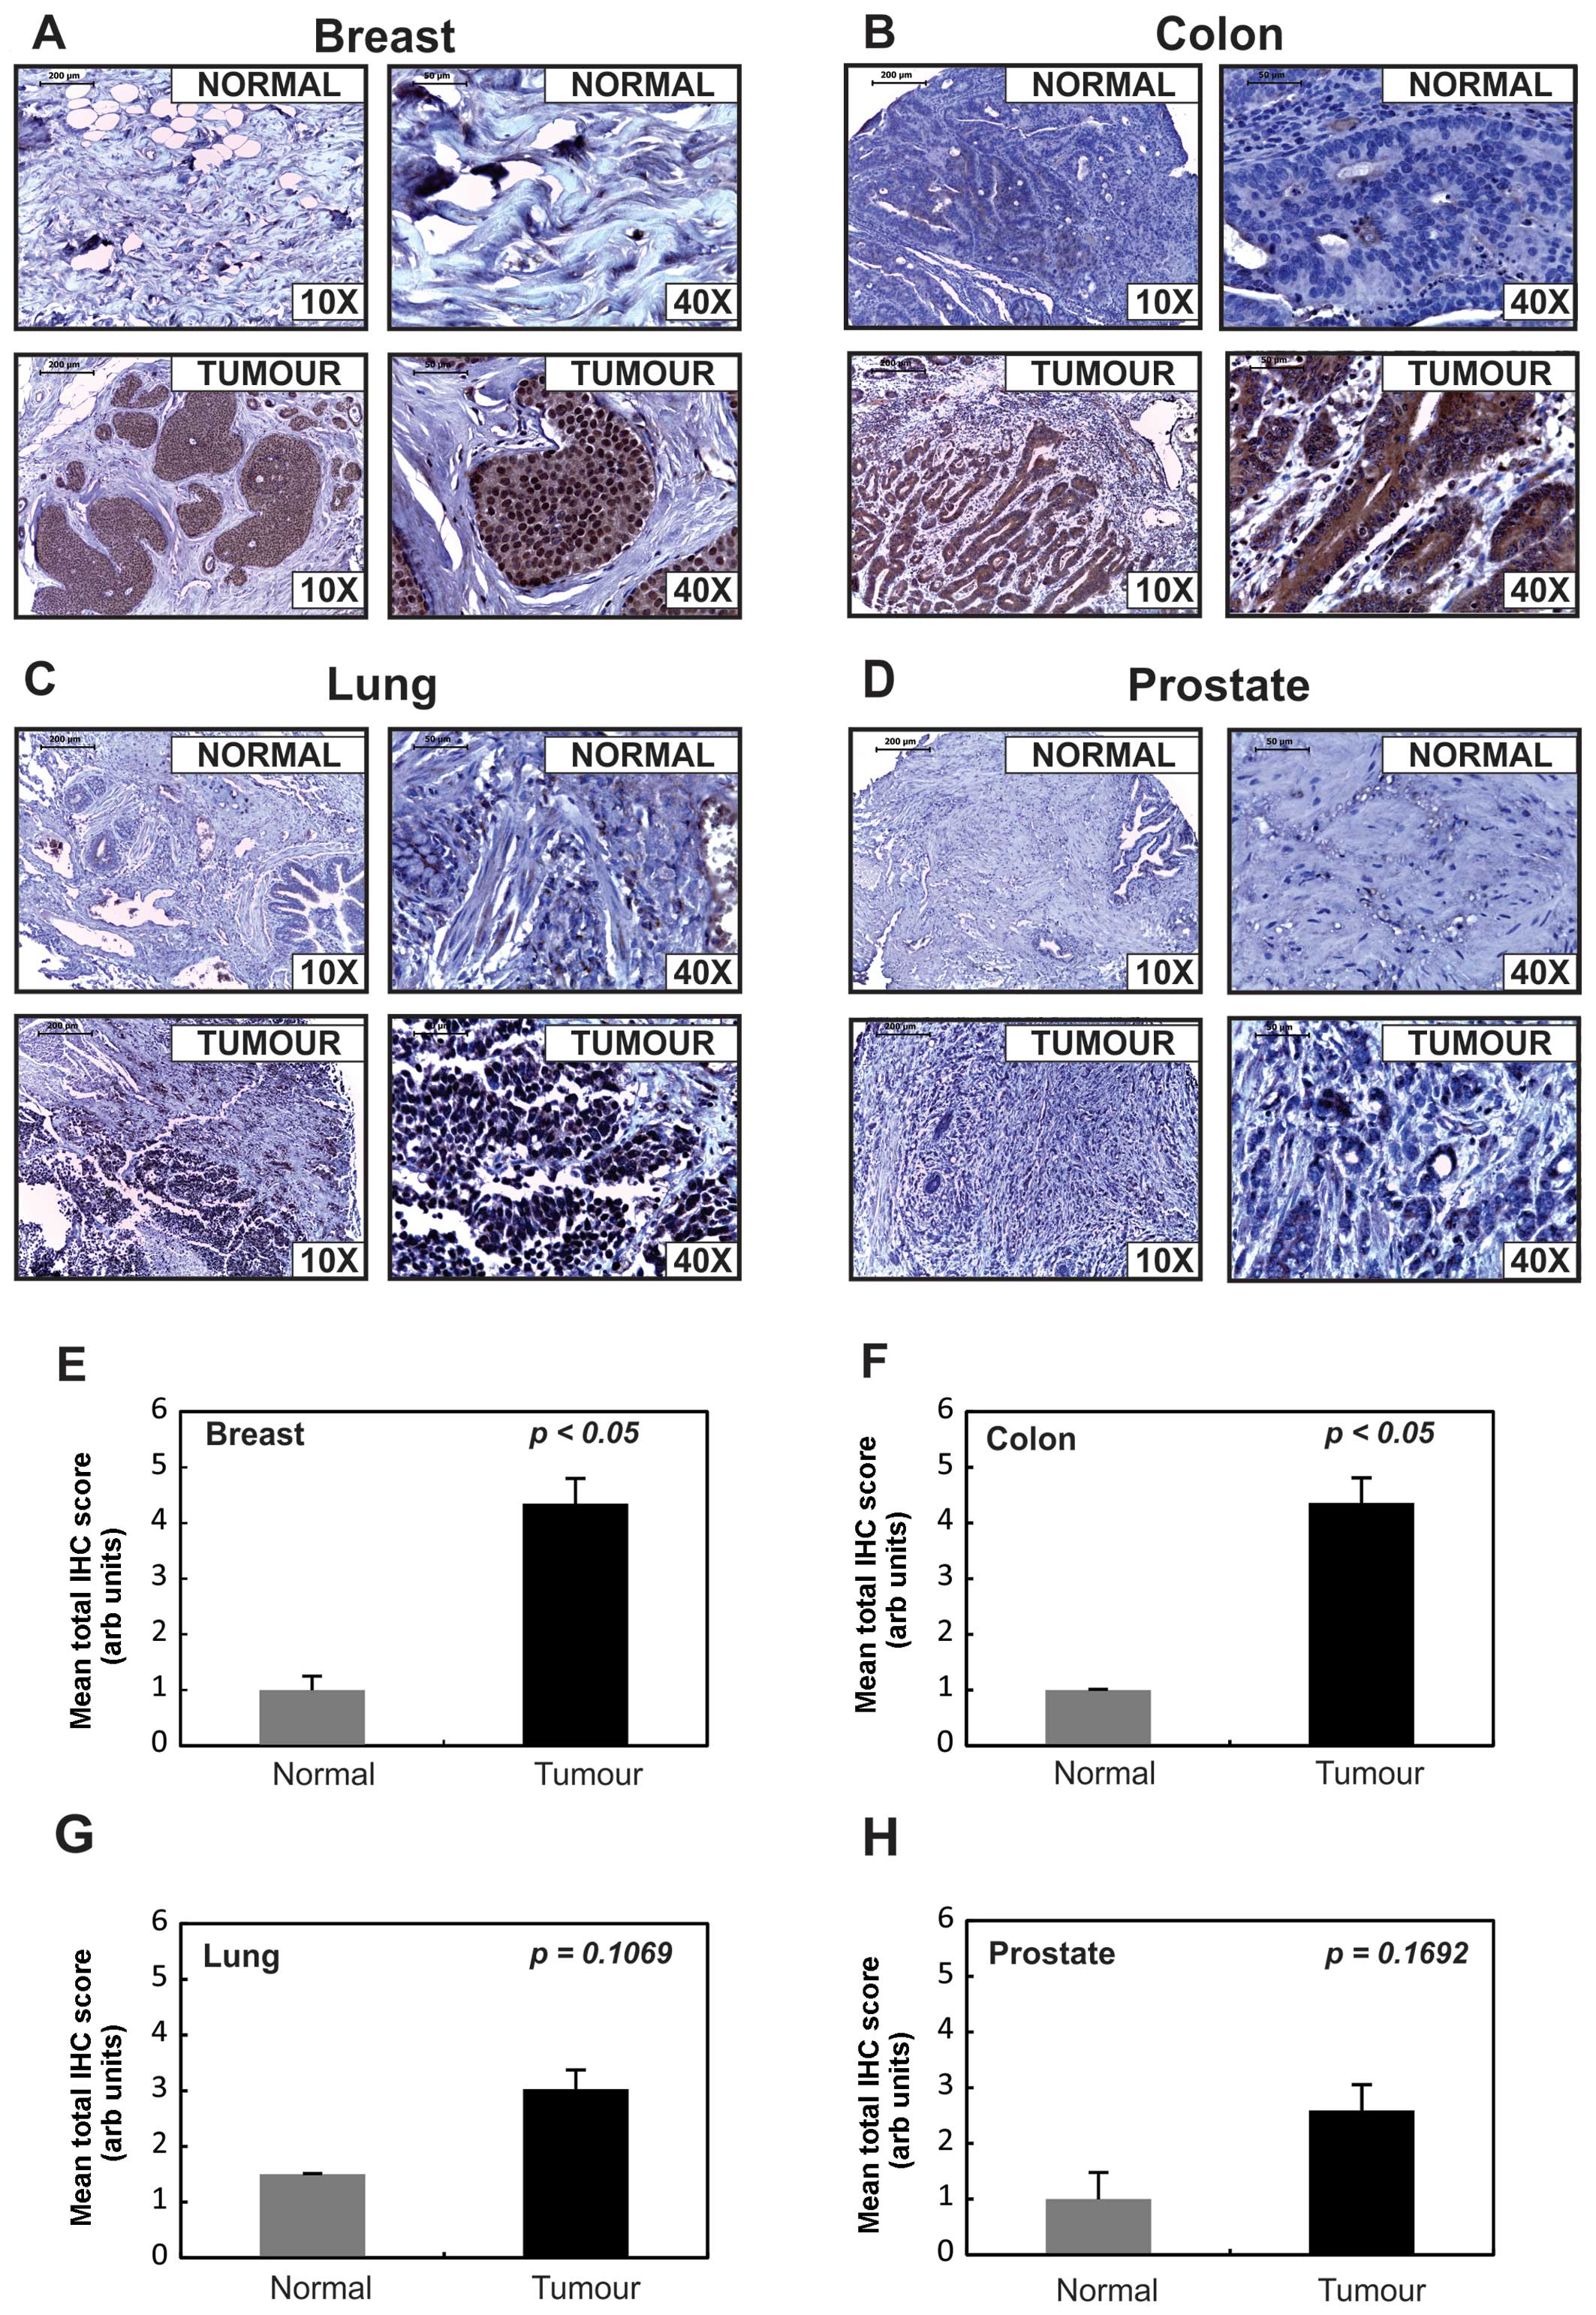 | Figure 4Tks5 is overexpressed in human
cancers. Histological sections of paraffin-embedded human cancer
tissue microarrays subjected to Tks5 antigen retrieval (citrate
buffer, pH 6.0, Tks5 antibody, 1:100) overnight. (A) Breast, (B)
colon, (C) lung and (D) prostate tissues include 2.00-mm cores of
tumour and corresponding normal tissues (Chemicon Select Tissue
Array). Brightfield images were captured with a Leica ICC50HD
camera using 10 and 40X objectives (scale bars, 200 and 50 μm,
respectively). Tks5 expression was significantly higher in the
breast and colon tumour tissues. The tissue microarray slides were
reviewed and scored independently by two observers blinded to the
information supplied with the slides and a ‘total IHC score’
compiled for each core on the tissue microarrays. Total IHC score,
tumour cell proportion (score, 1, 2 or 3) × staining intensity
(score, 1, 2 or 3). This is graphically represented in (E) breast,
(F) colon, (G) lung and (H) prostate. Error bars indicate SEM. (E)
Breast and (F) colon show a significant difference (p<0.05,
Student’s t-test) in mean total IHC score for Tks5 staining between
normal and tumour tissues. |
Data mining on the Oncomine database
We systematically compared Tks5 mRNA gene expression
levels across a number of human cancers and the corresponding
normal tissues using datasets from the Oncomine database (Table I). Overexpression of Tks5 in tumour
tissue compared to normal tissue was found in three independent
breast cancer studies (p=5.12E-17, p=0.002 and p=0.033) (37–39);
in pancreatic adenocarcinoma compared to normal pancreas in three
independent studies (p=5.22E-16, p=0.020 and p=0.009) (40–42);
in gastric adenocarcinoma compared to the normal tissue counterpart
in three independent studies (p=2.86E-5, p=1.80E-4 and p=0.020)
(43–45) and a study comparing seminoma to
normal testis (p=6.53E-9 and p=9.58E-7) (46). Overexpression of Tks5 was also found
in sarcoma (p=1.40E-14) (47),
testicular teratoma (p=0.031) (48), renal (p=0.012) (49), skin squamous cell carcinoma
(p=0.010) (50), cutaneous melanoma
(p=0.002) (51), anaplastic
oligodendroglioma (p=0.045) (52),
squamous cell lung carcinoma (p=1.52E-7) (53) and colon (p=2.13E-6) (54) cancers. P-values were determined by
Student’s t-test and those <0.05 were considered to indicate a
statistically significant result.
 | Table ITks5 is overexpressed in human cancer
tissue compared to normal tissues. |
Table I
Tks5 is overexpressed in human cancer
tissue compared to normal tissues.
| Cancer | Cancer/normal
tissue subtype | Sample no. | Log2
median-centered ratio | Mean fold-change
vs. normal tissue | P-value | Total no. of
measured genes | Overexpression gene
rank | Ranking (%) | Platform | D ataset authors
(ref.) |
|---|
| Breast | Invasive breast
carcinoma | 53 | 2.604 | 5.289 | 5.12E-17 | 19,189 | 636 | 4 | Agilent Human
Genome 44K | Finak et al
(37) |
| Sarcoma | Myxoid/round cell
liposarcoma | 20 | 2.466 | 5.283 | 1.40E-14 | 12,624 | 52 | 1 | Human Genome U 133A
Array | Barretina et
al (47) |
| Testis | Testicular
teratoma | 4 | 3.265 | 4.900 | 0.031 | 14,699 | 1,217 | 9 | ND | Skotheim et
al (48) |
| Seminoma | Teratoma, NOS | 14 | 3.136 | 3.927 | 6.53E-9 | 17,779 | 410 | 3 | Human Genome U
133A/B Arrays | Korkola et
al (46) |
| Pancreas | Pancreatic ductal
adenocarcinoma | 39 | 4.192 | 3.214 | 5.22E-16 | 19,574 | 51 | 1 | Human Genome U 133
Plus 2.0 Array | Badea et al
(41) |
| Renal | Renal Wilms
tumour | 4 | 1.975 | 2.684 | 0.012 | 19,574 | 2,463 | 13 | Human Genome U 133
Plus 2.0 Array | Yusenko et
al (49) |
| Pancreas | Pancreatic ductal
adenocarcinoma | 7 | 0.724 | 2.488 | 0.020 | 15,741 | 1,888 | 12 | ND | Buchholz et
al (40) |
| Breast | Breast phyllodes
tumour | 5 | 5.546 | 2.376 | 0.002 | 19,273 | 467 | 3 | Illumina Human
HT-12 V3.0 R2 Array | Curtis et al
(38) |
| Skin | Skin squamous cell
carcinoma | 5 | −0.46 | 2.275 | 0.010 | 12,624 | 745 | 6 | Human Genome U 133A
Array | Nindl et al
(50) |
| Pancreas | Pancreatic
adenocarcinoma | 12 | 2.439 | 2.293 | 0.009 | 14,380 | 1,578 | 11 | ND | Iacobuzio et
al (42) |
| Seminoma | Embryonal
carcinoma, NOS | 15 | 2.337 | 2.169 | 9.58E-7 | 17,779 | 1,294 | 8 | Human Genome U
133A/B Arrays | Korkola et
al (46) |
| Gastric | Gastric mixed
adenocarcinoma | 8 | 1.421 | 2.145 | 2.86E-5 | 10,709 | 216 | 3 | ND | Chen et al
(43) |
| Skin | Cutaneous
melanoma | 45 | 2.651 | 2.059 | 0.002 | 12,624 | 2,584 | 21 | Human Genome U 133A
Array | Talantov et
al (51) |
| Brain | Anaplastic
oligo-dendroglioma | 3 | 0.602 | 1.593 | 0.045 | 14,836 | 2,645 | 18 | ND | Bredel et al
(52) |
| Lung | Squamous cell lung
carcinoma | 27 | 0.552 | 1.580 | 1.52E-7 | 19,574 | 1,797 | 10 | Human Genome U 133
Plus 2.0 Array | Hou et al
(53) |
| Breast | Invasive ductal
breast carcinoma | 9 | 5.191 | 1.577 | 0.033 | 19,139 | 3,350 | 18 | Affymetrix Human X
3P Array | Ma et al
(39) |
| Gastric | Gastric intestinal
type adenocarcinoma | 20 | 4.616 | 1.561 | 1.80E-4 | 19,273 | 624 | 4 | Illumina Human WG-6
v3.0 Expression Beadchip | Cho et al
(44) |
| Gastric | Gastric mixed
adenocarcinoma | 4 | −0.561 | 1.555 | 0.020 | 19,574 | 4,935 | 26 | Human Genome U 133
Plus 2.0 Array | D’Errico et
al (45) |
| Colon | Colon mucinous
adenocarcinoma | 13 | 2.898 | 1.529 | 2.13E-6 | 19,574 | 603 | 4 | Human Genome U 133
Plus 2.0 Array | Kaiser et al
(54) |
Thirteen independent studies also showed an
association between Tks5 overexpression and poorer prognosis at 1-,
3- or 5-year survival post-diagnosis in various types of cancers
(Table II). It is also interesting
to note that the Tks5 overexpression gene rank for all the datasets
was in the top 15%, with the majority falling within the top 10% of
all overexpressed genes affecting patient prognosis within their
respective studies. Two studies (squamous cell carcinoma of the
oesophagus (55) and gastric
diffuse adenocarcinoma (43) which
had a follow-up from 1 to 3 years post-diagnosis showed an increase
in the Tks5 gene expression with progression from 1 to 3 years
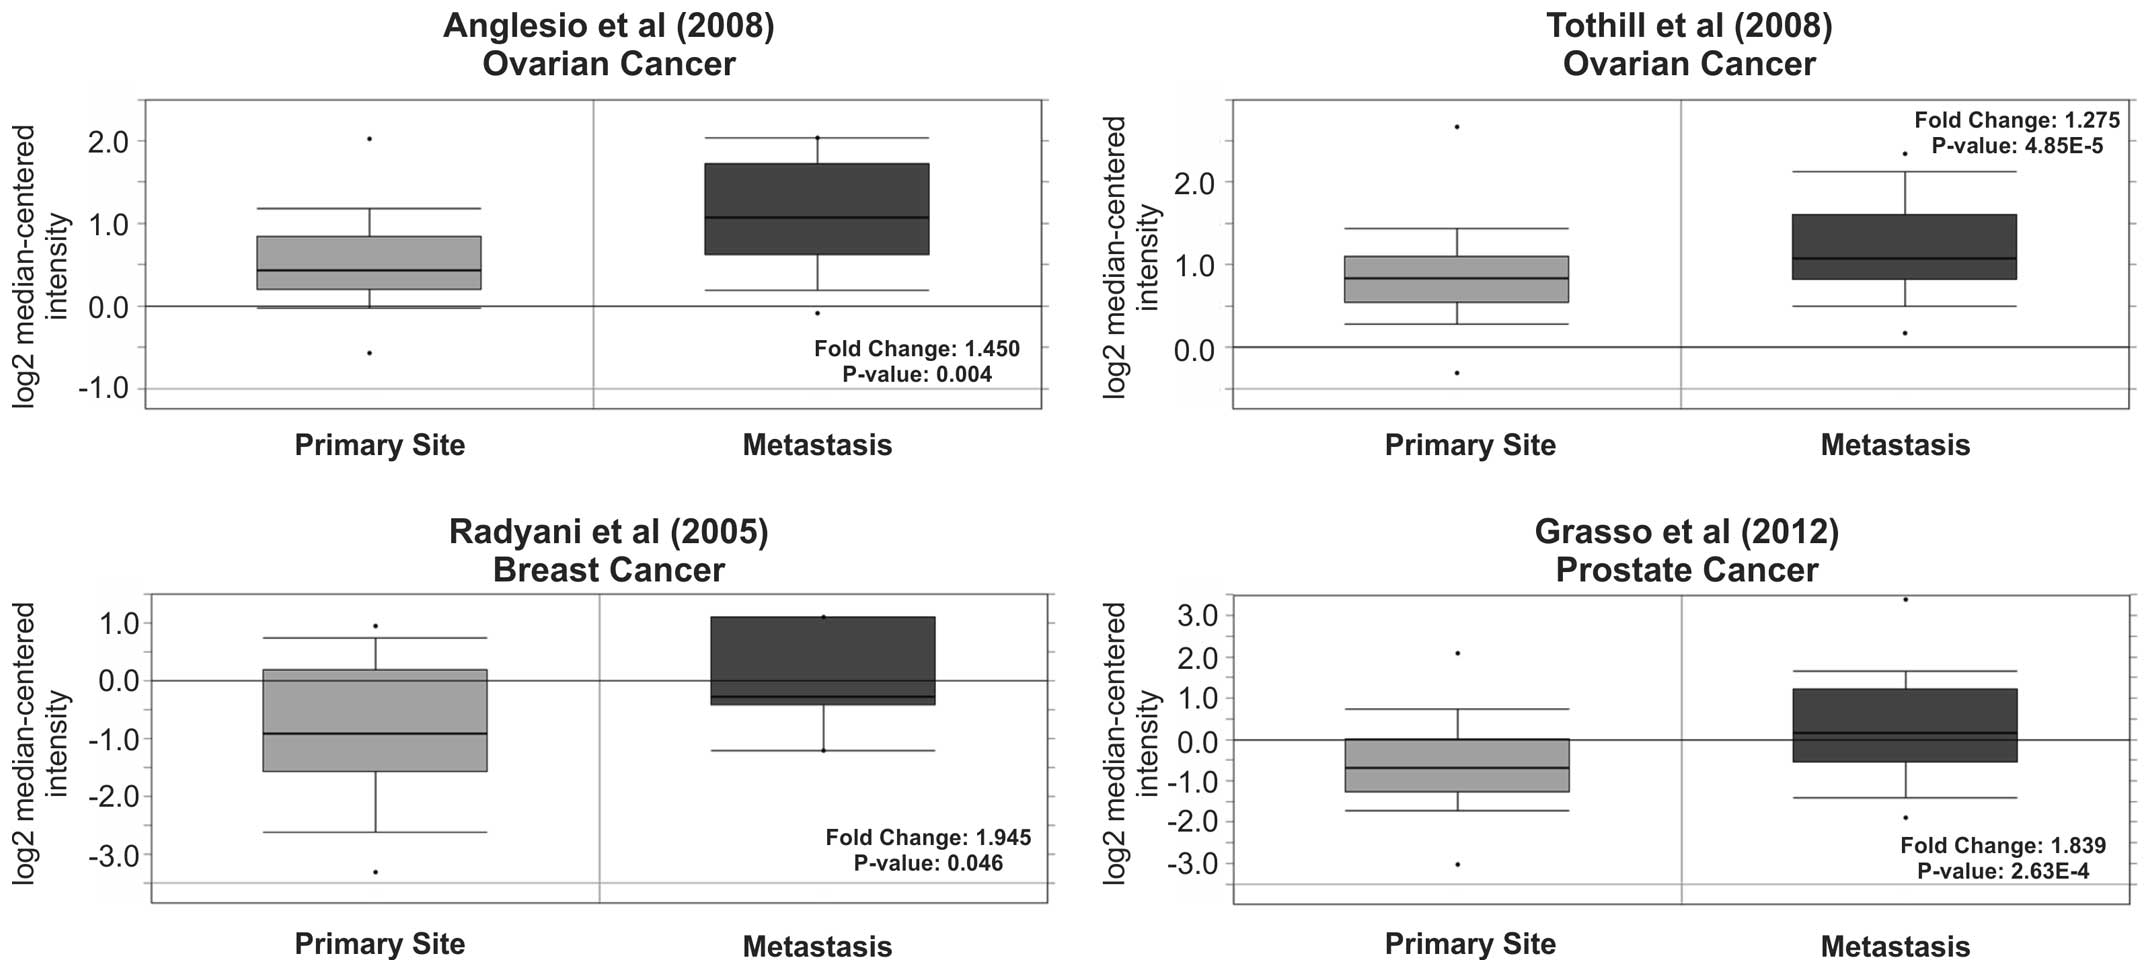
post-diagnosis. Given that Tks5 appeared to be of prognostic
significance in a number of cancers, we also investigated whether
there was a difference in Tks5 expression between primary and
metastatic cancer tissue. Intriguingly, an increase in Tks5
expression was observed in metastatic tissue compared to primary
cancer tissue in four studies; ovarian (56,57),
breast (58) and prostate (59) (Fig.
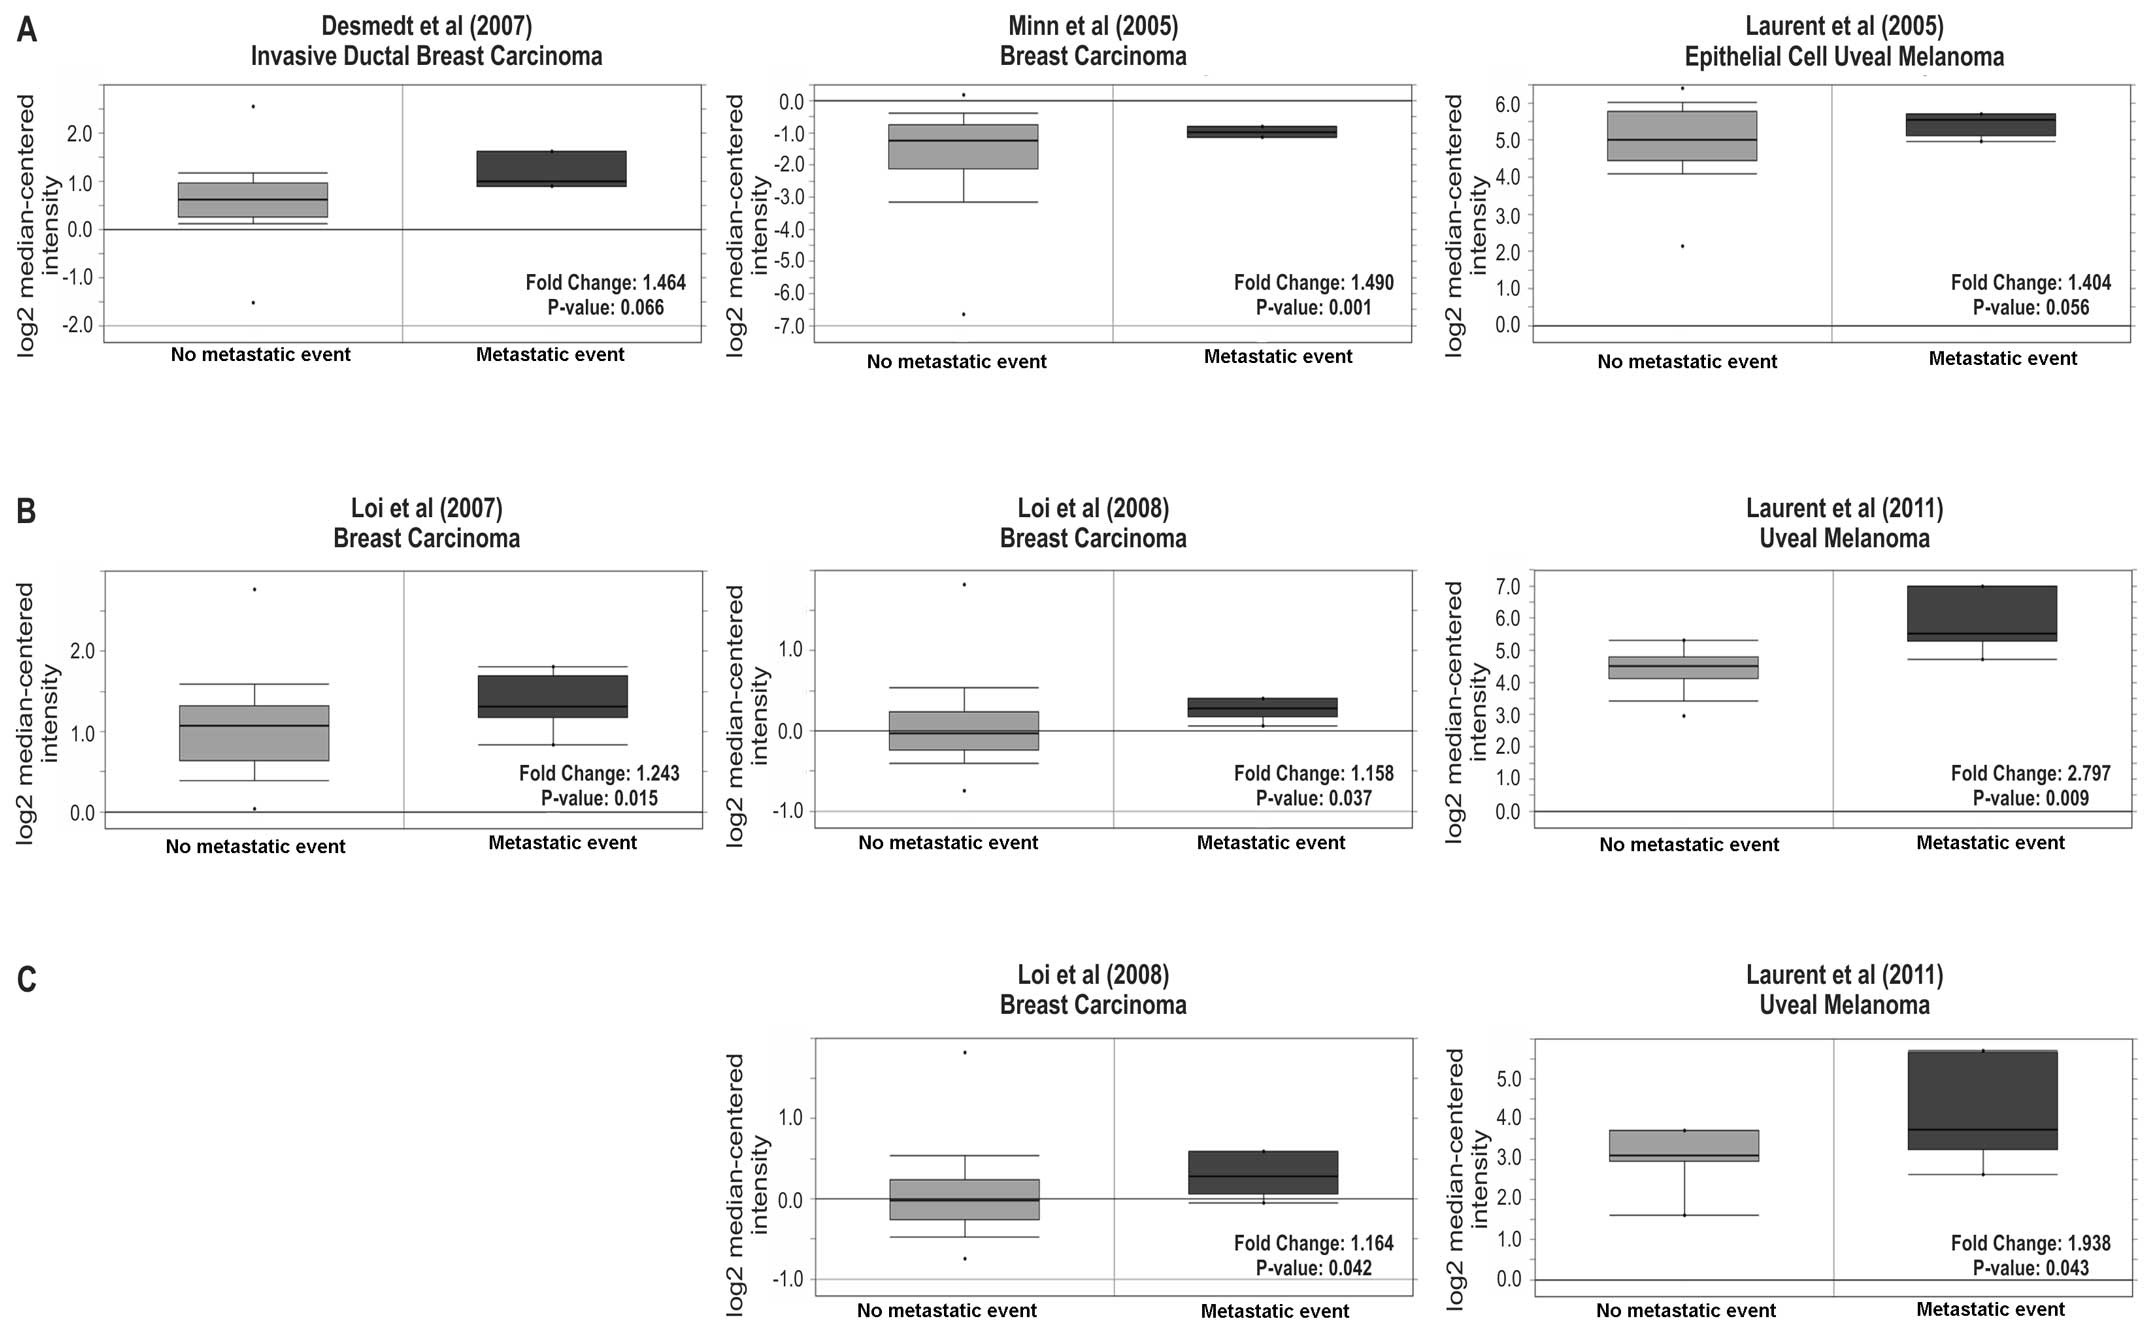
5). We also examined the occurrence of metastatic events
post-diagnosis being linked to Tks5 expression. Six studies
(60–64) covering the time frame of 1, 3 or 5
years post-diagnosis showed that there was an increase in Tks5
expression in the patients that had recorded a metastatic event
compared to the ones that had none (Fig. 6). This data suggest that Tks5
overexpression is linked to an increase in metastatic potential
which may also be associated with a poorer prognostic outcome.
| Table IITks5 gene expression and clinical
outcome. |
Table II
Tks5 gene expression and clinical
outcome.
| Cancer type | Year of death | Mean fold-change
vs. normal tissue | P-value | Total measured
genes | Gene rank | Gene rank (%) | Dataset authors
(ref.) |
|---|
| Oesophageal
squamous | 1 | 1.370 | 0.019 | 19,574 | 1,444 | 8 | Aoyagi et al
(55) |
| cell carcinoma | 3 | 1.611 | 0.032 | 19,574 | 1,837 | 10 | Aoyagi et al
(55) |
| Ovarian
carcinoma | 1 | 1.074 | 0.038 | 12,624 | 630 | 5 | Bonome et al
(76) |
| Gastric intestinal
type | 1 | 1.307 | 0.051 | 10,709 | 1,370 | 13 | Chen et al
(43) |
| adenocarcinoma | 3 | 1.271 | 0.030 | 10,709 | 425 | 4 | Chen et al
(43) |
| Gastric
diffuse | 1 | 1.245 | 0.056 | 10,709 | 856 | 8 | Chen et al
(43) |
| adenocarcinoma | 3 | 1.415 | 0.023 | 10,709 | 451 | 5 | Chen et al
(43) |
| Glioblastoma | 1 | 1.347 | 0.025 | 17,779 | 903 | 6 | Freije et al
(77) |
| Adrenal cortex
carcinoma | 1 | 1.131 | 0.050 | 19,574 | 2,871 | 15 | Giordano et
al (78) |
| Squamous cell lung
carcinoma | 1 | 1.129 | 0.049 | 19,574 | 1,243 | 7 | Hou et al
(53) |
| Colorectal
adenocarcinoma | 1 | 1.109 | 0.047 | 19,574 | 2,344 | 12 | Smith et al
(79) |
| Ovarian peritoneal
serous adenocarcinoma | 1 | 1.291 | 3.72E-4 | 19,574 | 26 | 1 | Tothill et
al (57) |
| Renal papillary
renal | 1 | 1.518 | 0.001 | 19,574 | 134 | 1 | Yang et al
(49) |
| cell carcinoma | 5 | 1.267 | 0.005 | 19,574 | 459 | 3 | Yang et al
(49) |
| Poorly
differentiated synovial sarcoma | 3 | 1.592 | 0.010 | 19,574 | 180 | 1 | Nakayama et
al (80) |
| Astrocytoma | 3 | 1.418 | 0.019 | 17,779 | 1,407 | 8 | Phillips et
al (81) |
| Squamous cell lung
carcinoma | 3 | 1.231 | 0.024 | 20,423 | 904 | 5 | TCGA |
| Medullary breast
carcinoma | 5 | 1.561 | 0.048 | 19,273 | 1,065 | 6 | Curtis et al
(38) |
Discussion
The ability of cells to migrate and invade through
the surrounding ECM and across tissue boundaries is crucial not
only for physiological processes that occur during normal
development, wound healing and immune responses, but importantly
for the progression of pathological conditions such as arthritis,
vascular diseases and tumour cell invasion and metastasis (65). The cells involved reassemble,
reorganize and reform their actin cytoskeleton to facilitate the
migration process. The migration of cells also involves the
rearrangement of the surrounding ECM which is aided by the
secretion of various proteases arising from actin-based specialized
structures known as podosomes in normal cells and invadopodia in
tumour cells.
The present study provides evidence that the
invadopodia-associated protein, Tks5, is overexpressed in a number
of cancers (breast, colon, lung and prostate cancer). We
demonstrated using immunohistochemical staining that Tks5
expression is enhanced in tumour tissues of breast, colon, lung and
prostate compared to the normal tissue counterpart and therefore
may be of clinical relevance. Our results confirm previously
published data also examining Tks5 expression in human cancer
(28). Evidence of increased Tks5
expression using immunohistochemical staining in breast carcinoma
and invading melanoma cells was observed compared to normal breast
and skin tissues. Extensive Tks5 expression was observed in both
ductal carcinoma in situ and metastatic breast cancer
samples, as well as in the early stage melanoma and metastatic
tumour samples.
Even though all cancer tissues in the present study
showed increased Tks5 expression, only the breast and colon cancer
tissues showed a significant (p<0.05) increase in Tks5 staining.
Having established appropriate conditions for the
immunohistochemical detection of Tks5 in tumour tissues, it will be
informative in the future to similarly examine the expression of
Tks5 in sections of different grades of tumour tissues to determine
its distribution in malignant compared to normal surrounding
tissues and whether Tks5 levels vary between infiltrating tumour
cells at the periphery of all tumours (of different primary origin)
and those within the central core region of the tumour itself.
We previously showed that Tks5 via an Src-Tks5-Nck
signalling pathway is important in the formation of invadopodia in
cancer cells (24). We demonstrated
that Src phosphorylates Tks5 at Y557, inducing it to associate
directly with the SH3-SH2 domain adaptor proteins Nck1 and Nck2 in
invadopodia, promoting matrix degrading activity. It has been
postulated that once Nck proteins are recruited to invadopodia,
they regulate the actin network via Nck SH3 domain-associated
proteins such as N-WASP and the Arp2/3 actin nucleation complex
(66,67). Potentially, Tks5-Nck mediated actin
assembly could regulate protrusive or vesicular trafficking events
in invadopodia within cells at the invasive edge of the tumour. The
ECM degradation required for the invasive tumour cells in this
region may be linked to the focal recruitment and activation of a
number of pericellular proteases including the zinc-regulated
metalloproteases (MMP-2, MMP-9 and MT1-MMP) (6,7,15).
Demonstrating that Tks5 and Nck co-localize at the invading edge of
the tumour within the infiltrating cells would further enhance the
importance of Tks5 (and binding partners such as Nck) within
invadopodia and the invasion process utilized by tumour cells.
Artym et al (15) observed that another regulator of
invadopodium formation, cortactin, was recruited to invadopodia
preceding the trafficking of MMPs to future sites of ECM
degradation. It has also been suggested that a major role of
cortactin in invadopodia is to regulate the localization and
secretion of MMPs by coupling the dynamic actin assembly to the
secretory machinery to enhance ECM degradation (6,7). As we
previously observed that increased Tks5 expression results in
enhanced matrix degradation (24),
we generated a doxycycline inducible system of Tks5 overexpression
to precisely ascertain if the increase in ECM degradation in these
cells is linked to regulation of the MMP component of invadopodium
biogenesis. In the present study, we witnessed an increase in the
levels of processed mature MMP-2 in the conditioned medium of the
B16F10 doxycycline inducible pooled cells overexpressing Src and
Tks5. This indicates that increased Src and Tks5 expression results
in enhanced processing and activation of MMP-2. It has also been
demonstrated that in EGF-treated cells, Tks5 is phosphorylated
within minutes and that this is catalyzed by Src (25). The observed secretion and activation
of MMP-2 could be mediated through Src-mediated phosphorylation of
Tks5 Y557 allowing for Nck recruitment to Tks5 within invadopodia
(24). To further ascertain if Tks5
is required for the proteolytic process of invasion, the B16F10
inducible pooled cells were transiently transfected with Tks5
siRNA. A reduction in Tks5 expression also resulted in a
considerable decrease in the invasive capacity of the Tks5 siRNA or
GM6001-treated cells compared to the control siRNA duplex cells.
The invasive capacity of the control cells or Tks5
siRNA-transfected cells was not completely abolished when treated
with GM6001, suggesting the existence of a protease-independent
method of invasion not dependent on Tks5 expression (68).
The importance of invadopodia has been emphasized by
an increasing number of publications in recent years attempting to
clarify the key components and regulatory mechanisms of these
structures (5,6,8,9,11,12,14,15,18,27,33,69).
These studies have shown that invadopodia in a number of cancer
cell lines are involved in the reorganization and degradation of
the surrounding ECM. Many of these studies have focused on the
actin-binding protein, cortactin, which stabilizes the interaction
of Arp2/3 with F-actin in the formation of invadopodia (6,7,15,70–72).
However, Tks5, as a multi-SH3 domain adaptor protein and also an
Src substrate, has been shown to localize to these structures
(3) and be a vital component
required for their formation in Src transformed fibroblasts
(28) and melanoma cells (24).
Finally, given the importance of finding prognostic
markers for the diagnosis and treatment of cancers, there has been
increasing evidence linking invadopodium-associated proteins, such
as cortactin to poor disease-specific survival in patients
(73–75). We previously conducted a
retrospective pilot study evaluating the possible role of Tks5 as a
prognostic marker in human glioma (30). Even though there was no correlation
of Tks5 expression with the grade of glioma, we established that
Tks5 expression in glioma can predict reduced survival particularly
in lower grade astrocytoma and oligoastrocytoma patients. Our
current analysis of Tks5 expression in a number of different human
cancers in a commercial tissue microarray also showed increased
Tks5 expression in other tumour tissue types (breast, colon, lung
and prostate cancer) relative to the corresponding normal tissue.
These results also support the previous observations (28) and strengthen the rationale for
further examining the role of Tks5 in cancer given the
overexpression observed in a number of human cancers. Our Oncomine
data further highlights the need for expanded studies investigating
the clinical significance of Tks5 in a range of cancers. The data
extracted from the Oncomine compendium showed that enhanced Tks5
expression was higher in metastatic tumours compared to the primary
tumours for ovarian, breast and prostate cancer. In addition, there
was also a significant increase in the number of metastatic events
when Tks5 was overexpressed.
We intend to undertake further studies examining
Tks5 expression in tumour tissues of different types of cancers and
histological grades and integrating this with the clinical
information (including response to therapies) to obtain a more
detailed Tks5 prognostic profile, as the commercial tissue array
utilized in this study, did not have associated relevant patient
survival data linked to the pathological diagnosis. Patients with a
poorer prognosis may harbour tumours with a more invasive margin
that contain Tks5-positive cells infiltrating further into the
surrounding tissue. These cells may also show co-localization of
Tks5 binding partners such as Nck, supporting an Src-Tks5-Nck
signalling pathway (24). This
approach is reinforced by the results from our present analysis of
the Oncomine database, where Tks5 overexpression in human types of
cancers was listed in the top 10–15% of all genes that were
analysed in the respective cancer datasets. In conclusion, the
present study identified Tks5 as a potential prognostic indicator
in the range of cancers examined. Secondly, it raises the
possibility that Tks5 should be further investigated as a pertinent
molecular target in the development of future anticancer agents for
personalized therapy of patients harbouring Tks5 overexpressing
tumours.
Acknowledgements
We are grateful to the contributors of data to
Oncomine and those who have made their data publicly available.
Abbreviations:
|
DMEM
|
Dulbecco’s modified Eagle’s medium
|
|
ECM
|
extracellular matrix
|
|
EGF
|
epidermal growth factor
|
|
EGFR
|
epidermal growth factor receptor
|
|
FCS
|
foetal calf serum
|
|
HRP
|
horseradish peroxidase
|
|
kDa
|
kilodalton
|
|
MMP
|
matrix metalloproteinase
|
|
nM
|
nanomolar
|
|
rpm
|
revolutions per minute
|
|
SDS
|
sodium dodecyl sulphate
|
|
SEM
|
standard error of the mean
|
|
Tks5
|
tyrosine kinase substrate with 5 SH3
domains
|
|
TMA
|
tissue microarray
|
|
WIP
|
WASP-interacting protein
|
References
|
1
|
Sporn MB: The war on cancer. Lancet.
347:1377–1381. 1996. View Article : Google Scholar : PubMed/NCBI
|
|
2
|
Hanahan D and Weinberg RA: Hallmarks of
cancer: the next generation. Cell. 144:646–674. 2011. View Article : Google Scholar : PubMed/NCBI
|
|
3
|
Abram CL, Seals DF, Pass I, et al: The
adaptor protein fish associates with members of the ADAMs family
and localizes to podosomes of Src-transformed cells. J Biol Chem.
278:16844–16851. 2003. View Article : Google Scholar : PubMed/NCBI
|
|
4
|
Bowden ET, Barth M, Thomas D, Glazer RI
and Mueller SC: An invasion-related complex of cortactin, paxillin
and PKCμ associates with invadopodia at sites of extracellular
matrix degradation. Oncogene. 18:4440–4449. 1999.PubMed/NCBI
|
|
5
|
Buccione R, Caldieri G and Ayala I:
Invadopodia: specialized tumor cell structures for the focal
degradation of the extracellular matrix. Cancer Metastasis Rev.
28:137–149. 2009. View Article : Google Scholar : PubMed/NCBI
|
|
6
|
Clark ES and Weaver AM: A new role for
cortactin in invadopodia: regulation of protease secretion. Eur J
Cell Biol. 87:581–590. 2008. View Article : Google Scholar : PubMed/NCBI
|
|
7
|
Clark ES, Whigham AS, Yarbrough WG and
Weaver AM: Cortactin is an essential regulator of matrix
metalloproteinase secretion and extracellular matrix degradation in
invadopodia. Cancer Res. 67:4227–4235. 2007. View Article : Google Scholar : PubMed/NCBI
|
|
8
|
Gimona M, Buccione R, Courtneidge SA and
Linder S: Assembly and biological role of podosomes and
invadopodia. Curr Opin Cell Biol. 20:235–241. 2008. View Article : Google Scholar
|
|
9
|
Linder S: The matrix corroded: podosomes
and invadopodia in extracellular matrix degradation. Trends Cell
Biol. 17:107–117. 2007. View Article : Google Scholar : PubMed/NCBI
|
|
10
|
Linder S and Aepfelbacher M: Podosomes:
adhesion hot-spots of invasive cells. Trends Cell Biol. 13:376–385.
2003. View Article : Google Scholar : PubMed/NCBI
|
|
11
|
Weaver AM: Invadopodia: specialized cell
structures for cancer invasion. Clin Exp Metastasis. 23:97–105.
2006. View Article : Google Scholar : PubMed/NCBI
|
|
12
|
Weaver AM: Cortactin in tumor
invasiveness. Cancer Lett. 265:157–166. 2008. View Article : Google Scholar : PubMed/NCBI
|
|
13
|
Webb BA, Jia L, Eves R and Mak AS:
Dissecting the functional domain requirements of cortactin in
invadopodia formation. Eur J Cell Biol. 86:189–206. 2007.
View Article : Google Scholar : PubMed/NCBI
|
|
14
|
Yamaguchi H, Pixley F and Condeelis J:
Invadopodia and podosomes in tumor invasion. Eur J Cell Biol.
85:213–218. 2006. View Article : Google Scholar : PubMed/NCBI
|
|
15
|
Artym VV, Zhang Y, Seillier-Moiseiwitsch
F, Yamada KM and Mueller SC: Dynamic interactions of cortactin and
membrane type 1 matrix metalloproteinase at invadopodia: defining
the stages of invadopodia formation and function. Cancer Res.
66:3034–3043. 2006. View Article : Google Scholar : PubMed/NCBI
|
|
16
|
Daly RJ: Cortactin signalling and dynamic
actin networks. Biochem J. 382:13–25. 2004. View Article : Google Scholar : PubMed/NCBI
|
|
17
|
Li Y, Tondravi M, Liu J, et al: Cortactin
potentiates bone metastasis of breast cancer cells. Cancer Res.
61:6906–6911. 2001.PubMed/NCBI
|
|
18
|
Yamaguchi H, Lorenz M, Kempiak S, et al:
Molecular mechanisms of invadopodium formation: the role of the
N-WASP-Arp2/3 complex pathway and cofilin. J Cell Biol.
168:441–452. 2005. View Article : Google Scholar : PubMed/NCBI
|
|
19
|
Staub E, Groene J, Heinze M, et al: An
expression module of WIPF1-coexpressed genes identifies patients
with favorable prognosis in three tumor types. J Mol Med.
87:633–644. 2009. View Article : Google Scholar : PubMed/NCBI
|
|
20
|
Hanahan D and Weinberg RA: The hallmarks
of cancer. Cell. 100:57–70. 2000. View Article : Google Scholar
|
|
21
|
Pao W, Miller V, Zakowski M, et al: EGF
receptor gene mutations are common in lung cancers from ‘never
smokers’ and are associated with sensitivity of tumors to gefitinib
and erlotinib. Proc Natl Acad Sci USA. 101:13306–13311. 2004.
|
|
22
|
Zeineldin R, Muller CY, Stack MS and
Hudson LG: Targeting the EGF receptor for ovarian cancer therapy. J
Oncol. 2010:4146762010. View Article : Google Scholar : PubMed/NCBI
|
|
23
|
Lock P, Abram CL, Gibson T and Courtneidge
SA: A new method for isolating tyrosine kinase substrates used to
identify fish, an SH3 and PX domain-containing protein, and Src
substrate. The EMBO J. 17:4346–4357. 1998. View Article : Google Scholar : PubMed/NCBI
|
|
24
|
Stylli SS, Stacey TT, Verhagen AM, et al:
Nck adaptor proteins link Tks5 to invadopodia actin regulation and
ECM degradation. J Cell Sci. 122:2727–2740. 2009. View Article : Google Scholar : PubMed/NCBI
|
|
25
|
Fekete A, Bőgel G, Pesti S, Péterfi Z,
Geiszt M and Buday L: EGF regulates tyrosine phosphorylation and
membrane-translocation of the scaffold protein Tks5. J Mol Signal.
8:82013. View Article : Google Scholar : PubMed/NCBI
|
|
26
|
Balzer EM, Whipple RA, Thompson K, et al:
c-Src differentially regulates the functions of microtentacles and
invadopodia. Oncogene. 29:6402–6408. 2010. View Article : Google Scholar : PubMed/NCBI
|
|
27
|
Oikawa T, Itoh T and Takenawa T:
Sequential signals toward podosome formation in NIH-src cells. J
Cell Biol. 182:157–169. 2008. View Article : Google Scholar : PubMed/NCBI
|
|
28
|
Seals DF, Azucena EF Jr, Pass I, et al:
The adaptor protein Tks5/Fish is required for podosome formation
and function, and for the protease-driven invasion of cancer cells.
Cancer Cell. 7:155–165. 2005. View Article : Google Scholar : PubMed/NCBI
|
|
29
|
Murphy DA, Diaz B, Bromann PA, et al: A
Src-Tks5 pathway is required for neural crest cell migration during
embryonic development. PLoS One. 6:e224992011. View Article : Google Scholar : PubMed/NCBI
|
|
30
|
Stylli SS, I ST, Kaye AH and Lock P:
Prognostic significance of Tks5 expression in gliomas. J Clin
Neurosci. 19:436–442. 2012. View Article : Google Scholar : PubMed/NCBI
|
|
31
|
Zhu HJ, Iaria J and Sizeland AM: Smad7
differentially regulates transforming growth factor β-mediated
signaling pathways. J Biol Chem. 274:32258–32264. 1999.
|
|
32
|
Rhodes DR, Yu J, Shanker K, et al:
ONCOMINE: a cancer microarray database and integrated data-mining
platform. Neoplasia. 6:1–6. 2004. View Article : Google Scholar : PubMed/NCBI
|
|
33
|
Ayala I, Baldassarre M, Caldieri G and
Buccione R: Invadopodia: a guided tour. Eur J Cell Biol.
85:159–164. 2006. View Article : Google Scholar : PubMed/NCBI
|
|
34
|
Baldassarre M, Pompeo A, Beznoussenko G,
et al: Dynamin participates in focal extracellular matrix
degradation by invasive cells. Mol Biol Cell. 14:1074–1084. 2003.
View Article : Google Scholar : PubMed/NCBI
|
|
35
|
Deryugina EI and Quigley JP: Matrix
metalloproteinases and tumor metastasis. Cancer Metastasis Rev.
25:9–34. 2006. View Article : Google Scholar
|
|
36
|
Deryugina EI, Ratnikov B, Monosov E, et
al: MT1-MMP initiates activation of pro-MMP-2 and integrin αvβ3
promotes maturation of MMP-2 in breast carcinoma cells. Exp Cell
Res. 263:209–223. 2001.
|
|
37
|
Finak G, Bertos N, Pepin F, et al: Stromal
gene expression predicts clinical outcome in breast cancer. Nat
Med. 14:518–527. 2008. View
Article : Google Scholar : PubMed/NCBI
|
|
38
|
Curtis C, Shah SP, Chin SF, et al: The
genomic and transcriptomic architecture of 2,000 breast tumours
reveals novel subgroups. Nature. 486:346–352. 2012.PubMed/NCBI
|
|
39
|
Ma XJ, Dahiya S, Richardson E, Erlander M
and Sgroi DC: Gene expression profiling of the tumor
microenvironment during breast cancer progression. Breast Cancer
Res. 11:R72009. View Article : Google Scholar : PubMed/NCBI
|
|
40
|
Buchholz M, Braun M, Heidenblut A, et al:
Transcriptome analysis of microdissected pancreatic intraepithelial
neoplastic lesions. Oncogene. 24:6626–6636. 2005. View Article : Google Scholar : PubMed/NCBI
|
|
41
|
Badea L, Herlea V, Dima SO, Dumitrascu T
and Popescu I: Combined gene expression analysis of whole-tissue
and microdissected pancreatic ductal adenocarcinoma identifies
genes specifically overexpressed in tumor epithelia.
Hepatogastroenterology. 55:2016–2027. 2008.
|
|
42
|
Iacobuzio-Donahue CA, Maitra A, Olsen M,
et al: Exploration of global gene expression patterns in pancreatic
adenocarcinoma using cDNA microarrays. Am J Pathol. 162:1151–1162.
2003. View Article : Google Scholar : PubMed/NCBI
|
|
43
|
Chen X, Leung SY, Yuen ST, et al:
Variation in gene expression patterns in human gastric cancers. Mol
Biol Cell. 14:3208–3215. 2003. View Article : Google Scholar : PubMed/NCBI
|
|
44
|
Cho JY, Lim JY, Cheong JH, et al: Gene
expression signaturebased prognostic risk score in gastric cancer.
Clin Cancer Res. 17:1850–1857. 2011. View Article : Google Scholar : PubMed/NCBI
|
|
45
|
D’Errico M, de Rinaldis E, Blasi MF, et
al: Genome-wide expression profile of sporadic gastric cancers with
microsatellite instability. Eur J Cancer. 45:461–469.
2009.PubMed/NCBI
|
|
46
|
Korkola JE, Houldsworth J, Chadalavada RS,
et al: Down-regulation of stem cell genes, including those in a
200-kb gene cluster at 12p13.31, is associated with in vivo
differentiation of human male germ cell tumors. Cancer Res.
66:820–827. 2006. View Article : Google Scholar : PubMed/NCBI
|
|
47
|
Barretina J, Taylor BS, Banerji S, et al:
Subtype-specific genomic alterations define new targets for
soft-tissue sarcoma therapy. Nat Genet. 42:715–721. 2010.
View Article : Google Scholar : PubMed/NCBI
|
|
48
|
Skotheim RI, Lind GE, Monni O, et al:
Differentiation of human embryonal carcinomas in vitro and in vivo
reveals expression profiles relevant to normal development. Cancer
Res. 65:5588–5598. 2005. View Article : Google Scholar : PubMed/NCBI
|
|
49
|
Yusenko MV, Kuiper RP, Boethe T, Ljungberg
B, van Kessel AG and Kovacs G: High-resolution DNA copy number and
gene expression analyses distinguish chromophobe renal cell
carcinomas and renal oncocytomas. BMC Cancer. 9:1522009. View Article : Google Scholar : PubMed/NCBI
|
|
50
|
Nindl I, Dang C, Forschner T, et al:
Identification of differentially expressed genes in cutaneous
squamous cell carcinoma by microarray expression profiling. Mol
Cancer. 5:302006. View Article : Google Scholar : PubMed/NCBI
|
|
51
|
Talantov D, Mazumder A, Yu JX, et al:
Novel genes associated with malignant melanoma but not benign
melanocytic lesions. Clin Cancer Res. 11:7234–7242. 2005.
View Article : Google Scholar : PubMed/NCBI
|
|
52
|
Bredel M, Bredel C, Juric D, et al:
Functional network analysis reveals extended gliomagenesis pathway
maps and three novel MYC-interacting genes in human gliomas. Cancer
Res. 65:8679–8689. 2005. View Article : Google Scholar : PubMed/NCBI
|
|
53
|
Hou J, Aerts J, den Hamer B, et al: Gene
expression-based classification of non-small cell lung carcinomas
and survival prediction. PLoS One. 5:e103122010. View Article : Google Scholar : PubMed/NCBI
|
|
54
|
Kaiser S, Park YK, Franklin JL, et al:
Transcriptional recapitulation and subversion of embryonic colon
development by mouse colon tumor models and human colon cancer.
Genome Biol. 8:R1312007. View Article : Google Scholar : PubMed/NCBI
|
|
55
|
Aoyagi K, Tatsuta T, Nishigaki M, et al: A
faithful method for PCR-mediated global mRNA amplification and its
integration into microarray analysis on laser-captured cells.
Biochem Biophys Res Commun. 300:915–920. 2003. View Article : Google Scholar : PubMed/NCBI
|
|
56
|
Anglesio MS, Arnold JM, George J, et al:
Mutation of ERBB2 provides a novel alternative mechanism for the
ubiquitous activation of RAS-MAPK in ovarian serous low malignant
potential tumors. Mol Cancer Res. 6:1678–1690. 2008. View Article : Google Scholar : PubMed/NCBI
|
|
57
|
Tothill RW, Tinker AV, George J, et al:
Novel molecular subtypes of serous and endometrioid ovarian cancer
linked to clinical outcome. Clin Cancer Res. 14:5198–5208. 2008.
View Article : Google Scholar : PubMed/NCBI
|
|
58
|
Radvanyi L, Singh-Sandhu D, Gallichan S,
et al: The gene associated with trichorhinophalangeal syndrome in
humans is overexpressed in breast cancer. Proc Natl Acad Sci USA.
102:11005–11010. 2005. View Article : Google Scholar : PubMed/NCBI
|
|
59
|
Grasso CS, Wu YM, Robinson DR, et al: The
mutational landscape of lethal castration-resistant prostate
cancer. Nature. 487:239–243. 2012. View Article : Google Scholar : PubMed/NCBI
|
|
60
|
Desmedt C, Piette F, Loi S, et al: Strong
time dependence of the 76-gene prognostic signature for
node-negative breast cancer patients in the TRANSBIG multicenter
independent validation series. Clin Cancer Res. 13:3207–3214. 2007.
View Article : Google Scholar
|
|
61
|
Minn AJ, Gupta GP, Siegel PM, et al: Genes
that mediate breast cancer metastasis to lung. Nature. 436:518–524.
2005. View Article : Google Scholar : PubMed/NCBI
|
|
62
|
Laurent C, Valet F, Planque N, et al: High
PTP4A3 phosphatase expression correlates with metastatic risk in
uveal melanoma patients. Cancer Res. 71:666–674. 2011. View Article : Google Scholar : PubMed/NCBI
|
|
63
|
Loi S, Haibe-Kains B, Desmedt C, et al:
Predicting prognosis using molecular profiling in estrogen
receptor-positive breast cancer treated with tamoxifen. BMC
Genomics. 9:2392008. View Article : Google Scholar : PubMed/NCBI
|
|
64
|
Loi S, Haibe-Kains B, Desmedt C, et al:
Definition of clinically distinct molecular subtypes in estrogen
receptor-positive breast carcinomas through genomic grade. J Clin
Oncol. 25:1239–1246. 2007. View Article : Google Scholar : PubMed/NCBI
|
|
65
|
Lambrechts A, Van Troys M and Ampe C: The
actin cytoskeleton in normal and pathological cell motility. Int J
Biochem Cell Biol. 36:1890–1909. 2004. View Article : Google Scholar : PubMed/NCBI
|
|
66
|
Rohatgi R, Nollau P, Ho HY, Kirschner MW
and Mayer BJ: Nck and phosphatidylinositol 4,5-bisphosphate
synergistically activate actin polymerization through the
N-WASP-Arp2/3 pathway. J Biol Chem. 276:26448–26452. 2001.
View Article : Google Scholar : PubMed/NCBI
|
|
67
|
Rivera GM, Briceño CA, Takeshima F,
Snapper SB and Mayer BJ: Inducible clustering of membrane-targeted
SH3 domains of the adaptor protein Nck triggers localized actin
polymerization. Curr Biol. 14:11–22. 2004. View Article : Google Scholar : PubMed/NCBI
|
|
68
|
Rowe RG and Weiss SJ: Navigating ECM
barriers at the invasive front: the cancer cell-stroma interface.
Annu Rev Cell Dev Biol. 25:567–595. 2009. View Article : Google Scholar : PubMed/NCBI
|
|
69
|
Bowden ET, Onikoyi E, Slack R, et al:
Co-localization of cortactin and phosphotyrosine identifies active
invadopodia in human breast cancer cells. Exp Cell Res.
312:1240–1253. 2006. View Article : Google Scholar : PubMed/NCBI
|
|
70
|
Kinley AW, Weed SA, Weaver AM, et al:
Cortactin interacts with WIP in regulating Arp2/3 activation and
membrane protrusion. Curr Biol. 13:384–393. 2003. View Article : Google Scholar : PubMed/NCBI
|
|
71
|
Oser M, Yamaguchi H, Mader CC, et al:
Cortactin regulates cofilin and N-WASp activities to control the
stages of invadopodium assembly and maturation. J Cell Biol.
186:571–587. 2009. View Article : Google Scholar : PubMed/NCBI
|
|
72
|
Webb BA, Zhou S, Eves R, Shen L, Jia L and
Mak AS: Phosphorylation of cortactin by p21-activated kinase. Arch
Biochem Biophys. 456:183–193. 2006. View Article : Google Scholar : PubMed/NCBI
|
|
73
|
Gibcus JH, Mastik MF, Menkema L, et al:
Cortactin expression predicts poor survival in laryngeal carcinoma.
Br J Cancer. 98:950–955. 2008. View Article : Google Scholar : PubMed/NCBI
|
|
74
|
Hofman P, Butori C, Havet K, et al:
Prognostic significance of cortactin levels in head and neck
squamous cell carcinoma: comparison with epidermal growth factor
receptor status. Br J Cancer. 98:956–964. 2008. View Article : Google Scholar : PubMed/NCBI
|
|
75
|
Sheen-Chen SM, Huang CY, Liu YY, Huang CC
and Tang RP: Cortactin in breast cancer: analysis with tissue
microarray. Anticancer Res. 31:293–297. 2011.PubMed/NCBI
|
|
76
|
Bonome T, Levine DA, Shih J, et al: A gene
signature predicting for survival in suboptimally debulked patients
with ovarian cancer. Cancer Res. 68:5478–5486. 2008. View Article : Google Scholar : PubMed/NCBI
|
|
77
|
Freije WA, Castro-Vargas FE, Fang Z, et
al: Gene expression profiling of gliomas strongly predicts
survival. Cancer Res. 64:6503–6510. 2004. View Article : Google Scholar : PubMed/NCBI
|
|
78
|
Giordano TJ, Kuick R, Else T, et al:
Molecular classification and prognostication of adrenocortical
tumors by transcriptome profiling. Clin Cancer Res. 15:668–676.
2009. View Article : Google Scholar : PubMed/NCBI
|
|
79
|
Smith JJ, Deane NG, Wu F, et al:
Experimentally derived metastasis gene expression profile predicts
recurrence and death in patients with colon cancer.
Gastroenterology. 138:958–968. 2010. View Article : Google Scholar : PubMed/NCBI
|
|
80
|
Nakayama R, Mitani S, Nakagawa T, et al:
Gene expression profiling of synovial sarcoma: distinct signature
of poorly differentiated type. Am J Surg Pathol. 34:1599–1607.
2010.PubMed/NCBI
|
|
81
|
Phillips HS, Kharbanda S, Chen R, et al:
Molecular subclasses of high-grade glioma predict prognosis,
delineate a pattern of disease progression, and resemble stages in
neurogenesis. Cancer Cell. 9:157–173. 2006. View Article : Google Scholar : PubMed/NCBI
|