Introduction
Intrahepatic cholangiocarcinoma (ICC), arising from
cholangiocytes of small intrahepatic bile ducts or bile ductules,
is the second most common type of primary hepatic malignancy second
to hepatocellular carcinoma (HCC) among all liver malignancies.
Although ICC accounts for ~10–15% (1) of liver cancers, its incidence and
mortality has increased drastically over the past several decades
in China and even worldwide (2,3). In
most cases, there is no particular clinical symptom for the early
onset in ICC, and no specific or practical laboratory markers for
early diagnosis. Although radical surgical resection is associated
with an estimated 5-year survival rate of ~35% in ICC patients
(4), the overall prognosis for ICC
has remained very poor for decades (5–8). To
date, limited serum markers for ICC, such as carbohydrate antigen
19-9 (CA19-9) (9), carcinogenic
embryonic antigen (CEA) (10),
cancer antigen 125 (CA-125) (11)
and serum cytokeratin 19 fragment (CYFRA 21-1) (12) have been reported to be useful in
diagnostic procedures, but the sensitivity and specificity of these
markers remain far lower than expected. For diagnosing ICC, the
sensitivity and specificity of CA19-9 are 62 and 63%, respectively
(13). Thus, these biomarkers
cannot be used for early qualitative detection but only for
auxiliary diagnosis. There is still an urgent need for the
identification of new biomarkers for the early diagnosis of ICC in
clinical practice.
MicroRNAs (miRNAs) are a class of small non-coding
RNA molecules, which play a crucial role in the regulation of gene
expression at the post-translational level (14). miRNAs are critically involved in
diverse cellular pathways, such as cell proliferation,
differentiation and apoptosis (15). Dysregulation of miRNAs has been
observed in various tumors including ICC (16–18).
Many studies have revealed definite associations between miRNAs and
HCC, such as miR-200c, miR-141 and miR-126 that could be used to
distinguish primary HCC vs. metastatic tumors in liver. Yet, few
studies have focused on the involvement of miRNAs in ICC. For
example, miR-31 was found to suppress the expression of RASA1 and
promote oncogenesis in ICC cells (18); miR-124 may participate in the
migration and invasion of ICC cells by targeting SMYD3 (19). Meanwhile, most of these studies were
carried out only on cell lines. According to the vital function of
miRNAs, potential diagnostic, and prognostic roles in other
malignancies, we hypothesized that certain miRNAs may have
diagnostic and/or prognostic significance in ICC. The aim of this
study was to identify potential miRNAs as biomarkers for the
screening or diagnosis of ICC in the early stage. We applied miRNA
microarray to detect miRNA expression profiling in ICC tissues and
adjacent normal tissues. Among the 10 differentially expressed
miRNAs, miR-150 showed consistently lower expression levels in ICC.
Subsequently, we compared the expression profiles of miR-150 in ICC
tissues, adjacent normal tissues, and plasma samples to investigate
the correlation between miR-150 and clinical characteristics. To
our knowledge, this study is the first one to identify the
diagnostic value of miR-150 in ICC.
Materials and methods
Patients and samples
The study population in the present study was
enrolled at the Department of General Surgery of Tangdu Hospital
(The Fourth Military Medical University, Xi’an, China) during the
period from January 2012 to October 2013. All subjects provided
informed consent. The ICC patients were diagnosed based on clinical
and imageology, and received radical resection in accordance with
clinical practice guidelines of The National Comprehensive Cancer
Network (NCCN) for Hepatobiliary Cancers. The final diagnosis was
confirmed by pathological diagnosis. Meanwhile, 15 age- and
gender-matched patients treated in our department who were
cancer-free, were used as controls in the present study.
Epidemiological and clinicopathological information for all
patients was obtained from the in-hospital medical records. The
differences in demographic and clinical characteristics between the
2 groups are shown in Table I. In
total, we utilized 15 ICC cancerous tissues, 15 peritumoral normal
tissues, 15 paired blood samples from the ICC patients and the
controls. The study was approved by the Institute Research Ethics
Committee of Tangdu Hospital.
 | Table IClinical characteristics of the ICC
patients and controls. |
Table I
Clinical characteristics of the ICC
patients and controls.
| ICC patients
(n=15) | Controls (n=15) | P-value |
|---|
| Clinical factors |
| Age (years) | 57±10 | 57±11 | 0.974 |
| Gender (M/F) | 11/4 | 11/4 | 0.659 |
| RBC
(×109/l) | 4.27±0.55 | 4.48±0.26 | 0.227 |
| WBC
(×109/l) | 6.83±3.28 | 5.74±1.01 | 0.235 |
| PLT
(×109/l) | 160.07±79.54 | 164.87±39.99 | 0.836 |
| Hb
(×109/l) | 133.47±15.01 | 130.33±8.64 | 0.498 |
| ALT (U/l) | 48.8±37.72 | 25.7±15.52 | 0.056 |
| AST (U/l) | 40.9±26.19 | 39.3±14.67 | 0.841 |
| ALP (U/l) | 40.8±4.30 | 39.5±4.48 | 0.360 |
| ALB (g/l) | 40.9±4.30 | 44.9±3.84 |
0.010a |
| TB (μmol/l) | 60.99±119.12 | 11.27±5.73 | 0.129 |
| Operation time
(min) | 333.67±152.27 | | |
| Tumor-related
factors |
| AFP (ng/ml) | 43.83±156.57 | 3.89±2.10 | 0.340 |
| CEA (ng/ml) | 15.97±33.65 | 2.14±1.08 | 0.134 |
| CA19-9
(ng/ml) |
1029.32±2573.42 | 16.64±6.65 | 0.150 |
| Child-Pugh
(A/B) | 12/3 | | |
miRNA microarray
miRNA microarray was performed in 3 pairs of tissue
specimens which were collected from 1 male and 2 female ICC
patients, using a service provider (LC Sciences, Houston, TX, USA).
The assay starting with 4 to 8 μg total RNA was 3′-extended with a
poly(A) tail using poly(A) polymerase. An oligonucleotide tag was
then liquated to the poly(A) tail for later fluorescent dye
staining. Hybridization was performed overnight on a μParaflo
microfluidic chip using a micro-circulation pump (Atactic
Technologies, Houston, TX, USA). On the microfluidic chip, each
detection probe consisted of a chemically modified nucleotide
coding segment complementary to target miRNA or control RNA and a
spacer segment of polyethylene glycol to extend the coding segment
away from the substrate. The detection probes were made by in
situ synthesis using photo-generated reagent chemistry.
Hybridization used 100 liters 6X SSPE buffer containing 25%
formamide at 34°C. After RNA hybridization, tag-conjugating Cy3 dye
was circulated through the microfluidic chip for dye staining.
Fluorescence images were collected using a laser scanner (GenePix
4000B; Molecular Devices, Sunnyvale, CA, USA) and digitized using
Array-Pro image analysis software (Media Cybernetics, Bethesda, MD,
USA). Data were analyzed by first subtracting the background and
then normalizing the signals using a LOWESS filter
(locally-weighted regression).
RNA isolation, complementary DNA
synthesis, and quantification
According to the manufacturer’s instructions, total
RNAs including miRNAs were extracted from tissues and plasma
samples using the miRNeasy® Mini Kit (Qiagen, German)
and RN24-BLOODmisi (Aidlab Biotechnologies, Beijing, China),
respectively. For tissues, every 25 μg sample was ground to powder,
and mixed with 700 μl QIAzol lysis reagent, then disrupted and
homogenized at room temperature for 5 min. After being mixed with
140 μl chloroform, the upper aqueous phase was added with 525 μl
100% ethanol, and then 700 μl of the sample was pipetted into the
RNeasy® Mini column and centrifuged at 10,000 rpm for 15
sec at room temperature. The miRNA was eluted with 40 μl RNase-free
water. The isolation of plasma RNA was carried out using a similar
procedure according to the RN24-BLOODmisi instructions. The purity
of the RNA solution was detected by measuring its absorbance at 260
and 280 nm using a NanoDrop™ Lite spectrophotometer (Thermo
Scientific, Waltham, MA, USA). Pure RNA solution has an A260/A280
ratio of 1.89–2.07. All RNA preparations were stored at −80°C.
The reverse transcription reactions were carried out
on a PTC-200 Peltier thermal cycler (Bio-Rad Laboratories,
Shanghai, China) at 42°C for 60 min and then at 70°C for 5 min,
using a RevertAid First Strand cDNA synthesis kit (Thermo
Scientific) according to the manufacturer’s protocol. The reaction
solution volume was 20 μl, including 1 μl gene-specific primer, 4
μl 5X reaction buffer, 1 μl RiboLock RNase inhibitor, 2 μl dNTP
Mix, 1 μl RevertAid M-MuLV reverse transcriptase, 2.5 μl total RNA
solution and 8.5 μl RNase-free water.
To detect the expression level of mature miR-150,
quantitative qPCR was carried out using a Maxima SYBR-Green qPCR
Master Mix (Thermo Scientific) and ABI Prism 7500 (Applied
Biosystems, Foster City, CA, USA) according to the manufacturer’s
protocol. A housekeeping gene, hsa-miR-U6, was used as the
endogenous control for the tissue and plasma samples. Every 25 μl
of the qPCR reaction solution including 12.5 μl 2X Maxima
SYBR-Green qPCR Master Mix, 1.5 μl forward primer, 1.5 μl reverse
primer, 0.05 μl 10X ROX Reference Dye, 2.5 μl cDNA and 6.95 μl
RNase-free water. Amplification was carried out by ABI 7500 with a
cycling profile of 50°C for 2 min and 95°C for 10 min, followed by
40 cycles of 95°C for 15 sec, 60°C for 30 sec and 72°C for 30 sec.
Reverse transcription primers, forward primers and reverse primers
were provided by RiboBio Biotech (Guangzhou, China). Every sample,
including the negative control sample without cDNA template, was
performed in triplicate. The ΔCt method was used to quantify the
gene expression level as reported previously (20).
Statistical analysis
Statistical analysis was performed using Statistical
Program for Social Sciences (SPSS) software 21.0 (IBM-SPSS, Cary,
NC, USA), and graphs were generated using Graphpad Prism 6.0. The
difference in miRNA expression levels between groups was calculated
using the Student’s t-test or the Mann-Whitney U test. The
clinicopathological data are represented as means ± SD or
frequencies, and differences between groups were calculated by the
t-test, Mann-Whitney U test or Fisher’s exact test. The receiver
operating characteristic (ROC) curve and the areas under the ROC
curve (AUC) were used to evaluate the diagnostic value of miR-150
for differentiating ICC patients from controls. A value of
P<0.05 was considered to indicate a statistically significant
difference.
Results
Clinical features of the patients
Fifteen ICC patients (including 12 males) and 15
age- and gender-matched normal controls were recruited in the
present study. The age ranged from 45 to 76 years with a mean value
of 57 years. No significant difference was observed in the
distribution of age and gender, and there were no significant
differences in terms of ALT (P=0.056), AST (P=0.841), ALP
(P=0.360), CA19-9 (P=0.150) and CEA (P=0.134) between the 2 groups.
There was significant difference in the serum ALB level (P=0.010)
(Table I) between the 2 groups.
Despite the difference in ALB level which may have been caused by
cancer-related malnutrition, the 2 groups were fully comparable. As
for the statistical analysis of AFP and CA19-9, there were no
significant differences between the 2 groups. The distributional
difference in original data of AFP and CA19-9 was caused by the
maximum value of AFP 609 ng/ml and CA19-9 10,000 ng/ml in 2
patients, respectively.
miRNA microarray results
The miRNA expression profile in the 3 pairs of ICC
tissues and peritumoral normal tissues was analyzed using the
microarray platform μParaflo®. We found that 10 miRNAs
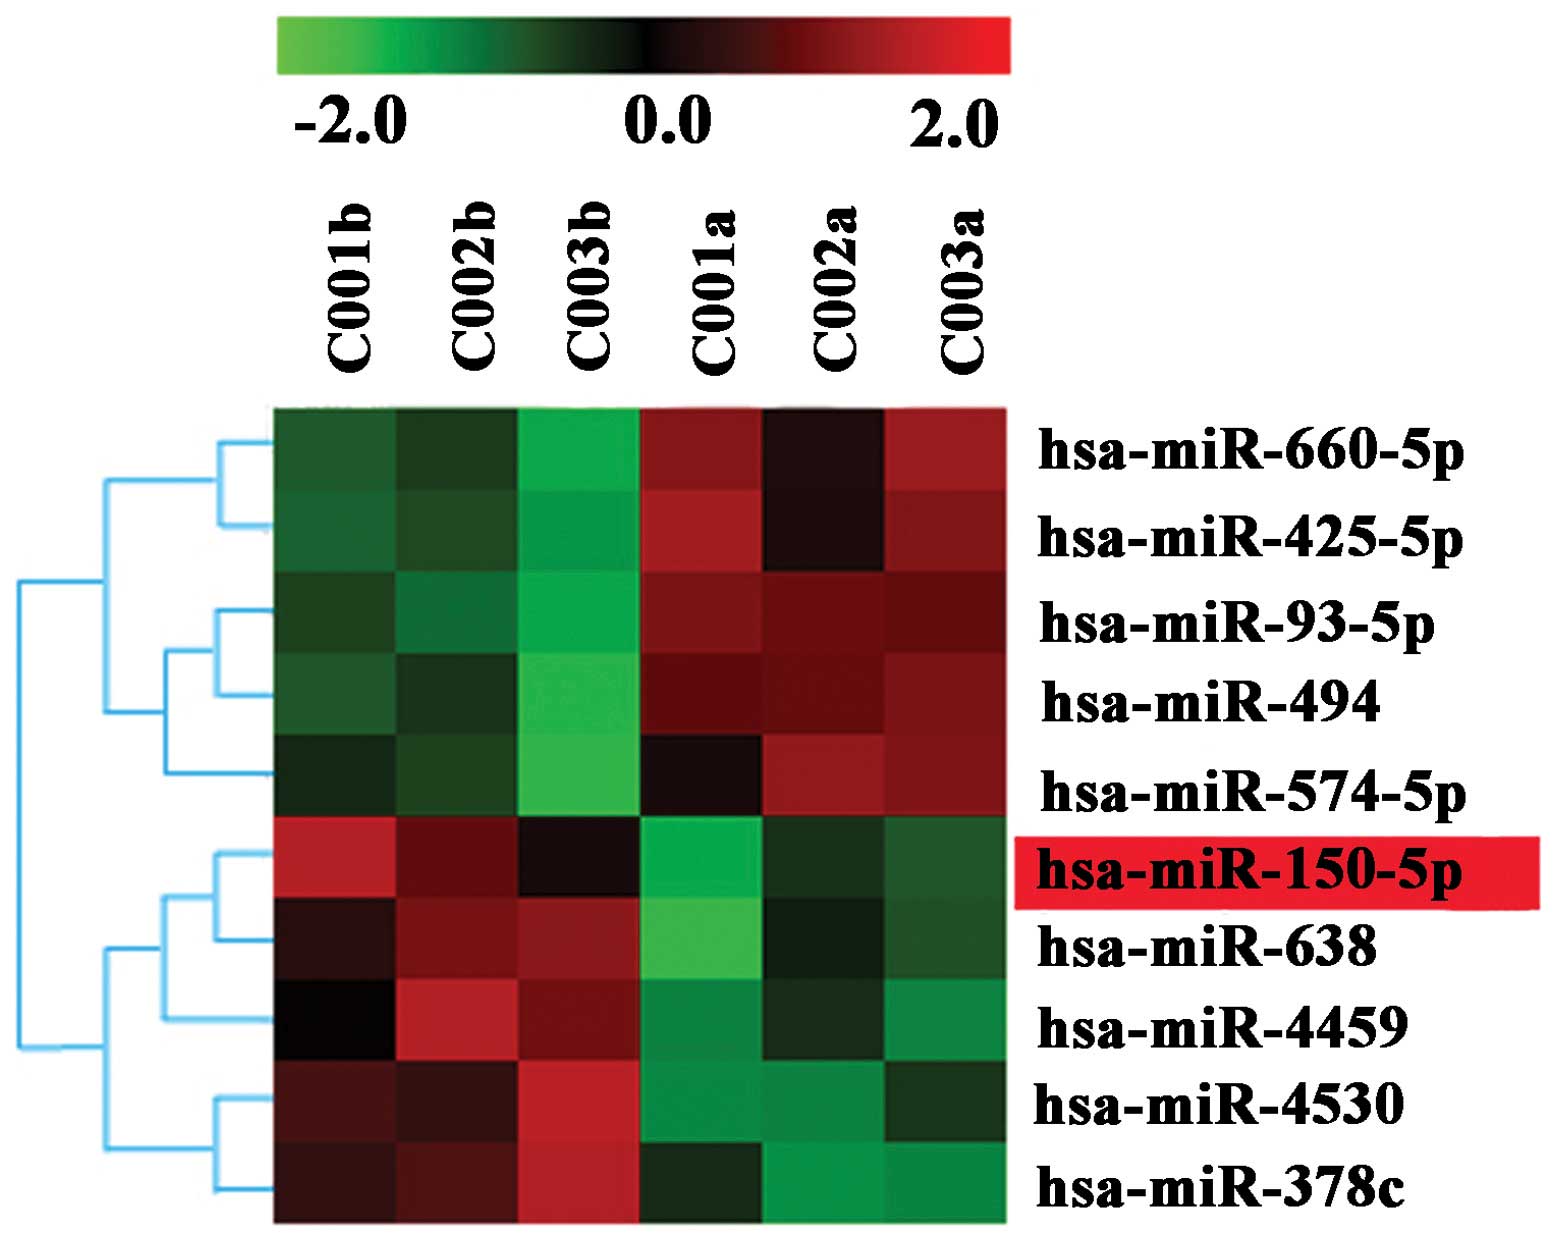
were dysregulated in the ICC cancerous tissues. Fig. 1 is the heat map of the dysregulated
targets and defines the comprehensive miRNA expression profiling.
The most significant downexpression values were found for miR-150,
miR-638, miR-4459, miR-4530 and miR-378c, while the overexpression
values were found for miRNA-660, miR-425, miR-93 and miR-494. Among
these miRNAs, miR-150 was selected for further investigation based
on an extensive literature review of the PubMed database due to the
potential biological function it may carry (21,22).
Expression of miR-150 in tissues and
plasma samples
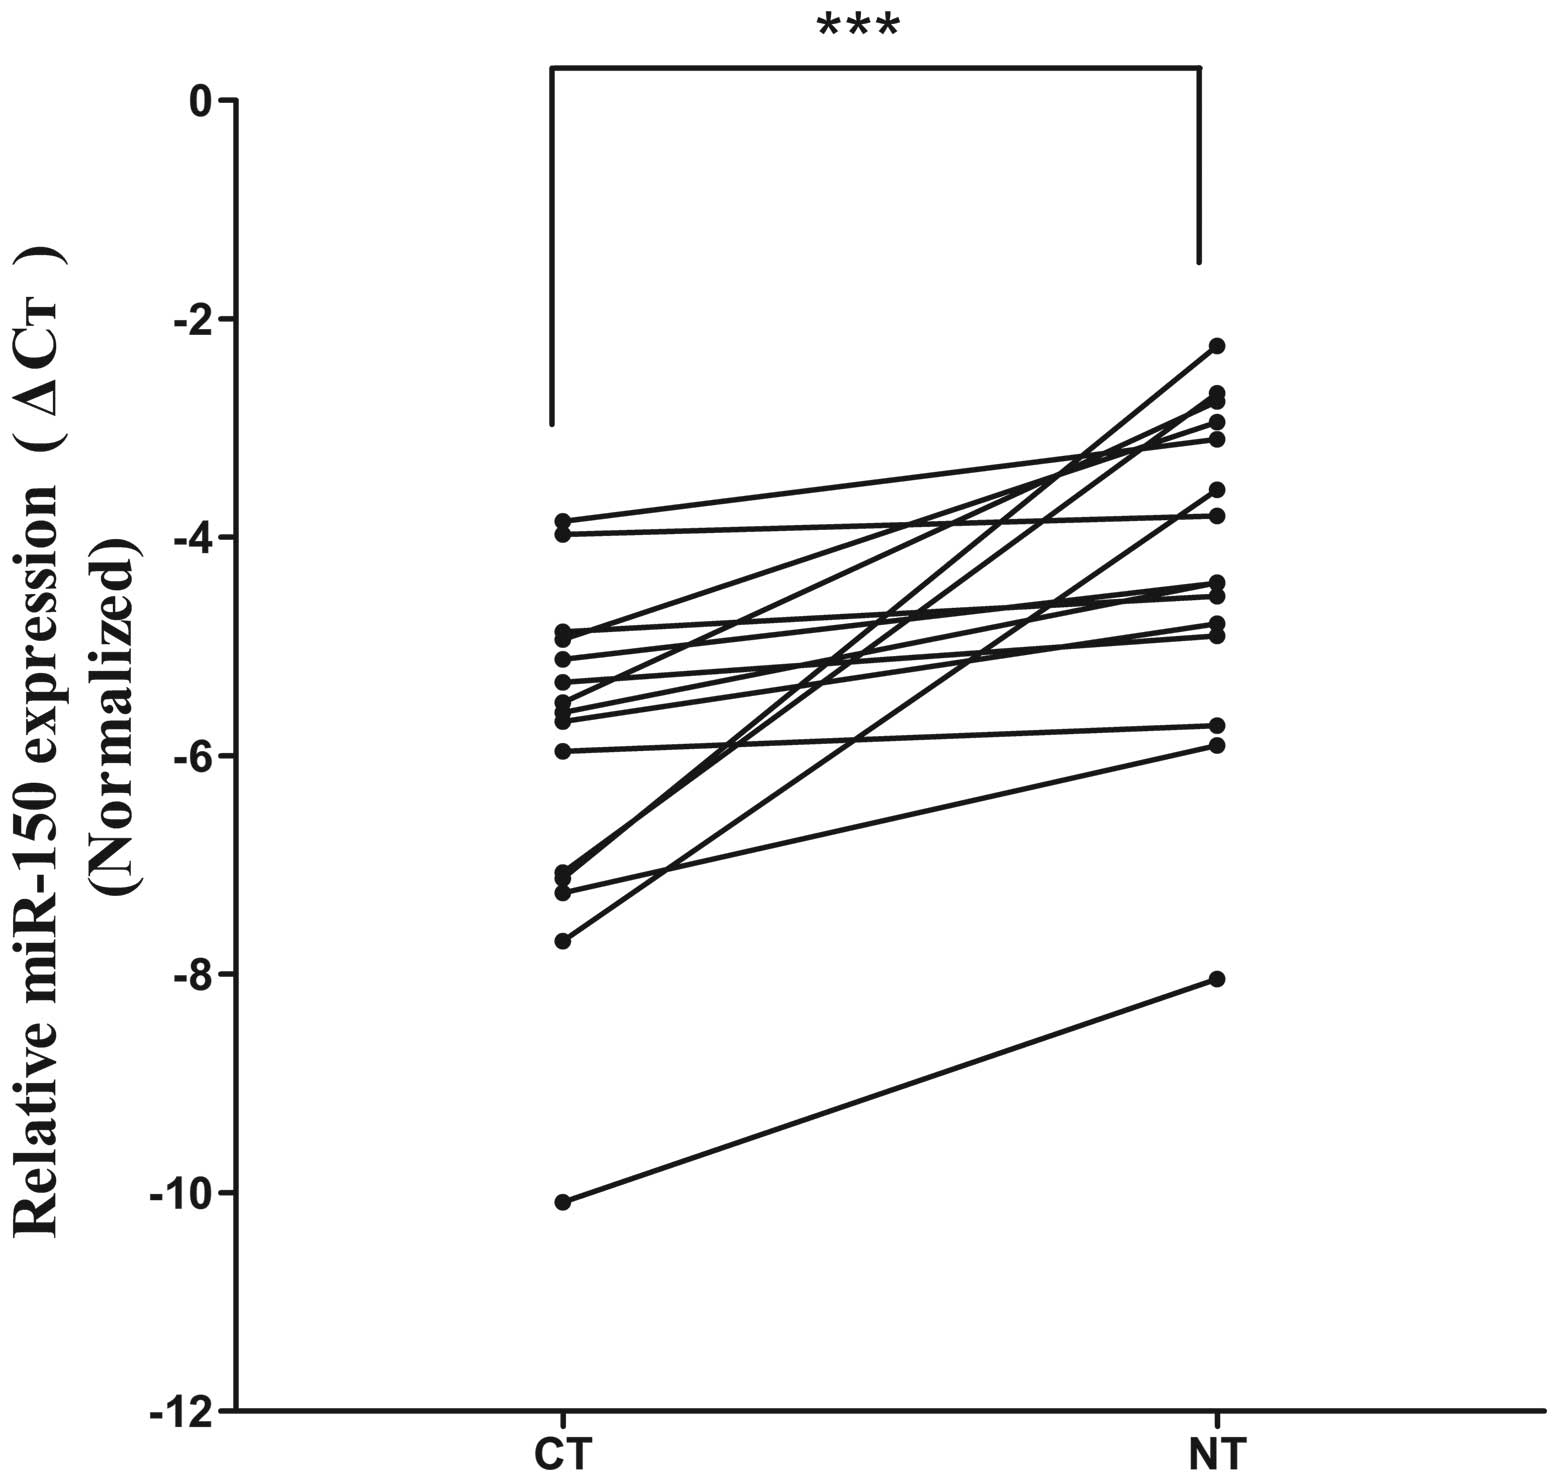
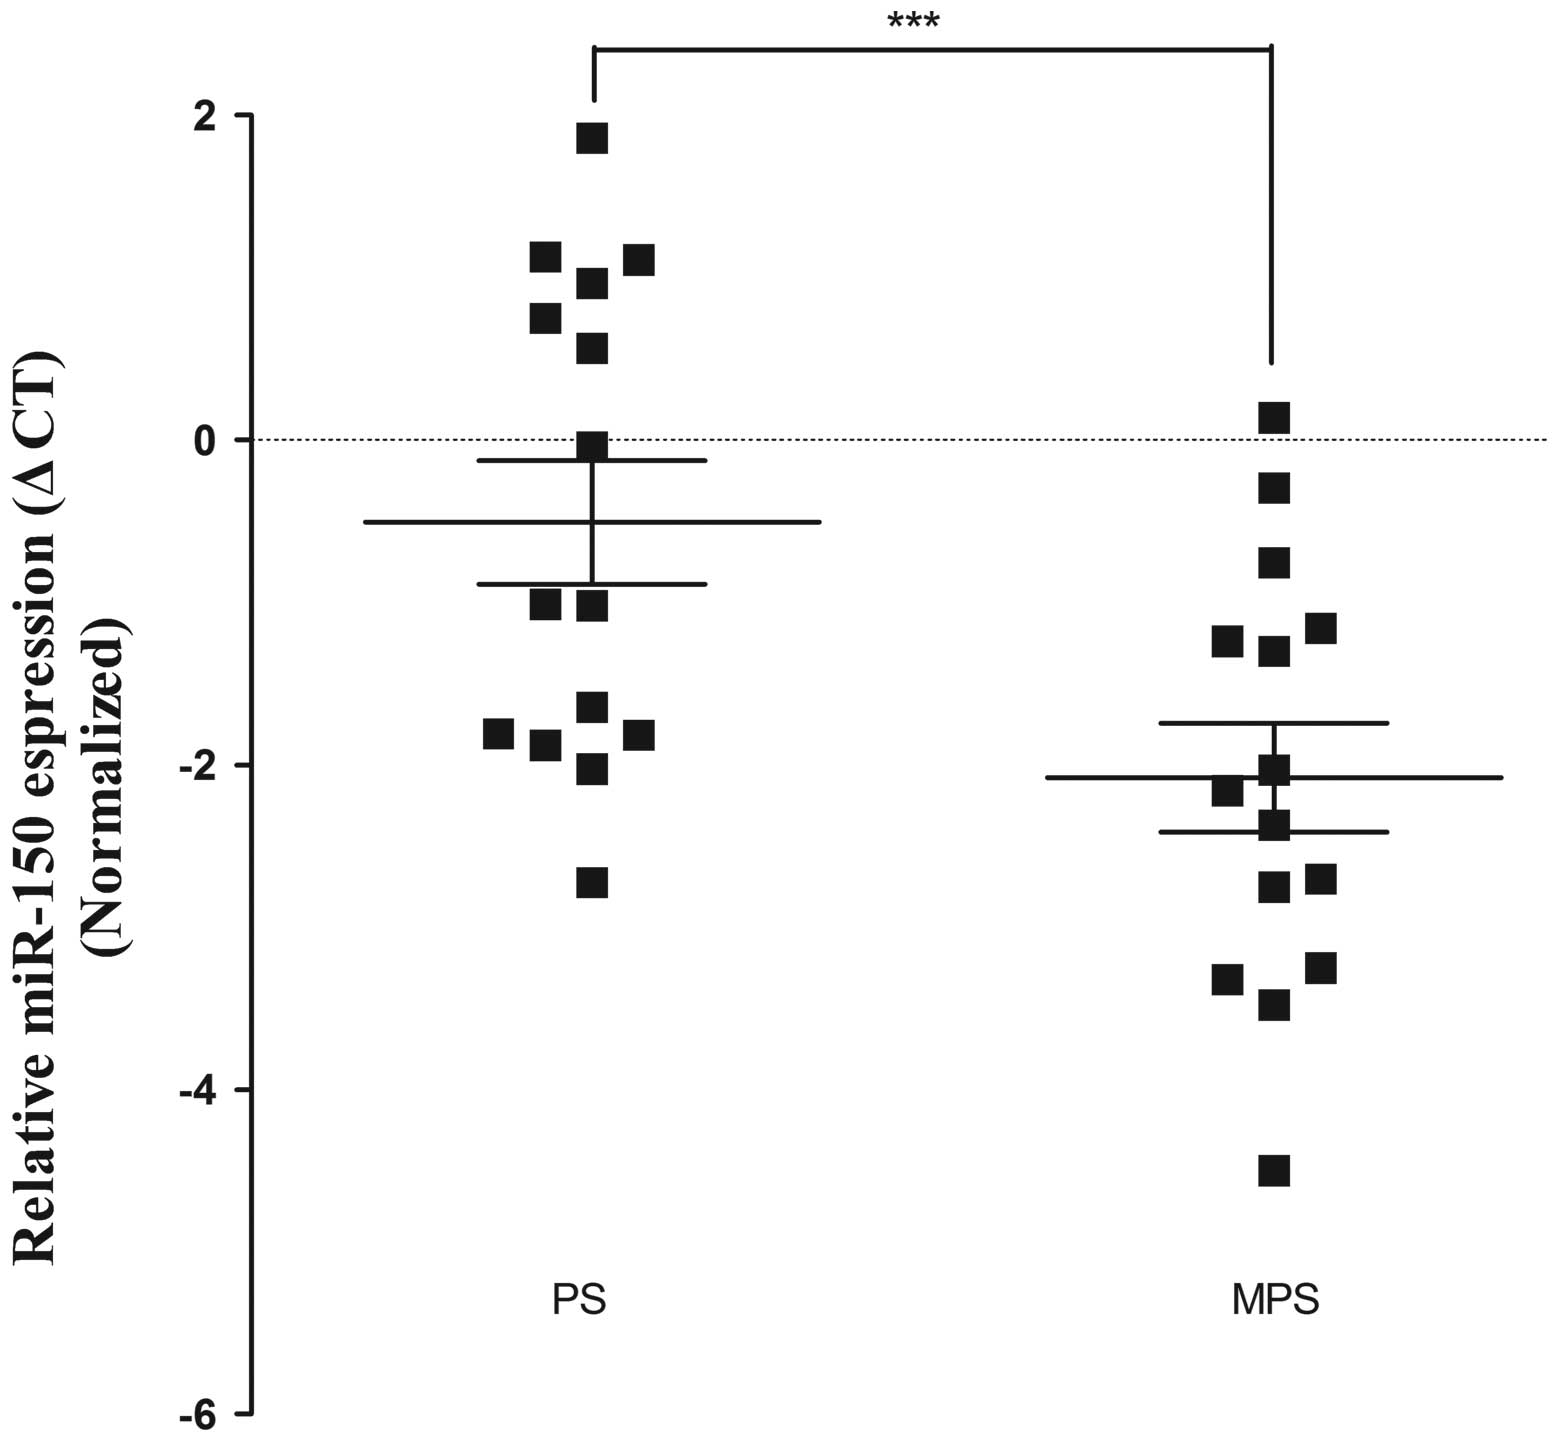
To evaluate the clinical relevance of miR-150 in
human ICC, we measured the miR-150 expression in the ICC tumor
tissues (CT group), peritumoral normal tissues (NT group), ICC
plasma samples (PS group) and matched plasma samples (MPS group) by
means of quantitative reverse transcription-polymerase chain
reaction (qRT-PCR). The miR-150 expression level in the CT group
was significantly lower than that in the NT group (mean ΔCt value:
−6.004±1.612 vs. −4.256±1.524, P<0.01; Fig. 2). In addition, compared with the MPS
group, the miR-150 expression level was upregulated in the PS
group, with a mean ΔCt value of −0.507 vs. −2.079 (P<0.01;
Fig. 3).
Discrepant expression of miR-150 between
ICC tissues and ICC plasma
Discrepant expression profiles of miR-150 between
the tumor tissues and plasma samples were noted. The miR-150
expression level in the CT group was significantly lower than that
in the NT group (average ΔCt value: −6.004±1.612 vs. −4.256±1.524,
P<0.01; Fig. 2). In addition,
compared with the MPS group, the miR-150 expression level was
upregulated in the PS group, with an average ΔCt value of
−0.507±1.473 vs. −2.079±1.301 (P<0.01; Fig. 3). Recent studies have shown similar
results. It was reported that miR-378 was significantly upregulated
in the serum of GC patients, but downregulated in gastric cancer
tissues (23).
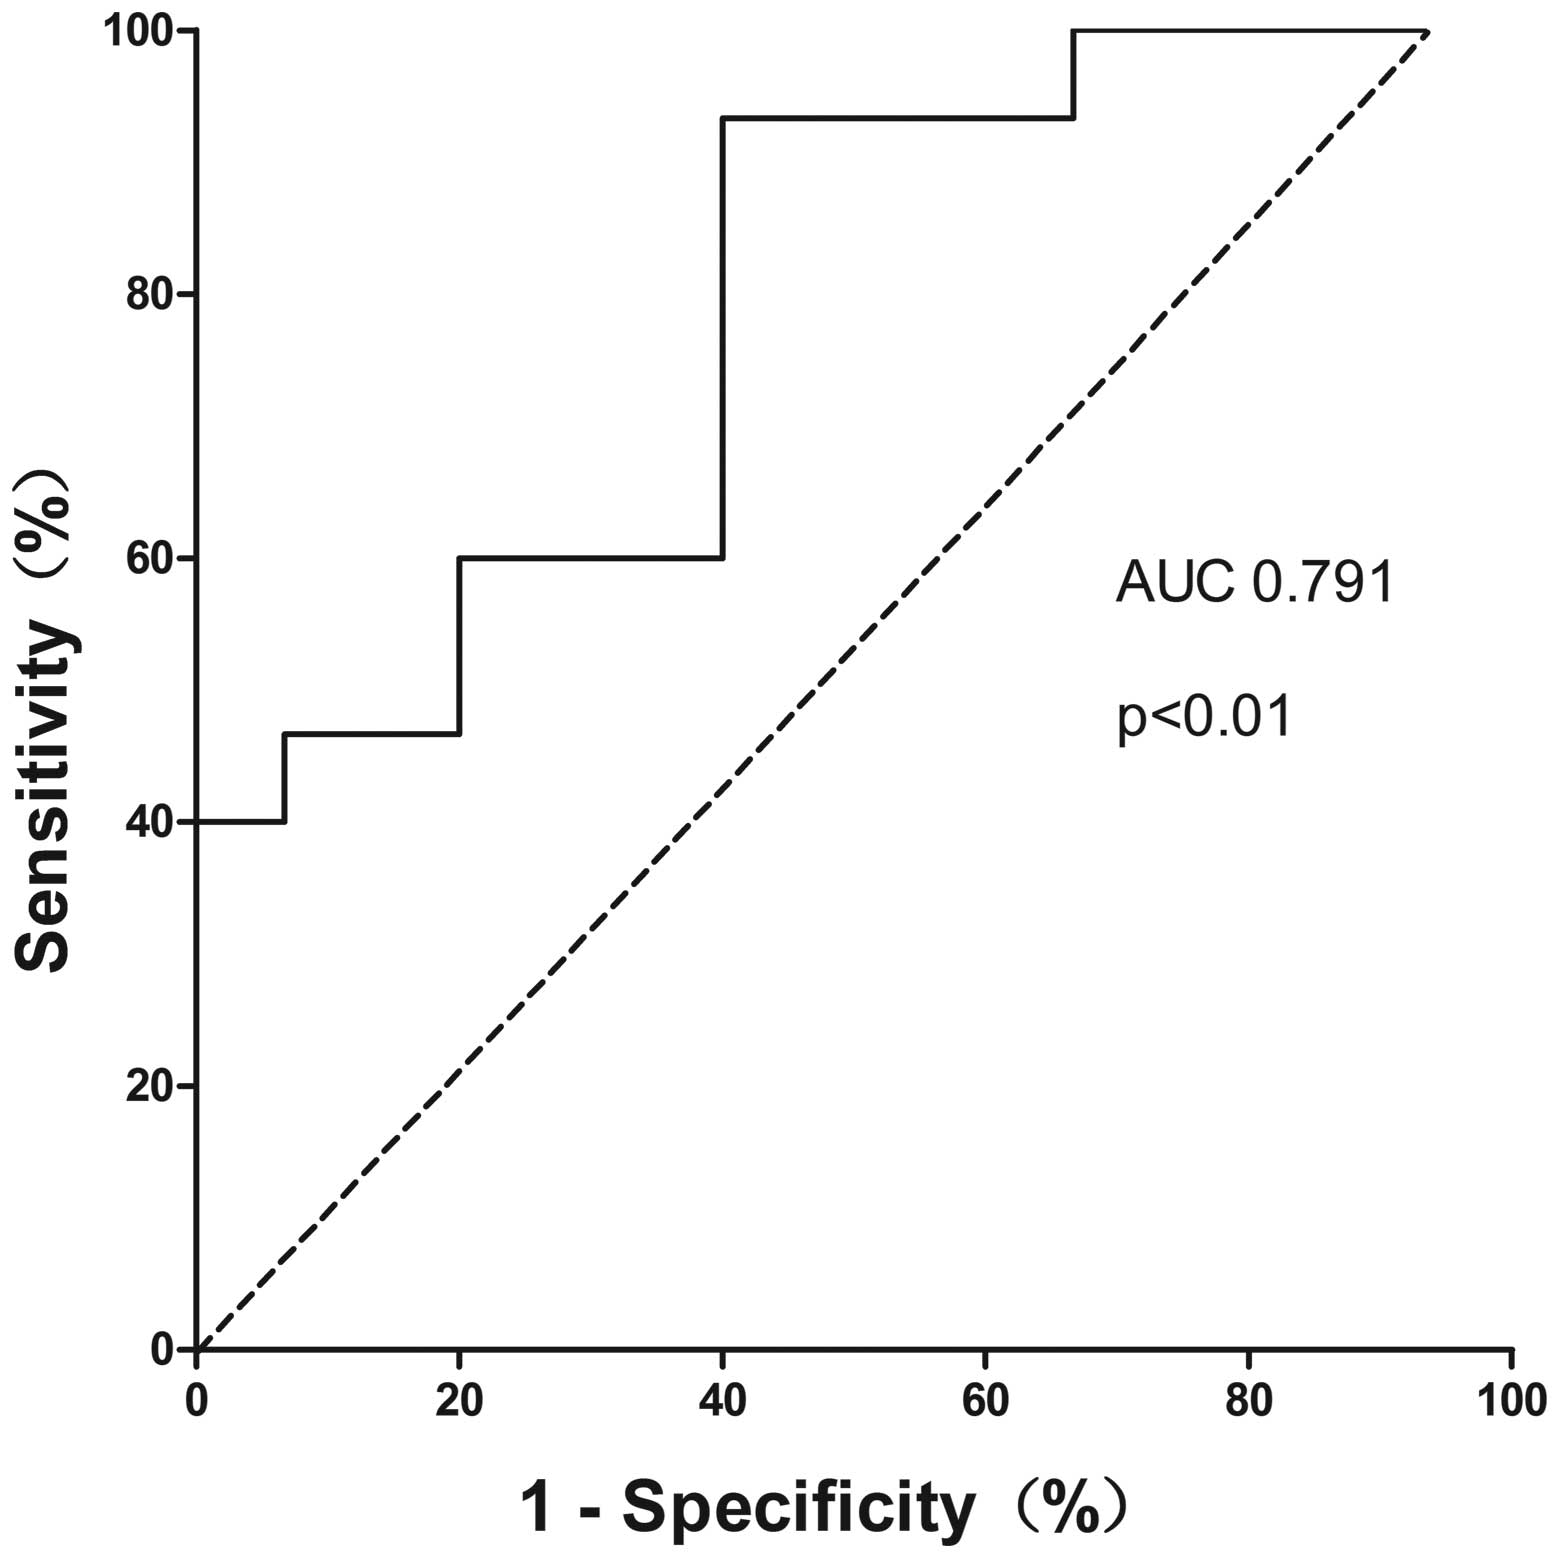
The diagnostic value of miR-150, CA19-9,
and combination of miR-150 and CA19-9 for ICC
ROC curves were applied to evaluate the diagnostic
power of plasma miR-150 and CA19-9, and the discriminatory accuracy
was calculated in AUC values. Meanwhile, logistic regression was
used to construct ROC curves for the combination of miR-150 and
CA19-9 to quantify the diagnostic power. Plasma miR-150 was able to
identify ICC patients from the controls with a discriminatory
accuracy of 0.791 (95% CI=0.630–0.952, P=0.007) (Fig. 4). At the cut-off value of −2.097 for
plasma miR-150, the optimal sensitivity and specificity were 93.3
and 53.3%, respectively. In the same study population, CA19-9 had
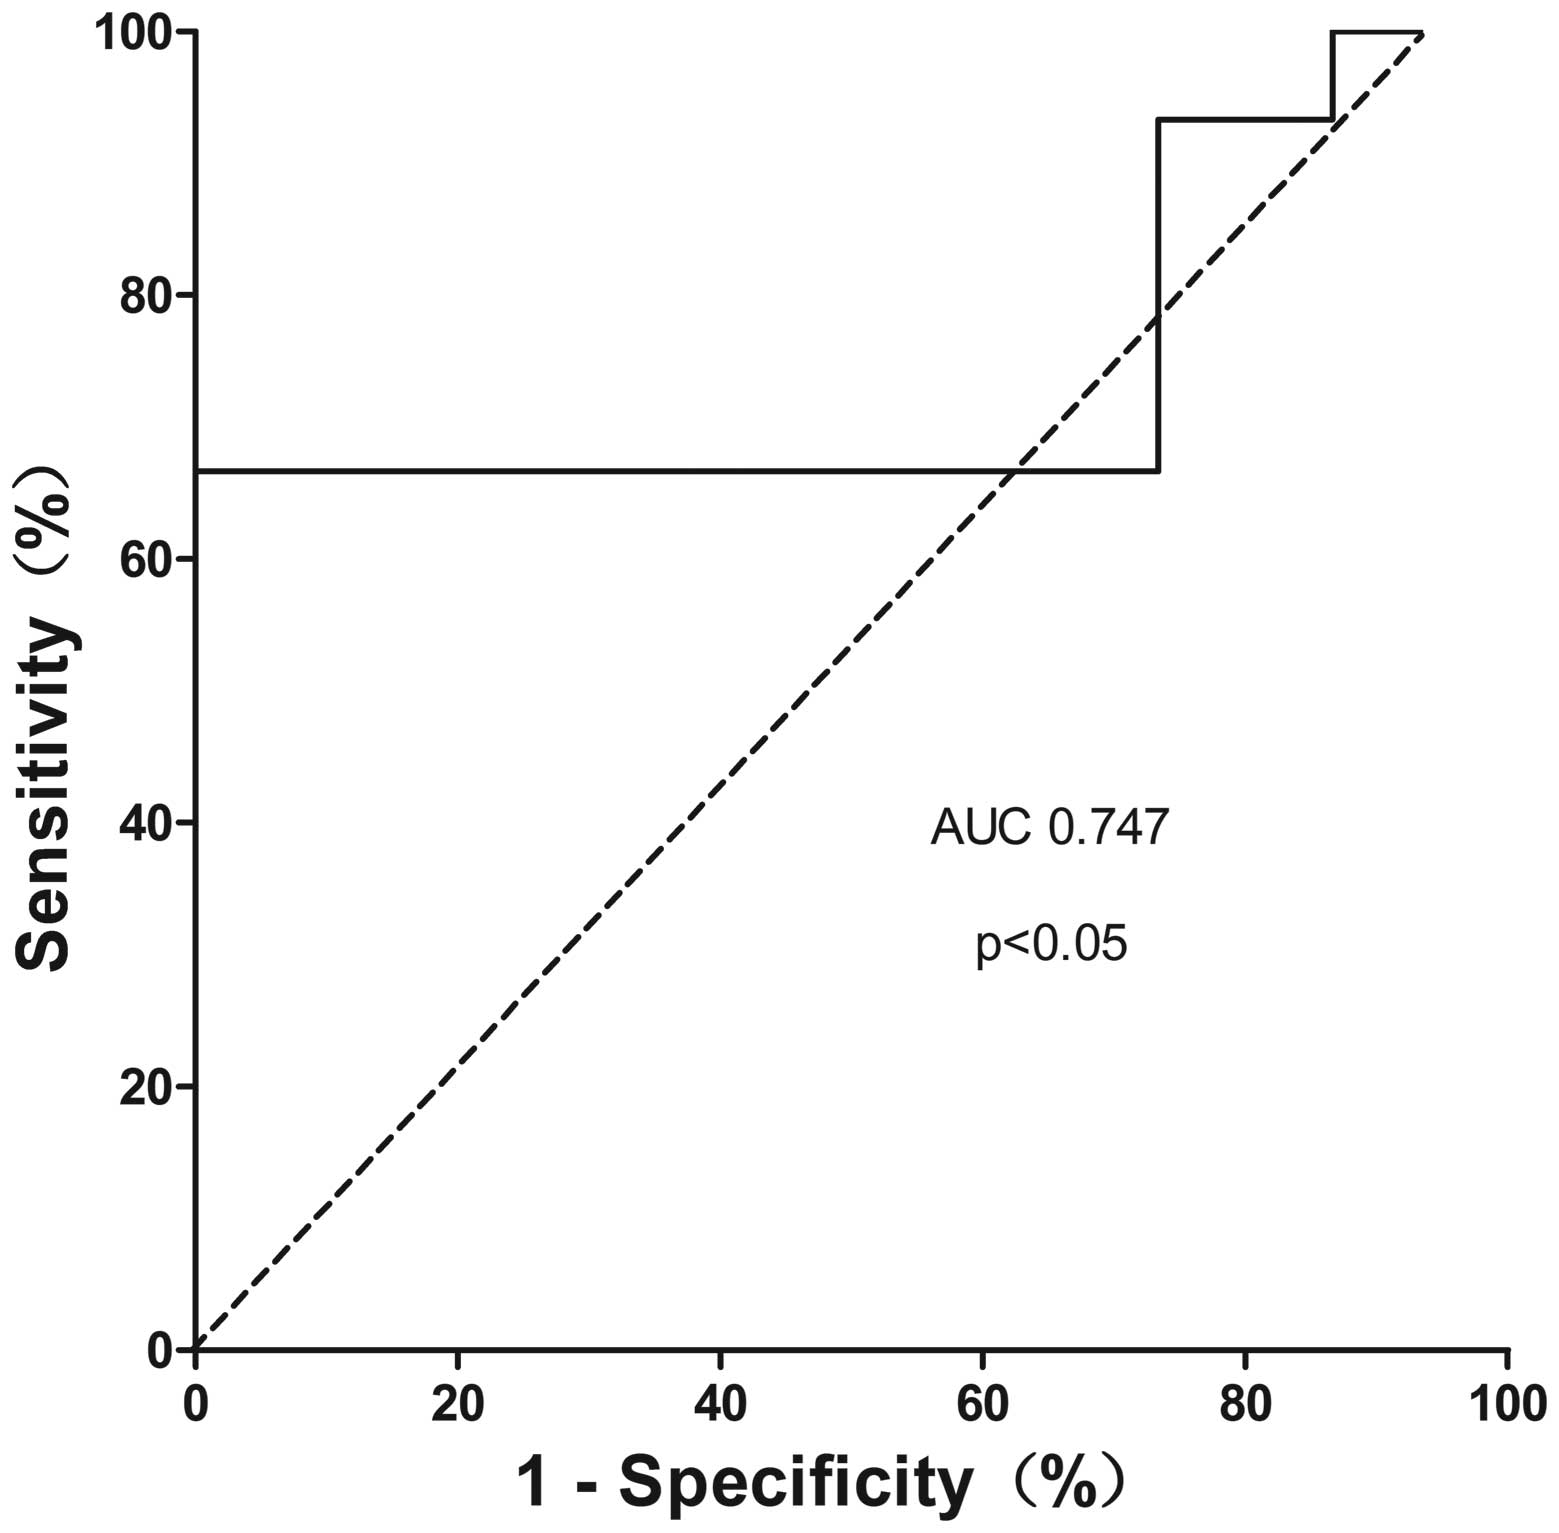
an AUC of 0.747 (95% CI=0.551–0.943, P=0.021) (Fig. 5) with a sensitivity of 66.7% and a
specificity of 100%, which is consistent with previously studies.
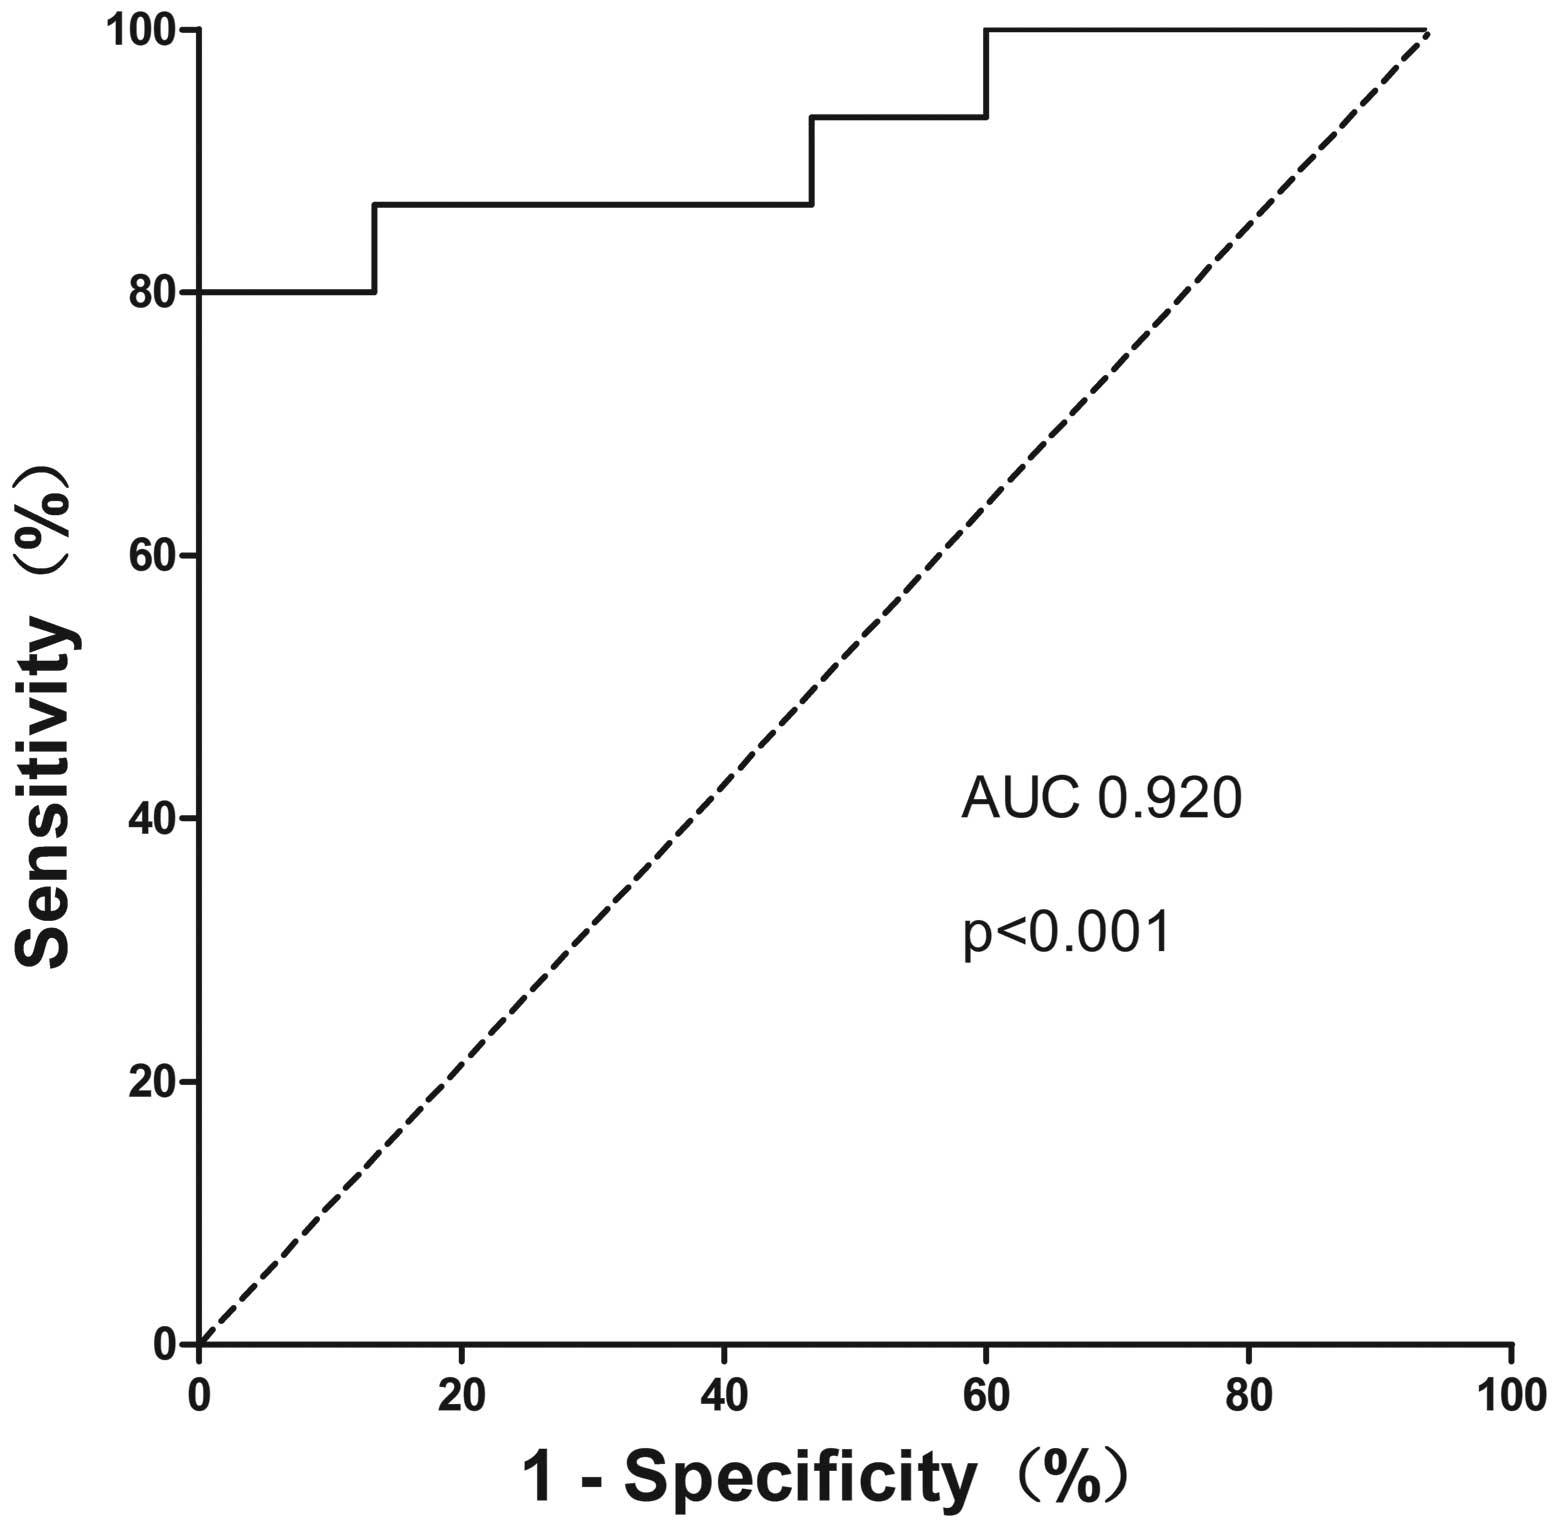
Similarly, the diagnostic value of the combination of miR-150 and
CA19-9 was analyzed. We found that combination of these 2
biomarkers yielded a higher discriminatory accuracy of 0.920 (95%
CI=0.817–1.000) (Fig. 6).
Plasma miR-150 correlates with the
clinicopathological features of the ICC patients
We analyzed the relevance between plasma miR-150
expression level and clinical features (Table II). Based on the expression level
of miR-150, 15 ICC patients were divided into 2 groups: low
expression group (n=8), containing the ones with a plasma miR-150
level less than the mean value of −0.507, and a high expression
group (n=7) with a plasma miR-150 level higher than the mean value
of −0.507. No significant differences were noted between the 2
groups.
| Table IIClinicopathological characteristics
of the ICC patients categorized according to the plasma miR-150
expression level. |
Table II
Clinicopathological characteristics
of the ICC patients categorized according to the plasma miR-150
expression level.
| Low group
(n=8)
< −0.507 (ΔCt) | High
group
(n=7)
> −0.507 (ΔCt) | P-value |
|---|
| Clinical
factors |
| Age (years) | 59±8 | 54±12 | 0.441 |
| Gender (M/F) | 5/3 | 7/0 | 0.123 |
| RBC
(×109/l) | 4.31±0.50 | 4.23±0.65 | 0.799 |
| WBC
(×109/l) | 6.65±3.32 | 7.02±3.48 | 0.837 |
| PLT
(×109/l) | 155.50±87.23 | 165.28±76.32 | 0.822 |
| Hb
(×109/l) | 132.38±16.31 | 134.71±14.50 | 0.776 |
| ALT (U/l) | 45.25±28.67 | 52.86±48.22 | 0.712 |
| AST (U/l) | 37.00±21.70 | 45.29±31.75 | 0.561 |
| ALP (U/l) | 149.63±146.32 | 168.14±123.23 | 0.797 |
| ALB (g/l) | 41.34±5.53 | 40.34±2.62 | 0.672 |
| GGT (U/l) | 282.75±33.59 | 165.14±200.58 | 0.418 |
| TB (μmol/l) | 16.03±6.02 | 112.37±165.20 | 0.174 |
| DB (μmol/l) | 6.95±4.68 | 83.53±133.16 | 0.179 |
| IB (μmol/l) | 9.07±3.14 | 28.73±34.67 | 0.185 |
| Operation time
(min) | 328.13±102.71 | 340.00±204.25 | 0.887 |
| Blood loss
(ml) |
1275.00±1158.51 |
1482.86±1199.47 | 0.739 |
| Tumor-related
factors |
| AFP (ng/ml) | 79.83±214.14 | 2.69±1.56 | 0.360 |
| CEA (ng/ml) | 24.99±45.30 | 6.12±3.70 | 0.294 |
| CA19-9
(ng/ml) |
1467.54±3470.70 | 528.49±922.15 | 0.501 |
| Child-Pugh
(A/B) | 7/1 | 5/2 | 0.446 |
| Tumor size
(cm) | 7.62±4.78 | 6.86±3.08 | 0.722 |
| TNM stage
(I/II/III) | 2/2/4 | 2/3/2 | 0.669 |
Discussion
Intrahepatic cholangiocarcinoma is consistently
asymptomatic in the early stages. More importantly, current
available tumor markers lack suitable sensitivity and specificity
for ICC at early onset. In terms of the treatments for ICC,
surgical resection remains the only effective strategy to achieve a
possible cure in ICC. Yet, radical surgical resection always relies
on the hope that the disease is diagnosed in an early stage. ICC is
also a contraindication for liver transplantation due to the poor
prognosis (24,25). As a result, the identification of
new diagnostic and prognostic biomarkers for ICC with proper
sensitivity and specificity is urgently needed.
Previous studies have revealed that miRNAs in blood
circulation are usually combined with the protein stably, not in
free form, and dysregulation of miRNAs in blood samples may be
potential diagnostic markers in diverse diseases (26,27),
especially in the field of malignant neoplasms, such as pancreatic
cancer (28), hepatocellular cancer
(29), neurooncology (28), colorectal cancer (30), and gastric cancer (31). Dysregulation of miRNA expression in
ICC has not been studied extensively as in many other cancers,
perhaps due to the rarity of this pathological entity. Mitchell
et al (27) was the first to
identify the presence of circulating tumor-associated miRNAs in
plasma and showed that circulating miRNAs may have an important
value for cancer diagnosis. Those findings suggest that circulating
miRNAs could be non-invasive diagnostic markers for cancers and
also in ICC. Dysregulation of miRNA-150 was found to have 2
contrary roles in malignant tumors. Some studies revealed that
miR-150 promotes tumorigenesis in various cancers. For example,
miR-150 exerts its oncogenic function through downregulation of the
expression of the pro-apoptotic purinergic P2×7 receptor in
epithelial cell cancer (32) and by
targeting the pro-apoptotic gene EGR2 in gastric cancer (33). On the contrary, other studies
revealed that miR-150 may act as a tumour-suppressor miRNA. For
example, miR-150 expression was found to be downregulated in
esophageal squamous cell carcinoma (34), and miR-150 inhibited the growth and
malignant behavior of pancreatic cancer cells by targeting MUC4
(35). We believe that whether
miRNAs function as oncogenes or tumor suppressors is dependent on
the cell and tumor type (36).
Under different cellular microenvironments, miR-150 may carry out
different functions. However, the role of miR-150 in ICC has yet to
be elucidated.
Our study found that the expression level of miR-150
was significantly lower in the ICC tissues than their peritumoral
noncancerous tissues in the miRNA microarray analysis. Afterwards,
the miR-150 expression profile was further determined in the tissue
and plasma samples of 15 ICC patients and another 15 age- and
gender-matched controls. The tissue expression level of miR-150 was
significantly lower in the ICC tissues than that in the peritumoral
noncancerous tissues. The expression level of miR-150 in blood was
significantly higher in the ICC patients than that in the controls.
Notably, we found contrary expression profiles of miR-150 between
the tumor tissues and blood samples. These results suggest that
miR-150 may be involved in the pathogenesis of ICC as a
tumor-suppressor miRNA. Chang et al (37) showed that miR-150 is downregulated
by c-myc which is always highly expressed in ICC (38). This might be the reason for the
downregulated miR-150 found in the ICC tissues. However, Pigati
et al (39) reported that
the difference in extracellular miRNA and cellular miRNA profiles
may suggest the existence of a cellular selection mechanism of
miRNA release. Based on the same hypothesis, we believe that
miR-150 may be an exocrine miRNA released by peritumoral
noncancerous cells such as cholangiocytes or hepatocytes and may
serve as an important negative feedback regulating agent. Thus,
cholangiocarcinoma cells may selectively secrete or release
cellular miRNAs such as miR-150 into the plasma As a result,
miR-150 was found to be upregulated in blood. Yet, the exact
mechanism for the difference between tissue and plasma miRNA
profiles is not clear and needs to be further studied.
The ROC curve showed that the sensitivity of plasma
miR-150 to discriminate ICC patients from the normal controls was
93.3%, and the specificity was 53.3% with the AUC of 0.791. In the
same population studied, the sensitivity and the specificity of
plasma CA19-9 were 66.7 and 100% respectively with AUC of 0.747 at
the cut-off value of 28.915 ng/ml. When we further combined miR-150
and CA19-9, the sensitivity and specificity of the diagnosis were
80.0 and 100%, respectively, while the AUC value increased to
0.920, which is much better than miR-150 or CA19-9 alone. As for
CA19-9, increased levels of CA19-9 also have been observed in
patients with benign diseases such as bacterial cholangitis or
choledocholithiasis. Lack of sufficient sensitivity, specificity,
and accuracy limits the use of a single blood-based biomarker in
clinical practice. Combining miR-150 with CA19-9 made the
sensitivity, specificity, and accuracy much more reliable than
these variables with miR-150 or CA19-9 alone. This is more suitable
for clinical use. Our results showed that miR-150 could be used as
an effective biomarker for diagnosing ICC and more reliable when
combined with CA19-9.
For better understanding of the clinical
implications of plasma miR-150, we also examined the correlations
between the plasma miR-150 expression level and clinical features.
There were no significant differences between the low expression
group and high expression group. This observation suggests that the
miR-150 expression level was not affected by albumin (ALB), total
bilirubin (TB), alanine (ALT), aspartate aminotransferase (AST) and
other clinical indices. Therefore, miR-150 exists stably in blood
samples from ICC patients.
In conclusion, the plasma miR-150 was found to be
dysregulated in the ICC patients, and may be a potential biomarker
for diagnosing ICC. Yet, it was more effective when combined with
CA19-9. We also found that miR-150 was downregulated in ICC tissues
but upregulated in ICC plasma. The limitation of the present study
was the relatively small sample size. Future prospective trials
using larger ICC patient cohorts are needed. Functional assays are
also needed to reveal the potential biological roles of miR-150 in
the carcinogenesis and/or progression of ICC.
Acknowledgements
This study was supported by grant nos. 30901457 and
81172287 from the National Natural Science Foundation of China.
References
|
1
|
Aljiffry M, Abdulelah A, Walsh M,
Peltekian K, Alwayn I and Molinari M: Evidence-based approach to
cholangiocarcinoma: a systematic review of the current literature.
J Am Coll Surg. 208:134–147. 2009. View Article : Google Scholar : PubMed/NCBI
|
|
2
|
Patel T: Worldwide trends in mortality
from biliary tract malignancies. BMC Cancer. 2:102002. View Article : Google Scholar : PubMed/NCBI
|
|
3
|
Martin R and Jarnagin W: Intrahepatic
cholangiocarcinoma. Current management. Minerva Chir. 58:469–478.
2003.PubMed/NCBI
|
|
4
|
de Jong MC, Nathan H, Sotiropoulos GC, et
al: Intrahepatic cholangiocarcinoma: an international
multi-institutional analysis of prognostic factors and lymph node
assessment. J Clin Oncol. 29:3140–3145. 2011. View Article : Google Scholar : PubMed/NCBI
|
|
5
|
Nakagohri T, Kinoshita T, Konishi M,
Takahashi S and Gotohda N: Surgical outcome and prognostic factors
in intrahepatic cholangiocarcinoma. World J Surg. 32:2675–2680.
2008. View Article : Google Scholar : PubMed/NCBI
|
|
6
|
Morimoto Y, Tanaka Y, Ito T, et al:
Long-term survival and prognostic factors in the surgical treatment
for intrahepatic cholangiocarcinoma. J Hepatobiliary Pancreat Surg.
10:432–440. 2003. View Article : Google Scholar
|
|
7
|
Ohtsuka M, Ito H, Kimura F, et al: Results
of surgical treatment for intrahepatic cholangiocarcinoma and
clinicopathological factors influencing survival. Br J Surg.
89:1525–1531. 2002. View Article : Google Scholar : PubMed/NCBI
|
|
8
|
Weber SM, Jarnagin WR, Klimstra D,
DeMatteo RP, Fong Y and Blumgart LH: Intrahepatic
cholangiocarcinoma: resectability, recurrence pattern, and
outcomes. J Am Coll Surg. 193:384–391. 2001. View Article : Google Scholar : PubMed/NCBI
|
|
9
|
Shen WF, Zhong W, Xu F, et al:
Clinicopathological and prognostic analysis of 429 patients with
intrahepatic cholangiocarcinoma. World J Gastroenterol.
15:5976–5982. 2009. View Article : Google Scholar : PubMed/NCBI
|
|
10
|
Li FH, Chen XQ, Luo HY, et al: Prognosis
of 84 intrahepatic cholangiocarcinoma patients. Ai Zheng.
28:528–532. 2009.(In Chinese). PubMed/NCBI
|
|
11
|
Higashi M, Yamada N, Yokoyama S, et al:
Pathobiological implications of MUC16/CA125 expression in
intrahepatic cholangiocarcinoma-mass forming type. Pathobiology.
79:101–106. 2012. View Article : Google Scholar : PubMed/NCBI
|
|
12
|
Uenishi T, Kubo S, Hirohashi K, Tanaka H,
et al: Cytokeratin-19 fragments in serum (CYFRA 21-1) as a marker
in primary liver cancer. Br J Cancer. 88:1894–1899. 2003.
View Article : Google Scholar : PubMed/NCBI
|
|
13
|
Tao LY, Cai L, He XD, Liu W and Qu Q:
Comparison of serum tumor markers for intrahepatic
cholangiocarcinoma and hepatocellular carcinoma. Am Surg.
76:1210–1213. 2010.PubMed/NCBI
|
|
14
|
Rana TM: Illuminating the silence:
understanding the structure and function of small RNAs. Nat Rev Mol
Cell Biol. 8:23–36. 2007. View
Article : Google Scholar
|
|
15
|
Jannot G and Simard MJ: Tumour-related
microRNAs functions in Caenorhabditis elegans. Oncogene.
25:6197–6201. 2006. View Article : Google Scholar : PubMed/NCBI
|
|
16
|
Chen L, Yan HX, Yang W, et al: The role of
microRNA expression pattern in human intrahepatic
cholangiocarcinoma. J Hepatol. 50:358–369. 2009. View Article : Google Scholar
|
|
17
|
Karakatsanis A, Papaconstantinou I,
Gazouli M, Lyberopoulou A, Polymeneas G and Voros D: Expression of
microRNAs, miR-21, miR-31, miR-122, miR-145, miR-146a, miR-200c,
miR-221, miR-222, and miR-223 in patients with hepatocellular
carcinoma or intrahepatic cholangiocarcinoma and its prognostic
significance. Mol Carcinog. 52:297–303. 2013. View Article : Google Scholar
|
|
18
|
Hu C, Huang F, Deng G, Nie W, Huang W and
Zeng X: miR-31 promotes oncogenesis in intrahepatic
cholangiocarcinoma cells via the direct suppression of RASA1. Exp
Ther Med. 6:1265–1270. 2013.PubMed/NCBI
|
|
19
|
Zeng B, Li Z, Chen R, et al: Epigenetic
regulation of miR-124 by hepatitis C virus core protein promotes
migration and invasion of intrahepatic cholangiocarcinoma cells by
targeting SMYD3. FEBS Lett. 586:3271–3278. 2012. View Article : Google Scholar : PubMed/NCBI
|
|
20
|
Schmittgen TD and Livak KJ: Analyzing
real-time PCR data by the comparative C(T) method. Nat Protoc.
3:1101–1108. 2008. View Article : Google Scholar : PubMed/NCBI
|
|
21
|
Watanabe A, Tagawa H, Yamashita J, et al:
The role of microRNA-150 as a tumor suppressor in malignant
lymphoma. Leukemia. 25:1324–1334. 2011. View Article : Google Scholar : PubMed/NCBI
|
|
22
|
Farhana L, Dawson MI, Murshed F, Das JK,
Rishi AK and Fontana JA: Upregulation of miR-150* and
miR-630 induces apoptosis in pancreatic cancer cells by targeting
IGF-1R. PLoS One. 8:e610152013. View Article : Google Scholar
|
|
23
|
Liu H, Zhu L, Liu B, et al: Genome-wide
microRNA profiles identify miR-378 as a serum biomarker for early
detection of gastric cancer. Cancer Lett. 316:196–203. 2012.
View Article : Google Scholar
|
|
24
|
Meyer CG, Penn I and James L: Liver
transplantation for cholangiocarcinoma: results in 207 patients.
Transplantation. 69:1633–1637. 2000. View Article : Google Scholar : PubMed/NCBI
|
|
25
|
Shimoda M, Farmer DG, Colquhoun SD, et al:
Liver transplantation for cholangiocellular carcinoma: analysis of
a single-center experience and review of the literature. Liver
Transpl. 7:1023–1033. 2001. View Article : Google Scholar : PubMed/NCBI
|
|
26
|
Schetter AJ, Leung SY, Sohn JJ, et al:
MicroRNA expression profiles associated with prognosis and
therapeutic outcome in colon adenocarcinoma. JAMA. 299:425–436.
2008. View Article : Google Scholar : PubMed/NCBI
|
|
27
|
Mitchell PS, Parkin RK, Kroh EM, et al:
Circulating microRNAs as stable blood-based markers for cancer
detection. Proc Natl Acad Sci USA. 105:10513–10518. 2008.
View Article : Google Scholar : PubMed/NCBI
|
|
28
|
Ganepola GA, Rutledge JR, Suman P,
Yiengpruksawan A and Chang DH: Novel blood-based microRNA biomarker
panel for early diagnosis of pancreatic cancer. World J
Gastrointest Oncol. 6:22–33. 2014. View Article : Google Scholar : PubMed/NCBI
|
|
29
|
Brockhausen J, Tay SS, Grzelak CA,
Bertolino P, et al: miR-181a mediates TGF-β induced hepatocyte EMT
and is dysregulated in cirrhosis and hepatocellular cancer. Liver
Int. Feb 28–2014.(Epub ahead of print). View Article : Google Scholar
|
|
30
|
Yang X, Zeng Z, Hou Y, Yuan T, Gao C, Jia
W, Yi X and Liu M: MicroRNA-92a as a potential biomarker in
diagnosis of colorectal cancer: a systematic review and
meta-analysis. PLoS One. 9:e887452014. View Article : Google Scholar : PubMed/NCBI
|
|
31
|
Zheng G, Xiong Y, Xu W, et al: A
two-microRNA signature as a potential biomarker for early gastric
cancer. Oncol Lett. 7:679–684. 2014.PubMed/NCBI
|
|
32
|
Zhou L, Qi X, Potashkin JA, Abdul-Karim FW
and Gorodeski GI: MicroRNAs miR-186 and miR-150 down-regulate
expression of the pro-apoptotic purinergic P2×7 receptor by
activation of instability sites at the 3′-untranslated region of
the gene that decrease steady-state levels of the transcript. J
Biol Chem. 283:28274–28286. 2008. View Article : Google Scholar : PubMed/NCBI
|
|
33
|
Wu Q, Jin H, Yang Z, et al: MiR-150
promotes gastric cancer proliferation by negatively regulating the
pro-apoptotic gene EGR2. Biochem Biophys Res Commun. 392:340–345.
2010. View Article : Google Scholar : PubMed/NCBI
|
|
34
|
Yokobori T, Suzuki S, Tanaka N, et al:
MiR-150 is associated with poor prognosis in esophageal squamous
cell carcinoma via targeting the EMT inducer ZEB1. Cancer Sci.
104:48–54. 2013. View Article : Google Scholar
|
|
35
|
Srivastava SK, Bhardwaj A, Singh S, et al:
MicroRNA-150 directly targets MUC4 and suppresses growth and
malignant behavior of pancreatic cancer cells. Carcinogenesis.
32:1832–1839. 2011. View Article : Google Scholar : PubMed/NCBI
|
|
36
|
Croce CM: Causes and consequences of
microRNA dysregulation in cancer. Nat Rev Genet. 10:704–714. 2009.
View Article : Google Scholar : PubMed/NCBI
|
|
37
|
Chang TC, Yu D, Lee YS, et al: Widespread
microRNA repression by Myc contributes to tumorigenesis. Nat Genet.
40:43–50. 2008. View Article : Google Scholar
|
|
38
|
Nakanuma Y, Sasaki M, Sato Y, Ren X, Ikeda
H and Harada K: Multistep carcinogenesis of perihilar
cholangiocarcinoma arising in the intrahepatic large bile ducts.
World J Hepatol. 1:35–42. 2009. View Article : Google Scholar : PubMed/NCBI
|
|
39
|
Pigati L, Yaddanapudi SC, Iyengar R, et
al: Selective release of microRNA species from normal and malignant
mammary epithelial cells. PLoS One. 5:e135152010. View Article : Google Scholar : PubMed/NCBI
|