Introduction
Renal cell carcinoma (RCC), which originates from
renal tubular epithelial cells, accounts for 80–85% of all cases of
kidney cancer, and is responsible for ~2–3% of all malignant
diseases in adults (1). The overall
5-year survival of RCC is as low as 20–25%, and the most important
factor in the selection of the appropriate therapy for RCC patients
is the presence of metastases (2).
Tropomyosin (TPM) is an important component of
microfilaments, a cytoskeleton structure, and is mainly involved in
the contraction of skeletal and smooth muscle cells or maintaining
the stability of the cytoskeleton in non-muscular cells (3). Four tropomyosin genes, TPM1,
TPM2, TPM3 and TPM4, have been confirmed in
mammals including humans. More than 20 isoforms can be produced
through alternative splicing. All of these homologous isoforms fold
into two parallel, linear chains of spiral α-helices (4). These TPM proteins are involved in the
regulation of many benign myopathies, such as myasthenia gravis and
familial hypertrophic cardiomyopathy (5). Additionally, other studies have
discovered that TPM1 plays an important role as a
tumor-suppressor gene (TSG) in tumor occurrence and progression
(6,7). Recently, evidence indicates that
TPM1 could be a novel target gene of microRNA-21 which was
found to be upregulated in many different solid tumors, including
RCC (8). However, whether or not
TPM1 serves as a tumor-suppressor gene in RCC and is selectively
downregulated during RCC development has not been determined.
Therefore, in the present study, we investigated the expression
level of TPM1 in a set of RCC tissue samples and further evaluated
its tumor-suppressing activities in two RCC cell lines (786-O and
OSRC-2).
Materials and methods
Tissue samples
Ninety-eight tissue samples including 49 primary RCC
tissues and 49 paired tumor adjacent renal tissues from the same
patients were collected between May 2009 and April 2013 at The
First Bethune Hospital of Jilin University, Jilin, China. All the
samples were immediately stored in liquid nitrogen vapor at −196°C.
All tumor specimens contained more than 80% cancer tissue and few
necrosis in some. Tumor adjacent renal tissues were obtained from
the region 5 cm distant from the tumor location, which ensured the
absence of any kidney lesions. The present study was approved by
the Ethics Committee of The First Bethune Hospital of Jilin
University, and consent forms were obtained from all participating
patients.
Cell culture
Human clear cell renal cell carcinoma (ccRCC) cell
line 786-O (TCHu3), human RCC cell line OSRC-2 (TCHu40) and human
non-tumorous embryonal kidney cell line HEK293T were purchased from
the Cell Resource Center of Shanghai Life Science Institute
(Shanghai, China). HEK293T and OSRC-2 cells were cultured and
maintained in high glucose Dulbecco’s modified Eagle’s medium
(DMEM; Gibco, Carlsbad, CA, USA), while 786-O cells were cultured
in RPMI-1640 medium (Gibco), both media being supplemented with 10%
fetal bovine serum (Gibco), 100 U/ml penicillin, 100 mg/ml
streptomycin in a 5×7 cm flask in a moist atmosphere containing 5%
CO2 at 37°C (Thermo Scientific, Waltham, MA, USA).
Cultured cells used for extracting total RNA or proteins were
harvested from 1 well of a 6-well plate and lysed using TRIzol
reagent (Life Invitrogen, Carlsbad, CA, USA) or precooling RIPA
lysis buffer [150 mM NaCl, 50 mM Tris-HCl (pH 7.4)], 0.25%
Na-deoxycholate, 1% Nonidet P-40, 1 mM EDTA and protease inhibitor
cocktail tablets (Roche, Penzberg, Germany). The methods of the
cell culture were previously described (9).
Reverse transcription and quantitative
real-time PCR (RT-qPCR)
Total RNA was isolated using TRIzol reagent
(Invitrogen, Carlsbad, CA, USA) and reverse transcribed to cDNA
using PrimeScript™ reverse transcriptase (Takara, Dalian, China).
The resulting cDNA was analyzed by RT-qPCR with a real-time PCR
detector (Ilumina Eco; Ilumina, San Diego, CA, USA). RT-qPCR
reactions were completed under the following conditions: the
initial denaturation step consisted of 95°C for 30 sec, followed by
40 cycles of further denaturation at 95°C for 5 sec, and annealing
and extension at 60°C (59°C for TPM2, TPM3 and TPM4) for 30 sec.
The following steps were used to obtain the melting curve: 95°C for
15 sec, then 55°C for 15 sec and finally 95°C for 15 sec again. The
final concentration of all reagents in the reaction were as
follows: SYBR® Premix Ex Taq 1X, forward and
reverse primers 0.2 μM each, DNA templates ≤5 ng/μl. Unless
otherwise indicated, the relative mRNA expression levels were
calculated as −ΔΔCt where ΔΔCt = ΔCttumor −
ΔCtnormal and ΔCt = Cttarget −
Ctcontrol. TPM1-4 were the target genes, and
GAPDH was the control gene in the present study. Table I lists the primer sequences
(synthesized by BGI Gene Company, Beijing, China) used for
RT-qPCR.
 | Table IPrimer sequences for the RT-qPCR. |
Table I
Primer sequences for the RT-qPCR.
| Primer name | Sequence 5′–3′ | Product size
(bp) |
|---|
| GAPDH F |
GAGCCACATCGCTCAGACAC | 150 |
| GAPDH R |
CATGTAGTTGAGGTCAATGAAGG | |
| TPM1 F |
GCCGACGTAGCTTCTCTGAAC | 160 |
| TPM1 R |
TTTGGGCTCGACTCTCAATGA | |
| TPM2 F |
TGAGACCCGAGCAGAGTTTG | 132 |
| TPM2 R |
TTGAGTGCGTTGTCCAGTTC | |
| TPM3 F |
AGGAGACTTGGAACGCACAG | 100 |
| TPM3 R |
AGACTTGAGGTTGTTGGTGACA | |
| TPM4 F |
ACCGCAAATACGAGGAGGTA | 118 |
| TPM4 R |
TTGAGTTCTTCTTCCAGGTCAC | |
Western blotting
Methods for the protein extraction and western
blotting were previously described (9). Whole cell lysate from the cultured
cells was mixed with 4X SDS loading buffer (8% SDS, 30% glycerol,
0.25 M Tris-HCl pH 6.8, 0.02% bromophenol blue with 10% BME).
Kidney tissue samples (100 mg) were homogenized with tissue
grinders (XinZhi, Ningbo, China) and solubilized in 100 μl
precooling RIPA lysis buffer. Whole cell lysate was prepared by
sonication (Scientz-IID, Ningbo, China) for 12 sec with 30% work
cycle and following centrifugation at 15,000 × g for 10 min at 4°C.
Total proteins in the supernatant after centrifugation were
quantified using the Bradford method according to the handling
manual (Bio-Rad, Hercules, CA, USA). Equal total amounts of boiled
protein samples with SDS loading buffer were separated by SDS
polyacrylamide gel (SDS-PAGE) electrophoresis, and specific
proteins were detected by immunoblotting using TPM1 (1:500,
#AV41392, rabbit anti-human polyclonal; Sigma-Aldrich, St. Louis,
MO, USA) antibodies and α-tubulin (1:800, #bs-0159R, rabbit
anti-human polyclonal; Bioss, Beijing, China) antibodies. Protein
bands were analyzed by Quantity One® (Bio-Rad) and the
TPM1 protein level was defined as the grey scale value ratio of
TPM1 to α-tubulin.
Immunohistochemical (IHC) staining
To obtain homogeneous samples for
immunohistochemical analysis, we collected 25 formalin-fixed,
paraffin-embedded tissue blocks from the 49 patients mentioned
above. The method for immunohistochemical staining was previously
described (9). Tissue blocks were
sectioned and then heated in a constant temperature oven at 60°C
for 3 h. The sections were deparaffinized in xylene and rehydrated
through a series of graded ethanol. The sections were washed by
distilled water once then with phosphate-buffered saline (PBS)
buffer twice every 3 min. Each section was treated with 3% hydrogen
peroxide solution at room temperature for 10 min to eliminate
endogenous peroxidase. Then they were washed 3 times with PBS
buffer, 5 min each time. The tissue sections were blocked with
normal goat serum, incubated at room temperature for 15 min, the
serum was decanted, but not washed, and 1:100 dilution of TPM1
polyclonal antibodies (#AV41392, rabbit anti-human; Sigma-Aldrich),
was added and maintained at 4°C overnight. Tissue slides were
washed by PBS buffer again and biotinylated secondary antibody was
added at 37°C for 10 min. Tissue sections were incubated in
horseradish peroxidase-labeled streptavidin working solution at
37°C for 10 min. Finally, the immunoreaction was detected using the
DAB detection kit (Maixin, Fuzhou, China).
Semi-quantitation of IHC staining
The staining intensity (SI) and the percentage of
positive cells (PP) were semi-quantitatively assessed using the
following criteria: SI was scored as 0, no staining; 1, weak; 2,
moderate; and 3, strong; and PP: 0, no positive cells; 1, <10%;
2, 10–50%; 3, 51–80%; and 4, >80%. For each section, the
immunoreactive score (IRS) was calculated as SI × PP with a maximum
possible value of 12 (10).
Observations were recorded separately by two different individuals
and the average score was used.
Plasmid transfection
The full-length coding sequence of the TPM1
gene transcription variant 5 was amplified from the HepG2 cell line
cDNA library. Then the TPM1 coding sequence was linked into the T
vector and finally constructed into the eukaryotic expression
vector pcDNA3.1 to obtain the pcDNA3.1-TPM1 plasmid for cell
transfection (Comate Bioscience, Changchun, China). HEK293T, 786-O
and OSRC-2 cells were cultured in 6-well plates (1–2×10⁵
cells/well) in specific complete culture medium as described above.
These cells were transiently transfected with 0.2–1 μg of
pcDNA3.1-TPM1 plasmid using Lipofectamine® 2000 reagent
(Life Invitrogen) in the Opti-MEM® diluent condition
(Gibco) following the manufacturer’s instructions. Cells were
harvested for further analysis 48 h after transfection.
Wound scratch assays
OSRC-2 and 786-O cells were seeded in a 6-well plate
and incubated to form cell monolayers. Subsequently, cross-shaped
scratches were made gently with sterile pipette tips across the
diameter of the wells and washed with PBS to wipe off residuals.
The scratched monolayers of cells were then transfected with
different plasmid DNA. At least 5 microscopic (Olympus, Tokyo,
Japan) fields were analyzed for each well at a magnification of
×100 at 0, 24 and 48 h after scratching (11). The ratio of the recovered area at 24
or 48 h after scratching to the initial wound area was identified
as the wound healing rate.
Migration and invasion assays
OSRC-2 and 786-O cells were transfected with
pcDNA3.1-NC or pcDNA3.1-TPM1 and starved for 24 h. An in
vitro Transwell® membrane (Corning Costar, Corning,
NY, USA) precoated with BD Matrigel matrix (BD Biosiences, Franklin
Lakes, NJ, USA) and medium mixture (matrix:medium, 1:1) was
prepared for the overnight invasion assay and the uncoated membrane
was prepped for the migration assay. The cell seeding amounts for
this 24-well plate were 1×10⁴ and 6×10⁴
cells/well for the migration and invasion assay, respectively. Then
culturing under the indicated condition for 24 h was carried out as
described in the product instructions for users. Finally, the
bottom filters were fixed in methanol and stained with 1% crystal
violet solution. Images were captured for 5 random optical fields
at ×200 magnification on each filter.
Apoptosis assays
OSRC-2 and 786-O cells were transfected with
pcDNA3.1-NC or pcDNA3.1-TPM1, or mock treated for 72 h. Cells were
collected and stained with Annexin V-FLUOS staining kit (Roche)
following the instructions for users. Sample cells were then
analyzed by a FACS flow cytometer (Becton-Dickinson, Franklin
Lakes, NJ, USA). We recorded Annexin V-positive and propidium
iodide (PI)-negative cells as early stage apoptotic cells.
Statistical analysis
Statistical analysis was achieved using IBM
SPSS® Statistics 21.0 (IBM, Armonk, NY, USA). Unless
otherwise indicated, values are presented as the means ± SEM. The
paired t-test was used to determine significant differences between
the treatment and the control groups. The Chi-square test was used
to analyze the associations between TPM1 and clinical features. The
log-rank test was used to analyze the survival results. Due to the
marked dispersion of the cancer specimens, the Mann-Whitney U test
was performed to analyze RT-qPCR data instead of the t-test.
Significance was defined at p<0.05.
Results
Expression of TPM1, TPM2, TPM3 and TPM4
in the RCC tumor and paired adjacent normal renal tissues
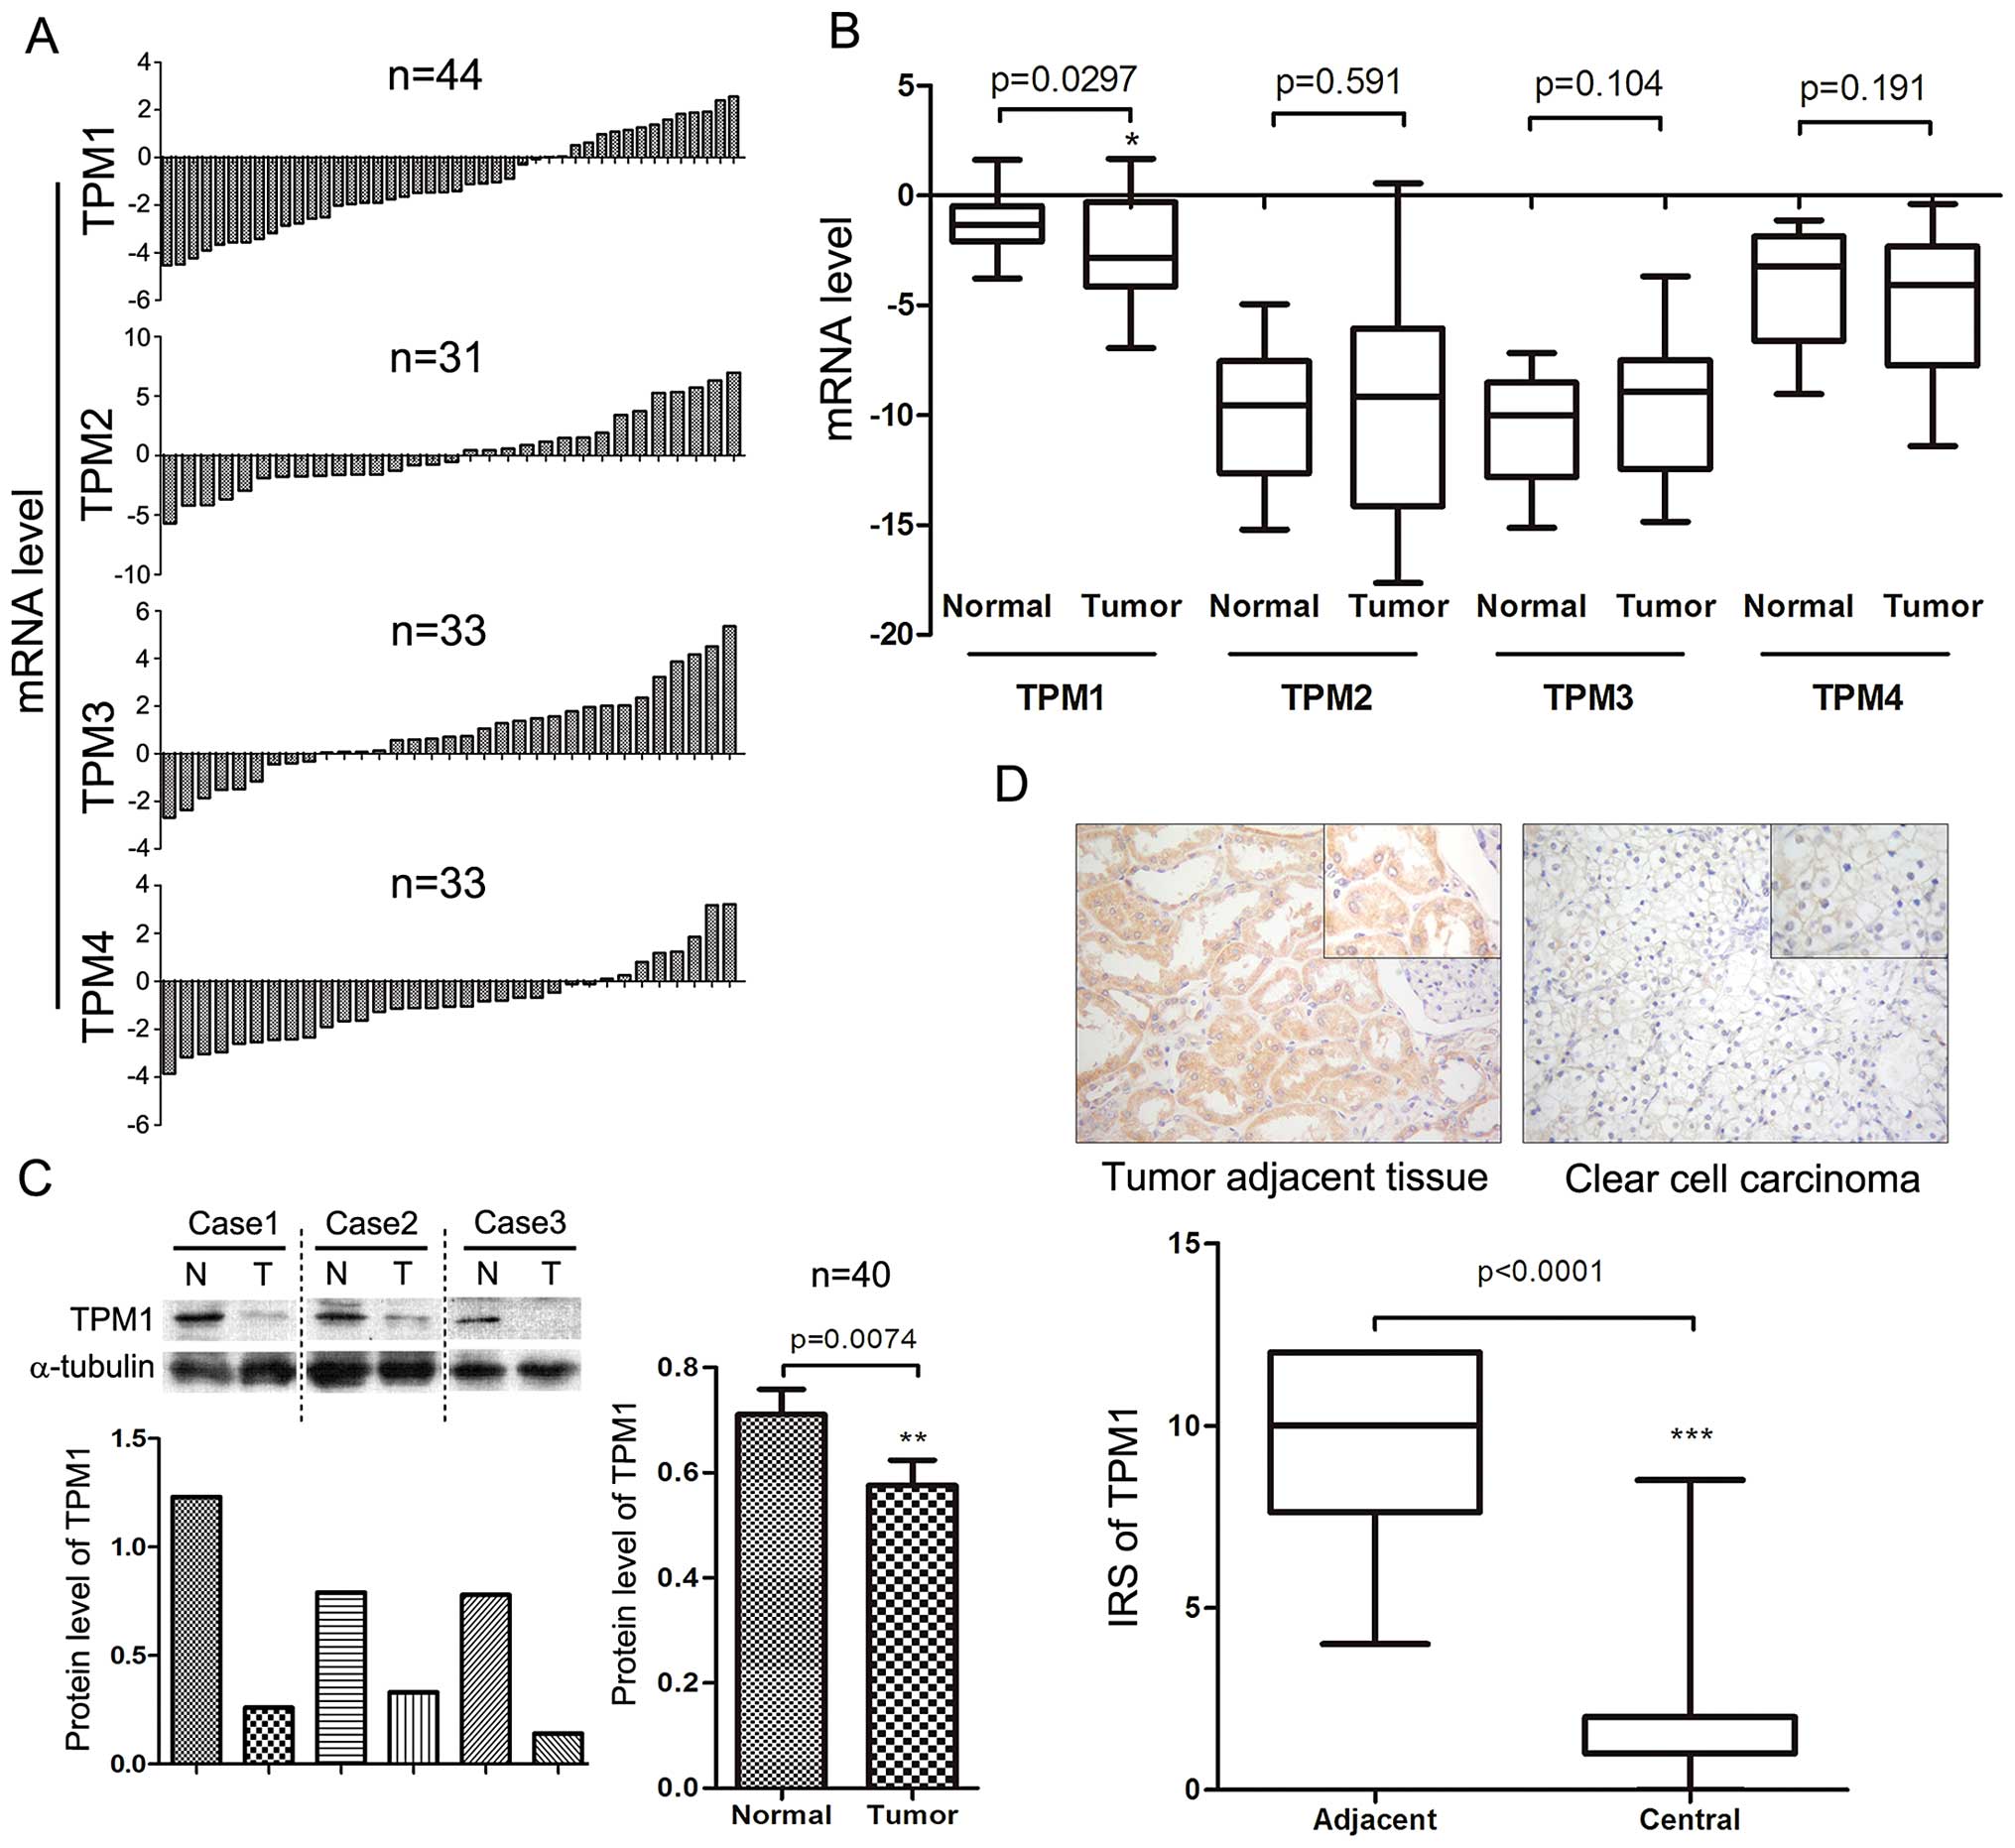
The expression levels of four major TPM genes (TPM1,
TPM2, TPM3 and TPM4) in the RCC tumor tissues and paired adjacent
normal renal tissues from the same patients were detected by
RT-qPCR. The mRNA levels of TPM2-4 had no significant differences
in expression in the 33 RCC tumor tissues compared to these levels
in the adjacent normal renal tissues (p=0.591, p=0.104 and p=0.191,
respectively, Fig. 1A and B).
However, compared with the normal kidney tissues, the RCC tumor
tissues exhibited significantly lower TPM1 expression at the mRNA
level. Even after the sample number was enlarged to 44 pairs, the
statistical difference remained significant (p<0.05, Fig. 1A and B).
TPM1 protein levels in the primary RCC tumor tissues
were further confirmed by western blotting. The results of the
western blotting of the 40 paired RCC samples were consistent with
the results of the RT-qPCR. RCC tumor tissue had significantly
lower TPM1 expression at the protein level when compared with
levels in the normal kidney tissues (p<0.01, Fig. 1C).
Immunohistochemical staining
We then evaluated TPM1 protein expression at the
tissue level using immunohistochemical staining of 25 tissue
sections, including 25 RCC tissues and 24 paired tumor adjacent
tissues (one section only had tumor tissue). In the tumor adjacent
tissues, TPM1 was mainly expressed in the cytoplasm of renal
tubular cells rather than the nucleus or the renal corpuscle. TPM1
was mainly expressed in the tumor adjacent normal kidney tissues,
yet not in the RCC tissues. TPM1 expression was even lost in many
highly developed RCC sections. Since ccRCC dominated the majority
of RCC cases, we selected one microscopic sample of ccRCC as
representative (Fig. 1D). IRS of
TPM1 in the RCC tissues was significantly different than that in
the adjacent normal renal tissues (p<0.001, Fig. 1D).
Relationship between the TPM1 mRNA level
and the clinical characteristics of the RCC cases
There was no significant difference between age,
gender, pathologic type, T and N stage, metastasis, recurrence and
alcoholic consumption and TPM1 expression levels among all the
patients involved in the RT-qPCR analyses (Table II). TPM1 mRNA expression was
significantly decreased in the various types of RCC cases; in other
words, there was no significant difference in decreased TPM1 levels
among the various RCC subgroups. However, tumor size was
significantly associated with the TPM1 mRNA level (p=0.012,
Table II). RCC patients with tumor
size >4.5 cm had a higher chance to have a downregulated TPM1
level. In addition to tumor size, the association between smoking
incidence and TPM1 was also observed (p=0.031, Table II). The markedly decreasing
(>2-fold) rate of TPM1 mRNA in the primary RCC cases was 59.1%
(26/44).
| Table IIRelationship between the TPM1 mRNA
level and the clinical characteristics of the RCC cases. |
Table II
Relationship between the TPM1 mRNA
level and the clinical characteristics of the RCC cases.
| | Degree of TPM1
downregulation | | |
|---|
| |
| | |
|---|
|
Characteristics | No of pts.
(n=44) | >2-fold (n=26) n
(%) | ≥2-fold (n=18) n
(%) | χ2 | P-value |
|---|
| Gender |
| Male | 25 | 14 (56) | 11 (44) | 0.229 | 0.632 |
| Female | 19 | 12 (63) | 7 (37) | | |
| Age (years) |
| <55.5 | 19 | 13 (68) | 6 (32) | 3.125 | 0.077 |
| ≥55.5 | 25 | 13 (52) | 12 (48) | | |
| Pathologic
type |
| ccRCC | 39 | 21 (54) | 18 (46) | 2.229 | 0.135c |
| nccRCC | 5 | 5 (100) | 0 (0) | | |
| Size (cm)a |
| ≤4.5 | 15 | 5 (33) | 10 (67) | 6.246 | 0.012 |
| >4.5 | 29 | 21 (72) | 8 (28) | | |
| T stage |
| T1–T2 | 35 | 21 (60) | 14 (40) | 0 | 1c |
| T3–T4 | 9 | 5 (56) | 4 (44) | | |
| N stage |
| N0 | 42 | 25 (60) | 17 (40) | | 1b |
| N+ | 2 | 1 (50) | 1 (50) | | |
| Metastasis |
| No | 41 | 25 (61) | 16(39) | 0.11 | 0.74c |
| Yes | 3 | 1 (33) | 2 (67) | | |
| Recurrence |
| No | 42 | 26 (62) | 16 (38) | | 0.162b |
| Yes | 2 | 0 (0) | 2 (100) | | |
| Alcohol |
| No | 21 | 14 (67) | 7 (33) | | 0.121b |
| Yes | 10 | 3 (30) | 7 (70) | | |
| No data | 13 | 9 (69) | 4 (31) | | |
| Smokinga |
| No | 18 | 13 (72) | 5 (28) | | 0.031b |
| Yes | 14 | 4 (29) | 10 (71) | | |
| No data | 12 | 9 (75) | 3 (25) | | |
TPM1 IHC staining and clinical
characteristics of the RCC cases
TPM1 IHC staining status in the 25 tissue sections
was systematically evaluated. We analyzed the statistical
significance of the IRS variances compared to age, gender, grade
and stage of the RCC cases. The results indicated that the average
IRS in the normal kidney tissues in male and female patients were
significantly different from each other (p=0.034, Table III), yet the difference in the IRS
for TPM1 in the RCC tumor tissues according to gender was not
significant. Notably, the IRS in the normal kidney tissues was
significantly decreased with increasing Fuhrman nuclear grade while
the IRS in the RCC tissues was significantly increased according to
increasing Fuhrman nuclear grade (p=0.019 and p=0.009, Table IV). However, a similar phenomenon
was not observed at different clinical stage or age for IRS.
| Table IIIImmunoreactive scores for TPM1
according to patient age and gender. |
Table III
Immunoreactive scores for TPM1
according to patient age and gender.
| Age (years) | Gender |
|---|
|
|
|
|---|
| Tissues | <55.5 | ≥55.5 | Male | Female |
|---|
| Normal | 9.54±2.73 | 9.30±3.02 |
10.73±1.89a |
8.35±3.02a |
| Tumor | 1.43±1.59 | 2.82±2.71 | 2.50±2.42 | 1.62±2.02 |
| ΔIRS | 8.11±3.05 | 7.05±4.20 | 8.77±2.97 | 6.73±3.79 |
| Table IVImmunoreactive scores for TPM1
according to different grade and stage. |
Table IV
Immunoreactive scores for TPM1
according to different grade and stage.
| Fuhrman nuclear
grade | TNM stage |
|---|
|
|
|
|---|
| Tissues | I | II | III | I | II | IIIc |
|---|
| Normal | 12.00±0a | 9.44±2.54a | 6.00±2.65a | 9.33±0.64 | 9.25±0.75 | 12.00±0 |
| Tumor | 1.13±0.25 | 2.14±2.15 | 2.67±4.19 | 1.83±0.41 | 3.83±2.40 | 1.00±0 |
| ΔIRS | 10.86±0.25b | 7.68±3.37b | 3.33±1.76b | 7.50±0.80 | 7.75±1.75 | 11.00±0 |
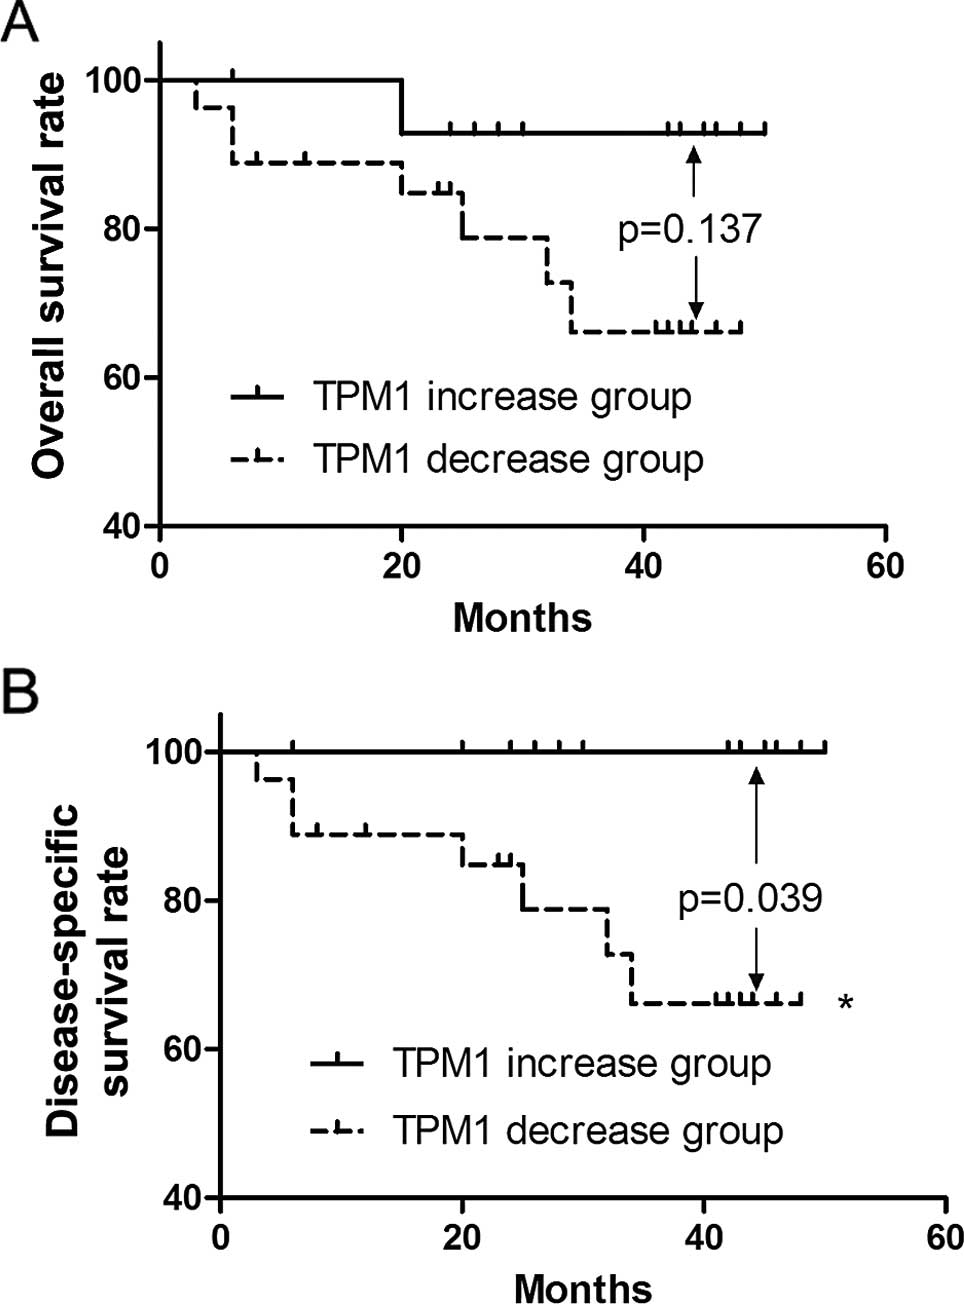
Overall survival and disease-free
survival of the RCC patients in regards to TPM1 expression
We followed up 42 of these patients for >4 years
after surgical intervention in the present study. One patient from
the TPM1 increase group passed away from an unrelated cause
(myocardial infarction) 629 days after surgery. Thus, this case was
treated as a censored observation in the disease-specific survival
rate analysis while as a death observation in the overall survival
rate analysis. During the follow-up, 7 patients (7/27, 25.9%)
passed away in the TPM1 decrease group while one unrelated death
(1/15, 6.7%) occurred in the TPM1 increase group. No significant
difference was observed in regards to the overall survival rate
(p=0.137, Fig. 2A), yet a
significant difference in the disease-specific survival rate was
noted between the TPM1 decrease group and TPM1 increase group
(p=0.039, Fig. 2B).
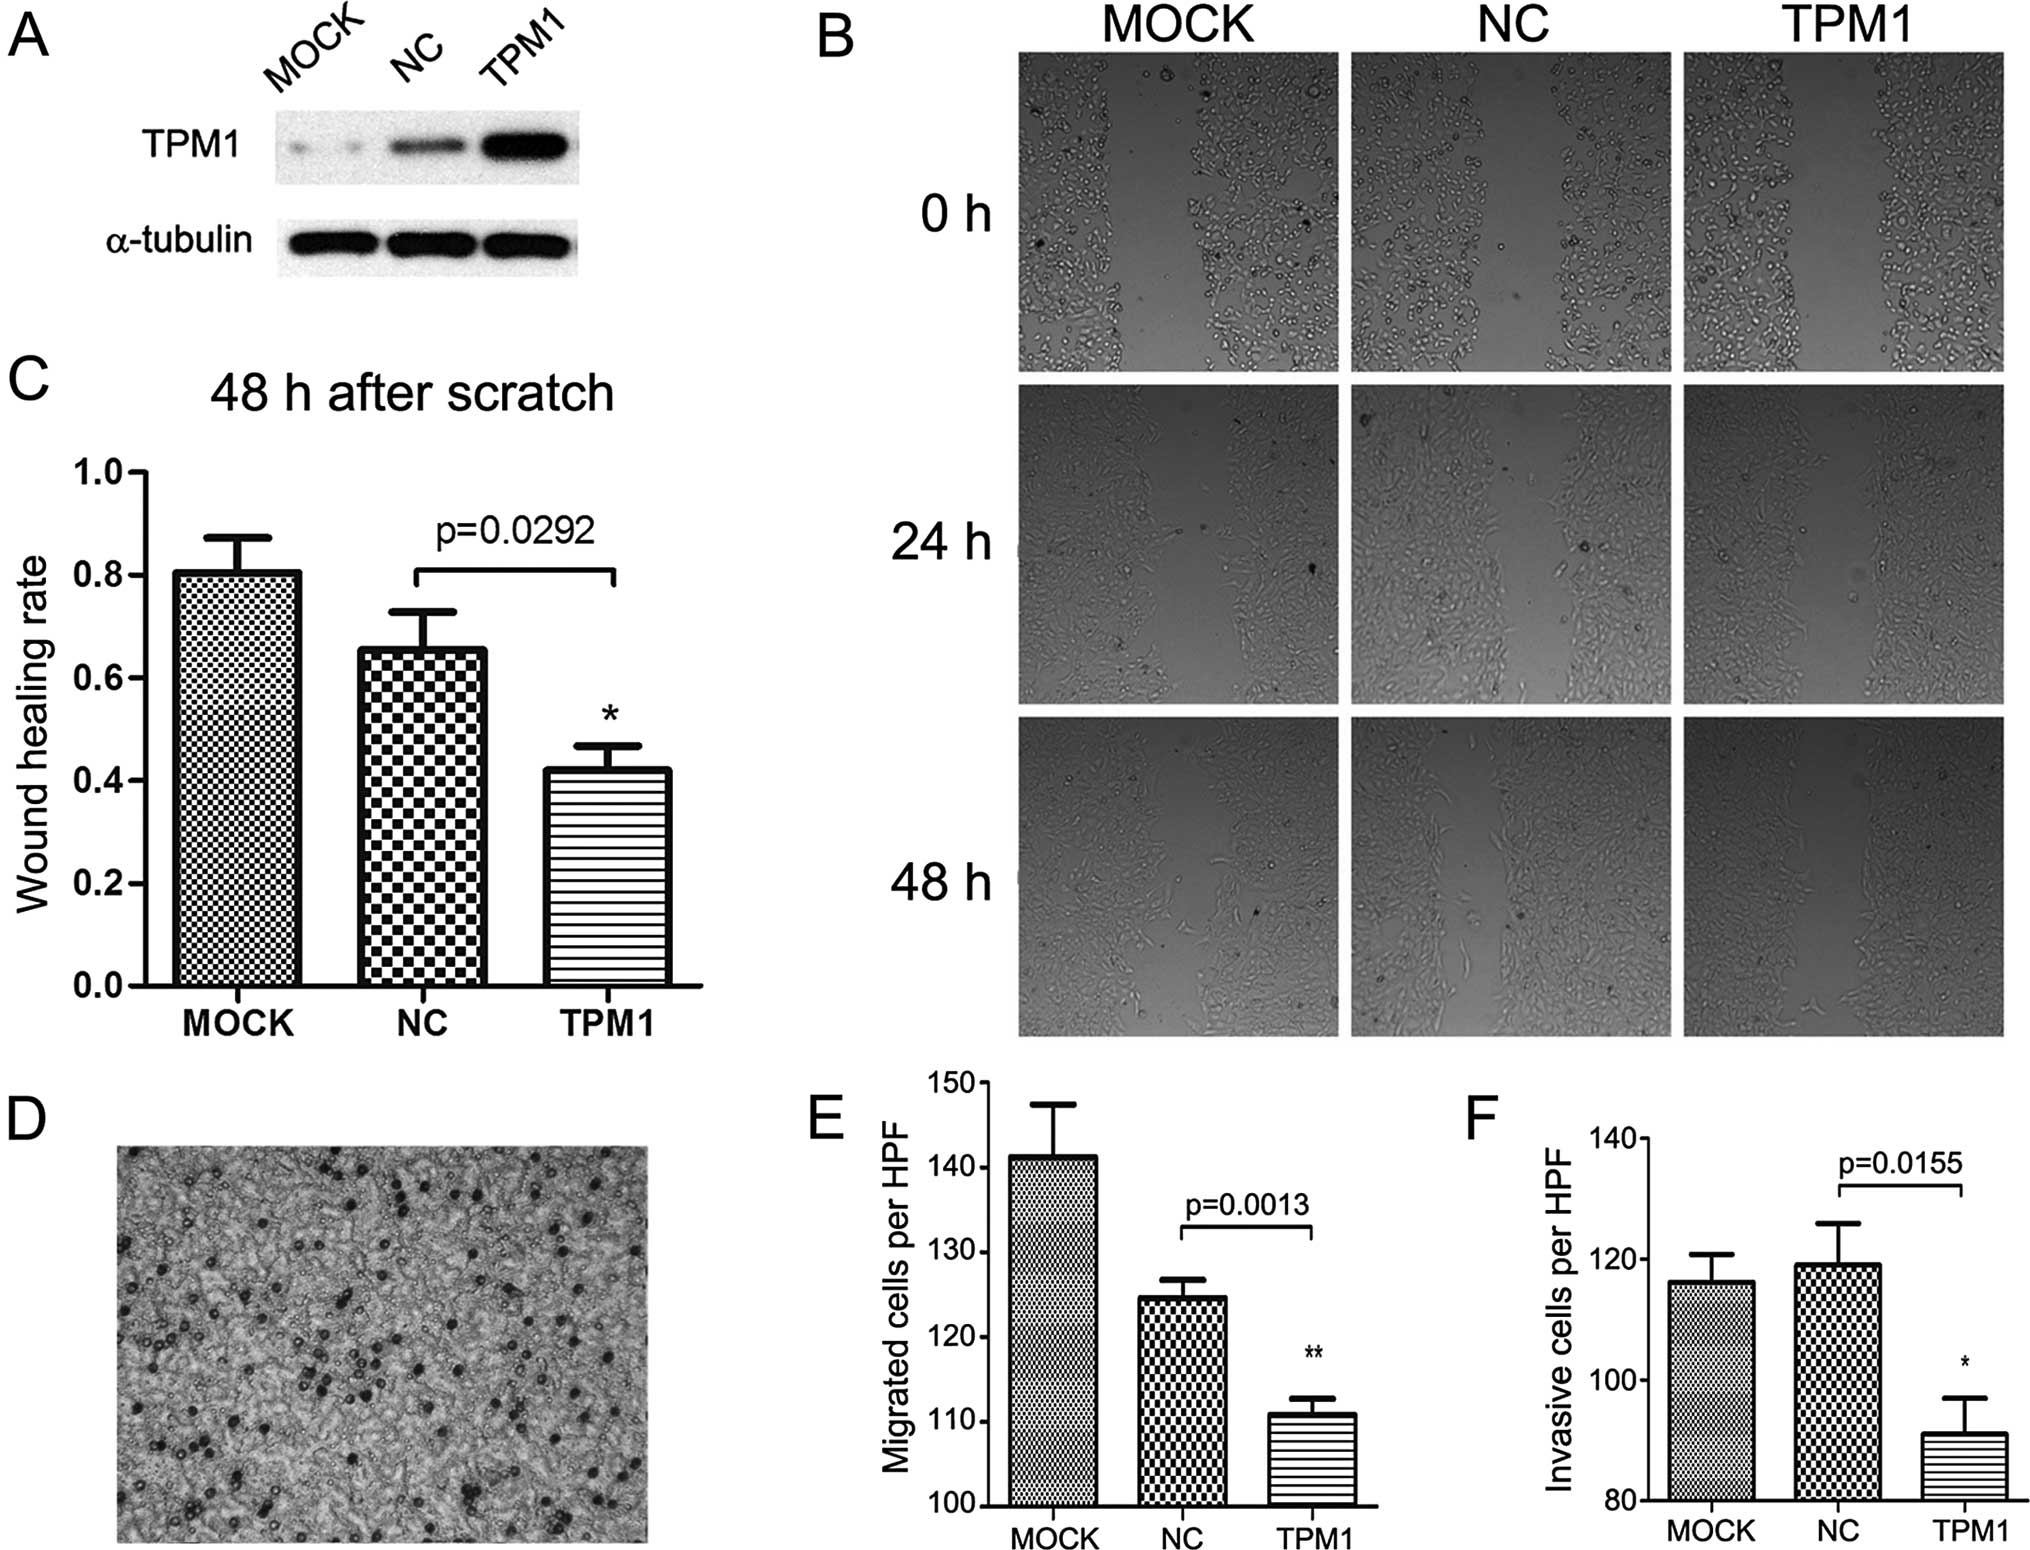
Scratch and Transwell migration
assays
TPM1 also played a role in RCC cell motility. In the
scratch assay, the TPM1-transfected OSRC-2 and 786-O cells
exhibited significantly slower wound healing compared with the
empty plasmid transfected and the mock treatment group. In regards
to the OSRC-2 cells, the wound healing status between the
experimental and the negative control group showed a significant
difference after 48 h (p=0.0292, Fig.
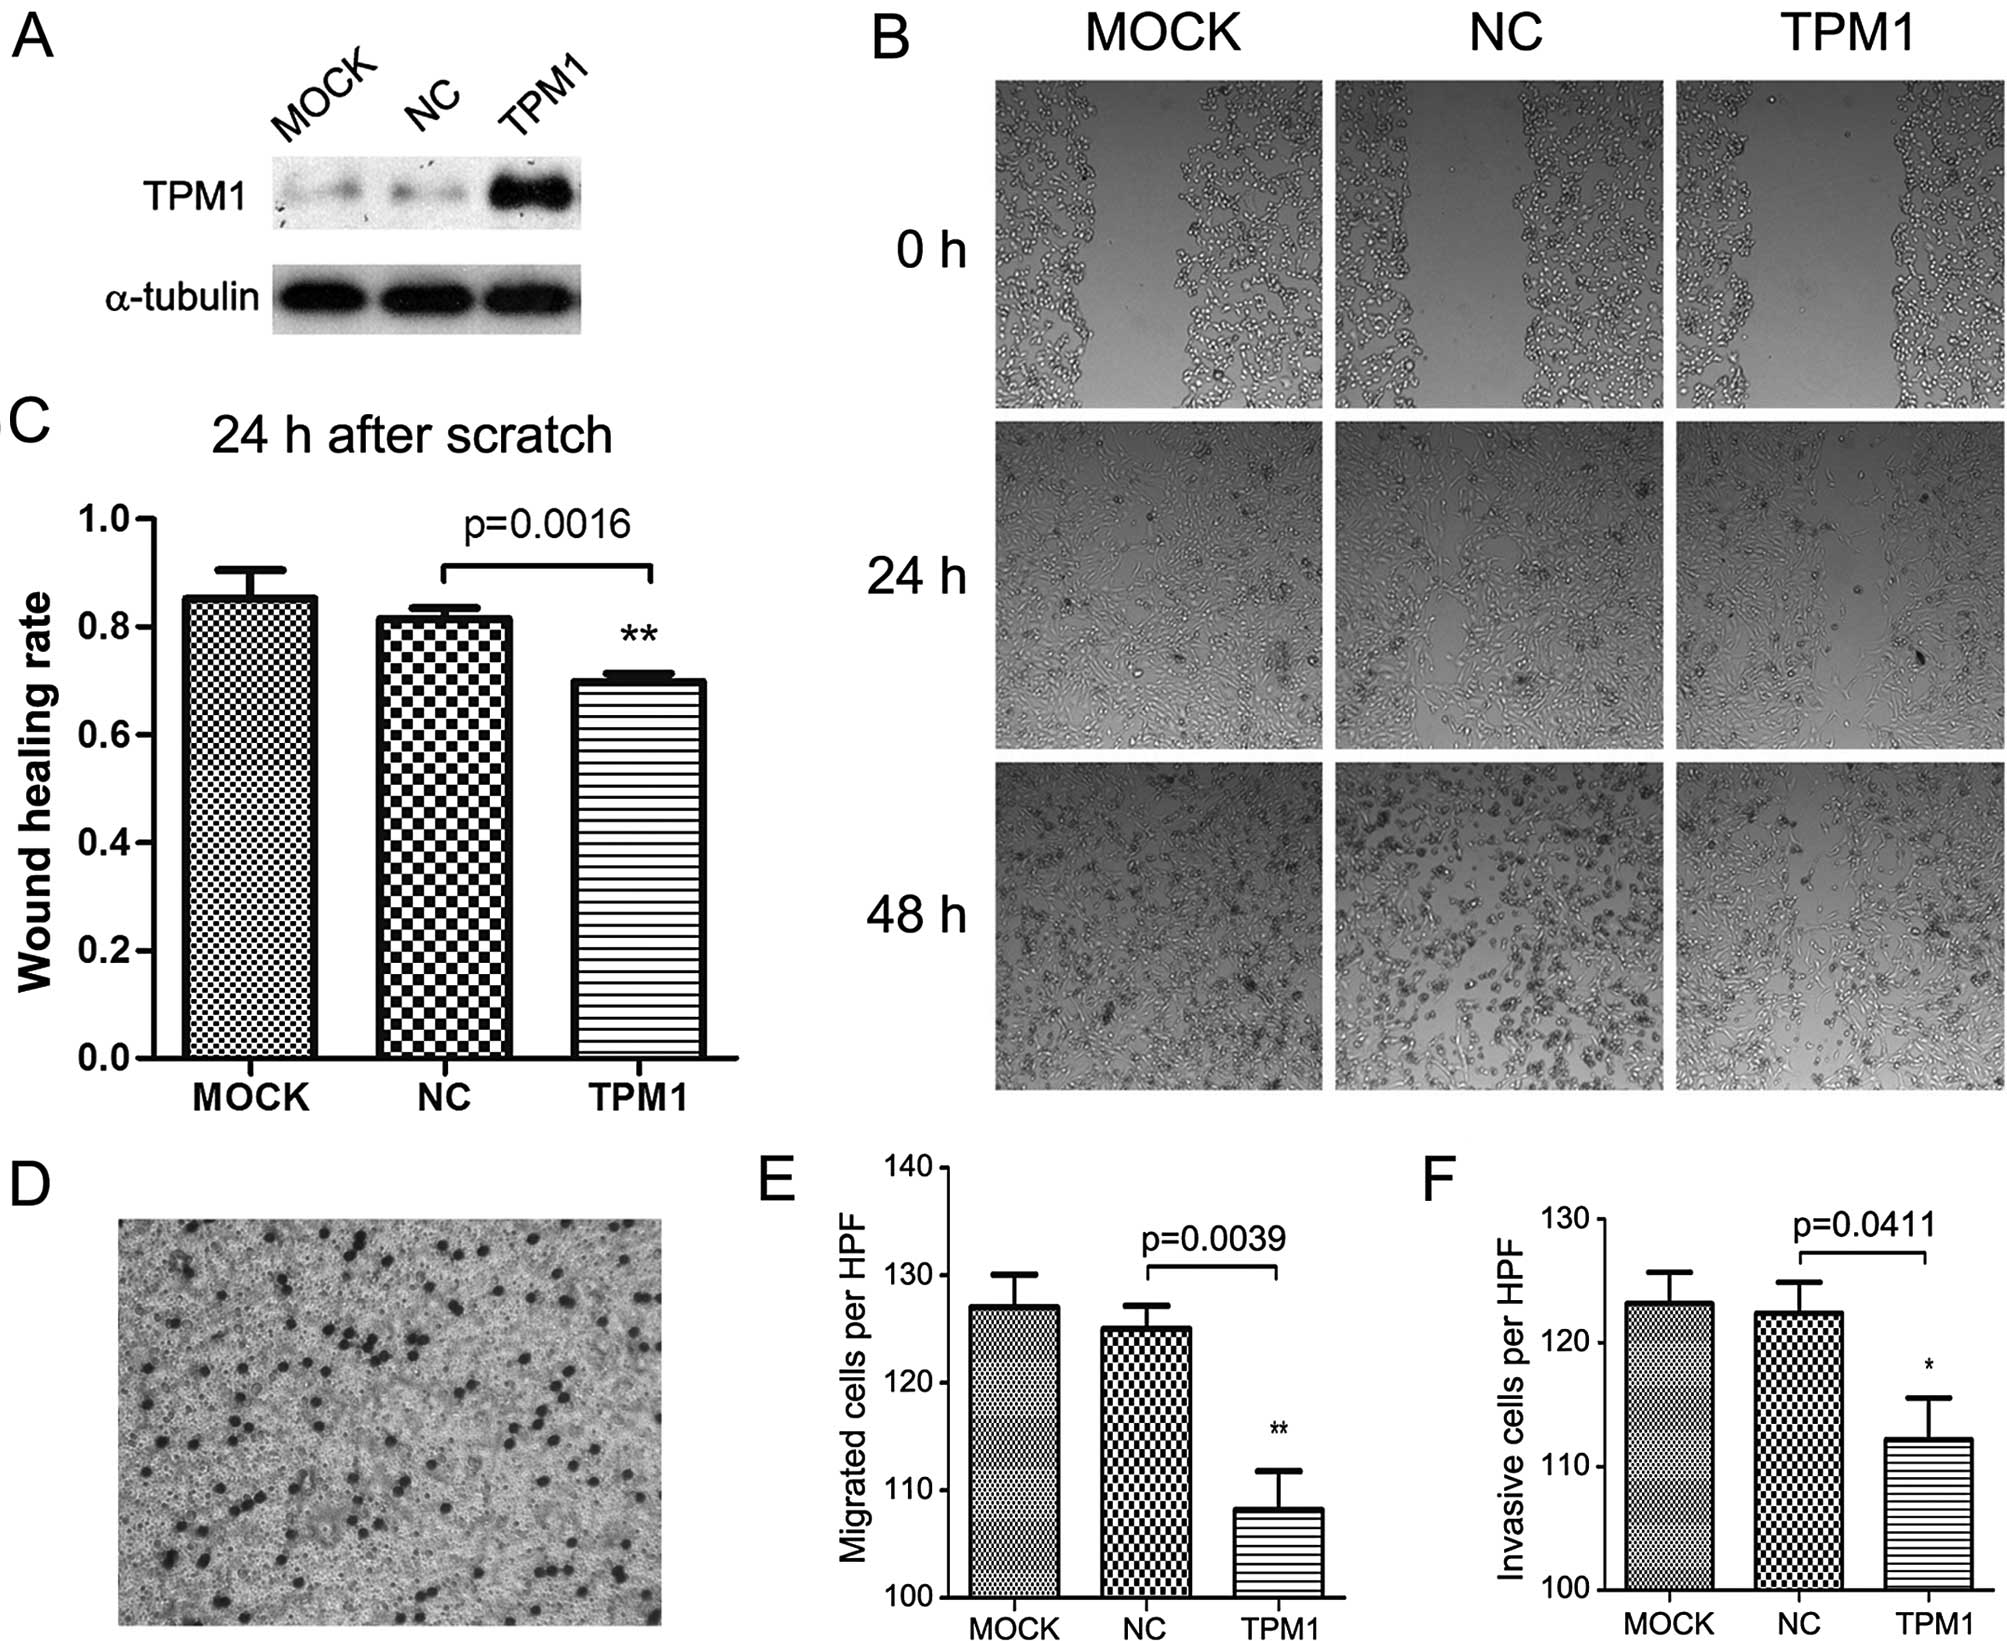
3B and C). The same observation was made in the 786-O cells
until 24 h after scratching (p=0.0016, Fig. 4B and C); a near complete wound
closure was observed after 48 h. This was probably due to the
weaker migratory ability of the OSRC-2 compared to the 786-O
cells.
Correspondingly, the Transwell migration assay
demonstrated that overexpression of TPM1 was associated with
markedly inhibited migration in both the OSRC-2 and 786-O cells
(p=0.0013 and p=0.0039 separately, Figs. 3E and 4E). Cell migration was detected by crystal
violet staining and microscopic graphs 24 h after seeding into the
Transwell inserts. In regards to the OSRC-2 cells, the number of
migrated cells/microscopic field (x200) for the pc3.1-NC and
pc3.1-TPM1 groups was 124.6±2.112 and 110.8±1.934, respectively. In
regards to the 786-O cells, the two values for each group were
125.0±2.168 and 108.2±3.597, respectively.
For the Transwell invasion assay, the cells needed
to invade the Matrigel matrix and then reach the filter bottom
which was stained and then images could be captured. Compared with
the negative control group, the invasive abilities of the OSRC-2
and 786-O cells in the TPM1-transfected group were significantly
reduced (p=0.0155 and p=0.0411 for each cell type, Figs. 3F and 4F). In regards to the OSRC-2 cells, the
numbers of invasive cells/microscopic field (x200) in the pc3.1-NC
and pc3.1-TPM1 groups were 119.0±6.928 and 91±5.958, respectively.
In regards to the 786-O cells, the two values for each of the pc3.1
groups were 122.4±2.502 and 112.2±3.367, respectively.
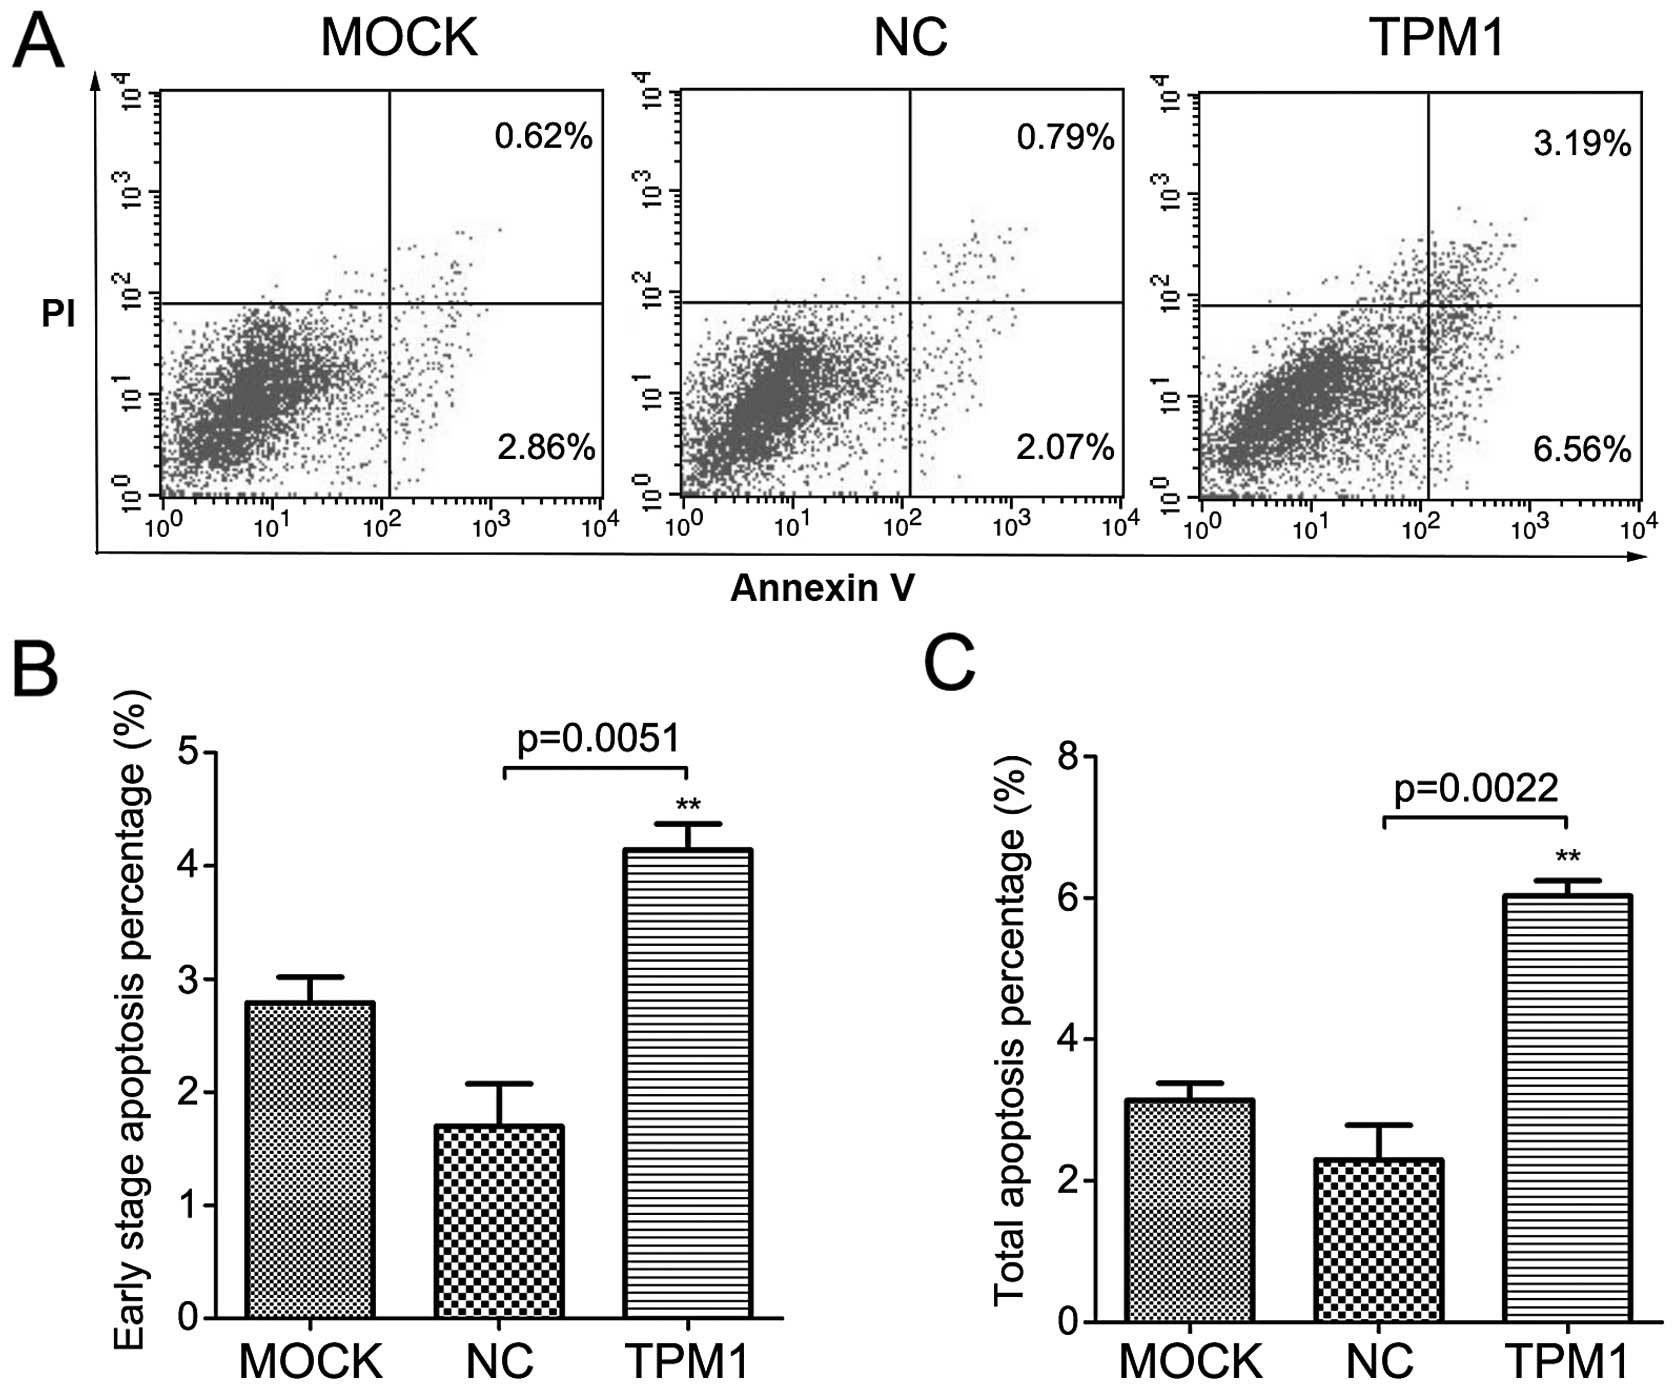
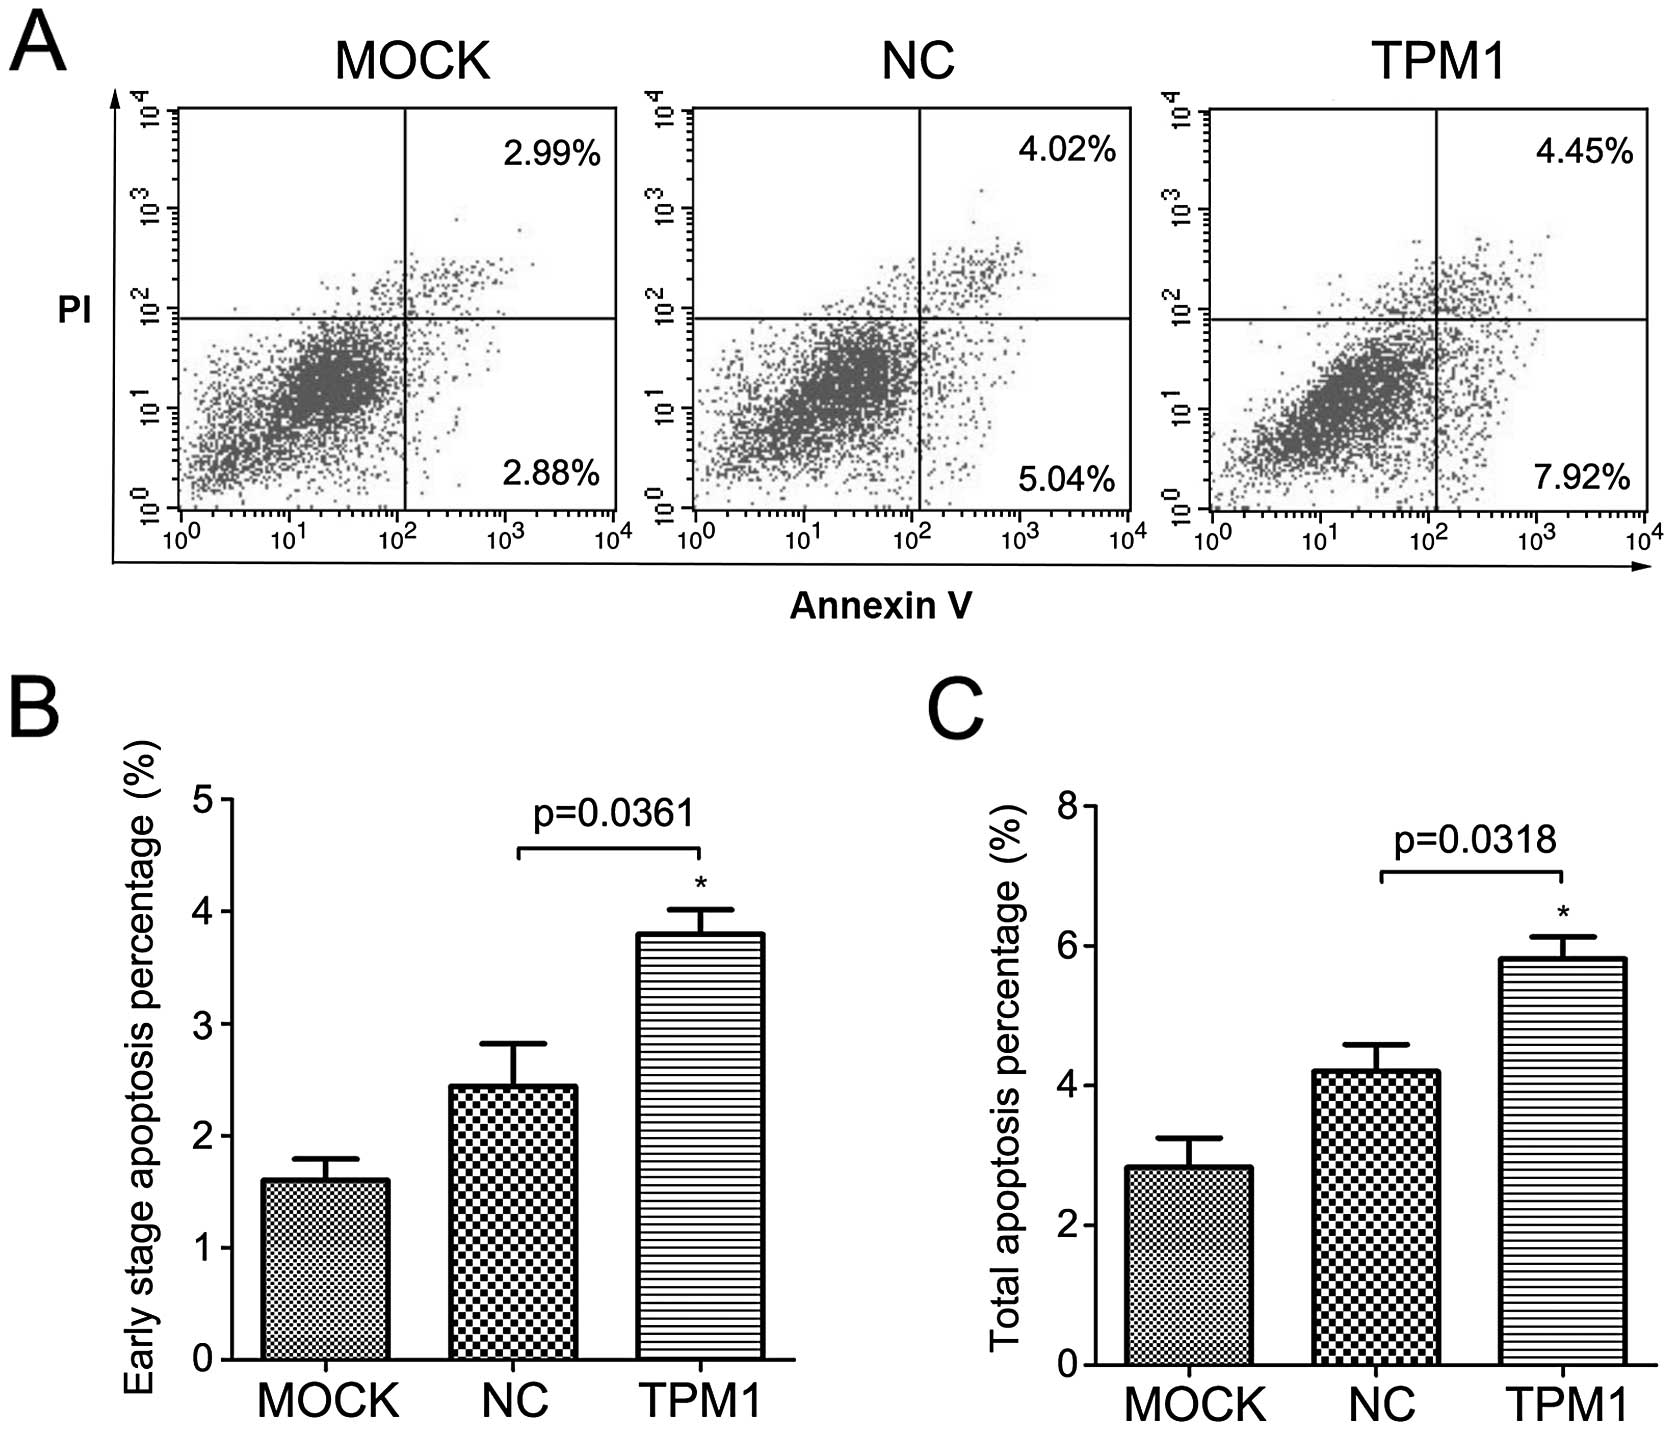
Analysis of apoptosis
We then detected apoptosis in the OSRC-2 and 786-O
cells following TPM1 transfection. For these two cell lines, we
used flow cytometry based on Annexin V and PI staining. The results
demonstrated that TPM1 transfection promoted cell apoptosis in
these two RCC cell lines (Figs. 5
and 6). At 72 h after transfection,
the early stage apoptosis rate (Annexin
V+/PI−) following TPM1 transfection was
4.1±0.2 and 3.8±0.2% for the OSRC-2 and 786-O cells, respectively.
This was significantly higher than the negative control: 1.7±0.4
and 2.4±0.4%, respectively (p=0.0051 and p=0.0361, Figs. 5B and 6B). In addition, the total apoptosis rate
(Annexin V+/PI±) following TPM1 transfection
was 6.0±0.2 and 5.8±0.3% for the OSRC-2 and 786-O cells,
respectively. This was also significantly higher than the empty
vector transfection: 2.3±0.5 and 4.2±0.4%, respectively (p=0.0022
and p=0.0318, Figs. 5C and 6C).
Discussion
Recently, it was reported that TPM1 acts as a
tumor-suppressor gene (TSG) and is downregulated in various types
of cancers (6,12–16).
However, the existence of other TPM family members varied among the
different types of cancers or studies (17–19).
In the present study, TPM1 was significantly downregulated in most
RCC tissues compared to that in the tumor adjacent normal renal
tissues while TPM2-4 showed no significant expression differences
in the RCC tissue samples. These results indicated that TPM1, among
all of the TPM family members, was specifically downregulated in
the various primary RCC patients. In addition, post-transcriptional
regulation mechanisms may be involved in the carcinogenesis of RCC
since some samples had inconsistent TPM1 expression between the
mRNA and protein level.
Importantly, decreased TPM1 expression occurred in
all types of RCC, such as ccRCC, chRCC or other RCC, and was also
associated with a larger tumor size, a lower Fuhrman nuclear grade,
and poorer prognosis after operation. This suggests that
downregulation of TPM1 may be an early event during RCC clinical
development excluding renal mass growth. We also speculated that
TPM1 plays an important role during the pathological progression of
RCC, for example, in the process of atypical nuclear progression.
Many studies have confirmed that Fuhrman grade is correlated with
RCC prognosis (20). Recent
research found that the Fuhrman grade also provides independent
prognostic information for papillary RCC patients (21). We found that TPM1 expression was
associated synchronously with both the Fuhrman grade and prognosis
in the participating RCC patients. Thus, we inferred that
downregulation of TPM1 in RCC may be an independent risk factor for
poor prognosis. However, this prediction may be more complicated
since IRS could only be semi-quantified. Due to the limited number
of patients involved in the present study, a statistically
significant association between TPM1 expression and risk of
metastasis could not be observed, which was supported by previous
studies. Further study with a large number of participants and an
improved study design should be conducted to further confirm our
prediction.
As a TSG, TPM1 has various roles in RCC tumor cells.
After TPM1 was restored in OSRC-2 and 786-O cells, the most
significant observation was that the migratory and invasive
capabilities of the RCC cells were reduced. This discovery
confirmed many previous studies by other researchers (6,22,23).
In addition, our observation confirmed the apoptotic function of
TPM1 in RCC cell lines (6,24).
Many other meaningful studies have demonstrated that
microRNA-21 suppresses TPM1, a target gene of microRNA-21, along
with other target genes, such as PDCD4 and MMP (7,8,23).
MicroRNA-21 has been the most frequently researched microRNA in
solid tumors and has been already shown to be upregulated in RCC
(25). Therefore, it is reasonable
to speculate that microRNA-21 plays a regulatory role in TPM1
expression during RCC promotion. In addition, researchers also
found that many epigenetic regulatory processes, such as promoter
methylation (6,18), and chromatin remodeling caused by
histone deacetylation (16), are
involved in the regulation of TPM1 in other types of cancers other
than RCC. Further research regarding these genetic modifications
specifically in RCC needs to be conducted.
Acknowledgements
This study was supported by the National Nature
Science Foundation of China (31100999 and 31071131). In the present
study, human kidney cancer tissues were stored by Dr Jing Jiang in
the Tissue Warehouse of the First Hospital, Jilin University.
Professor Shunzi Jin from the Public Health College of Jilin
University provided the laboratory to complete the cell
experiments. Professor Shibo Li from the Pediatrics Department of
the Health Science Center, University of Oklahoma, provided
assistance with language editing.
References
|
1
|
Jemal A, Bray F, Center MM, Ferlay J, Ward
E and Forman D: Global cancer statistics. CA Cancer J Clin.
61:69–90. 2011. View Article : Google Scholar : PubMed/NCBI
|
|
2
|
Mihaly Z, Sztupinszki Z, Surowiak P and
Gyorffy B: A comprehensive overview of targeted therapy in
metastatic renal cell carcinoma. Curr Cancer Drug Targets.
12:857–872. 2012. View Article : Google Scholar : PubMed/NCBI
|
|
3
|
Pittenger MF, Kazzaz JA and Helfman DM:
Functional properties of non-muscle tropomyosin isoforms. Curr Opin
Cell Biol. 6:96–104. 1994. View Article : Google Scholar : PubMed/NCBI
|
|
4
|
Brown JH, Kim KH, Jun G, et al:
Deciphering the design of the tropomyosin molecule. Proc Natl Acad
Sci USA. 98:8496–8501. 2001. View Article : Google Scholar : PubMed/NCBI
|
|
5
|
Perry SV: Vertebrate tropomyosin:
distribution, properties and function. J Muscle Res Cell Motil.
22:5–49. 2001. View Article : Google Scholar : PubMed/NCBI
|
|
6
|
Bharadwaj S and Prasad GL: Tropomyosin-1,
a novel suppressor of cellular transformation is downregulated by
promoter methylation in cancer cells. Cancer Lett. 183:205–213.
2002. View Article : Google Scholar : PubMed/NCBI
|
|
7
|
Mlakar V, Berginc G, Volavsek M, Stor Z,
Rems M and Glavac D: Presence of activating KRAS mutations
correlates significantly with expression of tumour suppressor genes
DCN and TPM1 in colorectal cancer. BMC Cancer. 9:2822009.
View Article : Google Scholar : PubMed/NCBI
|
|
8
|
Zhu S, Si ML, Wu H and Mo YY: MicroRNA-21
targets the tumor suppressor gene tropomyosin 1 (TPM1). J Biol
Chem. 282:14328–14336. 2007. View Article : Google Scholar : PubMed/NCBI
|
|
9
|
Wang Y, Zhang R, Wu D, et al: Epigenetic
change in kidney tumor: downregulation of histone acetyltransferase
MYST1 in human renal cell carcinoma. J Exp Clin Cancer Res.
32:82013. View Article : Google Scholar : PubMed/NCBI
|
|
10
|
Venerito M, Treiber G, Wex T, et al:
Effects of low-dose aspirin on gastric erosions, cyclooxygenase
expression and mucosal prostaglandin-E2 do not depend on
Helicobacter pylori infection. Aliment Pharmacol Ther.
23:1225–1233. 2006. View Article : Google Scholar : PubMed/NCBI
|
|
11
|
Dong W, Zhang H, Li J, et al: Estrogen
induces metastatic potential of papillary thyroid cancer cells
through estrogen receptor α and β. Int J Endocrinol.
2013:9415682013. View Article : Google Scholar
|
|
12
|
Petrova DT, Asif AR, Armstrong VW, et al:
Expression of chloride intracellular channel protein 1 (CLIC1) and
tumor protein D52 (TPD52) as potential biomarkers for colorectal
cancer. Clin Biochem. 41:1224–1236. 2008. View Article : Google Scholar : PubMed/NCBI
|
|
13
|
Ku BM, Ryu HW, Lee YK, et al:
4′-Acetoamido-4-hydro-xychalcone, a chalcone derivative, inhibits
glioma growth and invasion through regulation of the tropomyosin 1
gene. Biochem Biophys Res Commun. 402:525–530. 2010. View Article : Google Scholar : PubMed/NCBI
|
|
14
|
Yager ML, Hughes JA, Lovicu FJ, Gunning
PW, Weinberger RP and O’Neill GM: Functional analysis of the
actin-binding protein, tropomyosin 1, in neuroblastoma. Br J
Cancer. 89:860–863. 2003. View Article : Google Scholar : PubMed/NCBI
|
|
15
|
Alaiya AA, Oppermann M, Langridge J, et
al: Identification of proteins in human prostate tumor material by
two-dimensional gel electrophoresis and mass spectrometry. Cell Mol
Life Sci. 58:307–311. 2001. View Article : Google Scholar : PubMed/NCBI
|
|
16
|
Yang W, Wang X, Zheng W, Li K, Liu H and
Sun Y: Genetic and epigenetic alterations are involved in the
regulation of TPM1 in cholangiocarcinoma. Int J Oncol. 42:690–698.
2013.
|
|
17
|
Tang HY, Beer LA, Tanyi JL, Zhang R, Liu Q
and Speicher DW: Protein isoform-specific validation defines
multiple chloride intracellular channel and tropomyosin isoforms as
serological biomarkers of ovarian cancer. J Proteomics. 89:165–178.
2013. View Article : Google Scholar : PubMed/NCBI
|
|
18
|
Zare M, Jazii FR, Soheili ZS and
Moghanibashi MM: Down-regulation of tropomyosin-1 in squamous cell
carcinoma of esophagus, the role of Ras signaling and methylation.
Mol Carcinog. 51:796–806. 2012. View
Article : Google Scholar : PubMed/NCBI
|
|
19
|
Pawlak G, McGarvey TW, Nguyen TB, et al:
Alterations in tropomyosin isoform expression in human transitional
cell carcinoma of the urinary bladder. Int J Cancer. 110:368–373.
2004. View Article : Google Scholar : PubMed/NCBI
|
|
20
|
Ficarra V, Martignoni G, Maffei N, et al:
Original and reviewed nuclear grading according to the Fuhrman
system: a multivariate analysis of 388 patients with conventional
renal cell carcinoma. Cancer. 103:68–75. 2005. View Article : Google Scholar
|
|
21
|
Klatte T, Anterasian C, Said JW, et al:
Fuhrman grade provides higher prognostic accuracy than nucleolar
grade for papillary renal cell carcinoma. J Urol. 183:2143–2147.
2010. View Article : Google Scholar : PubMed/NCBI
|
|
22
|
Lees JG, Bach CT and O’Neill GM: Interior
decoration: tropomyosin in actin dynamics and cell migration. Cell
Adh Migr. 5:181–186. 2011. View Article : Google Scholar :
|
|
23
|
Zhu S, Wu H, Wu F, Nie D, Sheng S and Mo
YY: MicroRNA-21 targets tumor suppressor genes in invasion and
metastasis. Cell Res. 18:350–359. 2008. View Article : Google Scholar : PubMed/NCBI
|
|
24
|
Bharadwaj S, Thanawala R, Bon G, Falcioni
R and Prasad GL: Resensitization of breast cancer cells to anoikis
by tropomyosin-1: role of Rho kinase-dependent cytoskeleton and
adhesion. Oncogene. 24:8291–8303. 2005. View Article : Google Scholar : PubMed/NCBI
|
|
25
|
Faragalla H, Youssef YM, Scorilas A, et
al: The clinical utility of miR-21 as a diagnostic and prognostic
marker for renal cell carcinoma. J Mol Diagn. 14:385–392. 2012.
View Article : Google Scholar : PubMed/NCBI
|